Abstract
Molasses is a highly thick by-product produced after sugarcane crystallization constitutes large amounts of biodegradable organics. These organic compounds can be converted to renewable products through anaerobic digestion. Nevertheless, its anaerobic digestion is limited due to its high chemical oxygen demand (COD) and ion concentration. The effects of nickel (Ni2+) on the stability of anaerobic digestion of molasses were established by studying the degradation of organic matter (COD removal rate), biogas yield, methane content in the biogas, pH, and alkalinity. The results showed that there were no significant effects on the stability of pH and alkalinity. Increased COD removal rate and higher methane content was observed by 2–3% in the digesters receiving 2 and 4 mg/L of Ni2+ in the first phase of the experiment. Ni2+ supplemented to reactors at concentration 2 mg/L enhanced biogas yield. Overall, it is suggested that the addition of Ni2+ has some effects on the enhancement of biogas yield and methane contents but has no obvious effects on the long-lasting stability of the molasses digestion.
1. Introduction
Anaerobic digestion (AD) is considered one of the most promising biotechnological practices for treating organic waste. However, the process has a significant advantage of waste disposal and allows biogas production as a by-product during organic waste treatment [1]. Its benefits have involved much of the researcher’s attention to improve the digestion efficiency with minimum difficulties in the process [2]. Different susceptible microbial communities such as hydrolytic, acidogenic, acetogenic, and methanogenic communities are involved in anaerobic digestion. They carry out the digestion process that makes the process sensitive to environmental factors [3].
Trace elements (TEs) are considered one of the most critical factors as a micronutrient required by microorganisms in the digestion system. There should be adequate concentration of trace elements in the digestion system for stable microbial metabolism. In addition to macronutrients such as carbon (C), nitrogen (N), phosphorus (P), and sulfur (S), microorganisms in the anaerobic system need TEs in comparatively small concentrations [4].
Nickel (Ni) has an essential role in methanogenesis and is required to synthesize the co-factor porphyrinoid F430 of methyl co-enzyme M reductase, enhancing acetate utilization for methane production [5]. Nickel has been connected with other enzymes named NiFe hydrogenases, carbon monoxide dehydrogenase/acetyl-CoA synthase, hydrogenases, and F420-reducing hydrogenases. These enzymes play a critical role in aceticlastic methanogenesis, hydrogenotrophic methanogenesis, and acetogenesis, respectively [6]. Hence, due to the lack of adequate trace elements concentration, changes in microbial communities and their function led to process upset [7,8]. For instance, the predominance of genus Methanosarcina has been reported with Ni supplementation to anaerobic digester [9,10]. The dominancy of Methanosarcina sp. in the anaerobic digestion system is advantageous, because these species are the multipurpose and important methanogens in the digestion system that can survive under different stressful conditions, such as a high level of ammonium and sodium in digesters compared to other methanogens. On the other hand, anaerobic digestion comprises complex organic and inorganic compounds that restrict trace elements’ bioavailability. For example, substrates rich in sulfur can make precipitations with TEs and decrease their bioavailability [11,12]. However, some studies have reported that increased addition of Fe may be required to make precipitations with sulfur, leaving other TEs to be used by methanogens [13]. Generally, only a small amount of TEs are bioavailable to microbial communities, especially to methanogens, than the total quantity present in the system. TE bioavailability problems are more common in the mono-digestion process than in co-digestion [14,15].
Many studies have reported the role of TEs such as iron, nickel, cobalt, molybdenum, zinc, and tungsten at different concentrations in the digestion process. These TEs at different concentrations have effectively enhanced the digestion process, treating various industrial wastes [1,12,15,16,17]. In addition, a high concentration of some metals may negatively affect the digestion process and inhibit microbial activities [18,19]. Trace elements play a vital role in the development of ion channels for transportation. These are also required to synthesize some important co-enzymes, including acetyl-CoA synthase, methyltransferase, hydrogenase, CO-dehydrogenase, methyltransferase, formyl-MF-dehydrogenase, formate dehydrogenase, corrinoids, and B12 enzymes, methyl-CoM-reductase, and co-factor F430, which regulate methanogenesis [1]. The lack of trace elements in the anaerobic system inhibits co-enzymes production, leading to slowing down the process performance. Recent studies have shown that trace elements can be an effective way to enhance the digestion process [16,20]. Moreover, inhibition in the anaerobic digestion process due to propionic acid could be recovered by adding trace elements [1].
Molasses-based environmental problems could be significantly reduced by anaerobic technology, considered a source of high-value by-products such as biomethane, hydrogen, and organic acids obtained through anaerobic digestion [21,22]. Moreover, anaerobic digestion of molasses is difficult due to high COD, melanoidin contents, and high ion concentrations. For example, high potassium ions in molasses has shown adverse effects on microbial communities and leads to carboxylate accumulation during anaerobic digestion [22]. Oleszkiewicz and Sharma (1990) reported that methanogen activity in anaerobic digestion could be increased or decreased by the concentration of nickel and other trace elements [14]. Together, trace elements can induce four different digestion processes, i.e., higher methane content in biogas, higher methanogenic activities, increased biomass growth, and higher COD removal rate. These aspects are vital for anaerobic digestion, but their combined and synergistic effect is unknown.
A deficiency of TEs normally ends up in alterations of microbial community composition and performance, suboptimal AD operation, and eventually complete method failure. Consequently, supplementation of TEs is required in several cases to keep up the activity of the microbial community in AD systems. Deficiencies of TEs might occur either because of deficient TE content within the substrate or a high concentration of compounds that bind the TEs, decreasing their bioavailability [23]. The digestion of substrates normally lacking specific TEs in the organic fraction of municipal solid waste, or energy crops, will typically be improved by addition of Ni, Co, and Se. Sulphur-rich substrates, such as grain stillage, on the opposite hand, typically end in attenuated bioavailability of the present TEs. Nickel needs vary from 2.3 to 4.8 µg/g CODfed for the acidogenic pathways and from 0.9 to 5.4 µg/g CODfed for the acetogenic and methanogenic pathways [24].
Keeping in view the abovementioned importance of Nickel on the anaerobic digestion process. Therefore, the present study was designed for the first time to figure out the effects of different concentrations of nickel on molasses digestion in terms of COD removal rate, biogas yield, methane content in biogas, and the stability parameters such as alkalinity and pH. In addition, the effects of nickel on the digestion of molasses were carried out after stressed biomass from the co-digestion of molasses and rice alcohol wastewater (RAW).
2. Material and Methods
2.1. Inoculum Sludge and Molasses
The inoculum sludge was taken from the last experiment conducted on anaerobic co-digestion of molasses and rice alcohol wastewater [22]. Molasses was taken from the Guangxi Guitang (Group) Co., Ltd. (Guigang, China). In addition, rice alcohol wastewater (RAW) was obtained from a rice fermenting company. The characteristics of both molasses and RAW such as COD, BOD (biological oxygen demand), total nitrogen (TN), and pH are mentioned in Table 1. The concentration of nickel in molasses were detected through optical emission spectroscopy (ICP-OES) inductively coupled with plasma spectrometry (Table 1).

Table 1.
Molasses and rice alcohol wastewater properties [22].
2.2. Design for Evaluating the Effects of Nickel (Ni) on the Digestion of Molasses
This experiment was carried out to assess nickel (Ni effects) on the anaerobic digestion of molasses. The experiment was carried out in small anaerobic reactors. The total volume of each reactor was 250 mL and the working volume 200 mL. This experiment’s anaerobic sludge was taken from the previous experiment stressed due to the high loading rate. The experiment began with the initial loading rate of 6.8 g COD/L·d to evaluate digestion efficiency. Stock solutions were prepared using NiCl2·6H2O in ppm, and specific concentrations were added on day 10 to R1, R2, R3, and R4 as 2, 4, 8, and 16 mg/L, respectively. Nickel was added with the daily feed to reach the specified concentration and avoid washout with water’s daily exchange. Onward to day 15, due to a decrease in process efficiency, the organic loading rate (OLR) was lowered to 5 g COD/L·d and continued the same loading until the thirtieth day, while from day 31 the OLR was increased 5.6 g COD/L·d (Table 2). However, on the fortieth day of the experiment the decreased process efficiency led the process to stop which was followed by phase of the experiment. Phase II of this experiment started after a break of 7 days with relatively high OLR (6.8 g COD/L·d). In this phase, RAW was co-digested with molasses for the smooth startup of the process, and the ratio of molasses to RAW was 4:1, shown in Table 2. However, phase II was carried out for 30 days to acclimatize the digestion process, while from day 70 to 100, RAW was eliminated and only molasses was fed to digesters to evaluate Ni’s effects on molasses’ digestion.
Table 2.
Design for the operating conditions of the second experiment.
Each set of experiments was performed in triplicate at a temperature of 35 ± 2 °C. The pH was measured daily with the exchange of wastewater, while the COD removal rate and percent methane content were examined at the interval of 5 days. Alkalinity was measured by the titration method.
2.3. Analytical Methods
The pH of the effluent and influent was detected daily by using a standard pH meter. Effluent COD was measured using HACH (DRB 200 (COD 200-15000)). The concentration of CaCO3 of each reactor was measured by the titration method. Biogas was collected in biogas bags, and their composition was analyzed by gas chromatography, Shimadzu GC-14C (Shimadzu Co., Ltd., Kyoto, Japan). A capillary column, Porapak Q (80–100 mesh; 0.3 mm × 2 m) equipped with a flame ionization detection (FID) detector was used. Working temperatures were set as 100, 60, and 100 °C for the inlet, column, and detector, correspondingly. The hydrogen gas and oxygen gas pressures were settled as 40 and 30 Kpa, respectively. At the same time, the nitrogen as a carrier gas pressure was set as 65 Kpa. A 3-µL gas sample was injected manually, and methane in biogas was calculated using the standard sample’s peak area (99.9% methane).
3. Results and Discussion
3.1. Effects of Different Concentration of Nickel (Ni) on COD Removal Rate
The sludge used in this experiment was taken from the previous experiment of co-digestion of molasses and rice alcohol wastewater. The experiment was started initially at organic loading rate 6.8 g COD/L of molasses. After 5 days of the experiment, the average COD removal rate of control, R1, R2, R3, and R4 was recorded as 85.575%, 86.33%, 85.84%, 85.01%, and 84.8%, respectively (Figure 1). While feeding the reactors with the same OLR, a decrease in COD removal rate at day 15 was observed and recorded as 78.77%, 83.59%, 80.80%, 78.17%, and 74.52% in control, R1, R2, R3, and R4, correspondingly. Due to this reason, feeding to the reactors was stopped for 3 days. After this break, the organic loading rate was lowered to 5 g of COD L−1·d−1. An increase in percentage of the COD removal rate was observed on day 20 in control, R1, R2, R3, and R4 and recorded as 82.75, 85.84, 84.15, 82.29, and 81.19, respectively. However, on day 31 of the experiment, the organic loading rate was increased to 5.6 g COD L−1·d−1, and different concentrations of nickel solutions 2, 4, 8, and 16 mg/L were added to R1, R2, R3, R4, respectively, leaving the control. The COD removal rate at day 35 after the addition of nickel that was observed ranged 81.08%, 84.60%, 83.41%, 82.42%, and 82.33% in control, R1, R2, R3, and R4. Again, a decrease in the COD removal rate was observed on the fortieth day due to decreased pH. This increase and decrease in COD removal rate might have been due to sludge inactivation from the last experiment. Another reason could be the mono-digestion of molasses that could suppress the microbial community. On the other hand, no such effects of Ni have been detected on the digestion process’s stability. Colussi et al. (2009) reported variation in COD removal rate between 95% to 76% upon the addition of nickel [25]. Nickel was also reported to promote acidogenesis immediately rather than methanogenesis, and hence encourage the production of VFAs. On the other hand, bio-granules in the methanogenic phase were highly sensitive to metals rather than the acidogenic phase [26].
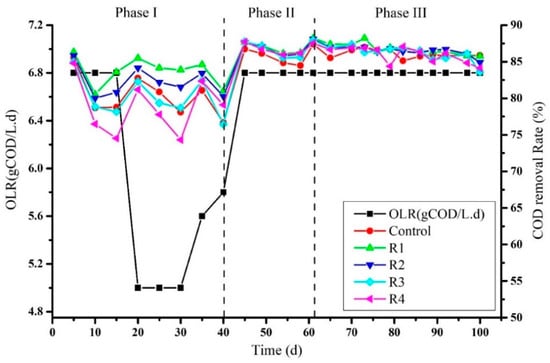
Figure 1.
Percent of COD removal rate after supplementation of Ni2+ at different concentrations.
After seeing the decreasing trend in the COD removal rate and pH, the process was stopped for 7 days to allow methanogens to degrade organic acids accumulated in reactors. Hence, phase II of the experiment was started as a co-digestion of molasses and rice alcohol wastewater with a feeding OLR 6.8 g COD L−1·d−1. The main purpose of adding rice alcohol wastewater with molasses was to stabilize the process. In addition, Khan et al. (2020) confirmed that the RAW could be a good co-substrate for stable anaerobic digestion of molasses [22]. As a result, the COD removal rate at day 45 increased in control was (86.74 ± 0.41%), R1 (87.65%), R2 (87.65%), R3 (87.77%), and R4 (87.71%) (Figure 1). The increased COD removal rate suggested that the digestion process has started stably. A decrease in the COD removal rate by 1–2% was observed in all treatments in two consecutive detections at days 49 and 54. The maximum COD removal rate detected at day 61 ranged from 87.40% to 88.21% among all treatments. However, until the seventieth day of the process, when molasses and RAW were co-digested, the COD removal rate observed was 86.61%, 87.35%, 86.96%, 87.32%, and 86.94% in the control, R1, R2, R3, and R4, respectively. On the seventy-first day of the process, rice alcohol wastewater was removed, and molasses started to feed alone along with Ni’s specified concentrations to each treatment. The COD removal rate was found very close on the seventy-sixth day of the process among all digesters (86.37% to 86.6%). Surprisingly, a decrease in the COD removal rate was observed until the last day of the experiment instead of increasing the process efficiency (Figure 1), although each reactor was supplemented with nickel with daily feeds to maintain the specified amount. The lowest COD removal rate was observed on day 100 with no significant differences between control and other treatments, shown as the control (85.87%), R1 (85.77%), R2 (84.91%), R3 (83.58%) and R4 (84.14%). Many studies have reported trace metals’ effects to examine the overall performance of the anaerobic digestion process rather than specific phases like acidogenesis and methanogenesis [27,28]. Bagby et al. (1981) reported a decrease in COD removal efficiency up to 3% upon the combined addition of nickel + cadmium to the reactors at different concentrations of 5.25 mg/L Cd2+ and 1.15 mg/L for Ni2+. In addition, a noticeably lowered COD removal rate was observed at the concentration of 10.17 mg Cd2+/L and Ni2+ 5.35 mg/L [29]. Our results can also be correlated with the observations of Takashima et al. (2011), who did not see any effect of soluble metals on COD removal rate [30]. The relationship between the COD removal rate and the metal concentration supplemented in the influent could be described by the metal enzyme complex theory hypothesized by Adams et al. (1973) [31]. It has been concluded that the toxicity or the neutral effects of metals on the microbial communities could be attributed to respiratory enzymes and metals’ interaction to form metal enzyme complex [31]. The other reason could be the high concentration of sulfides during the digestion process that causes nickel’s precipitation and reduces the bioavailability of Nickel [32]. The severity of metal inhibition depends on factors like the soluble and ionic fraction of metals in the solution, the type of metal, and the quantity and dissemination of biomass in the reactors [33].
3.2. Effects of Different Concentration of Ni on the Biogas Quality
Parallel to COD removal rate, methane contents were detected on a routine basis: Methane contents after 5 days of the experiment detected were 60.12%, 61.77%, 63.13%, 60.64%, and 59.60% in the control, R1, R2, R3, and R4, respectively (Figure 2). A decrease in methane contents was observed on the fifteenth day of the experiment, although Ni supplementation had been started at their specified concentrations such as 2, 4, 8, and 16 mg/L to R1, R2, R3, and R4 respectively on day 10. Thus, feeding to the reactors was stopped for three days and then restarted with a low OLR 5 g COD L−1·d−1, and again the increase in methane contents observed on day 20 was 58.18%, 61.43%, 60.69%, 58.34%, and 56.44% in the control, R1, R2, R3, and R4. R1 and R2 generally produced higher methane contents than the control, R3, and R4. As previously investigated, the increase in methane contents was most likely due to Ni addition [32]. This is because nickel-added reactors enhance the production of methyl-coenzyme M reductase (MCR) and accelerate the methanogenic phase. Other gases like CO2 and H2 were consumed to produce more methane contents. In this study, the production of methane contents was not always concurrent and is strongly supported by previous studies [32]. Later on, due to sudden decreases in pH on day 40, feeding to the reactors was stopped to utilize the organic acids by methanogens. Furthermore, after a break of seven days when methanogens consumed hydrolytic products, the reaction was started again as a co-digestion process (molasses + RAW) and continued until day 70. The percentages of methane contents observed in phase II at day 45 in the control, R1, R2, R3, and R4 were relatively very close, i.e., 65.13%, 66.55%, 65.87%, 66.41%, and 66.34%, respectively. However, a slight increase in methane content was detected on day 65 in R1, R2, R3, and R4, rather than in control. Moreover, the highest methane content was observed on day 79 (Figure 2, phase III) in R3 (67.92%) followed by R2 (67.76%), R1 (67.59%), R4 (66.78%), and the control (66.08%). After day 79, a regular decrease in methane contents was seen in three consecutive detections, and the methane contents produced on the last day by the control, R1, R2, R3, and R4 on day 100 were 61.09%, 62.82%, 63.29%, 63.34%, and 62.67% respectively. This regular decrease in methane contents could be related to the decreased efficiency of the methanogens. Overall, during the second and third phases of the process, the methane content in the control was lower than the nickel-supplemented reactors. Nevertheless, no obvious difference was observed among different concentrations of nickel. A study conducted by Aresta et al. (2003) found the synergistic effect at the maximum concentration of 16.08 mg/L of nickel on the enhancement of methane content in the biogas [34]. In another study where cattle dung was used as a substrate, Ni supplemented batch reactors’ enhanced biogas and methane contents in the biogas [35]. During the digestion of poultry excreta, the addition of NiCl2 did enhance biogas production but did not affect methane content [36]. Moreover, Ni’s supplementation did not improve the methane content while digesting mango wastes in a pilot-scale anaerobic digester [37].
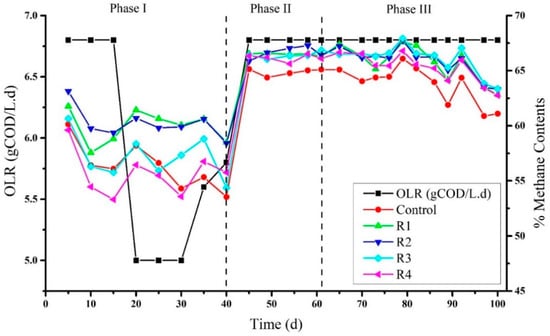
Figure 2.
Methane contents produced in biogas under the addition of different concentrations of Ni2+.
3.3. Process Stability
Alkalinity and pH Affected by Different Concentration of Nickel (Ni)
Alkalinity was measured periodically at the interval of 5 days (Figure 3). The results showed that on day 5 (phase I), the alkalinity detected in mg/L was 3018.43, 2889.94, 2803.79, 2916.02, and 2807.01 in the control, R1, R2, R3, and R4, respectively, which was then followed by a slight increase and ranged from 3182.30 to 3278.92 mg/L on day 10. A continuous decrease in the alkalinity was observed after day 15, even after Ni’s addition except in the control. The process was continued to day 40 and the lowest alkalinity observed at day 40 was 1923.45, 1972.23, 1956.32, 1923.45, and 1943.081 mg/L in the control, R1, R2, R3, and R4, respectively. This decreasing trend in alkalinity could be due to the suppression of methanogens in the sludge that cannot consume the reactors’ accumulated volatile fatty acids (VFAs). This could also be due to molasses’ mono-digestion, which can suppress methanogenic activity [22]. Li et al. (2014) suggested that alkalinity could be an adequate early warning for a stable digestion process [38]. In phase (II), after a 7-day break, the experiment started smoothly in-phase (II), and on day 45, the alkalinity detected ranged between 2940.52 and 3192.77 mg/L. This was increased abruptly on day 54, ranging 4456.53 to 4833.99 mg/L due to a break of feeding for one day. An increase in alkalinity was observed on the sixty-first day and recorded as 3601.5, 3701.43, 3620.05, 3622.23, and 3651.54 mg/L in the control, R1, R2, R3, and R4, respectively. This high alkalinity in phase II could be due to the co-substrate with molasses that increases the process’s buffering capacity. Bardi and Aminirad (2020) found that while co-digesting, food wastes (FW) and sewage sludge could lead to free ammonia, which increases alkalinity [39]. Furthermore, on day 70, after process stabilization, RAW was removed, and only molasses continued to feed the reactors as a single substrate. Again, a decreasing trend in alkalinity was observed until the last day of the experiment in all reactors and the control despite Ni’s supplementation at various concentrations (Figure 3). A decrease in alkalinity was detected in the study of Li et al. (2019) with the increase in OLR to 4.0 g VS/L·d that lead to an increase in VFA along with the reduction in pH [40]. After supplementation of TEs, the total alkalinity was not turned over to its stabilized state, and at high OLR, the TEs could not maintain the stable system [40]. One reason could be the high load in our study, i.e., 6.8 g COD/L·d, due to which Ni affects the process’s stability. Similarly, Jiang et al. (2012) digested vegetable waste in a laboratory-scale (4 L) digester and determined that an optimum concentration of trace elements could increase process stability at 2 g VS/(L·d). However, no effects of TEs were detected when high OLR 3 g VS/(L·d) was applied [41].
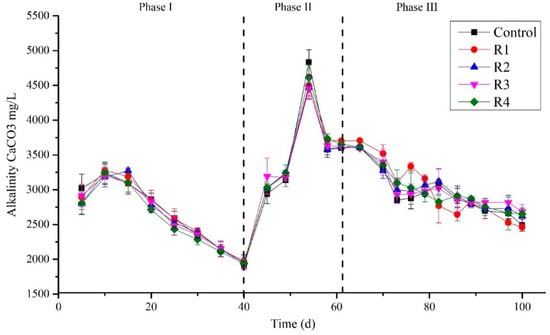
Figure 3.
Concentrations of alkalinity in different treated groups during the digestion process.
The significance of pH values represents digesters’ status, and microbial communities’ stability has been commonly considered [42]. Variation in pH during the digestion process is shown in Figure 4. At the beginning of the experiment, a decreased pH trend could be attributed to using destabilized sludge from the first experiment. Another reason could be the overload of the feed, which led to the accumulation of organic substances and rapidly converted to organic acids, resulting in the lowering of pH. However, in this situation, feeding was stopped for three days to allow methanogens to utilize the organic acids and maintain the pH [43]. The OLR was decreased to 5 g COD/L·d. By this approach, pH was maintained again up to day 39, suitable for methanogenic activities. In this duration, the methanogenic stage dominated, and the organic acids produced in the acidogenic stage were consumed, and eventually, pH values increased and tended to be stable [44]. A sudden drop in the pH was detected (6.64–6.73) on day 40 in all treatments and control due to unknown reasons. However, it could be concluded from this phase that nickel does not affect the pH stability, since our results strongly oppose the findings of Zhang et al. (2019), who stated that the addition of Ca+Ni could enhance the acid–base buffering capacity [45].
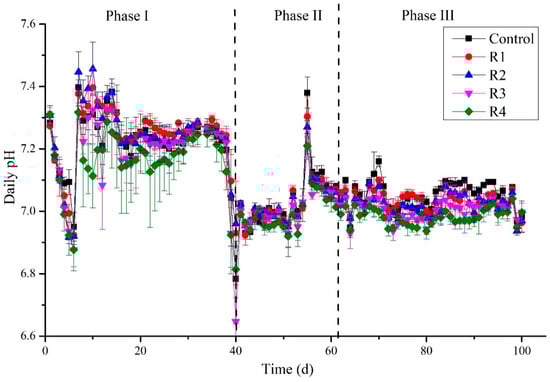
Figure 4.
Detection of pH daily during the digestion process.
On the other hand, Tian et al. (2017) reported a robust buffering capacity in the control compared to the nickel-added digesters [32]. In the third phase of the experiment, the pH was in the range (6.9 to 7.20), suitable for the high methanogenic activity. Moreover, in this duration, the pH values of control were found slightly above than mickel supplemented digesters, showing a high buffering capacity.
3.4. Daily Biogas Production
The daily biogas production was measured in all reactors in the third phase of the experiment. Figure 5 shows that no significant changes were observed among the treated reactors and control until day 20. Nevertheless, after day 20, an increase in biogas production was observed in R1, receiving 2 mg/L of Ni2+. Furthermore, the highest biogas production was recorded as 308.33 mL/day on the 23rd day of the experiment in the R1 reactor. Moreover, an apparent increase in biogas production was seen in R1 compare to other reactors. No significant difference among the reactors receiving 4, 8, and 16 mg/L was seen along with control. Therefore the addition of Ni2+ at a concentration of 2 mg/L performs better in terms of biogas yield than other concentrations. The present study’s biogas yield was comparable to the study conducted by Tian et al. (2017), who observed an increase in biogas yield when 2 mg/L of Ni2+ was added to the digester [32].
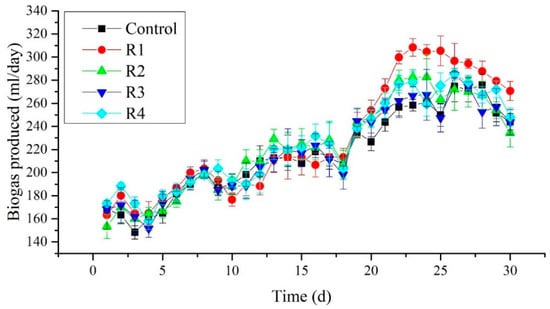
Figure 5.
Daily biogas production measured in different treated groups.
Moreover, Tian et al. (2017) found that high biogas yield would occur after 20 days of the experiment [32]. While in our experiment, the first peak was observed on the twenty-third day of the experiment. From this point, Ni2+ has a positive impact on the daily biogas production at 2 mg/L. However, later on, a decrease in biogas production was observed. This could be attributed to the decrease in stability parameters such as alkalinity and pH.
4. Conclusions
The present study investigated the impacts of nickel on the stability parameters of the anaerobic digestion of molasses. During the first phase of the experiment, a higher COD removal rate and methane content by 2–3% was observed in the reactors added with 2 and 4 mg/L. However, instability was observed in all reactors including the control due to a decrease in pH. Later on, in the third phase of the experiment, a high COD removal rate and methane content was observed in all reactors receiving Ni2+ compared to the control. Simultaneously, in the third phase, enhancement in daily biogas production was observed in reactors added with 2 mg/L of Ni2+; whereas no obvious difference was observed in alkalinity and pH in all reactors and control. It can be suggested from the current experiment that Ni2+ can enhance the process in terms of COD removal rate, methane content, and daily biogas, but have no impacts on the long-term stability of the anaerobic digestion of molasses.
Author Contributions
S.K.: Methodology, investigation, data curation, writing—original draft conceptualization. F.L.: Formal analysis. M.K.: Review and editing, P.S.: Supervision, resources, project administration, visualization. All authors have read and agreed to the published version of the manuscript.
Funding
This research was funded by National Natural Science Foundation of China (51868003) and Guangxi Key Research and Development Program (AB16380025).
Institutional Review Board Statement
Ethics approval and consent to participate (not applicable).
Informed Consent Statement
Not applicable.
Data Availability Statement
The data that support the findings of this study are available from the corresponding author upon reasonable request.
Conflicts of Interest
The authors declare that they have no known competing financial interests or personal relationships that could have appeared to influence the work reported in this paper. The authors declare the following financial interests/personal relationships which may be considered as potential competing interests.
References
- Zhang, W.; Xing, W.; Li, R. Real-time recovery strategies for volatile fatty acid-inhibited anaerobic digestion of food waste for methane production. Bioresour. Technol. 2018, 265, 82–92. [Google Scholar] [CrossRef]
- Choong, Y.Y.; Norli, I.; Abdullah, A.Z.; Yhaya, M.F. Impacts of trace element supplementation on the performance of anaerobic digestion process: A critical review. Bioresour. Technol. 2016, 209, 369–379. [Google Scholar] [CrossRef] [PubMed]
- De Vrieze, J.; Hennebel, T.; Boon, N.; Verstraete, W. Methanosarcina: The rediscovered methanogen for heavy duty biomethanation. Bioresour. Technol. 2012, 112, 1–9. [Google Scholar] [CrossRef]
- Osuna, M.B.; Iza, J.; Zandvoort, M.; Lens, P.N.L. Essential metal depletion in an anaerobic reactor. Water Sci. Technol. 2003, 48, 1–8. [Google Scholar] [CrossRef]
- Van der Meijden, P.; Heythuysen, H.J.; Pouwels, A.; Houwen, F.; van der Drift, C.; Vogels, G.D. Methyltransferases involved in methanol conversion by Methanosarcina barkeri. Arch. Microbiol. 1983, 134, 238–242. [Google Scholar] [CrossRef]
- Jaun, B.; Pfaltz, A. Coenzyme F430 from methanogenic bacteria: Reversible one-electron reduction of F430 pentamethyl ester to the nickel (I) form. Chem. Commun. 1986, 17, 1327–1329. [Google Scholar] [CrossRef]
- Feng, X.M.; Karlsson, A.; Svensson, B.H.; Bertilsson, S. Impact of trace element addition on biogas production from food industrial waste–linking process to microbial communities. FEMS Microbiol. Ecol. 2010, 74, 226–240. [Google Scholar] [CrossRef]
- Wintsche, B.; Jehmlich, N.; Popp, D.; Harms, H.; Kleinsteuber, S. Metabolic adaptation of methanogens in anaerobic digesters upon trace element limitation. Front. Microbiol. 2018, 9, 405. [Google Scholar] [CrossRef]
- Speece, R.E.; Parkin, G.F.; Gallagher, D. Nickel stimulation of anaerobic digestion. Water Res. 1983, 17, 677–683. [Google Scholar] [CrossRef]
- Munk, B.; Lebuhn, M. Process diagnosis using methanogenic Archaea in maize-fed, trace element depleted fermenters. Anaerobe 2014, 29, 22–28. [Google Scholar] [CrossRef] [PubMed]
- Gustavsson, J.; Yekta, S.S.; Sundberg, C.; Karlsson, A.; Ejlertsson, J.; Skyllberg, U.; Svensson, B.H. Bioavailability of cobalt and nickel during anaerobic digestion of sulfur-rich stillage for biogas formation. Appl. Energy 2013, 112, 473–477. [Google Scholar] [CrossRef]
- Schmidt, T.; Nelles, M.; Scholwin, F.; Pröter, J. Trace element supplementation in the biogas production from wheat stillage—Optimization of metal dosing. Bioresour. Technol. 2014, 168, 80–85. [Google Scholar] [CrossRef]
- Yekta, S.S.; Svensson, B.H.; Björn, A.; Skyllberg, U. Thermodynamic modeling of iron and trace metal solubility and speciation under sulfidic and ferruginous conditions in full scale continuous stirred tank biogas reactors. J. Appl. Geochem. 2014, 47, 61–73. [Google Scholar] [CrossRef]
- Oleszkiewicz, J.A.; Sharma, V.K. Stimulation and inhibition of anaerobic processes by heavy metals—A review. Biol. Wastes 1990, 31, 45–67. [Google Scholar] [CrossRef]
- Pobeheim, H.; Munk, B.; Johansson, J.; Guebitz, G.M. Influence of trace elements on methane formation from a synthetic model substrate for maize silage. Bioresour. Technol. 2010, 101, 836–839. [Google Scholar] [CrossRef] [PubMed]
- Wei, Q.; Zhang, W.; Guo, J.; Wu, S.; Tan, T.; Wang, F.; Dong, R. Performance and kinetic evaluation of a semi-continuously fed anaerobic digester treating food waste: Effect of trace elements on the digester recovery and stability. Chemosphere 2014, 117, 477–485. [Google Scholar] [CrossRef] [PubMed]
- Janke, L.; Leite, A.; Nikolausz, M.; Schmidt, T.; Liebetrau, J.; Nelles, M.; Stinner, W. Biogas production from sugarcane waste: Assessment on kinetic challenges for process designing. In. J. Mol. Sci. 2015, 16, 20685–20703. [Google Scholar] [CrossRef] [PubMed]
- Aquino, S.F.D.; Brandt, E.M.F.; Chernicharo, C.A.D.L. Remoção de fármacos e desreguladores endócrinos em estações de tratamento de esgoto: Revisão da literatura. Eng. Sanit. 2013, 18, 187–204. [Google Scholar] [CrossRef]
- Chen, Y.; Cheng, J.J.; Creamer, K.S. Inhibition of anaerobic digestion process: A review. Bioresour. Technol. 2008, 99, 4044–4064. [Google Scholar] [CrossRef]
- Zhang, L.; Ouyang, W.; Lia, A. Essential role of trace elements in continuous anaerobic digestion of food waste. Procedia Environ. Sci. 2012, 16, 102–111. [Google Scholar] [CrossRef]
- Kumar, P.; Mehariya, S.; Ray, S.; Mishra, A.; Kalia, V.C. Biodiesel industry waste: A potential source of bioenergy and biopolymers. Indian J. Microbiol. 2015, 55, 1–7. [Google Scholar] [CrossRef]
- Khan, S.; Lu, F.; Jiang, Q.; Jiang, C.; Kashif, M.; Shen, P. Assessment of Multiple Anaerobic Co-Digestions and Related Microbial Community of Molasses with Rice-Alcohol Wastewater. Energies 2020, 13, 4866. [Google Scholar] [CrossRef]
- Callander, I.J.; Barford, J.P. Precipitation, chelation, and the availability of metals as nutrients in anaerobic digestion. II. Applications. Biotechnol. Bioeng. 1983, 25, 1959–1972. [Google Scholar] [CrossRef]
- Šafarič, L.; Yekta, S.S.; Svensson, B.H.; Schnürer, A.; Bastviken, D.; Björn, A. Effect of Cobalt, Nickel, and Selenium/Tungsten Deficiency on Mesophilic Anaerobic Digestion of Chemically Defined Soluble Organic Compounds. Microorganisms 2020, 8, 598. [Google Scholar] [CrossRef] [PubMed]
- Colussi, I.; Cortesi, A.; Della Vedova, L.; Gallo, V.; Robles, F.C. Start-up procedures and analysis of heavy metals inhibition on methanogenic activity in EGSB reactor. Bioresour. Technol. 2009, 100, 6290–6294. [Google Scholar] [CrossRef]
- Mudhoo, A.; Kumar, S. Effects of heavy metals as stress factors on anaerobic digestion processes and biogas production from biomass. Int. J. Environ. Sci. Technol. 2013, 10, 1383–1398. [Google Scholar] [CrossRef]
- Lo, H.M.; Chiang, C.F.; Tsao, H.C.; Pai, T.Y.; Liu, M.H.; Kurniawan, T.A.; Lo, F.C. Effects of spiked metals on the MSW anaerobic digestion. Waste Manag. Res. 2012, 30, 32–48. [Google Scholar] [CrossRef] [PubMed]
- Bertin, L.; Bettini, C.; Zanaroli, G.; Fraraccio, S.; Negroni, A.; Fava, F. Acclimation of an anaerobic consortium capable of effective biomethanization of mechanically-sorted organic fraction of municipal solid waste through a semi-continuous enrichment procedure. J. Chem. Technol. Biotechnol. 2012, 87, 1312–1319. [Google Scholar] [CrossRef]
- Bagby, M.M.; Sherrard, J.H. Combined effects of cadmium and nickel on the activated sludge process. J. Water Pollut. Control Fed. 1981, 53, 1609–1619. [Google Scholar]
- Takashima, M.; Shimada, K.; Speece, R.E. Minimum requirements for trace metals (iron, nickel, cobalt, and zinc) in thermophilic and mesophilic methane fermentation from glucose. Water Environ. Res. 2011, 83, 339–346. [Google Scholar] [CrossRef]
- Adams, C.E., Jr.; Wesley, W.; Goodman, B.L. The Effects and Removal of Heavy Metals in Biological Treatment. In Heavy Metals in the Aquatic Environment Proceedings of the International Conference Held in Nashville, Tennessee, December 1973; Pergamon Press: Oxford, UK, 1975; p. 277. [Google Scholar]
- Tian, Y.; Zhang, H.; Chai, Y.; Wang, L.; Mi, X.; Zhang, L.; Ware, M.A. Biogas properties and enzymatic analysis during anaerobic fermentation of Phragmites Australis straw and cow dung: Influence of nickel chloride supplement. Biodegradation 2017, 28, 15–25. [Google Scholar] [CrossRef] [PubMed]
- Yue, Z.B.; Yu, H.Q.; Wang, Z.L. Anaerobic digestion of cattail with rumen culture in the presence of heavy metals. Bioresour. Technol. 2007, 98, 781–786. [Google Scholar] [CrossRef] [PubMed]
- Aresta, M.; Narracci, M.; Tommasi, I. Influence of iron, nickel and cobalt on biogas production during the anaerobic fermentation of fresh residual biomass. J. Chem. Ecol. 2003, 19, 451–459. [Google Scholar] [CrossRef]
- Dar, G.H.; Tandon, S.M. Response of a cattle dung methane fermentation to nickel. Biol. Wastes 1987, 22, 261–268. [Google Scholar]
- Williams, C.M.; Shih, J.C.H.; Spears, J.W. Effect of nickel on biological methane generation from a laboratory poultry waste digester. Biotechnol. Bioeng. 1986, 28, 1608–1610. [Google Scholar] [CrossRef] [PubMed]
- Raju, N.R.; Devi, S.S.; Nand, K. Influence of trace elements on biogas production from mango processing waste in 1.5 m3 KVIC digesters. Biotechnol. Lett. 1991, 13, 461–464. [Google Scholar] [CrossRef]
- Li, L.; He, Q.; Wei, Y.; He, Q.; Peng, X. Early warning indicators for monitoring the process failure of anaerobic digestion system of food waste. Bioresour. Technol. 2014, 171, 491–494. [Google Scholar] [CrossRef] [PubMed]
- Bardi, M.J.; Aminirad, H. Synergistic effects of co-trace elements on anaerobic co-digestion of food waste and sewage sludge at high organic load. Environ. Sci. Pollut. Res. 2020, 27, 18129–18144. [Google Scholar]
- Li, D.; Sun, J.; Cao, Q.; Chen, Y.; Liu, X.; Ran, Y. Recovery of unstable digestion of vegetable waste by adding trace elements using the bicarbonate alkalinity to total alkalinity ratio as an early warning indicator. Biodegradation 2019, 30, 87–100. [Google Scholar] [CrossRef]
- Jiang, Y.; Heaven, S.; Banks, C.J. Strategies for stable anaerobic digestion of vegetable waste. Renew. Energy 2012, 44, 206–214. [Google Scholar] [CrossRef]
- Wang, K.; Yin, J.; Shen, D.; Li, N. Anaerobic digestion of food waste for volatile fatty acids (VFAs) production with different types of inoculum: Effect of pH. Bioresour. Technol. 2014, 161, 395–401. [Google Scholar] [CrossRef]
- Glass, J.; Orphan, V.J. Trace metal requirements for microbial enzymes involved in the production and consumption of methane and nitrous oxide. Front. Microbiol. 2012, 3, 61. [Google Scholar] [CrossRef]
- Zhang, X.; Qiu, W.; Chen, H. Enhancing the hydrolysis and acidification of steam-exploded cornstalks by intermittent pH adjustment with an enriched microbial community. Bioresour. Technol. 2012, 123, 30–35. [Google Scholar] [CrossRef]
- Zhang, H.; Xu, Y.; Tian, Y.; Zheng, L.; Hao, H.; Huang, H. Impact of Fe and Ni Addition on the VFAs’ Generation and Process Stability of Anaerobic Fermentation Containing Cd. Int. J. Environ. Res. Public Health 2019, 16, 4066. [Google Scholar] [CrossRef] [PubMed]


Publisher’s Note: MDPI stays neutral with regard to jurisdictional claims in published maps and institutional affiliations. |
© 2021 by the authors. Licensee MDPI, Basel, Switzerland. This article is an open access article distributed under the terms and conditions of the Creative Commons Attribution (CC BY) license (https://creativecommons.org/licenses/by/4.0/).