Article

Scale Change and Correlation of Plant Functional Characteristics in the Desert Community of Ebinur Lake

1
College of Resources and Environmental Science, Xinjiang University, Urumqi 830046, China
2
Key Laboratory of Oasis Ecology, Ministry of Education, Urumqi 830046, China
*
Author to whom correspondence should be addressed.
Sustainability 2021, 13(9), 4983; https://doi.org/10.3390/su13094983
Submission received: 24 March 2021 / Revised: 23 April 2021 / Accepted: 26 April 2021 / Published: 29 April 2021

Abstract

:
The difference of functional traits among different species is the basis of species coexistence in natural ecosystems, and the variation of traits among individuals within species also plays an important role in species coexistence and distribution. Taking the desert plant community of Ebinur Lake as the research object, five plant functional characteristics were measured in 13 plants of 25 quadrats in the study area. The changes of these five functional characteristics by the method of character gradient analysis and the scale variation of plant functional traits and the correlation between their environments were studied. The results showed that: (1) the range of α value of the five plant functional characteristics in the community was larger than that of β value; that is, the change of the character value of a species relative to related symbiotic species was larger than that along the average character gradient of the community. (2) The correlations between leaf thickness and leaf area as well as between leaf thickness and leaf dry matter content were the strongest with correlation coefficients. That is, the correlations between LTH and SLA as well as between LTH and LDMC were stronger than that between the two species in the community, suggesting that the development of succession had no significant effect. The strategies used by dominant species to adapt to the environment changed from high-speed growth to improving resource utilization efficiency, while the coexisting species in the same community adopted different character combinations to adapt to the common community environment.

1. Introduction

Plant functional traits are biological characteristics of plants that affect survival, growth, reproduction rate, and plant fitness [1] These traits involve a long-term evolutionary process of plants, through the co-evolution of different internal functions, which can affect the survival, reproduction, death, and final fitness of plants. These traits allow the plant to adopt specific ecological strategies or attributes used to adapt to the surrounding environment and affect the structure and function of an ecosystem; there are certain biological attributes of a species that affect its ability to adapt to the environment [2,3,4,5]. Variation of plant functional traits, as a bridge connecting plants and the environment, has become a hot spot in ecology and global change research in recent years [6]. Trait variations can not only reflect the ability of plants to acquire, use, and conserve resources, but also closely link the environment, plant individuals, and ecosystem structure, processes, and functions to reflect the relationship between organisms at the levels of individuals, populations, communities, and ecosystems [7]. The interaction between organisms and the environment provides an important opportunity for studying many important ecological issues such as plant community development and mechanisms used to maintain biodiversity [8,9,10].
The variation of plant functional traits is the result of the of environmental change and scale effect. As trait changes are widespread at various scales, such as intraspecific, interspecific, community, and other organizational scales as well as different spatial scales, it is difficult to capture their changes [11]. Intraspecific variation refers to the phenotypic or genetic differences between different individuals, and provides the raw materials used for natural selection. It is one of the basic elements involved in biological evolution [12]. Intraspecific variation provides the maximum ability of plants to adapt along biological and abiotic gradients and fundamentally determines the plant niche width [13]. Plants can regulate ecological processes such as decomposition and resistance to herbivores through intraspecific variation; individual variation can allow species to enter local communities through abiotic and biological screening processes [14]. Interspecific variability refers to the differences in traits between different species. In natural communities, interspecific differences in traits are considered to be an important prerequisite for the coexistence of species in a specific habitat, and therefore have always been the main content of research related to variations in plant functional traits [15]. Proponents of niche theory believe that the composition of plant communities at different scales depends not only on the effects of environmental factors (such as climate, soil, and interference), but also on the interaction of organisms within the community to produce variations in trait composition in a community of species [16]. First, through environmental screening, species with similar functional traits are selected, which leads to the convergence of the traits of coexisting species in a community. However, overly similar species in a community will compete for exclusion, thereby reducing niche overlap and alleviating the pressure of resource competition that has led to the divergence of traits of species in a community in similar habitats. An increasing number of studies have found that the study of interspecific trait variation has certain limitations [17]. Only by combining the variation of intraspecific and interspecific traits can the response of species to environmental changes and resource competition be truly reflected in the process of community development [18]. Then, understanding how the relative importance of the two dynamics of environmental screening and biological competition based on trait variation has always been a major challenge in the field of ecology [19,20]. Analysis that uses trait gradient analysis techniques can distinguish the variation of plant traits in a community (α component) from the change in environmental gradient (β component) [21]. If an obvious environmental gradient exists, one can expect that the β components of different traits should have a strong covariance relationship; conversely, if competitive exclusion plays a dominant role with the species dividing the niche on different strategy axes, the α component of different traits can be expected to dominate [22]. The components have only a weak covariance relationship. Obviously, it is of great theoretical significance to examine how the α and β components of a species vary and correlate with each other in order to understand the mechanism of community development at different scales [23].
Climatic conditions cause desert ecosystems and arid regions to typically receive very little water from precipitation or from ice and snow melt. As a result, lake and river water serves as an important source for replenishing soil moisture. When coupled with large evaporation rates, soil salinization tends to be relatively serious in these areas so that plants experience a double stress from a lack of water along with increased water and soil salination [24]. Plant leaf morphology and the soil environment are closely related in arid regions. In recent years, research on functional traits of plants in arid regions has focused on how morphological and physiological traits of desert plants respond to changes in soil water and salt conditions [25]. However, few studies have reported on the scale changes and correlations among plant functional traits [26,27,28]
The vegetation structure of Aibi Lake Basin consists of desert forest in an arid area; Populus euphratica serves as the dominant species and is associated with various shrubs and herbs. Its special geographical location and climate type support plants that are adapted to the arid climate and soil salinization. Therefore, the plants in this area have established special leaf traits allowing them to tolerate wind and blowing sand, stabilize soil, conserve water, and this helps to maintain the biodiversity of the region [29]. This region has important ecological significance and provides an ideal research object that can be used to examine the changes and correlations of leaf character scales in arid desert areas [30]. In view of this, in the present study, the plant community of the desert ecosystem in the Aibi Lake Basin in Xinjiang Uygur Autonomous Region of the People’s Republic of China was selected as the research object. Five functional traits, average plant height, leaf thickness, specific leaf weight, specific leaf area and leaf dry matter content, were selected. The trait gradient and correlation analysis methods were used to analyze the variation of plant functional traits within and among communities in this area, with a view to discussing the following two scientific issues: (1) How do the plant functional traits in the study area change within and between communities? (2) What scale dependence and correlations do plant functional traits have? Reasonable answers to these scientific questions cannot only reveal the role of environmental screening and biological interactions in community development, but also help us to explore the dynamic changes and dynamics of community species composition and structure from the perspective of functional ecology. The findings will provide a scientific basis for vegetation management and restoration of Lake Aibi Natural Wetland Reserve.

2. Materials and Methods

2.1. Sampling Site Setting and Investigation

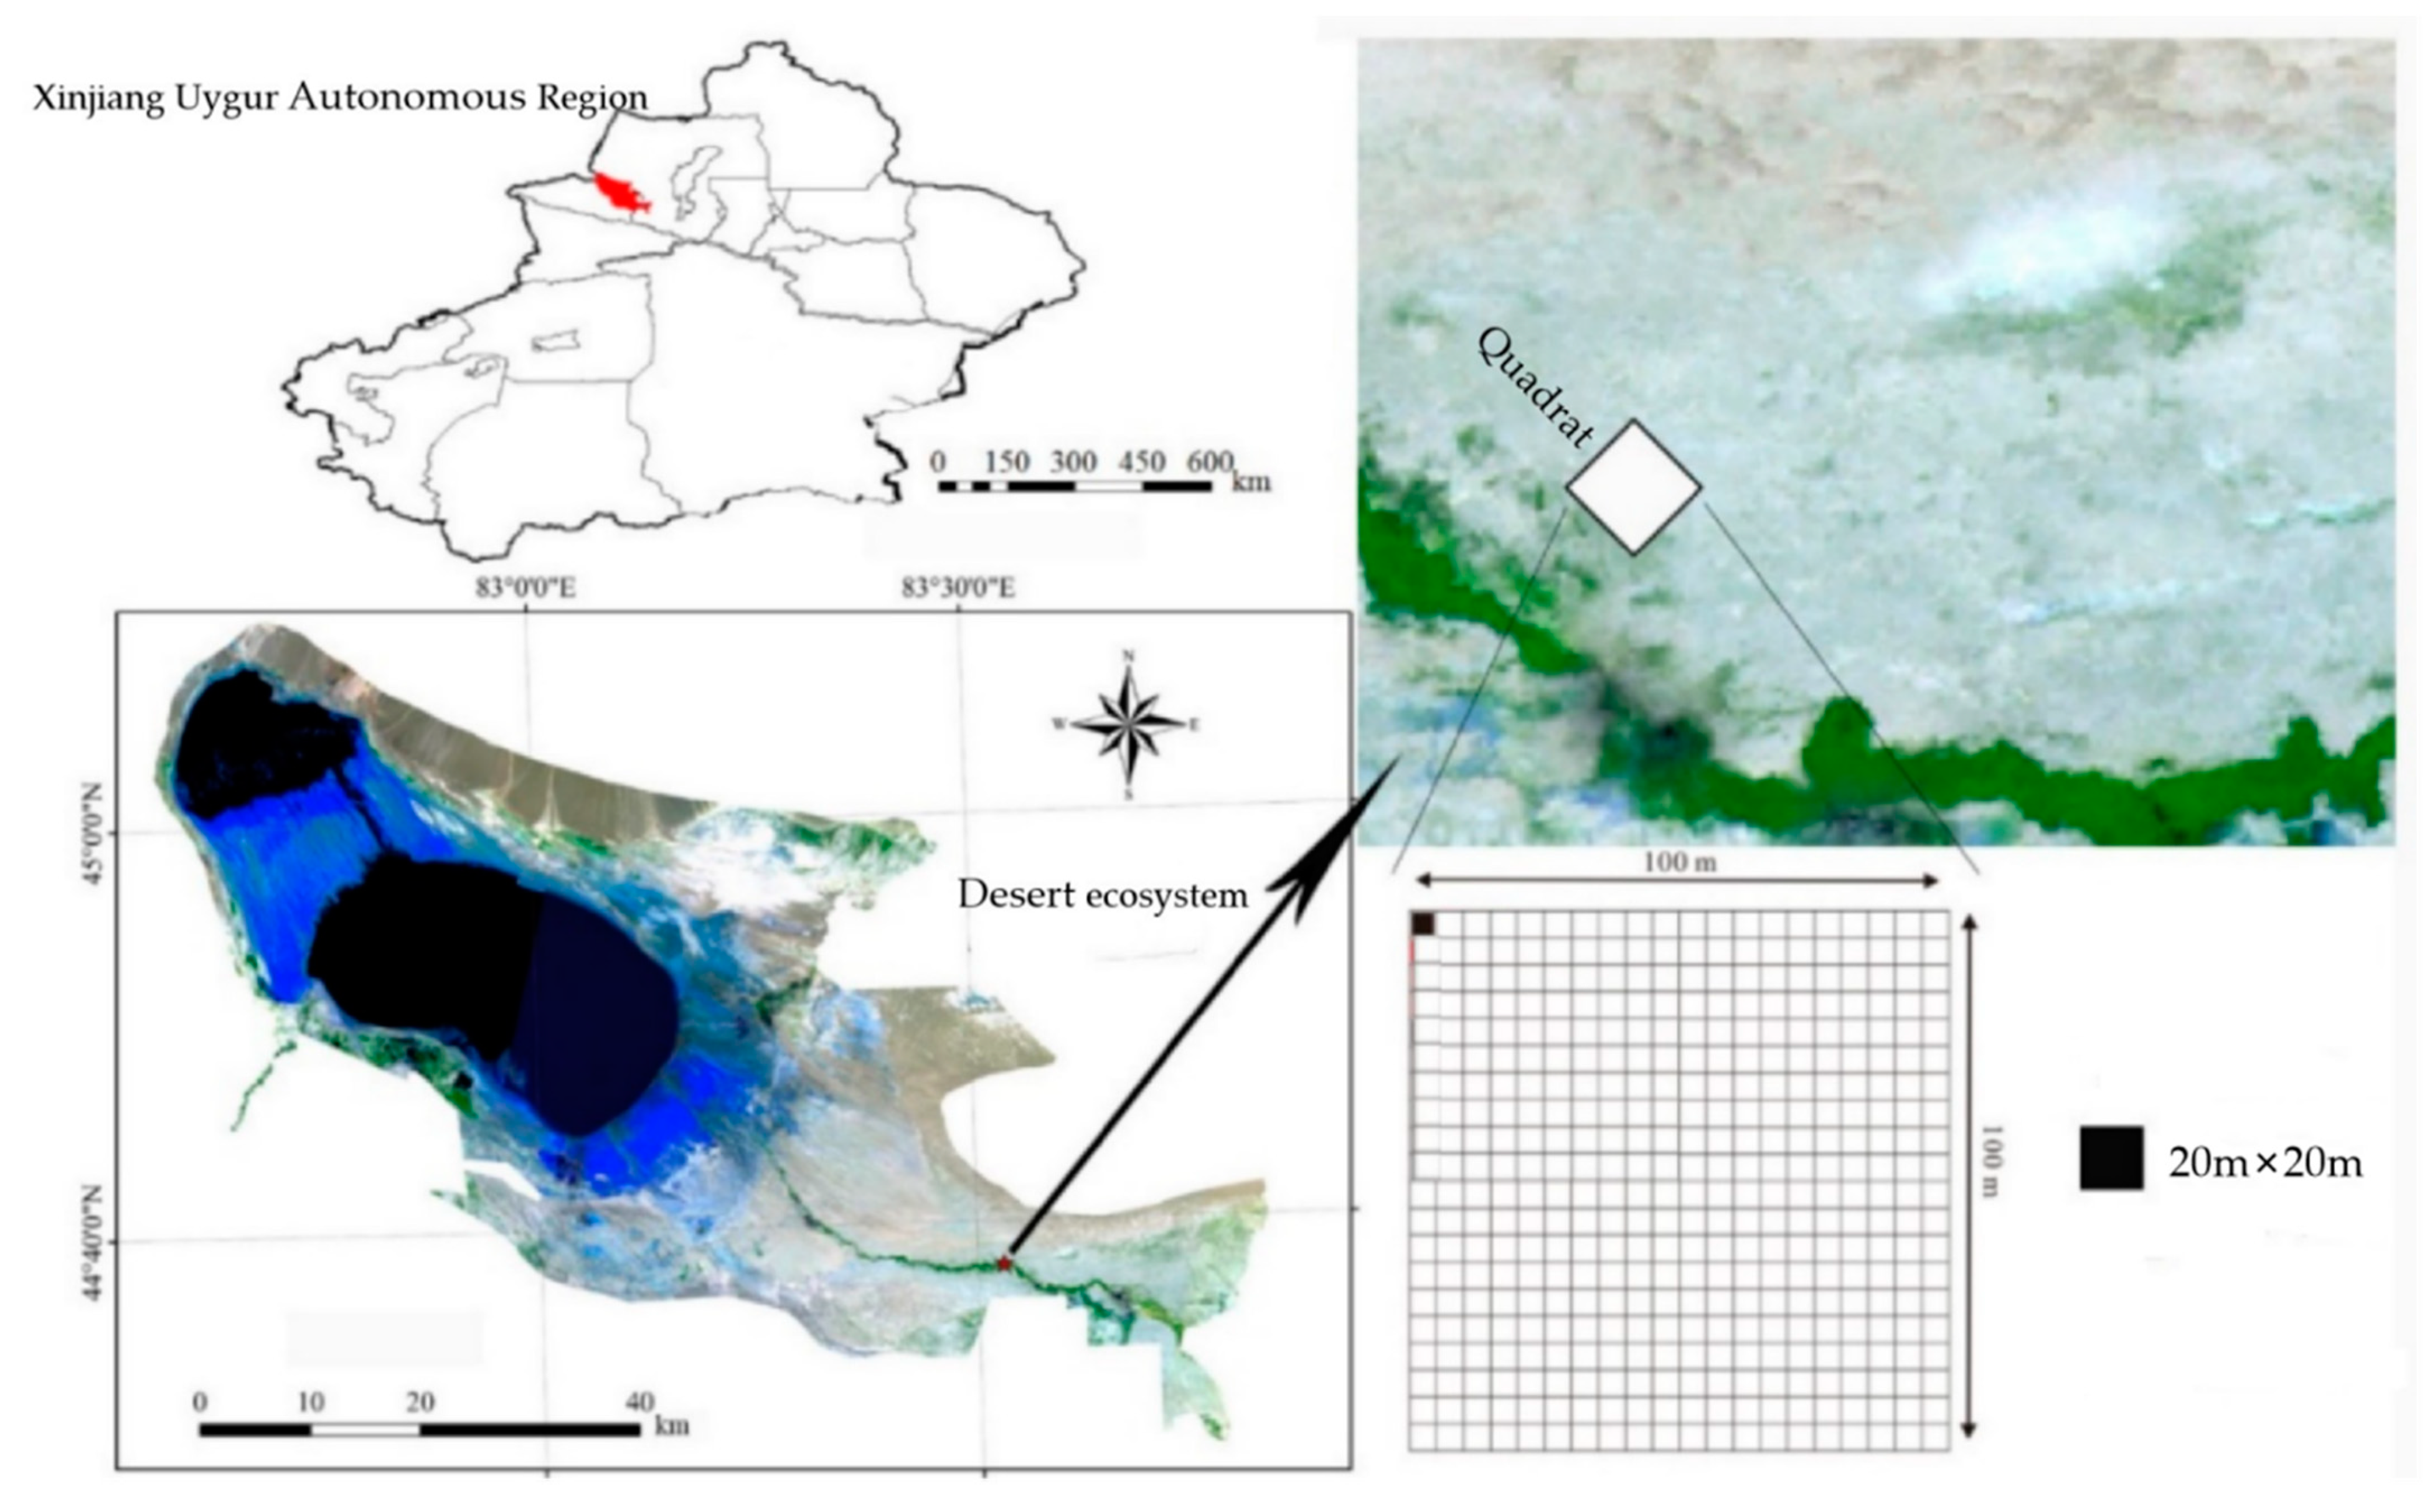
2.1.1. Description of the Study Area

Xinjiang Aibi Lake Wetland National Nature Reserve (44°30′ –45°09′ N, 82°36′ –83°50′ E) is located in Bortala Mongolian Autonomous Prefecture, Xinjiang Uygur Autonomous Region, China, and covers an area of about 2670 km2 [31]. High mountains define the northern, western, and southern borders of the region while the east is connected to the Gurbantunggut Desert. An average of 100 mm of precipitation falls annually with average annual evaporation of more than 1600 mm; the annual sunshine hours are about 2800 h, while the extreme maximum, minimum, and annual average temperatures are 44 °C, −34 °C, and 6–8 °C, respectively [32]. The extremely dry climate is a typical temperate continental arid climate. The unusual desert environment in the Lake Aibi watershed breeds special plant resources. The main dominant plants in the region include Populus euphratica, Haloxylon ammodendron, Halimodendron halodendron, and Apocynum venetum. Other plants include Reaumuria soongorica, Nitraria schoberi, Alhagi sparsifolia, Lycium ruthenicum, Suaeda glauca, Salsola collina, and other species [33]. The soil has mainly developed into gray–brown desert soil, saline soil, aeolian sand soil, etc., with an average particle size of 2.63–6.51 μm, a pH value in the range of 7.52–9.29, a high degree of soil salinization, and an area of saline soil reaching 568 km2.

2.1.2. Plant Community Investigation

In July and August 2018, a 100 m × 100 m plot was established perpendicular to the river channel in the protected desert riparian forest area near the East Bridge Management Station and 150 m from the bank of Aqiksu River. The plot was divided into 25 subplots of 20 m × 20 m for investigation (Figure 1). Each tree was sampled and measured with the species name, tree height, diameter at breast height, crown width and coverage. For shrubs, the species name, number of plants per subplot, basal diameter, plant height, and percent coverage of all shrubs within the shrub layer were measured. Three representative plants in the herb layer were selected and the species name, number of plants, basal diameter, plant height, and percent cover were recorded for each species of selected plants [32].

2.2. Statistical Analysis

2.2.1. Selection and Determination of Functional Traits

Average plant height, leaf thickness, specific leaf weight, specific leaf area, and leaf dry matter content were selected as the indicators of plant functional traits. Table 1 is the definition and ecological significance of plant characters. During field investigations, the height of each tree was measured with an altimeter, while the height of each shrub and selected herb was measured with a tape measure. For the determination of leaf traits, the thickness of the leaves was determined using percentile calipers.
For each sampled plant, 20 leaves with the same growth pattern and size were selected in the four cardinal directions of the canopy. After measuring the wet weight, each selected leaf was placed on a 1-mm2/J grid paper as a photographic background and a digital camera was used to capture a photograph of each leaf. Next, ImageJ software was used to process the photos by calculating the leaf area and the projected leaf area of each leaf. The sum of the area of the 20 leaves was calculated. Later, leaves were dried in an oven to a constant weight. After weighing with an analytical balance, the specific leaf weight of each blade was calculated as
LMA ( g / cm 2 ) = TLW ( g ) / TLA ( cm ) 2 ,
where LMA (g/cm2), TLW (cm2/g), and TLA (cm2) represent the specific leaf weight, total leaf dry weight, and total leaf area, respectively. The specific leaf area and specific leaf weight are reciprocal to each other, and their values are equal to the ratio of the single surface area of the leaf to the dry weight of the leaf.

2.2.2. Trait-Gradient Analysis.

Based on the Finalay–Wilkinson model of plant breeding, Ackerly and Cornwell proposed the trait-gradient analysis method [38,39]. The trait gradient analysis method is often used to sort the community according to its average trait value to form a trait gradient. The average value of each trait was calculated from the trait value of the species in the community based on the multiplicity weighting of the species. Then, the trait gradient was used to classify the functional trait of the species (ti) and split it into two components, α and β. The β component is the position of the species on the trait gradient; it indicates the change of the species along the trait value among the communities. The α component is the difference between the trait value of a species and the average trait value of the community; it indicates the change of the trait value of the species within the community relative to the coexisting species. Since this involves quantitative analysis, it is possible to distinguish the variation (α) component of plant traits within the community from the change in the environmental gradient (β) component. If an obvious environmental gradient exists, it can be expected that the β components of different traits should have a strong covariance relationship; conversely, if competitive exclusion plays a dominant role, the species are known to divide the niche on different strategic axes, and the α of different traits can be expected. The components have only a weak covariance relationship. The main calculation formula of the property gradient-analysis method is as follows [40]:
P j = i = 1 s a ij * t ij i = 1 i a ij ,
t i = j = 1 n t ij a ij j = 1 n a ij ,
β i = j = 1 n P j a ij j = 1 n a ij ,
α i = t i β i ,
where Pj and ti are the average trait values of the community and the species, respectively, aij is the abundance or weight of species i in community j, tij is the trait value of species i in community j, n represents the total number of communities surveyed, and s represents the total number of species in the survey. In this study, n = 25 and s = 13.
To more intuitively explain the trait gradient analysis method, this article uses specific leaf area as an example to introduce its ecological significance. Figure 1 provides a scatter plot of the average specific leaf area of the 13 species analyzed here and the average specific leaf area of the community analyzed in this study. The gray dots represent the species in each community, the red squares represent the tree Populus euphratica, the orange diamonds represent Nitraria tangutorum, and the green circles represent Phragmites australis. The X and Y axes are the average specific leaf area of the community (Pj) and the average specific leaf area (ti) of the species, respectively. The slope of the dotted line y = x is the ratio of the mean leaf area of a series of coexisting species to the mean leaf area of the community. The horizontal axis corresponding to the hollow graphic point of each species represents the average position of the species in the plot (i.e., the β component βi of the species trait), and the ordinate is the average trait value ti of the species, or the difference between the two. That is, the distance from the hollow graphic point to y = x (because αi = ti–βi) is the α component αi of the functional trait of the species, which represents the difference between the average specific leaf area of species i and the average specific leaf area of coexisting species in the community, bi. It is the slope of the regression line of the average specific leaf area (ti) of species i to the average specific leaf area (pj) of the community, reflecting the variation of the average specific leaf area of the species along the average trait gradient of the community within the species.
Figure 2 Introduces the ecological significance of the α and β components in Populus euphratica, Nitraria tangutorum, and Phragmites australis. In terms of specific leaf area, the β component of P. Populus euphratica calculated with reference to the formula was 69.55, which is in the lower half of the trait gradient constructed from the average specific leaf area. This finding indicates that P. Populus euphratica is commonly found in communities with lower specific leaf area values; the αi value of −3.53 indicates that P. Populus euphratica has a relatively low specific leaf area value compared with other species in the community, mostly in the later stage of community succession, the internal radiation of the community is weak, the humidity is relatively large, and the proportion of drought-tolerant species in the community is large. Generally, a conservative strategy to improve nutrient use efficiency was adopted. The β component of reed, 71.27, is in the upper half of the trait gradient constructed by the average leaf thickness of the community, indicating that reeds are mostly found in communities with high leaf thickness. The αi value was −0.72, indicating that the reed is slightly larger than other plants in the community, allowing it to adapt to the community environment; therefore, the openness strategy of increasing the growth rate was adopted.

3. Result and Analysis

3.1. Differences in Plant Functional Traits of Various Species

Differences in the plant functional traits of various species indicate that significant differences existed for average plant height in the distribution of the three levels of trees, shrubs, and herbs; trees were significantly taller than shrubs and herbs (p < 0.01; Figure 3). Lycium barbarum had the largest average leaf thickness (1.31 mm) while Achnatherum splendens had the smallest (0.31 mm). Lycium barbarum also had the smallest specific leaf area (47.70 cm2/g). Reed had the highest leaf dry matter content (4.13 g/kg), which was significantly larger than that of other plants (p < 0.01)

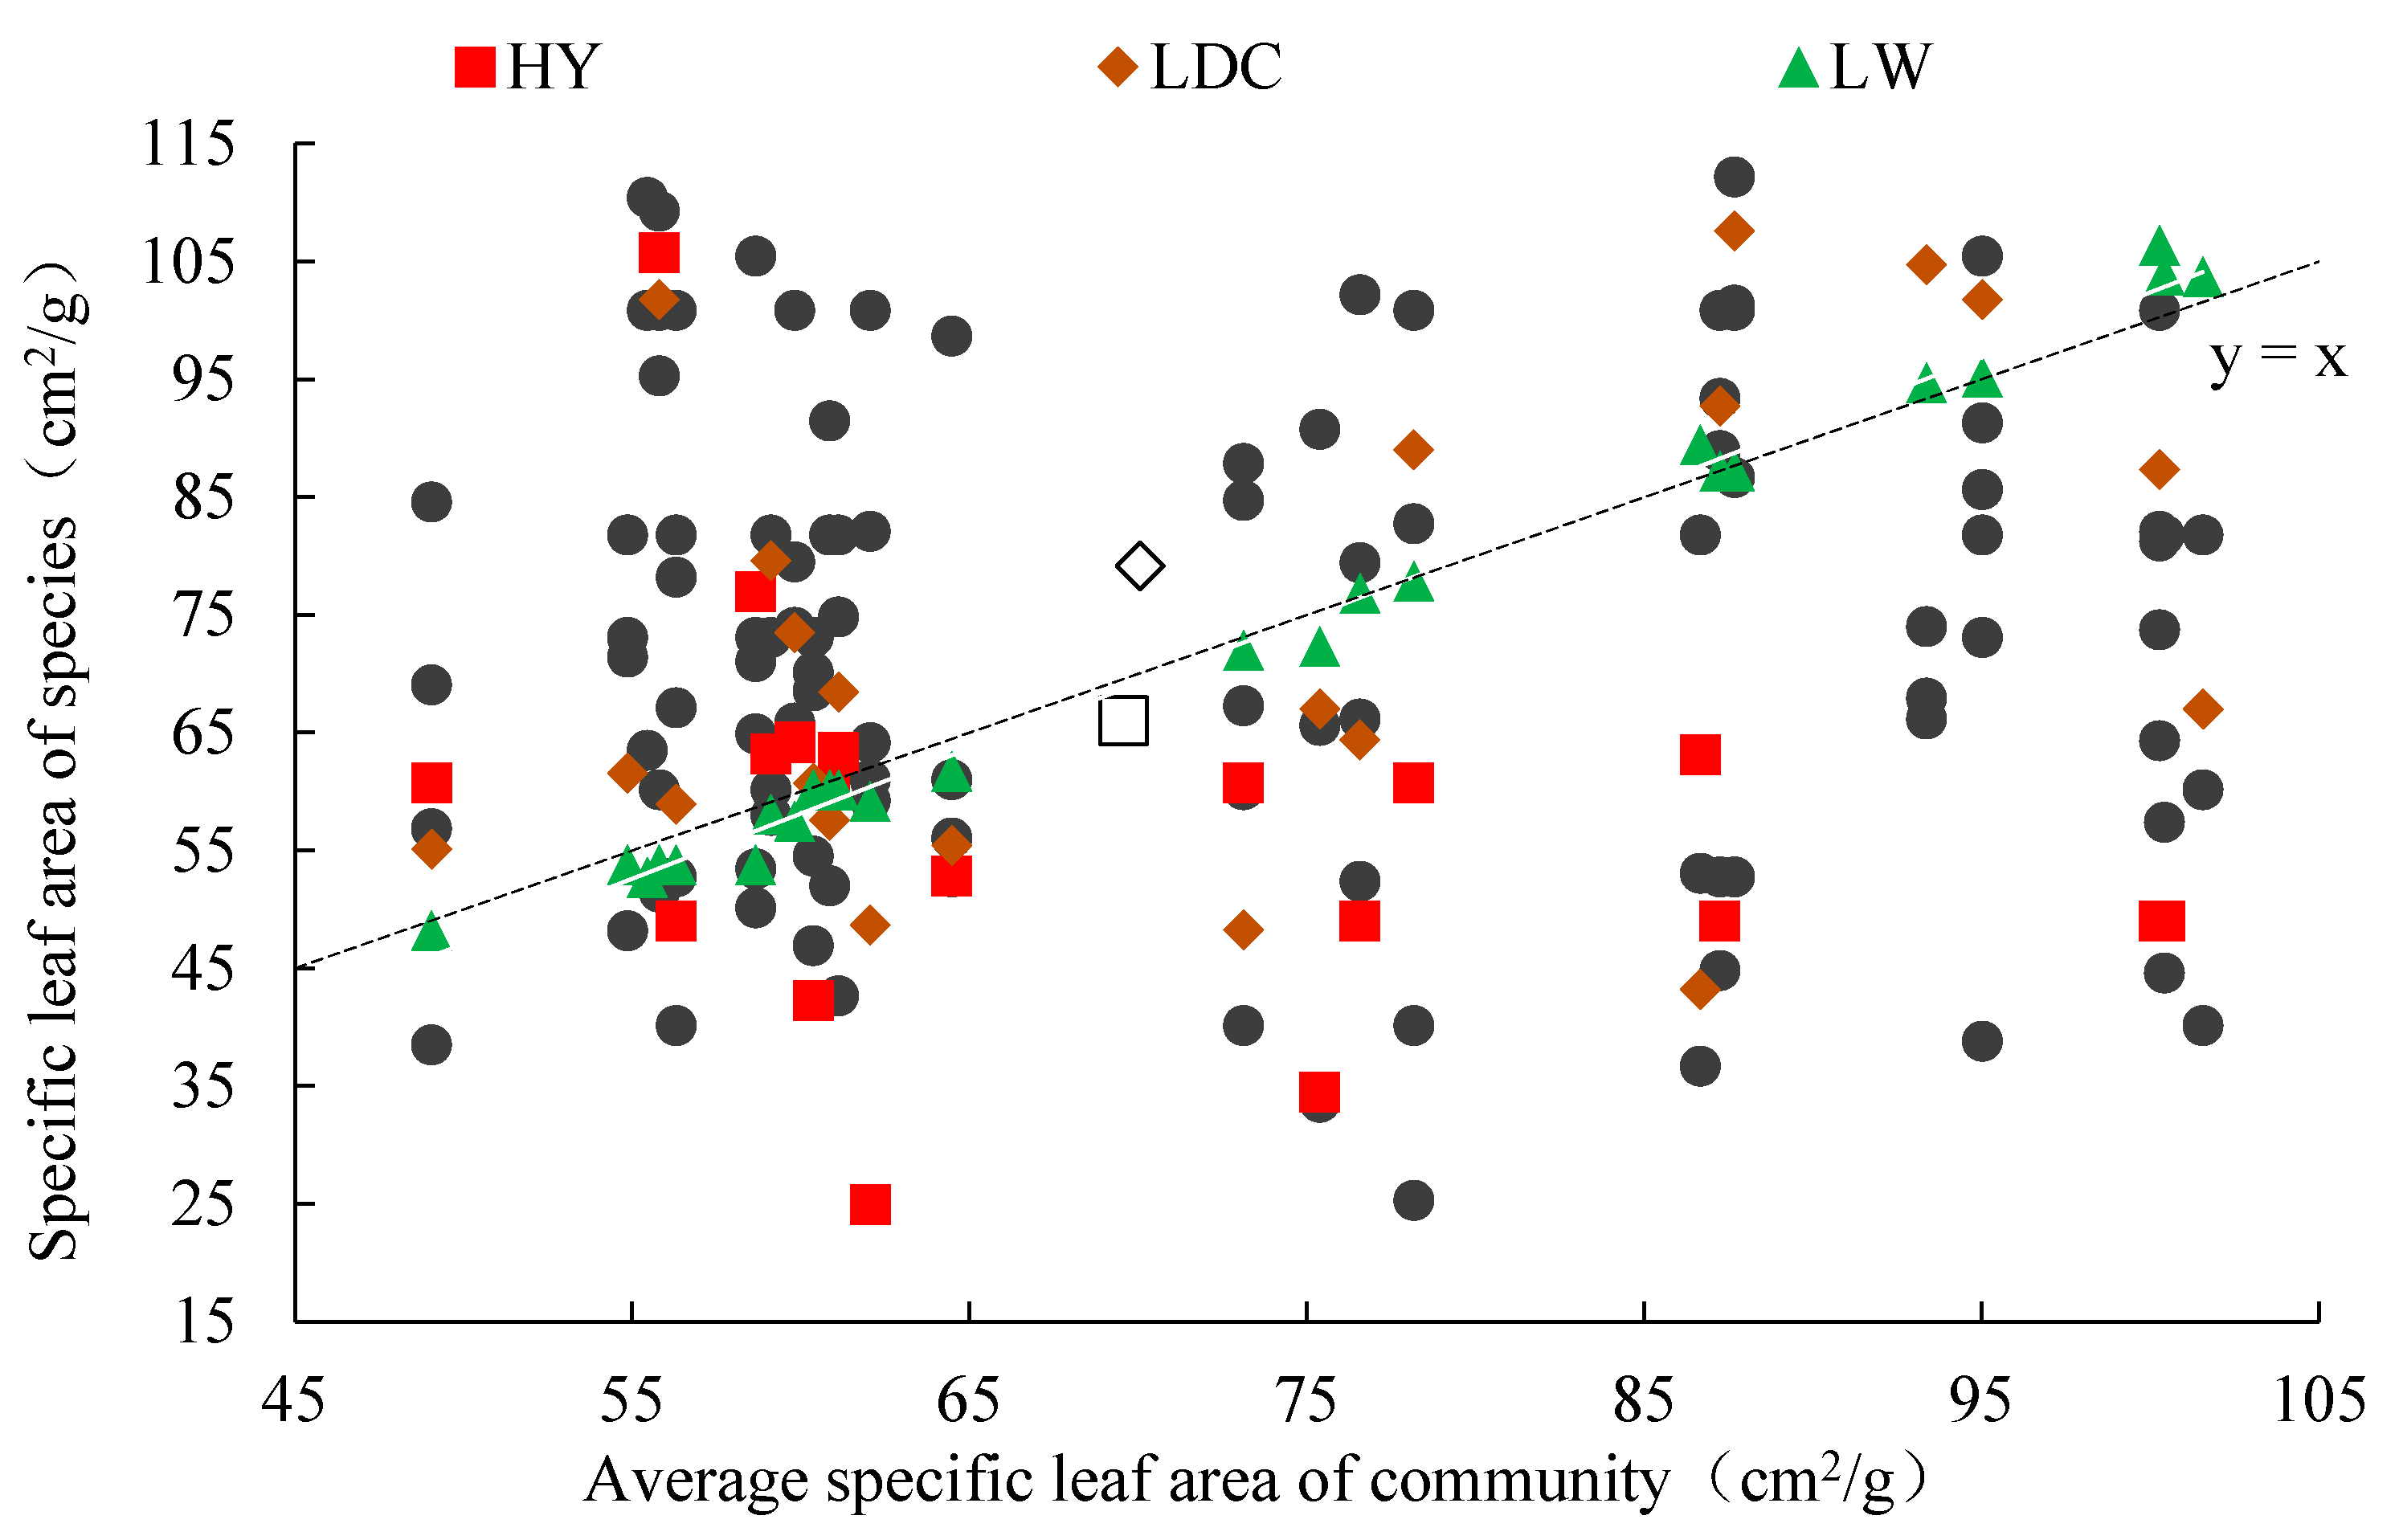
3.2. Changes of Plant Functional Traits between and within Communities

As shown in Table 2, the α and β components of specific leaf area ranged from −2.83 to 2.44 and from 0.33 to 4.01, respectively. The α and β components of average plant height ranged from 97.21 to 449 and 75.60 to 102.87, respectively. The α and β components of specific leaf weight ranged from −0.01 to 0.01 and 0.01 to 0.02, respectively. The α and β components of specific leaf area ranged from −27.61 to 30.16 and 64.24 to 87.23, respectively. The α and β components of leaf dry matter content ranged from −0.24 to −0.04 and 0.38 to 0.43, respectively. In summary, the range values for the α component of the five plant traits were larger than those of the β components.

3.3. Correlation Analysis of Plant Functional Traits

The correlation matrix heatmap 4 and SPSS correlation analysis showed that leaf thickness and leaf dry matter content were significantly positively correlated (p <0.05; correlation coefficient of 0.44; Figure 4). Leaf thickness, specific leaf area, and leaf dry matter content were highly representative in correlation analysis.

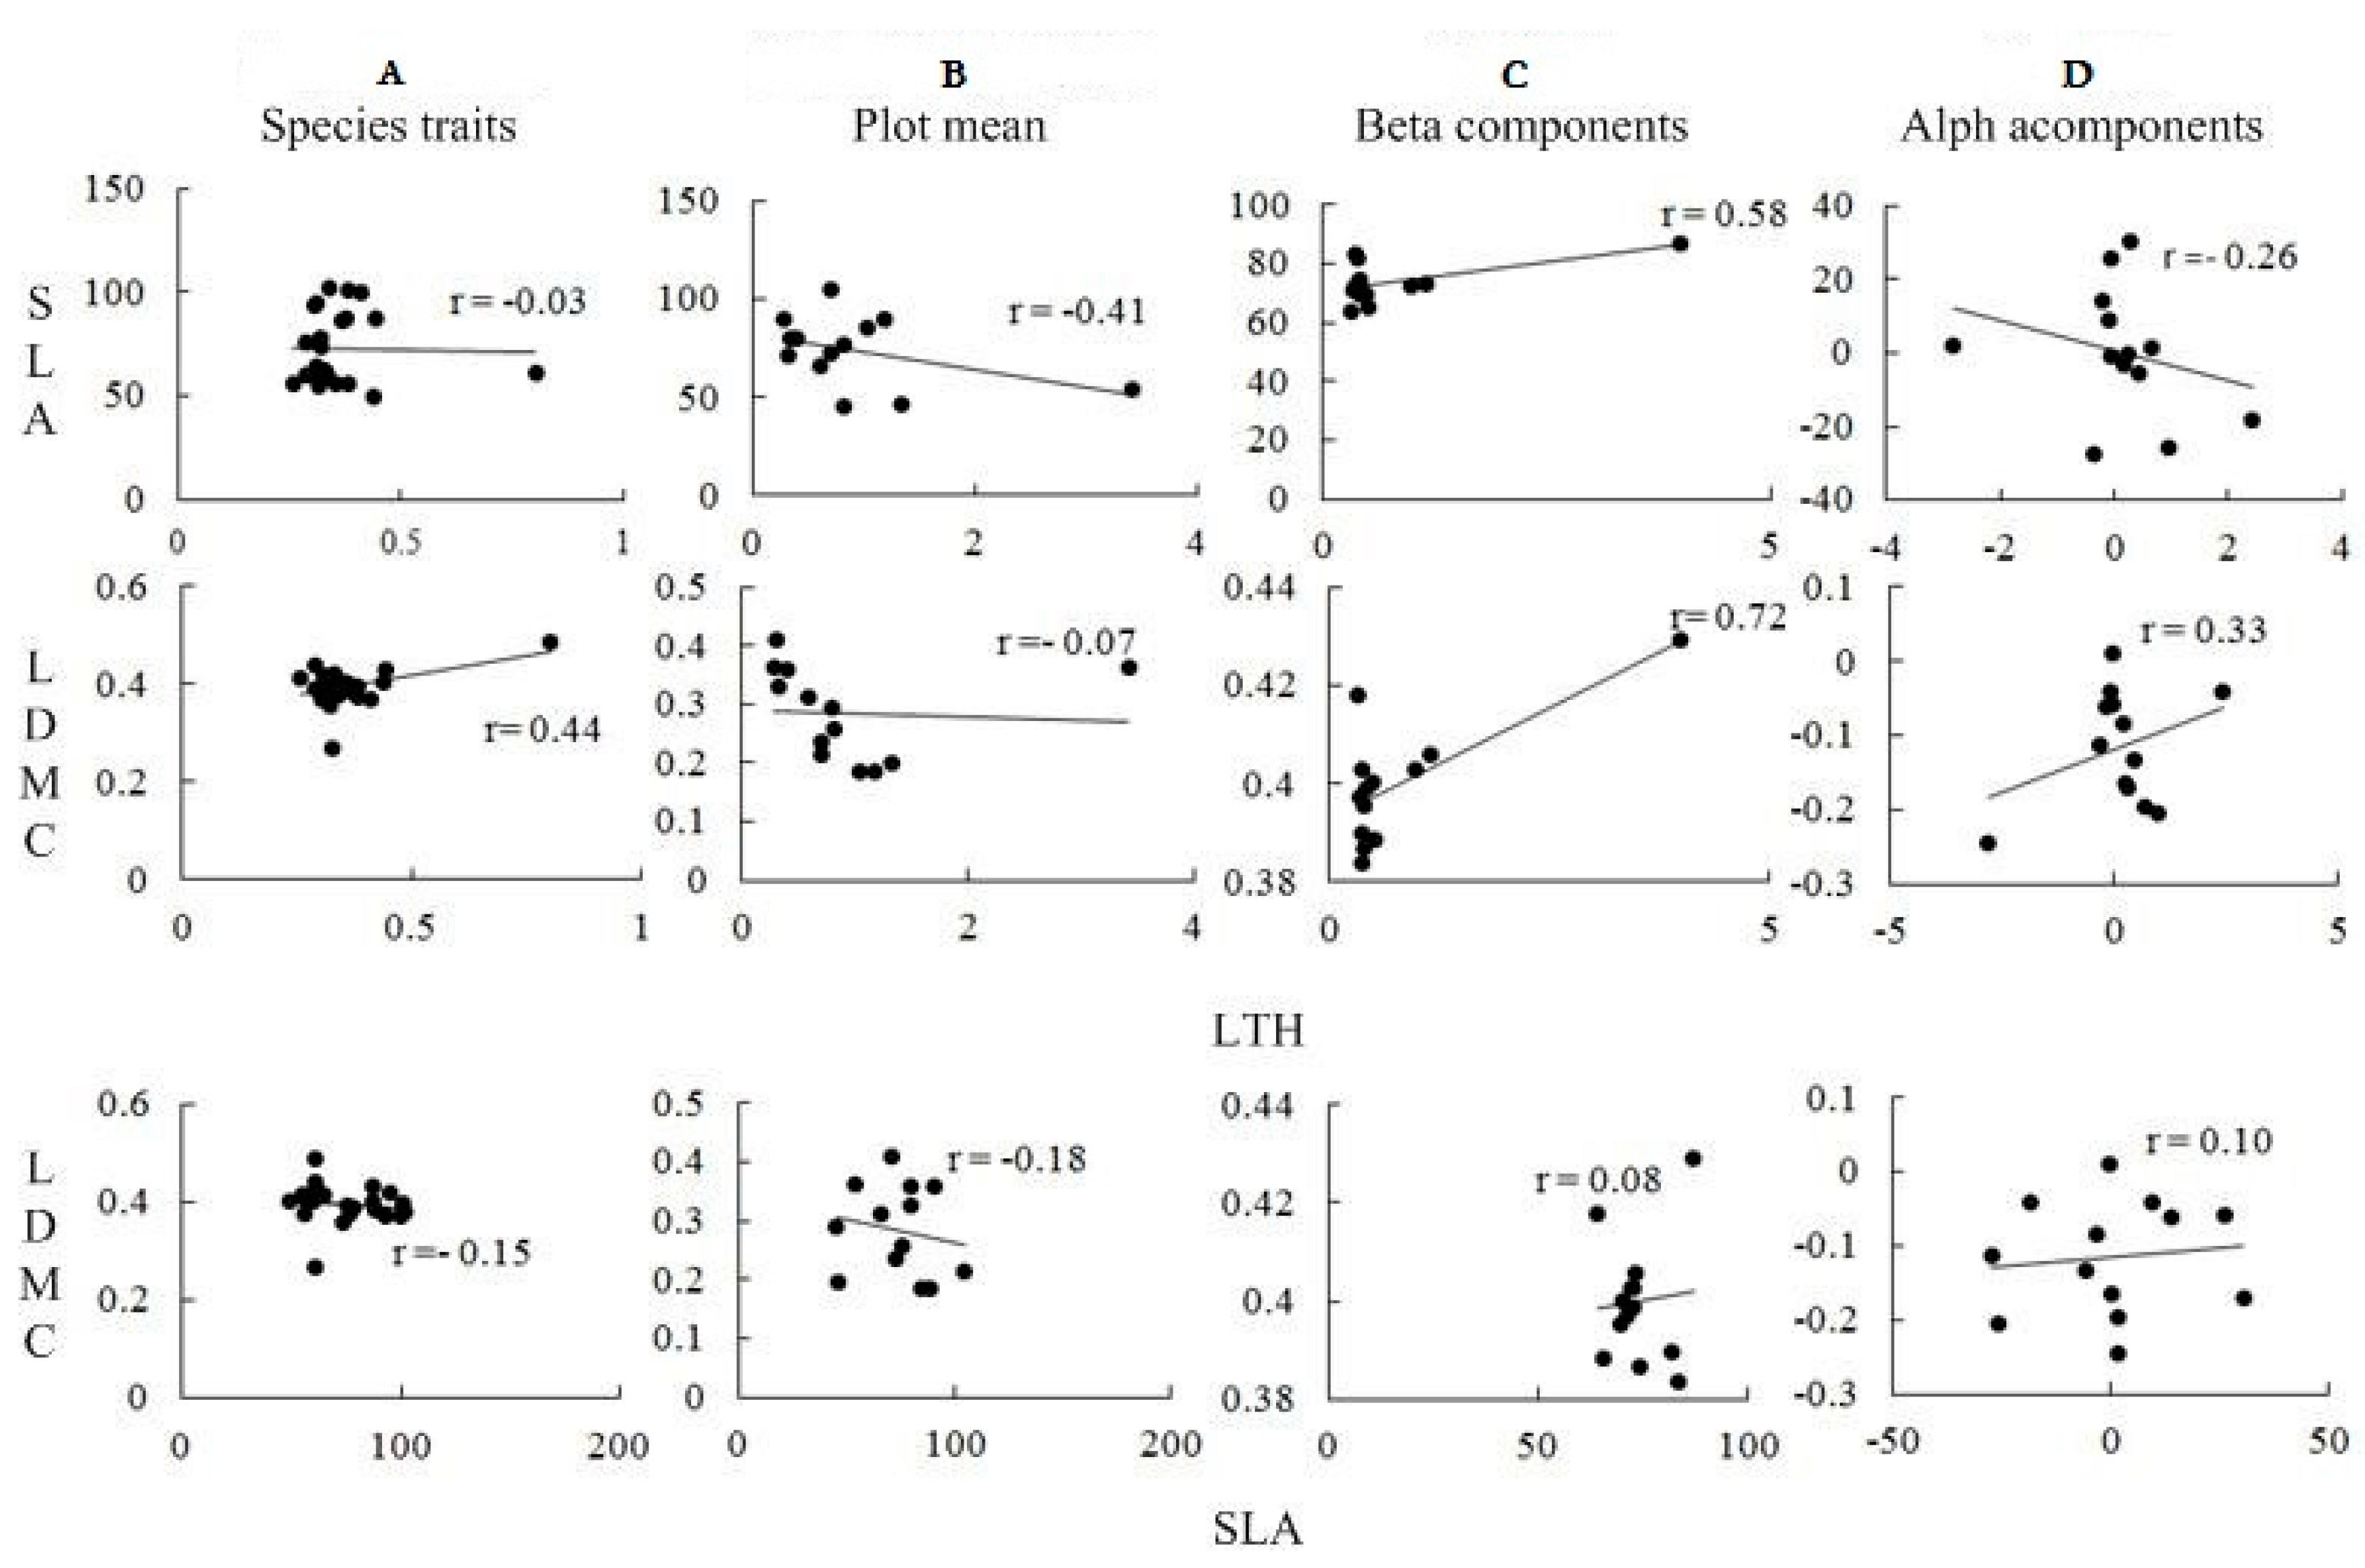
3.4. Sample Average Trait Value/Species Functional Traits and Correlations between α and β Components

The correlations of the three representative functional traits are shown in Figure 5. At the species level, no significant correlation was observed between leaf thickness, specific leaf area, and leaf dry matter content (p > 0.05). A close relationship was found between the β components (r > 0.55), among which the β components of leaf thickness, specific leaf area, and leaf dry matter content were extremely significantly positively correlated (p <0.01; r = 0.58, 0.72). No significant correlation was observed between three functional traits on the α component (p > 0.05). At the community scale, no significant correlation was found between specific leaf area, leaf thickness, and leaf dry matter content (p > 0.05). A significant positive correlation was observed between leaf thickness and leaf dry matter content, r = 0.44 (p < 0.05).

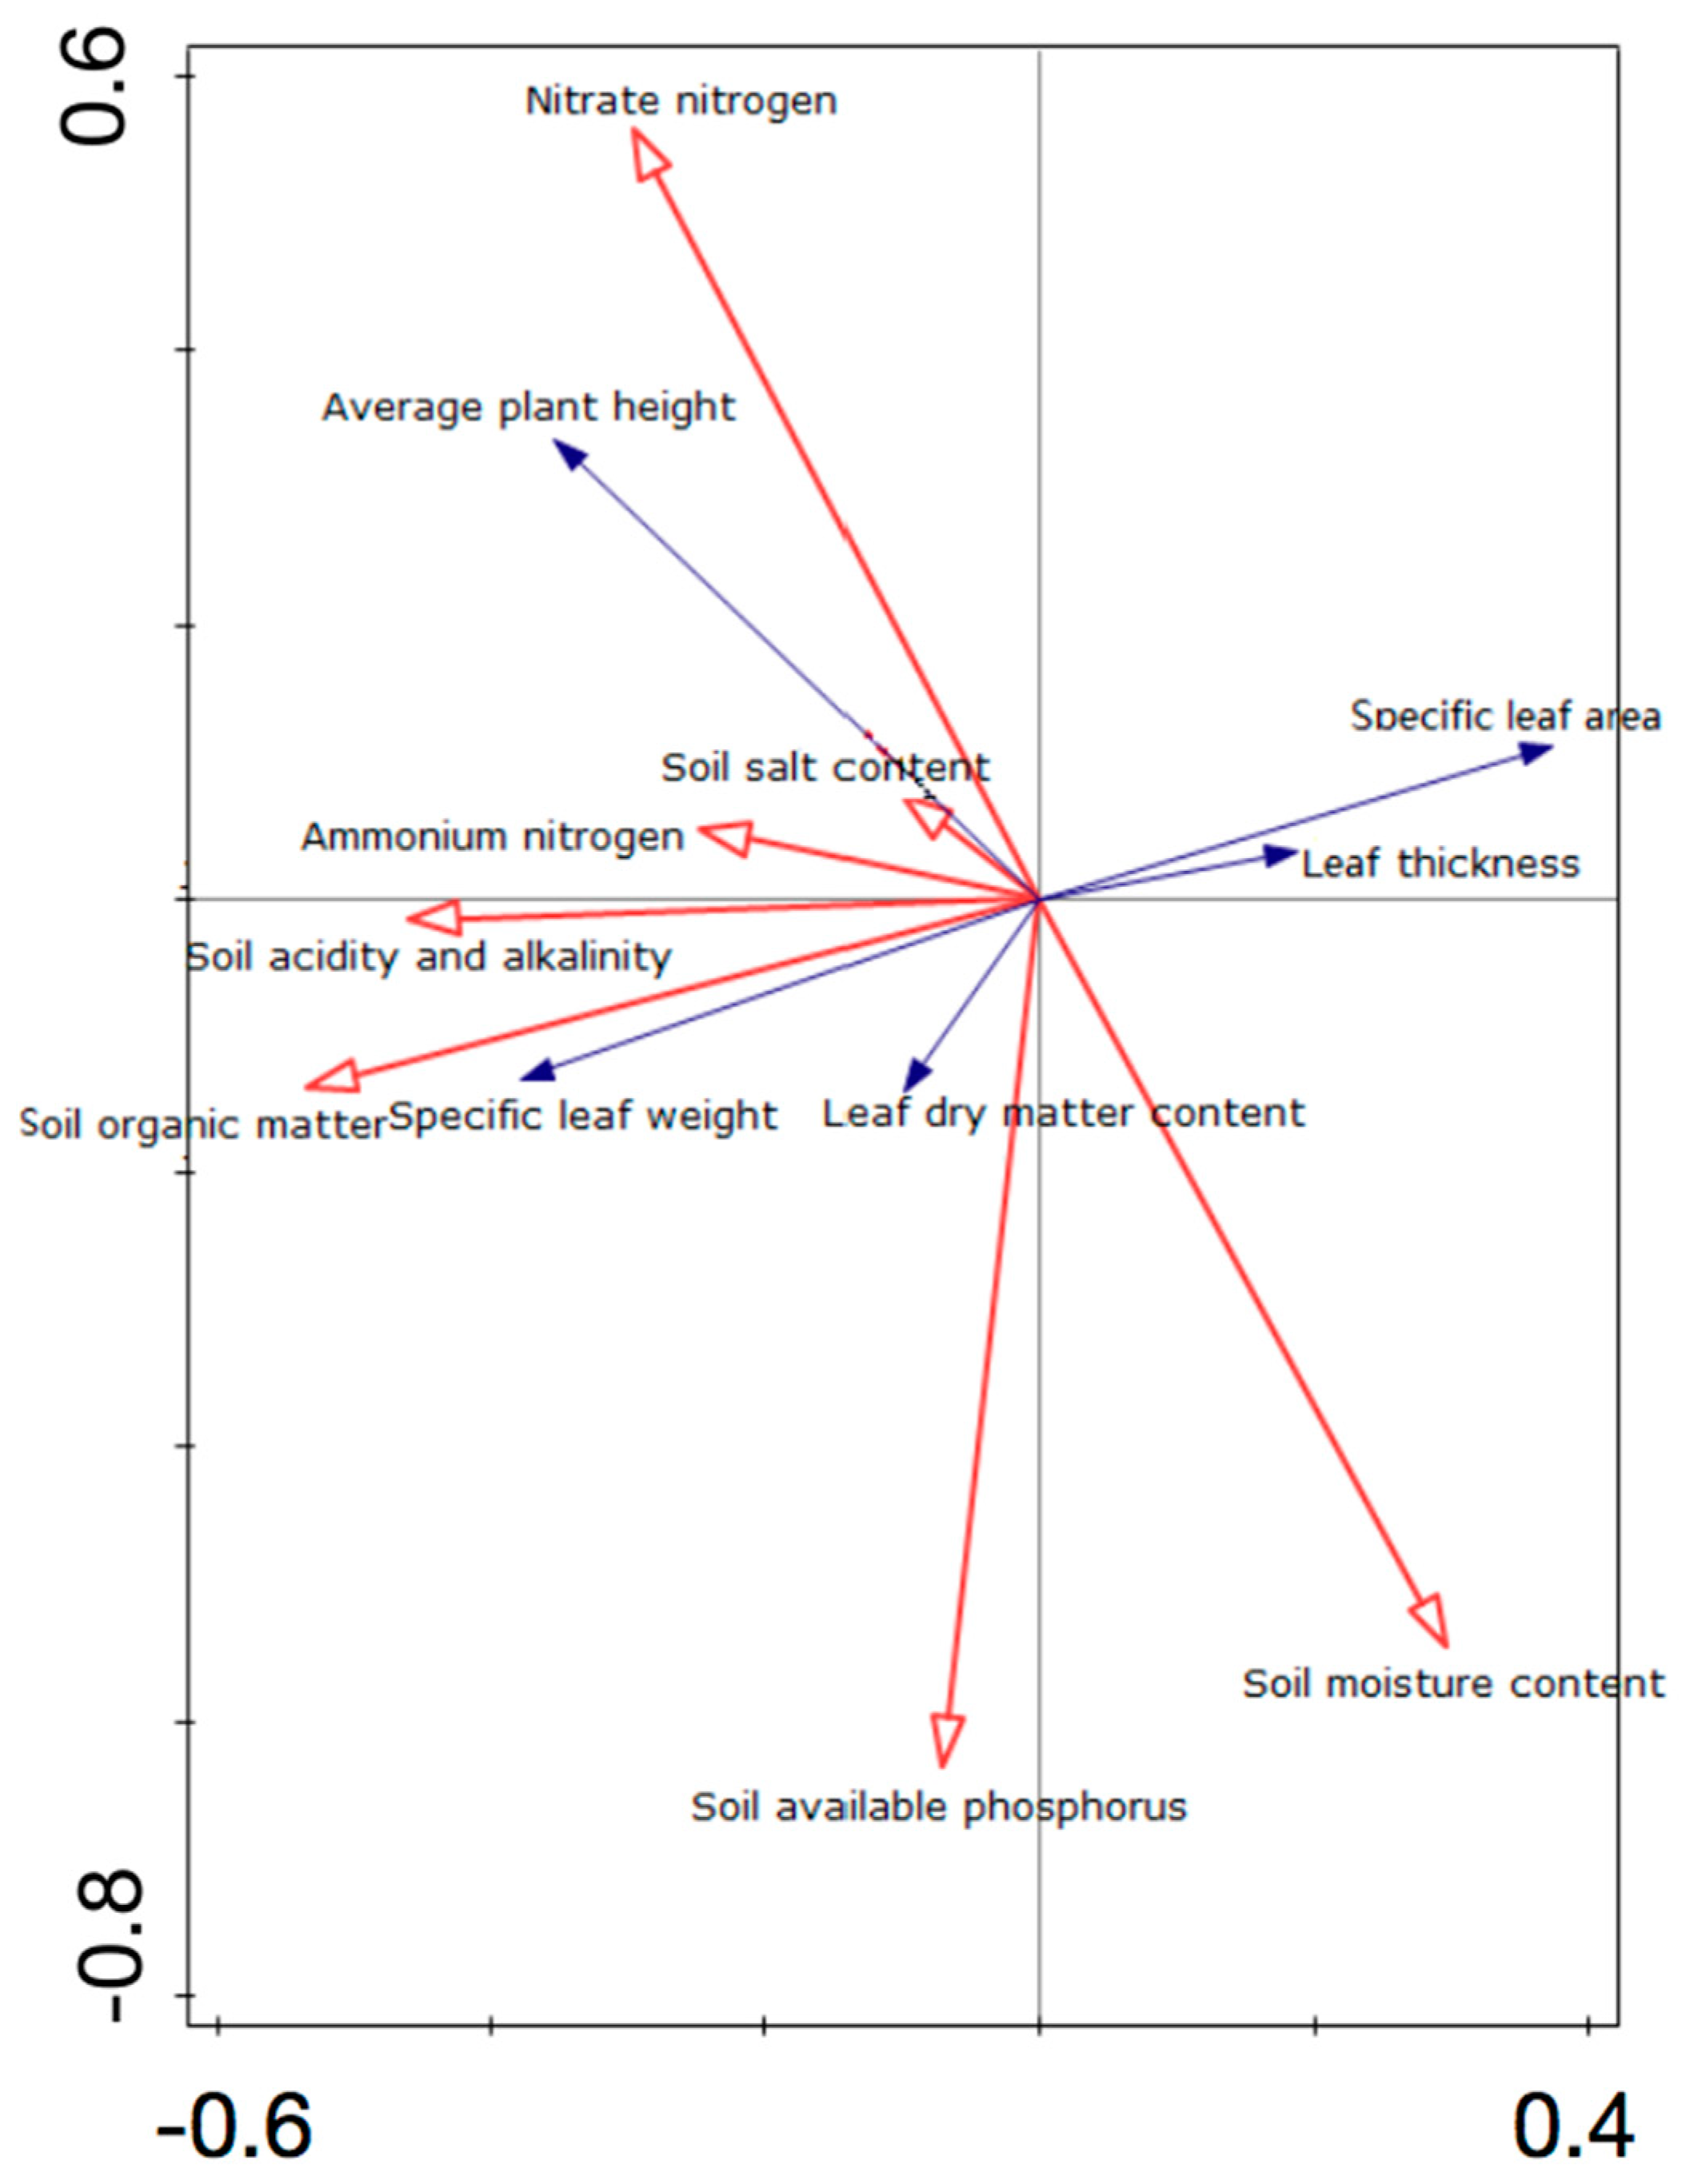
3.5. Redundancy Analysis (RDA) Ordination of Different Plant Functional Traits and Environmental Factors

The RDA ranking results of different plant functional traits and environmental factors show that specific leaf weight, leaf dry matter, leaf thickness, and specific leaf area content are mainly related to the first ranking axis of the RDA; leaf weight, specific leaf area, specific leaf weight, and leaf dry matter content were in the relative position of the first axis (Figure 6). Soil organic matter had a significant positive correlation with specific leaf weight, while soil organic matter had little effect on leaf area and leaf thickness. Both nitrate nitrogen and ammonium nitrogen were significantly positively correlated with the average plant height, although plant height was more closely related to nitrate nitrogen than to ammonium nitrogen.

4. Discussion

In this study, the analysis of the α and β components revealed that the range of values for the α component of the five traits of leaf thickness, average plant height, specific leaf weight, specific leaf area, and leaf dry matter content were all greater than the β component. The α component of plant functional traits is the difference between the average character value of a species and the average character value of a community, which represents the biological competition in the process of community development [41]. The β component is the position on a character formed by the average character value of a species community on the gradient, which represents the environmental screening effect in community development [42] The range of component values implies that the dispersion of the values of the α component was greater than that of the β component. This indicates that the change of functional trait values of a species relative to commensal species in the community of the Lake Aibi Wetland Nature Reserve is greater than that along the gradient of the average trait value of the community. That is, the differences in the five traits listed above within the community were greater than those between the communities. This also shows that, under certain conditions, the interaction between organisms is greater than the impact of environmental screening during the development of the desert nature reserve in the Aibi Lake Basin. This occurs because different species in the community have evolved different combinations of functional traits they use to adapt to the same community environment to reduce competition under the effects of similar restrictions. However, in most previous studies, the study of variation in plant traits has mainly focused on the interspecific level, while intraspecific variability has been neglected for a long time. Intraspecific variation reflects the changes of species composition and functional traits caused by environmental differences, which is often underestimated. The overlapping extent of niche and functional trait values between species is seriously underestimated, which underestimates the relative role of species in competition. In contrast, considering intraspecific variation can reflect the phenotypic plasticity of a species caused by factors such as variation in individual genotype and in habitat heterogeneity, which can help researchers to understand the specific ecological process of plant community development and its rules of change more deeply [43].
In the present study, the ratio of the five functional traits was calculated within the species and the average community trait development gradient to reflect the changes in the functional traits within the species, that is, the bi value. The bi is a positive value, indicating that the intraspecific trait changes can reflect the changes of species in the Aibi Lake Wetland Nature Reserve; when bi < 1, this indicates that the intraspecific trait changes are less than the trait changes caused by species replacement between communities. In this study, the average bi values of leaf thickness, average plant height, specific leaf weight, specific leaf area, and leaf dry matter content in the sample plot were 0.16, −0.17, 0.11, 0.10, and 0.16. The values of specific leaf area and leaf dry matter content were in the range (0,1), and the bi value of the average plant height was not in that range, indicating that leaf thickness, specific leaf weight, specific leaf area, and leaf dry matter content of the species within the community in the Aibi Lake Natural Wetland Reserve changed within species. The change of average plant height within species was less than that at community level. This is basically consistent with the study of plant functional traits in the Loess Hilly Region by Dingman et al. [21,44].
In the long history of evolution and development of plants, the combined effects and influence of physical and physiological factors have caused functional traits to often exhibit a certain covariation and trade-off relationship, resulting in different relationships between different functional traits [44,45,46]. Scales often show different correlations. This article analyzed the relationship between trait factors at two levels, that of species and communities. Only leaf thickness and leaf dry matter content had a significant positive correlation in the β component. The correlation between the variation in α components of the other three functional traits in the community was not significant, indicating that different species within the community adopt different combinations of traits to adapt to the common community environment. The range of α values of the five functional traits of each community was greater than the range of β values, indicating that the variation of plant species trait values is more related to symbiotic plant species within the same territory, but the correlation with the variation between different communities is weak. The development of the community is affected by environmental screening and biological similarity work together. The range of the α value was greater than the range of β values, indicating that the biological effect is greater than that of the environmental screening. In terms of species trait values, no correlation was observed between species level leaf thickness and specific leaf area as well as between specific leaf area and leaf dry matter content because the α component has no correlation. There was a strong positive correlation between leaf thickness and specific leaf area and leaf dry matter content in β component, indicating that as the environmental gradient changes, the leaf thickness and leaf dry matter content of the dominant species in the community gradually increase, and the leaf thickness and leaf dry matter content among communities, the dependence between communities was greater than that of the co species within communities. In summary, the differences in trait correlations at different scales may be caused by differences in community types and species composition in the study area, resulting in correlations between plant functional traits at different scales showing different regional dependencies [47,48]. Comparing the correlations among the species average trait value, the α component, β component, and community average trait value of leaf thickness, specific leaf area, and leaf dry matter content in this study; it was found that the correlation of the β component was the strongest among the four traits. The correlations between leaf thickness and specific leaf area, between leaf thickness and leaf dry matter content, between specific leaf area and leaf dry matter content were weaker, indicating that the correlation between leaf thickness and specific leaf area was greater than that of symbionts in the community [49]. Plant functional traits show a high overall convergence adaptability to environmental screening; that is, the correlation of β components among the three traits was high. In this study, Populus euphratica and reeds form the dominant population in the special habitat of Lake Aibi Natural Wetland Reserve, which is relatively adaptable to saline–alkali land and usually has the special ability to tolerate drought. It adopts the “conservative” strategy.
The growth and variation of plants not only depend on their own genetic makeup and physiological characteristics; plants also optimize the combination and balance of various functional traits to adapt to environmental change. The response of plant functional traits to environmental factors is not completely consistent, but many functional traits have a significant correlation with environmental factors. Leaf traits change with change in the environment, reflecting a plant’s adaptive regulation mechanism to different environmental factors. Studies by Westoby and others have shown that on the global and regional scales, various plant functional traits show different correlations [43]. A significant positive correlation exists between the level of organic carbon and specific leaf weight in plants growing on desert soil in the Lake Aibi region; ammonium nitrogen and available phosphorus have a significant positive correlation with the average plant height. Nutrient contents such as organic matter as well as nitrogen and phosphorus content have a significant effect on the variation of plant functional traits in cloud forests [49].

5. Conclusions

The differences in plant functional traits between species and among individuals within species have important ecological significance for community construction [50,51]. Habitat filtering can reduce the range of eigenvalues [52], but competition can lead to niche differentiation among coexisting organisms [38,53].As the development of plant communities is not only affected by environmental factors but also affected by the result of biological interactions, studying the scale variation of plant functional traits and the correlation between traits can help researchers to better understand the role of environmental screening and biological competition in community development. The present study found that 30% of the variation in functional traits originated from individual differences within species growing in different environments and communities; the differences between and within species within different functional traits were also significantly different. This type of study provides a new way to reveal the adaptation strategies of species to habitats, species coexistence, and community development. This study used the trait gradient analysis method to study the changes of leaf thickness, average plant height, specific leaf weight, specific leaf area, and leaf dry matter content in the Aibi Lake Basin Wetland National Nature Reserve. By analyzing various parameters, the characteristics of variation in functional traits within and between communities were further mastered. The characteristics of variation in traits within and among communities were analyzed based on the trait value analysis: the range of α values of the five traits in the desert plant community of Lake Aibi was greater than the range of β values, indicating that the variation of the trait value of the species relative to the commensal species was greater than that along that with the change of the average character gradient of the community, so that the effects of the interaction of organisms are greater than the impact of environmental screening. Leaf thickness, specific leaf area, and leaf dry matter content have no correlation between the variable components α in the community, indicating that different species in the community adopt different combinations of traits to adapt to the symbiotic environment; leaf thickness and leaf dry matter content β had a strong positive correlation of the components, and the dependence of the two traits in the community was stronger than that in the community.

Author Contributions

Conceptualization, G.L. and H.L.; formal analysis, H.L., J.W. and L.J.; investigation, H.L. and J.W.; writing—original draft, H.L.; writing—review and editing, G.L., J.W. and L.J. All authors have read and agreed to the published version of the manuscript.

Funding

This research was funded by the National Natural Science Foundation of China (no. 31560131) and construction mechanism of desert plant community in Xinjiang (no. xjedu2020i002).

Institutional Review Board Statement

Not applicable.

Informed Consent Statement

Not applicable.

Data Availability Statement

The data presented in this study are available on request from the corresponding author. The data are not publicly available due to privacy restrictions related to the firms included in the study.

Acknowledgments

The authors thank LetPub for their assistance with English language and grammatical editing.

Conflicts of Interest

The authors declare no conflict of interest.

References

  1. Ficken, C.D.; Rooney, R.C. Linking plant conservatism scores to plant functional traits. Ecol. Indic. 2020, 115, 106376. [Google Scholar] [CrossRef]
  2. Suding, K.N.; Lavorel, S.; Chapin, F.S.; Cornelissen, J.H.C.; Díaz, S.; Garnier, E.; Goldberg, D.; Hooper, D.U.; Jackson, S.T.; Navas, M.-L. Scaling environmental change through the community-level: A trait-based response-and-effect framework for plants. Glob. Chang. Biol. 2008, 14, 1125–1140. [Google Scholar] [CrossRef] [Green Version]
  3. Ramírez-Valiente, J.A.; Ros, F.V.; Aranda, I. Exploring the impact of neutral evolution on intrapopulation genetic differentiation in functional traits in a long-lived plant. Tree Genet. Genomes 2014, 10, 1181–1190. [Google Scholar] [CrossRef]
  4. Marcisz, K.; Colombaroli, D.; Jassey, V.E.J.; Tinner, W.; Kołaczek, P.; Gałka, M.; Karpińska-Kołaczek, M.; Słowiński, M.; Lamentowicz, M. Can we predict the response of ecosystems to environmental change based on the traits of species in a long-time scales? A high-resolution palaeoecological study from two Sphagnum-dominated peatlands from Poland. In Proceedings of the International Symposium on Testate Amoebae, Ilhabela, Brazil, 12–14 September 2016. [Google Scholar]
  5. Schick, A.; Porembski, S.; Hobson, P.R.; Ibisch, P.L. Classification of key ecological attributes and stresses of biodiversity for ecosystem-based conservation assessments and management. Ecol. Complex. 2019, 38, 98–111. [Google Scholar] [CrossRef]
  6. Zhang, L.; Wen, Z.M.; Miao, L.P. Source of variation of plant functional traits in the Yanhe river watershed:the influence of environment and phylogenetic background. Acta Ecol. Sin. 2013, 33, 6543–6552. [Google Scholar] [CrossRef]
  7. Xi, X.Q.; Zhao, Y.J.; Liu, Y.G.; Wang, X.; Gao, X.M. Variation and correlation of plant functional traits in karst area of central Guizhou Province, China. Chin. J. Plant Ecol. 2011, 35, 1000–1008. [Google Scholar] [CrossRef]
  8. Westoby, M.; Wright, I.J. Land-plant ecology on the basis of functional traits. Trends Ecol. Evol. 2006, 21, 261–268. [Google Scholar] [CrossRef] [PubMed]
  9. McGill, B.J.; Enquist, B.J.; Weiher, E.; Westoby, M. Rebuilding community ecology from functional traits. Trends Ecol. Evol. 2006, 21, 178–185. [Google Scholar] [CrossRef]
  10. Ding, M.; Wen, Z.; Zheng, Y. Scale change and dependence of plant functional traits in hilly areas of the loess region, Shaanxi Province, China. Acta Ecol. Sin. 2014, 34, 2308–2315. [Google Scholar]
  11. Liu, R.; Liang, S.; Huang, D.; Huang, C.; Jiang, Y. Variation in functional traits of woody species across scales in a riparian zone of Lijiang River, Southwest China. Acta Ecol. Sin. 2019, 39, 8038–8047. [Google Scholar]
  12. Albert, C.H.; Thuiller, W.; Yoccoz, N.G.; Soudant, A.; Boucher, F.; Saccone, P.; Lavorel, S. Intraspecific functional variability: Extent, structure and sources of variation. J. Ecol. 2010, 98, 604–613. [Google Scholar] [CrossRef]
  13. Ferrarini, A.; Dai, J.; Bai, Y.; Alatalo, J.M. Redefining the climate niche of plant species: A novel approach for realistic predictions of species distribution under climate change. Sci. Total Environ. 2019, 671, 1086–1093. [Google Scholar] [CrossRef]
  14. Laforest-Lapointe, I.; Martinez-Vilalta, J.; Retana, J. Intraspecific variability in functional traits matters: Case study of Scots pine. Oecologia 2014, 175, 1337–1348. [Google Scholar] [CrossRef] [PubMed] [Green Version]
  15. Díaz, S.; Hodgson, J.G.; Thompson, K.; Cabido, M.; Zak, M.R. The plant traits that drive ecosystems: Evidence from three continents. J. Veg. Sci. 2004, 15, 295–304. [Google Scholar] [CrossRef]
  16. Gross, N.; Börger, L.; Soriano-Morales, S.I.; Le Bagousse-Pinguet, Y.; Quero, J.L.; García-Gómez, M.; Valencia-Gómez, E.; Maestre, F.T. Uncovering multiscale effects of aridity and biotic interactions on the functional structure of Mediterranean shrublands. J. Ecol. 2013, 101, 637–649. [Google Scholar] [CrossRef]
  17. Lippman, Z.B.; Semel, Y.; Zamir, D. An integrated view of quantitative trait variation using tomato interspecific introgression lines. Curr. Opin. Genet. Dev. 2007, 17, 545–552. [Google Scholar] [CrossRef]
  18. Tang, Q. Variation of Plant Functional Traits in Subtropical Evergreen Deciduous Broad-Leaved Mixed Forest; China Academy of Forestry Sciences: Beijing, China, 2016. [Google Scholar]
  19. Niu, K.; Liu, Y.; Shen, Z.; He, F.; Fang, J. Community assembly: The relative importance of neutral theory and niche theory. Biology 2009, 17, 579. [Google Scholar]
  20. Escudero, A.; Valladares, F. Rait-based plant ecology: Moving towards a unifying species coexistence theory. Oecologia 2016, 180, 919–922. [Google Scholar] [CrossRef]
  21. Ding, M. Component Decomposition and Scale Variation of Plant Functional Traits in Loess Hilly Region; Northwest A & F University: Yang Ling, China, 2014. [Google Scholar]
  22. Yan, Y.; Zhang, Q.; Buyantuev, A.; Liu, Q.; Niu, J. Plant functional β diversity is an important mediator of effects of aridity on soil multifunctionality. Sci. Total. Environ. 2020, 726, 138529. [Google Scholar] [CrossRef]
  23. Hill, M.J.; Heino, J.; White, J.C.; Ryves, D.B.; Wood, P.J. Environmental factors are primary determinants of different facets of pond macroinvertebrate alpha and beta diversity in a human-modified landscape. Biol. Conserv. 2019, 237, 348–357. [Google Scholar] [CrossRef]
  24. Qie, Y.; Jiang, L.; LV, G.; Yang, X.; Teng, D.; Wang, H. Response of leaf functional traits of temperate desert plants to soil water and salt. Acta Ecol. Sin. 2018, 27, 2000–2010. [Google Scholar]
  25. M’hammed, B.; Souad, N.; Haroun, C. Vegetation traits are accurate indicators of how do plants beat the heat in drylands: Diversity and functional traits of vegetation associated with water towers in the Sahara Desert. Ecol. Indicators 2020, 114, 106364. [Google Scholar]
  26. Ulrich, W.; Zaplata, M.K.; Winter, S.; Fischer, A. Spatial distribution of functional traits indicates small scale habitat filtering during early plant succession. Perspect. Plant Ecol. Evol. Syst. 2017, 28, 58–66. [Google Scholar] [CrossRef]
  27. Wang, J.; Wang, Y.; He, N.; Ye, Z.; Chen, C.; Zang, R.; Feng, Y.; Lu, Q.; Li, J. Plant functional traits regulate soil bacterial diversity across temperate deserts. Sci. Total Environ. 2020, 715, 136976. [Google Scholar] [CrossRef]
  28. Hou, J.; Zhu, H.; Fu, B.; Lu, Y.; Zhou, J. Functional traits explain seasonal variation effects of plant communities on soil erosion in semiarid grasslands in the Loess Plateau of China. Catena 2020, 194, 104743. [Google Scholar] [CrossRef]
  29. Yang, L.; Wei, W.; Chen, L.; Mo, B. Response of deep soil moisture to land use and afforestation in the semi-arid Loess Plateau, China. J. Hydrol. 2012, 475, 111–122. [Google Scholar] [CrossRef]
  30. Gong, X.; Lv, G. Diversity of desert plant communities and niche of dominant species in dugaylin desert of Ebinur Lake Basin. Biodiversity 2017, 25, 34–45. [Google Scholar]
  31. He, X.; Qin, L.; Lv, G.; Yang, J.; Gong, Y.; Yang, X. Surface energy budget characteristics of wetland in arid desert area of Ebinur Lake Basin in Xinjiang. J. Ecol. 2017, 36, 309–317. [Google Scholar]
  32. Zhang, X.; Li, Y.; He, X.; Lv, G. Effects of water and salt changes on the relationship between functional diversity and species diversity of desert plants. J. Ecol. 2019, 38, 2354–2360. [Google Scholar]
  33. Zhang, X.; Li, Y.; He, X.; Lv, G. Response of desert plant functional traits and diversity to soil water and salt changes. Acta Zool. Sin. 2019, 39, 1541–1550. [Google Scholar]
  34. Song, L. Application of Chlorophyll Fluorescence Kinetics in Researches on Plant Stress Resistance. J. Sichuan For. Sci. Technol. 2013, 34, 69–71. [Google Scholar]
  35. Jin, T. Study on Drought Adaptability of Artificial Robinia Pseudoacacia Forest in Northern Shaanxi; Graduate School of Chinese Academy of Sciences: Beijing, China, 2011. [Google Scholar]
  36. Wilson, P.J.; Thompson, K.; Hodgson, J.G. Specific leaf area and leaf dry matter content as alternative predictors of plant strategies. New Phytol. 2010, 143, 155–162. [Google Scholar] [CrossRef]
  37. Britz, S.J.; Adamse, P. Uv-B-induced increase in specific leaf weight of cucumber as a consequence of increased starch content. Photochem. Photobiol. 2010, 60, 116–119. [Google Scholar] [CrossRef]
  38. Cornwell, W.K.; Ackerly, D.D. Community assembly and shifts in plant trait distributions across an environmental gradient in coastal California. Ecol. Monogr. 2009, 79, 109–126. [Google Scholar] [CrossRef] [Green Version]
  39. Ackerly, D.D.; Cornwell, W.K. A trait-based approach to community assembly: Partitioning of species trait values into within- and among-community components. Ecol. Lett. 2010, 10, 135–145. [Google Scholar] [CrossRef] [PubMed]
  40. Violle, C.; Enquist, B.J.; McGill, B.J.; Jiang, L.I.N.; Albert, C.H.; Hulshof, C.; Jung, V.; Messier, J. The return of the variance: Intraspecific variability in community ecology. Trends Ecol. Evol. 2012, 27, 244–252. [Google Scholar] [CrossRef] [PubMed]
  41. Liu, R. Variation of Functional Traits of Woody Plants in the Water Land Ecotone of Lijiang River; Guangxi Normal University: Guilin, China, 2018. [Google Scholar]
  42. Gong, S.; Wen, Z.; Shi, Y. Response of plant community functional traits to environmental gradient in Yanhe River Basin. Acta Zool. Sin. 2011, 31, 6088–6097. [Google Scholar]
  43. Westoby, M.; Falster, D.S.; Moles, A.T.; Vesk, P.A.; Wright, I.J. Plant Ecological Strategies: Some Leading Dimensions of Variation Between Species. Annu. Rev. Ecol. Syst. 2002, 33, 125–159. [Google Scholar] [CrossRef] [Green Version]
  44. Marika, M.; Matty, P.; Berg, I.; Tanya, H. Highly consistent effects of plant litter identity and functional traits on decomposition across a latitudinal gradient. Ecol. Lett. 2012, 15, 1033–1041. [Google Scholar]
  45. Pan, Y.; Chen, X.; Jiang, Y.; Shi, C.; Lu, Z.; Huang, Y.; Ni, M.; Qin, C.; Liu, R. Response of leaf functional traits and soil factors to slope aspect in Karst Rocky Mountain of Guilin. Acta Zool. Sin. 2018, 38, 1581–1589. [Google Scholar]
  46. Anke, K.; Kleyer, M. A parsimonious combination of functional traits predicting plant response to disturbance and soil fertility. J. Veg. Sci. 2010, 19, 681–692. [Google Scholar]
  47. Dang, H. Study on Multi-Scale Construction Mechanism of Desert Community Based on Characters in Arid Area; Northwest University: Xi’an, China, 2018. [Google Scholar]
  48. Bestelmeyer, B.T.; Trujillo, D.A.; Tugel, A.J.; Havstad, K.M. A multi-scale classification of vegetation dynamics in arid lands: What is the right scale for models, monitoring, and restoration? J. Arid. Environ. 2006, 65, 296–318. [Google Scholar] [CrossRef]
  49. Orwin, K.H.; Buckland, S.M.; Johnson, D.; Turner, B.L.; Smart, S.; Oakley, S.; Bardgett, R.D. Linkages of plant traits to soil properties and the functioning of temperate grassland. J. Ecol. 2010, 98, 1074–1083. [Google Scholar] [CrossRef] [Green Version]
  50. Xiong, M. Association and Differentiation of Plant Functional Traits in Tropical Cloud Forest in Hainan; Hainan University: Hainan, China, 2015. [Google Scholar]
  51. Weiher, E.; Freund, D.; Bunton, T.; Stefanski, A.; Lee, T.; Bentivenga, S. Advances, challenges and a developing synthesis of ecological community assembly theory. Philos. Trans. R. Soc. B Biol. Sci. 2011, 366, 2403–2413. [Google Scholar] [CrossRef]
  52. Kraft, N.J.B.; Valencia, R.; Ackerly, D.D. Functional Traits and Niche-Based Tree Community Assembly in an Amazonian Forest. Science 2008, 322, 580–582. [Google Scholar] [CrossRef] [PubMed] [Green Version]
  53. Jung, V.; Violle, C.; Mondy, C.P.; Hoffmann, L.; Muller, S.D. Intraspecific variability and trait-based community assembly. J. Ecol. 2010, 98, 1134–1140. [Google Scholar] [CrossRef]
Figure 1. Geographical location and layout of sample plot.
Sustainability 13 04983 g001
Figure 2. The scatter diagram of the specific leaf area of species and average specific leaf (HY: Populus euphratica; LDC: Halimodendron halodendron; LW: Phragmites communis).
Sustainability 13 04983 g002
Figure 3. The differences in the plant functional characteristics of different species.
Sustainability 13 04983 g003
Figure 4. Correlation analysis of plant functional characteristics. Note: LTH—Leaf thickness; AH—Average plant height; LMA—Specific leaf weight; SLA; LDMC.
Sustainability 13 04983 g004
Figure 5. The mean values of traits/functional traits of species and correlations of α and β components. Note: LTH: Leaf thickness; LMA: Specific leaf weight; SLA: leaf area; LDMC: leaf dry matter content.
Sustainability 13 04983 g005
Figure 6. The redundancy analysis ranking of different plant functional characteristics and environmental factors. Note: LDMC, leaf and dry matter content; SLA, specific leaf area.
Sustainability 13 04983 g006
Table 1. The indices, definitions, and ecological significance of the measured plant functional characteristics.
IndexDefinitionEcological Significance
Plant height (H)
Leaf thickness (LTH)
Refers to the distance from the root neck to the top of the main stem.
Thickness of plant leaves in the direction perpendicular to the main nerve surface.
Reflects the plant’s ability to compete for light [34].
Reflects plant resource acquisition and water conservation [35].
Leaf area (SLA) The ratio of a leaf’s one-sided area to its dry weight. Within the same individual or community, generally plants growing in weaker light have a larger leaf area; the SLA can be used as an index of leaf shading.Reflects the plant’s ability to obtain resources, and the plant growth and photosynthetic rates [36].
Specific leaf weight (LMA) Refers to the leaf weight (dry or fresh weight) per SLA, but is usually expressed as dry weight.Closely related to plant growth and resistance to stress [37].
Leaf dry matter content (LDMC) Dry leaf weight/saturated fresh leaf weight, or the ratio of dry matter to fresh leaf weight.Reflects the plant’s ability to obtain resources and resist physical damage [36].
Table 2. The changing characteristics of plant functional parameters.
ParameterCharacteristics
Plant LEAF Thickness (mm)Average Plant Height
(cm)
Heavier than Leaf (g/cm2)Specific Leaf Area (cm2/g)Leaf Dry Matter Content (g/kg)
Species characteristic
ti, mean0.93110.970.0273.640.28
ti, min–max0.29–3.434.00–542.630.01–0.0245.45–104.570.18–0.41
β, min–max0.33–4.0175.60–102.870.01–0.0264.24–87.230.38–0.43
ai, min–max−2.83–2.4497.20–449.52−0.01–0.01−27.61–30.16−0.24–0.04
bi, mean0.16−0.170.110.10.16
bi, min–max−4.1−5.48–2.71−0.92–1.091.18–1.57−1.21–1.03
Community characteristics
pj, mean0.5195.270.0172.530.4
pj, min–max0.26–4.0172.13–126.490.01–0.0249–101.550.27–0.49
Publisher’s Note: MDPI stays neutral with regard to jurisdictional claims in published maps and institutional affiliations.

