Abstract
Nowadays, due to a large number of changes in the external environment, as well as increased competition, organizations must actively support business processes. Internal management processes must be constantly improved. To understand whether a company is developing in the right direction, it is necessary to conduct a maturity assessment. The directions of changes in enterprises should be well designed and based on analysis of the gap between the present and expected state definition. The diagnosis for the present state definition should be holistic, reliable and for the expected state-based strategy and goal recognition. Hence, the goal of the paper is to present the methodology of a company’s self-assessment and definition of an individualized improvement strategy to strengthen the company’s ability to thrive and prosper. The paper includes a presentation of the diagnosis methodology based on maturity models and the resilience concept and its validation based on experts’ opinions and a case study. Companies need a diagnosis to know where they are, and guidance to move in the right direction, which makes the results of the research utilitarian. The methodology can be used for self-assessment, benchmarking and designing an improvement strategy.
1. Introduction
Contemporary companies face numerous challenges and, disregarding the triviality of the sentence, it is very true, and important for organizations all over the world. They either survive or fail to strive with the dynamics of the contemporary market and its uncertainty. Changes in the business, legal and political environment result in tasks and requirements that companies have never had to deal with. To manage the constantly increasing dynamics and hostility of the environment, companies need to change as well and, at the same time, maintain the sustainability of their products, processes, organization and strategy.
To strive and improve, companies need a diagnosis to know where they are, and guidance to move in the right direction.
Hence, the goal of the paper is to present an original methodology of a company’s self-assessment based on maturity models and the resilience concept, and the definition of an individualized sustainable improvement strategy to strengthen the company’s ability to thrive and prosper. It will allow each organizational unit striving to improve and to recognize its position on the market, as well as identify areas that require improvement in the context of constantly growing market requirements. The improvement results in increased agility, maturity and, finally, resilience of the company.
Agility was first defined in 1991 [1] and since then its definitions has referred to the ability to meet changing requirements of individual customers [1], using opportunities as drivers for innovation and increased competitiveness thanks to the fast and unique allocation of resources [2], ability to respond to changes [3,4,5,6,7], acting in critical situations [7], reacting to business challenges [8], surviving [9,10], exploiting opportunities and avoiding threats [11] and implementing changes [12,13,14].
Resilience, on the other hand, is defined as the ability to anticipate, prepare, react and adapt to incremental changes and unexpected disruptions to survive and develop further [15]. Resilience is a characteristic of an organization enabling its survival and sustainable development, which is built, on the one hand, by the non-susceptibility of the organization to the impact of crisis-generating factors, enabling the avoidance of problems and difficulties, and, on the other hand, the ability to resist the impact of these factors (i.e., the organization’s ability to react) and their occurrence, regardless of where they are located (external, internal), i.e., the organization’s ability to maintain its integrity (survive) and act correctly (satisfactorily) during the impact of crisis-generating factors, or the state of the organization conditioned by the overall management processes to restore the integrity of its internal environment (i.e., ensuring its durability and sustainable development), damaged by factors of a crisis-producing nature [16]. A resilient organization is therefore one that demonstrates “long-term development capacity and good economic condition, which is maintained despite changes in external conditions” [17].
Thus, the definitions of agility and resilience are similar, stressing the company’s ability to deal with a changing business environment.
Though the term maturity is more general and universal, it is also associated with adjustment, improvement and the ability to survive. Maturity is a positive social value [18]. Maturity includes phenomena that may undergo change or development, and the process of reaching maturity is related to the improvement of skills and the achievement of certain characteristics, and it also means being ready for specific tasks [19]. The process of reaching maturity is related to the passage of time. However, time is not the only determinant. A specific set of conditions is also required, thanks to which reaching maturity is possible, and to recognize these conditions, theoretical and applied research has been conducted in various areas of an organization’s activity [20].
Since maturity is usually defined in terms of the theory of development [21], its variability and evolutionary nature are indicated. Maturity is achieved gradually. Therefore, one can speak of a gradation of maturity and, consequently, levels of maturity, which are understood as the degree of development of an object towards its excellence [22]. In the changing business environment, maturity may refer to both agility and resilience. We decided, based on literature analysis and interpretation, that resilience is the highest level of agility, not only referring to the ability to adapt to changes but also the ability to survive them. A more detailed explanation is offered in the following sections.
The approach implemented in the paper is based on the well-recognized ideas of organizational agility and resilience as opposites to fragility and the inability to survive. It includes developing the maturity model in which the highest level of maturity is resilience, and the methodology to assess the level of maturity represented by a company. It benefits from the adaptation of the existing maturity model and implementation of the fuzzy index to maturity level assessment. The assessment result is not the only diagnosis of maturity level but also an input to the definition of an individualized sustainable improvement strategy. The methodology is introduced and validated (in the Materials and Methods section), moreover, an example of its implementation is presented in the following sections of the paper (namely, the example of maturity level calculation), followed by a discussion of the results and conclusion.
2. Theoretical Background
The maturity models are designed to present gradual improvement in different areas (e.g., organization: organizational maturity models, process: process maturity model). The first maturity model that refers to the management area was the one by Philip B. Crosby in 1979 [20]. It implemented a quality-based approach and, since that time, numerous maturity models have been developed and published. The number of publications on maturity models in the Scopus database (on 25 March 2021) was 27,360 which proves the importance of maturity assessment and interpretation. Figure 1 shows the dynamics of the growth of the number of publications on maturity models.
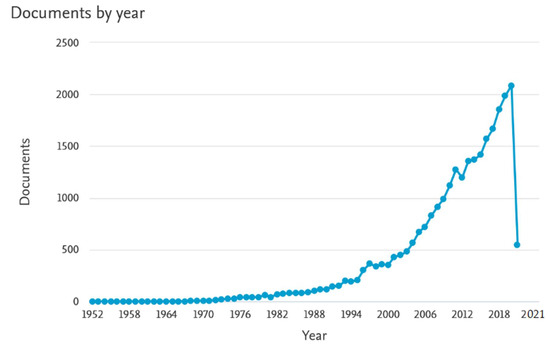
Figure 1.
The number of publications on maturity models in the Scopus database.
The number is growing systematically, contributing to the development of knowledge on maturity in many fields. The existing maturity models are often compared and contrasted to show their specificity the range [23,24]. Maturity models are widely used in industry to assess the ability of an organization or its selected processes or systems to undertake change and improvement [25,26,27]. As presented in Figure 2, maturity is a universal term and maturity models are developed for and implemented in various disciplines.
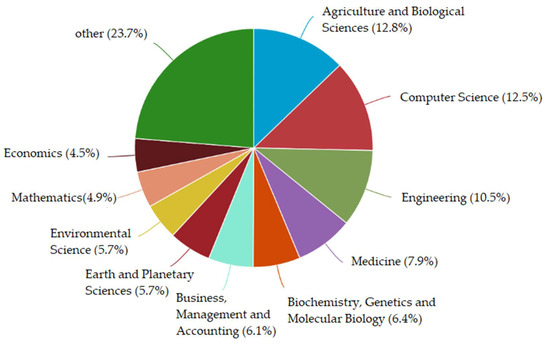
Figure 2.
Documents on maturity models by area (Scopus database).
Publications on maturity models in business and management are only 6.1% of the total number of documents on maturity models, even though business process maturity models (BPMMs) are increasingly important to help organizations obtain mature (or excellent) business processes [28]. This area is of great potential as companies want and need to improve their performance. There are many maturity models in the literature on the subject, which differ in measurement criteria, the number of maturity levels, methodology, etc. [29,30,31,32,33]. However, there are two common approaches for maturity assessment. The first one, referred to as the top-to-bottom approach, is based on a fixed number of maturity levels (differing from four to seven), which are defined and characterized. A company is assessed by a comparison of its individual features with those presented in the model. Examples of such an approach are maturity models by Becker et al. [28], Gajsek et al. [34] and Stachowiak et al. [35]. Another approach, referred to as the bottom-to-top approach, is based on assessing pre-specified characteristics and clustering the results. The approach presented by, e.g., Lahrmann et al. [36], is more flexible and customized.
Disregarding the approach, maturity assessment is usually descriptive and qualitative [37], but it requires setting the scale. The scale can be based on points and scores, and the distribution of procedures based on discrete assessment is presented in Figure 3.
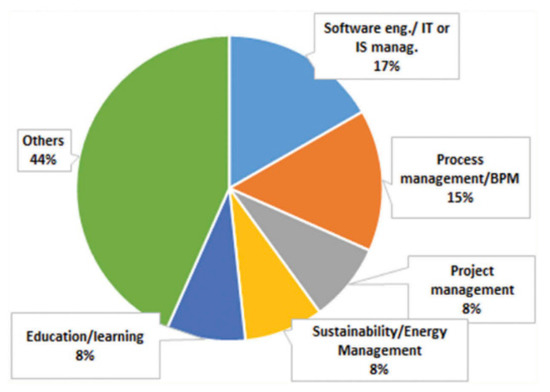
Figure 3.
Areas of implementation of maturity assessment procedures based on discrete values. Source: [38].
Another option is implementing fuzzy numbers that reflect qualitative assessment in a more natural, closer to natural language, way. The distribution of procedures based on fuzzy numbers theory in various areas is presented in Figure 4.
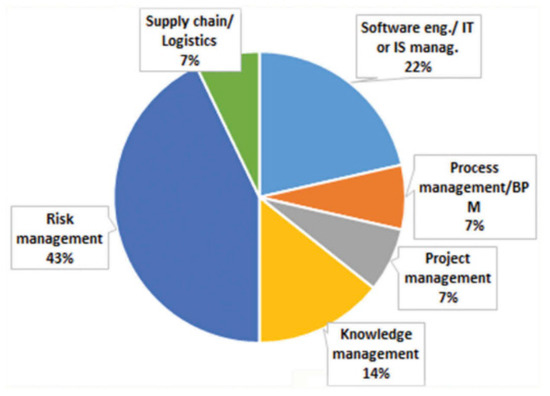
Figure 4.
Areas of implementation of maturity assessment procedures based on fuzzy numbers. Source: [38].
Fuzzy numbers are less often implemented in the business process management area (7% compared to 15%). We decided to use this approach in the methodology we developed to explore its advantages: opportunity to reflect nuances of natural language and differences in understanding of managerial aspects from different perspectives.
The implemented maturity model is based on agility definition and decomposition and settled in the ISO model logic, whereas the most commonly adopted method for agility maturity assessment in practice is the Consolidated Maturity Model Integrated (CMMI) [39], which has been shown to be misaligned with agile practices, particularly at higher levels of maturity [40].
It is expected that maturity models should not only provide a diagnostic conclusion but also should at least provide a catalog of generic improvement measures as well as basic selection guidelines that can be adapted to a company’s individual needs [41], and this is why we decided to include the procedure of sustainable improvement—which offers a dedicated set of tools for improving maturity in a continuous way.
3. Materials and Methods
The methodological approach implemented in the research has two stages:
- (I)
- diagnosis of an organization’s maturity (based on experts’ opinions transformed into the calculation of aggregated maturity level and assessment of predefined aspects and components of maturity);
- (II)
- development of an individualized sustainable improvement strategy (based on calculated values, the diagnosed gap between the highest level of maturity and results obtained, and predefined set of solutions enabling improvement of aspects and components of maturity).
The first stage (I), the diagnosis, encompasses a maturity assessment with a customized maturity model. We reviewed the existing maturity models [33] to select the most suitable one, as the literature offers many approaches, including CMMI. The first version of this research model (known as the CMM model) was formulated in the 1960s and the integrated concept was developed at Carnegie Mellon University in 2002. The CMMI model enables assessing the maturity of an organization at five levels. The premise of CMMI is that an organization cannot meet the next level of requirements without meeting all requirements of the previous one. The CMMI model is considered by many researchers as an alternative to the ISO 9001 standard [42], also using a five-level scale. There are many other models, including Kerzner’s Project Management Maturity Model (PMMM), or the Process and Enterprise Maturity Model (PEMM) proposed by Hammer [41,42].
In this paper, we used the maturity model proposed in the ISO standard as the basis and customized it to reflect levels of ability to deal with a dynamic and unpredictable environment. The organizational maturity model developed includes five levels. The lowest refers to an organization that cannot recognize nor deal with changes. Such an organization can be described as a fragile one. Changes can easily destroy it. To recognize and deal with changes, the organization needs to:
- be sharp to:
- perceive threats (1);
- perceive opportunities (2);
- forecast (3);
- be intelligent to:
- accumulate knowledge (4);
- process knowledge (5);
- acquire new knowledge (6);
- be flexible in terms of:
- technical resources (7);
- human resources (8);
- financial resources (9);
- be smart to:
- avoid threats (10);
- predict (11);
- seize opportunities and change them for the benefit of the enterprise (12).
Consequently, higher levels of maturity refer to aspects of the ability to recognize and deal with changes (referred to as agility), and the highest maturity level is resilience, as presented in Table 1.

Table 1.
Maturity levels in the model of organizational maturity in the context of dealing with changes.
This model can be treated as a holistic one, and the differentiation of the various levels is based on the degree to which the enterprise exhibits features that make it able to deal with changes and survive.
To recognize the level of maturity, the twelve specific features listed previously need to be assessed. The assessment is with qualitative terms, based on the intuitive use of assessment variables, following the proposed scale:
- the highest possible level of the feature (HPL);
- high level of the feature (HL);
- medium feature level (ML);
- low level of the feature (LL);
- lack of any manifestations of the feature (0L).
The assessment is internal, conducted among managers of the company representing various departments/areas of the company’s activity. We do not define the number of respondents as it depends on the size of the company and the scope of its activities and various levels of management. The maturity assessment should reflect the level at which the company represents the predefined twelve features and enables aggregated maturity assessment.
The input from the qualitative assessment will be transformed into a quantitative assessment. To assess organizational maturity in the context of response to changes, we use the indicator based on the fuzzy agility index (FAI) [43]. The use of elements of the fuzzy set theory in management is justified by difficulties in formulating a precise assessment on a numerical scale [43,44]. For this reason, fuzzy measures are adapted to the assessment of maturity by defining the fuzzy organizational maturity index (FOMI). This indicator is based on linguistic variables and linguistic values used in managers’ assessments and are converted into triangular fuzzy numbers by the fuzzification process. The fuzzy numbers obtained in the procedure of the feature evaluation procedure are aggregated into a weighted fuzzy average using the max–min pair elimination method (1). The obtained result, in the form of a fuzzy number, is converted back into a linguistic value in the process of defuzzification (2), so that the assessment result is easy to analyze. When transforming, the Euclidean distance method is used. The defuzzified values are used to determine aggregated maturity level (3).
The fuzzy average of individual assessments of predefined aspects of maturity (i.e., FOMI of each maturity aspect) is determined with the formula:
where:
- FOMIj—fuzzy organizational maturity index of j-aspect;
- J—number of the aspect;
- Li—level of individual feature I;
- I—number of individual features (1 … n);
- N—number of features taken into consideration in the assessment.
The calculation determines the level of individual features to define the aggregated level of organizational maturity on this basis.
The procedure for eliminating the max–min pairs for the aggregated maturity level (FOMI) calculation is presented in publication [45] and includes the following steps:
Calculate the membership function with the formula:
where:
- for every i = 1,2, …, n, fLi is the membership function of the fuzzy number Li.
Limit the scope of the membership function to finite numbers f1, f2, …, fn from the interval <0;1>.
For each fj, find the appropriate range of the feature coefficients [ai, bi] and the range of their respective weights [ci, di], when i = 1 … n.
Look for the maximum value a1 such that a1 ≥ ai and the maximum value b1 such that b1 ≥ bi and the minimum value an such that ai ≥ an and the minimum value bn such that bi ≥ bn.
For the minimum value {fL}, select c1 as the weight appropriate for a1, and dn as the weight for an. For the maximum value of {fU}, choose d1 as the weight appropriate for b1, and cn as the weight for bn.
Combine a1 and an and the corresponding weights c1 and dn according to the scheme:
w’ = c1 + dn
c’ = d’ = w’
Combine b1 i bn and the corresponding weights d1 and cn according to the scheme:
w’ = d1 + cn
c’ = d’ = w’
Eliminate a1, an, c1, dn, exchanging them with a’ and w’. Eliminate b1, bn, d1, cn, by exchanging them with b’ and w’. Introduce calculated values into the model.
Repeat steps 1–4 (n − 1) times, and the final a’ and b’ will be the solutions for fj. Repeat the procedure for every j.
Considering that the assessment of individual parameters is performed by experts, it is worth introducing weighting of assessments conditioned by the competencies of experts. The assessment of these competencies depends on professional experience, knowledge of the company and experience in a managerial position. The fuzzy weighted organizational maturity index of a feature can be expressed using a formula that uses extended multiplication and subtraction operators [43,44]:
where:
- i—index of a feature, i = 1 … n;
- n—number of features;
- Li—level of the feature according to an expert j.
F’i = (1,1,1) − Fi
- Fi—feature description.
The fuzzy organizational maturity index calculated with procedure (2) is a fuzzy number, hence, the next step must be to restore its meaning by changing it to a linguistic term, i.e., natural language. There are several methods for converting fuzzy numbers to linguistic values and terms. They can be broadly classified into three techniques:
- determination of the Euclidean distance;
- progressive zoom;
- decomposition.
Regarding the presented FOMI measure, a method based on calculating the Euclidean distance between a given fuzzy number and each of the fuzzy numbers representing the range of natural language expressions is used, as it is the most intuitive and the others are difficult to implement [44].
In the method based on determining the Euclidean distance, the linguistic value is assigned the Euclidean distance between a given fuzzy number (in this case designated the fuzzy organizational maturity index) and each of the fuzzy numbers representing the range of natural language expressions.
According to the method of determining the Euclidean distance, the expression corresponding to a given fuzzy number can be found by the following procedure [44]:
- Build a scale of linguistic values for the assessed feature.
- Assign a fuzzy number to each value on the scale.
- Find a discrete set of points p at which the Euclidean distance will be measuredwhere:
- Calculate Euclidean distance with the formula:where:
- Ni—natural language expression (assessment of the feature);
- X—point at which distance is measured;
- I—number of the point;
- N—number of points;
- fFOMI(x)—value at point x, for which natural expression is identified;
- fNi(x)—distance for every x point.
Find the minimal distance.
The linguistic value which is closest to the determined index corresponds to the level of the assessed feature.
Determination of the Euclidean distance enables the interpretation of the max–min value determined in the method of elimination of pairs.
The assessments of individual features are used to determine the aggregated maturity level. Thus, aggregated maturity level calculation requires the determination of evaluation for maturity features, and then calculation, based on the identification of a number of average or higher-rated features, drawing conclusions about the overall (aggregated) assessment. Simple decision rules are used to aggregate the assessment:
- If none of the maturity features are represented at a medium level or higher, then the organization is fragile.
- If only one maturity feature is represented at a medium level or higher, then the organization is almost agile.
- If any two maturity features are represented at a medium level or higher, then the organization is fairly agile.
- If any three maturity features are represented at a medium or higher level, then the organization is agile.
- If all maturity features are represented at a medium or higher level, then the organization is resilient.
The presented procedure is based on the assumption that all maturity features are equivalent, and the level of maturity is evidenced by their joint and synergistic occurrence at least at a medium level. The very presence of a feature may be spontaneous, unintentional or accidental and unconscious—and in such a situation it is difficult to relate it to maturity. The transformation and implementation of agile behavior into company routines are expected, but they should be a systematic approach.
Maturity improvement requires implementing an individual strategy (II). The strategy is based on the implementation of solutions striving to minimize or close the gaps in maturity level recognized and represented by the company. The procedure for preliminary strategy definition is presented in Figure 5. Diagnosis of maturity is the first step to recognize the gaps, followed by the actions presented.
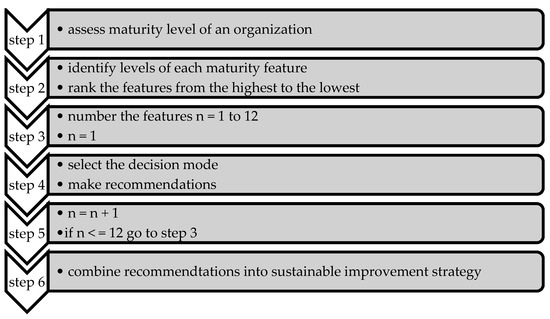
Figure 5.
Preliminary sustainable improvement strategy design.
The set of recommendations used in step 4 needs to be predefined. The literature offers a broad review of solutions for improving a company’s ability to deal with changes [45,46]. These routines refer to sustainable approach products, processes/technologies and management, hence, strategy-based sustainability is crucial for achieving agility and finally resilience. The set and scope of sustainable solutions, however, should fit the needs and capabilities of a company. This requires applying a filter system including filters for:
- presence of the solution;
- adequacy of the solution;
- availability of the solution.
The first filter eliminates solutions already in use (implemented in the enterprise). The filter is implemented by an interview with the company’s management, who has information about available resources and applied solutions.
The second filter (adequacy) allows for selecting solutions appropriate for a given sector, size and activity of the enterprise. The filter is implemented through consultations with experts regarding the fitness of appropriate solutions to the sector profile (requirements, restrictions). Thanks to its application, a set of solutions suitable for a given enterprise is defined.
The third filter (availability) allows for selecting available solutions. The availability criteria may be the cost of the solution or the availability of suppliers. The third filter requires consultation with the procurement department and the finance department as entities that have knowledge of the supplier market and access to data on available funds and possible investment opportunities. Thanks to its use, a set of solutions recommended for implementation is defined.
Finally, after carrying out the entire procedure, the company receives a set of solutions selected in such a way as to fill or minimize the identified gaps in maturity. Implementation of the received recommendation will in principle result in closing the gap, and thus increase the level of maturity—however, an immediate improvement in the company’s parameters cannot be expected. The observable effect depends on the intensity of the identified gaps and selected solutions as well as the degree and scope of their implementation.
The methodology presented in this section was validated by two groups of experts: one representing academics (an international group of experts representing the production management field: 16 respondents) and business practitioners (managers at various levels, representing companies in various industries: 16 respondents). Both groups were interviewed on the set of features used to assess maturity, ability to recognize and assess them and purposefulness of their use. The assessment was conducted with the following scale:
- the feature can be easily identified and assessed: 1.0;
- the feature is difficult to assess, but assessment is possible: 0.6;
- the feature is very difficult to assess, it is almost impossible to assess it: 0.3;
- this feature cannot be assessed: 0.0.
The opinions of experts were aggregated. The results of the validation procedure are presented in Table 2.
Table 2.
Methodology validation results.
The opinions of academics and business professionals prove that the features selected can be used for the assessment and are appropriate from a cognitive and utilitarian point of view (generally rated above 0.5 in a 0 to 1 scale). In some cases, ratings by academics were higher, in other ones by business, proving the practical dimension of the feature.
In general, the model developed could be useful for companies willing to recognize their maturity level. To validate the practical value of the approach to see whether it supports managers in defining an improvement strategy, the methodology was implemented in a selected company.
4. Example of Maturity Level Calculation
To validate the methodology’s usefulness, it was implemented in a medium-sized (according to SME classification) manufacturing company in Poland. The managers decided to assess their organization in terms of maturity and identify the solutions they could potentially implement to improve the company’s performance.
The assessment was conducted among eleven managers representing various departments (top management (2), production, planning, HR, finances, sales, purchases, warehousing, transport, marketing) to get holistic knowledge of the company. The research sample covered every manager in the company. They were selected based on their position (managers of departments identified in the structure), experience (more than 5 years in the company) and knowledge on industry and market (self-assessment: at least 4 in a 5-point scale) and asked to assess the features of their company. Their responses were collected (100% of respondents correctly gave their opinions) and processed with the procedure presented in the previous section. The results obtained are presented in Table 3.
Table 3.
Maturity assessment results.
Results of the diagnosis are presented in the table: the first column is the list of selected maturity aspects, the second column shows the calculation of the fuzzy organizational maturity index of each aspect based on an aggregation of individual opinions of respondents, the third column gives a defuzzified interpretation of calculated values, the fourth column presents results of calculation of the fuzzy weighted organizational maturity Index to include individual opinions on the importance of each factor and, finally, the fifth column displays the ranking of maturity aspects, from the strongest to the weakest one.
Aggregating the ratings at the level of elementary features made it possible to identify eight high-level and four medium-level features. The preliminary assessment of the maturity of the organization already gives grounds to define it as satisfactory, as the high-level assessment prevails. Given the diverse experience of respondents, it was interesting to include the experience of experts in the results of the evaluation. Thanks to the applied perspective, it is possible to determine which of the elementary features has the highest level according to the respondents, and the experience of the evaluators in this case influences the result of the assessment.
According to experts, taking into account their experience, the feature represented at the highest level is financial flexibility. This opinion is justified because the financial resources are flexible—they can be used in many ways. The speed of forecasting is next, while the speed of perceiving threats in the environment, the ability to acquire new knowledge and technical flexibility were rated the lowest.
5. Discussion and Conclusions
To determine the level of organizational maturity in a changing environment, further aggregation is necessary to obtain an assessment of generic features—they constitute the basis for determining the level of organizational maturity of an agile enterprise.
The next level of aggregation requires the conversion of the mean scores for each generic feature. According to the methodological assumptions, each of the generic features includes three elementary features, therefore, to obtain an average rating for each of the four generic features, it is necessary to determine the average of the ratings of their components. The calculation procedure uses the formula presented in the previous section and its results are presented in Table 4.
Table 4.
Aggregation of results.
The aggregate maturity assessment presented in the table proves that the company shows a high level in three maturity aspects of four aspects. This is a high score, indicating the company’s ability to perceive opportunities and threats, learn, flexibly adapt to changing conditions and seize opportunities. The aggregated maturity assessment resulting from the obtained ratings is high (the company is agile). Aggregating the assessments of generic features (using the computational procedures in the previous section) gives the result on the level of:
which after re-definition (using the procedure described in the previous section) can be interpreted as the highest level of agility—resilience.
FOMI: (45; 0.61; 0.78)
The maturity diagnosis shows that the enterprise represents the highest level of maturity, i.e., it is a resilient organization. Such a high level of maturity is a consequence of the actions taken, including those aimed at continuous development and improvement, but at the same time, it encourages their continuation.
A high level of maturity does not mean that there are no gaps in the maturity features. The assessment of each of the experts is decomposed into assessments of individual elementary features of maturity.
The gaps should be filled using the defined decision rules in the order resulting from the assessments of individual elementary features (Table 4, including the assessment in the form of a fuzzy and defuzzified mean and a ranking of features).
Decision rules based on the if … the … logic introduce a set of recommended solutions, which is a general maturity development strategy, ranging from the most needed (recommended for the lowest-level maturity traits) to those recommended for the relatively highest-level traits. Therefore, the recommendations are, by definition, presented from the lowest-rated to the highest-rated maturity trait. Providing the guidelines to increase maturity is (as cited in the previous section) one of the key features of high-quality maturity models. Adapting this strategy to the enterprise requires the use of filters. To select the best pathway towards agility, implementation of the set of filters is recommended. This is an original approach developed by the authors to customize recommendations based on detailed maturity diagnostic and individual characteristics of a company. The first is a filter that eliminates solutions already used. Identification of the media used requires knowledge of the company’s resources. The best source of data is the company’s employees—the information on the available media was obtained from the expert managers interviewed.
In the examined enterprise, the filter eliminated some carriers, leaving the recommended composition (Table 5).
Table 5.
Recommendation of solutions: individualized improvement strategy.
The diagnosed high level of maturity was confirmed by a large number of eliminated (and therefore already implemented) solutions. After applying the first filter, it remains to decide on the implementation of the recommended solutions. At this stage, the second filter is used, related to the adequacy of solutions (in relation to the sector represented by enterprises and the scope of its activities), and then the third one, related to the company’s capabilities (financial resources, time, opportunities). The use of such a filter requires an analysis of the current situation of the company and its confrontation with the adopted strategic assumptions. Implementation of the filters enables the selection of solutions that best fit the needs and requirements of the company, based on the prior diagnosis of maturity and resource analysis. Instead of trying out various compositions of solutions, a company gets a dedicated set of solutions.
The model developed is one of many in the organizational maturity area, yet it relates to the aspect of agility and helps to identify the company’s resilience to disturbances of various kinds. Implementation of the model was explained with an example of maturity self-assessment by a selected company. Benefiting from fuzzy numbers made the approach more intuitive and enabled self-assessment, not enhanced by external supervision or guidance.
The presented case study is illustrative and shows how to practically use the proposed approach. It can be a reference for future users of the assessment, fulfilling an explanatory function, explaining the next steps and how to interpret the assessment.
The methodology presented in the paper was developed in the pre-COVID period and the disturbances of the pandemic situation only proved the importance of resilience and the need to maintain sustainability to deal with changes of various ranges and scope. The importance and need for resilience are even more stressed by the findings presented in the Organizational Resilience Index 2019 [47] that show that business leaders’ confidence in the resilience of their organizations has faltered:
- The disruptive effects of technology and changes to governments and regulations have led to capacity having the most impact on maintaining resilience.
- In another year of political and economic uncertainty, the report shows that business leaders are struggling to adapt to new technology.
- Businesses appear unable to predict future market changes.
Concerning the above, key findings of the 2019 report include:
- The ability of businesses to adapt to change has fallen for the first time due to market turmoil—senior leader confidence in organizational resilience has fallen three points, down to 75 percent.
- Technological change is both the greatest opportunity and most severe threat to corporate adaptation—the gaps between impact and performance for innovation, horizon scanning and adaptive capacity (aspects of resilience) are growing.
- Strong leaders are needed to adapt strategy to changing conditions—staff engagement, clear direction and business performance are now valued more strongly than innovation and political acumen as key leadership skills.
- Corporate attitudes to sustainability must shift to retain talent—concerns over employee turnover have risen five percent year on year, while staff engagement is one of the lowest-ranked factors.
- Ethical accountability is encouraging a focus on supplier governance—Australia, India and the UK’s shared commitment to regulation supported by common standards are seeing these countries open a supply chain lead over others.
In light of the above, not only the diagnosis of organizational maturity but mostly defining the company’s path towards resilience seem to be a valuable approach to be used by business practitioners and an interesting cognitive challenge for academics.
The developed maturity model helps to understand in which direction the company should go, but its main task is to coordinate efforts to distribute them evenly to achieve specific features of maturity. Using the discussed model, the company can determine what level of maturity it has reached, as well as identify where its weaknesses are and where improvements should be made. Additionally, the maturity model can be used for learning purposes and as a means of representing information about the state of the enterprise. The maturity model will help convey the ideas and basic concepts of the maturity concept to employees.
It is worth noting that the maturity model is a scalable model. This means that it can be used to measure the maturity of both a single feature and the entire organization. The overall measure of maturity includes measures of maturity for specific features (such as the ability to process knowledge or ability to predict). At the same time, the level of maturity of individual features may be different, even if they concern the same area or state of their functioning. The company’s maturity model helps to identify such inconsistencies and allows management to determine what needs to be done to improve the situation.
Compared to other maturity models, the model proposed in this study has been expanded with a filter grid, the task of which is to eliminate the solutions used by the company, as well as to adapt such solutions that will be acceptable to the company in terms of adequacy and availability. The purpose of the filtering procedure is to select the best solutions for the analyzed organization, which will allow it to fill or eliminate the gap in the area that requires it.
The conducted research indicates the necessity to identify the development of the enterprise in the context of its maturity, because, thanks to this, it will be able to recognize its weak areas and, through appropriate preparation, adapt to rapidly changing economic situations, which is particularly important in the context of current global events. The presented model defines directions for the development of companies that want not only to survive in a competitive environment but also take leading positions on domestic or foreign markets. Managers of a company, thanks to the awareness of the company’s position (maturity), and then the analysis of possible directions of improvement of the existing state, will be able to identify the weakest functional links in the company and choose the appropriate strategies of conduct. The aim of eliminating the existing barriers should be the willingness to lead the company to a higher level of development, which will ensure its long-term presence in the market.
Further research can be conducted to assess the utilitarian aspects of the model developed and improve it. Moreover, the maturity assessment can more directly refer to uncertainty and volatility of the market situation. Concerning the methodology of assessment, it could be based on gray numbers instead of fuzzy numbers, as they can be used for incomplete information. Managers or professionals not having full information on the topic could contribute to maturity assessment without compromising the reliability of the procedure. Another promising and utilitarian aspect of the research is the definition of improvement guidelines and the procedure for their definition. Gray decision models seem to be promising in this field as well.
Author Contributions
Conceptualization, A.S. and I.P.; methodology, A.S.; validation, A.S. and I.P.; writing—original draft preparation, A.S.; writing—review and editing, I.P. Both authors have read and agreed to the published version of the manuscript.
Funding
This research received no external funding.
Informed Consent Statement
Informed consent was obtained from all subjects involved in the study.
Conflicts of Interest
The authors declare no conflict of interest.
References
- Gladwin, T.N.; Kennely, J.J.; Krause, T.S. Shifting paradigms for sustainable development: Implications for management theory and research. Acad. Manag. Rev. 1995, 20, 874–907. [Google Scholar] [CrossRef]
- D’aveni, R.A. Hypercompetition. Managing the Dynamics of Strategic Maneuvering; The Free Press: New York, NY, USA, 1994. [Google Scholar]
- Kidd, P.T. Agile Manufacturing: Forging New Frontiers; Addison-Wesley: Wokingham, UK, 1994. [Google Scholar]
- Kidd, P.T. Agile Corporations: Business Enterprises in the 21st Century—An Executive Guide; Cheshire Henbury: Macclesfield, UK, 1995. [Google Scholar]
- Gunasekaran, A. Agile manufacturing: A framework for research and development. Int. J. Prod. Econ. 1999, 62, 87–105. [Google Scholar] [CrossRef]
- McGaughey, R.E. Internet technology: Contributing to agility in the twenty-first century. Int. J. Agil. Manag. Syst. 1999, 1, 7–13. [Google Scholar] [CrossRef]
- Worley, C.G.; Williams, T.D.; Lawler, E.E., III. The Agility Factor. Building Adaptable Organizations for Superior Performance; Jossey-Bass: Blackwell, UK, 2014. [Google Scholar]
- Goldman, S.L.; Nagel, R.N.; Preiss, K. Agile Competitors and Virtual Organizations: Strategies for Enriching the Customer; Van Nostrand Reinhold: New York, NY, USA, 1995. [Google Scholar]
- Rigby, C.; Day, M.; Forrester, P.; Burnett, J. Agile supply: Rethinking systems thinking, systems practice. Int. J. Agil. Manag. Syst. 2000, 2, 178–186. [Google Scholar] [CrossRef]
- Zhang, Z.; Sharifi, H. A methodology for achieving agility in manufacturing organisations. Int. J. Oper. Prod. Manag. 2000, 20, 496–513. [Google Scholar] [CrossRef]
- Meredith, S.; Francis, D. Journey towards agility: The agile wheel explored. TQM Magaz. 2000, 12, 137–143. [Google Scholar] [CrossRef]
- Hormozi, A. Agile manufacturing: The next logical step. Benchmarking Int. J. 2001, 8, 132–143. [Google Scholar] [CrossRef]
- Highsmith, J. Agile Project Management: Creating Innovative Products; Addison Wesley Professional: Bonston, MA, USA, 2004. [Google Scholar]
- Storey, J.; Emberson, C.; Reade, D. The barriers to customer responsive supply chain management. Int. J. Oper. Prod. Manag. 2005, 25, 242–260. [Google Scholar] [CrossRef]
- Ambulkar, S.; Blackhurst, J.; Grawe, S. Firm’s Resilience to Supply Chain Disruptions: Scale Development and Empirical Examination. J. Oper. Manag. 2015, 33–34, 111–122. [Google Scholar] [CrossRef]
- Bhamra, R.; Dani, S.; Burnard, K. Resilience: The Concept, a Literature Review and Future Directions. Int. J. Prod. Res. 2011, 49, 5375–5393. [Google Scholar] [CrossRef]
- Brusset, X.; Teller, C. Supply Chain Capabilities, Risks, and Resilience. Int. J. Prod. Econ. 2017, 184, 59–68. [Google Scholar] [CrossRef]
- Anderson, E.; Jessen, S. Project Maturity in Organizations. Int. J. Proj. Manag. Accoun. 2003, 21, 457–461. [Google Scholar] [CrossRef]
- Alonso, J.; De Soria, I.M.; Orue-Echevarria, L.; Vergara, M. Enterprise Collaboration Maturity Model (ECMM): Preliminary Definition and Future Challenges. Enterprise Interoperability IV, Part VII; Springer: London, UK, 2010. [Google Scholar]
- Crosby, P. Quality is Free; McGraw-Hill: New York, NY, USA, 1979. [Google Scholar]
- Paulk, M.; Weber, C.V.; Curtis, B.; Chrissis, M.B. The Capability Maturity Model: Guidelines for Improving the Software Process; Carnegie Mellon Institute: Pittsburgh, PA, USA, 1995. [Google Scholar]
- Gren, L.; Torkar, R.; Feldt, R. The prospects of a quantitative measurement of agility: A validation study on an agile maturity model. J. Syst. Soft. 2015, 107, 38–49. [Google Scholar] [CrossRef]
- Henriques, V.; Tanner, M. A systematic literature review of agile and maturity model research. Int. J. Inform. Know. Manag. 2017, 12, 53–73. [Google Scholar] [CrossRef]
- Falessi, D.; Shaw, M.; Mullen, K. Achieving and Maintaining CMMI Maturity Level 5 in a Small Organization. IEEE Soft. 2014, 31, 80–86. [Google Scholar] [CrossRef]
- Menon, K.; Kärkkäinen, H.; Lasrado, L.A. Towards a maturity modeling approach for the implementation of industrial internet. In Proceedings of the Pacific Asia Conference on Information Systems (PACIS) 2016, Chiayi, Taiwan, 27 June–1 July 2016. [Google Scholar]
- Van Looy, A.; Poels, G.; Snoeck, M. Evaluating Business Process Maturity Models. J. AIS 2017, 18, 1. [Google Scholar]
- Singapore Economic Development Board. The Singapore Smart Industry Readiness Index: Catalyzing the Transoformation of Manufacturing; Singapore Economic Development Board: Singapore, 2018; pp. 1–46.
- Becker, J.; Knackstedt, R.; Pöppelbuß, J. Developing Maturity Models for IT Management—A Procedure Model and its Application. Bus. Inf. Syst. Eng. 2009, 1, 213–222. [Google Scholar] [CrossRef]
- Klötzer, C.; Pflaum, A. Toward the Development of a Maturity Model for Digitalization within the Manufacturing Industry’s Supply Chain. In Proceedings of the 50th Hawaii International Conference on System Sciences, Hilton Waikoloa Village, HI, USA, 4–7 January 2017; pp. 4210–4219. [Google Scholar]
- Weber, C.; Königsberger, J.; Kassner, L.; Mitschang, B. M2DDM—A Maturity Model for Data-Driven Manufacturing. Procedia CIRP 2017, 63, 173–178. [Google Scholar] [CrossRef]
- Ganzarain, J.; Errasti, N. Three stage maturity model in SME’s towards industry 4.0. J. Ind. Eng. Manag. 2016, 9, 1119–1128. [Google Scholar] [CrossRef]
- Schumacher, A.; Erol, S.; Sihn, W. A Maturity Model for Assessing Industry 4.0 Readiness and Maturity of Manufacturing Enterprises. Procedia CIRP 2016, 52, 161–166. [Google Scholar] [CrossRef]
- Sarmento dos Santos-Neto, J.B.; Cabral Seixas Costa, A.P. Enterprise maturity models: A systematic literature review. Enter. Inf. Syst. 2019, 13, 719–769. [Google Scholar] [CrossRef]
- Gajšek, B.; Sternad, M.; Lerher, T. Maturity Levels for Logistics 4.0 Based on Nrw’S Industry 4.0 Maturity Model. Bus. Logist. Mod. Manag. 2018, 18, 695–708. [Google Scholar]
- Stachowiak, A.; Oleśków-Szłapka, J. Agiliy capability maturity framework. Proc. Manuf. 2018, 17, 603–610. [Google Scholar]
- Lahrmann, G.; Marx, F.; Mettler, T.; Winter, R.; Wortmann, F. Inductive Design of Maturity Models: Applying the Rasch Algorithm for Design Science Research. Service-Oriented Perspectives in Design Science Research; Lecture Notes in Computer Science 6629; Springer: Berlin/Heidelberg, Germany, 2011; pp. 176–191. [Google Scholar]
- Mettler, T. Maturity assessment models: A design science research approach. Int. J. Soc. Syst. Sci. 2011, 3, 213–222. [Google Scholar] [CrossRef]
- Jiang, J.J.; Klein, G.; Hwang, H.G.; Huang, J.; Hung, S.Y. An exploration of the relationship between software development process maturity and project performance. Inf. Manag. 2004, 41, 279–288. [Google Scholar] [CrossRef]
- Leppänen, M. A comparative analysis of agile maturity models. In Information Systems Development: Reflections, Challenges and New Directions; Pooley, R., Coady, J., Schneider, C., Linger, H., Barry, C., Lang, M., Eds.; Springer: New York, NY, USA, 2013; pp. 329–343. [Google Scholar]
- Pöppelbuß, J.; Röglinger, M. What makes a useful maturity model? A framework of general design principles for maturity models and its demonstration in business process management. In Proceedings of the 19th European Conference on Information Systems, ECIS 2011 Proceedings, Helsinko, Finland, 9–11 June 2011. [Google Scholar]
- Khoshgoftar, M.; Osman, O. Comparison of maturity models. In Proceedings of the 2nd IEEE International Conference on Computer Science and Information Technology, Beijing, China, 8–11 August 2009. [Google Scholar]
- Cooke-Davies, T.J. Project Management Maturity Models; Handbook of Managing Projects; Wiley: New York, NY, USA, 2004. [Google Scholar]
- Lin, C.-T. Agility Index in Supply Chain. In Proceedings of the 17th International Conference on Production, Prague, Czech Republic, 17–22 August 2003. [Google Scholar]
- Lin, C.-T.; Chiu, H.; Tseng, Y.H. Agility evaluation using fuzzy logic. Int. J. Prod. Econ. 2006, 101, 353–368. [Google Scholar] [CrossRef]
- Shane, S.; Venkataraman, S. The Promise of Entrepreneurship as a Field of Research. Acad. Manag. Rev. 2000, 25, 217–226. [Google Scholar] [CrossRef]
- Sharifi, H.; Zhang, Z. A methodology for achieving agility in manufacturing organizations: An introduction. Int. J. Prod. Econ. 1999, 62, 7–22. [Google Scholar] [CrossRef]
- BSI Group. Organizational Resilience Report; British Standard Institution: London, UK, 2019. [Google Scholar]


Publisher’s Note: MDPI stays neutral with regard to jurisdictional claims in published maps and institutional affiliations. |
© 2021 by the authors. Licensee MDPI, Basel, Switzerland. This article is an open access article distributed under the terms and conditions of the Creative Commons Attribution (CC BY) license (https://creativecommons.org/licenses/by/4.0/).