
Assessing the Impacts of Climate Variations on the Potato Production in Bangladesh: A Supply and Demand Model Approach


Abstract
:1. Introduction
2. Materials and Methods
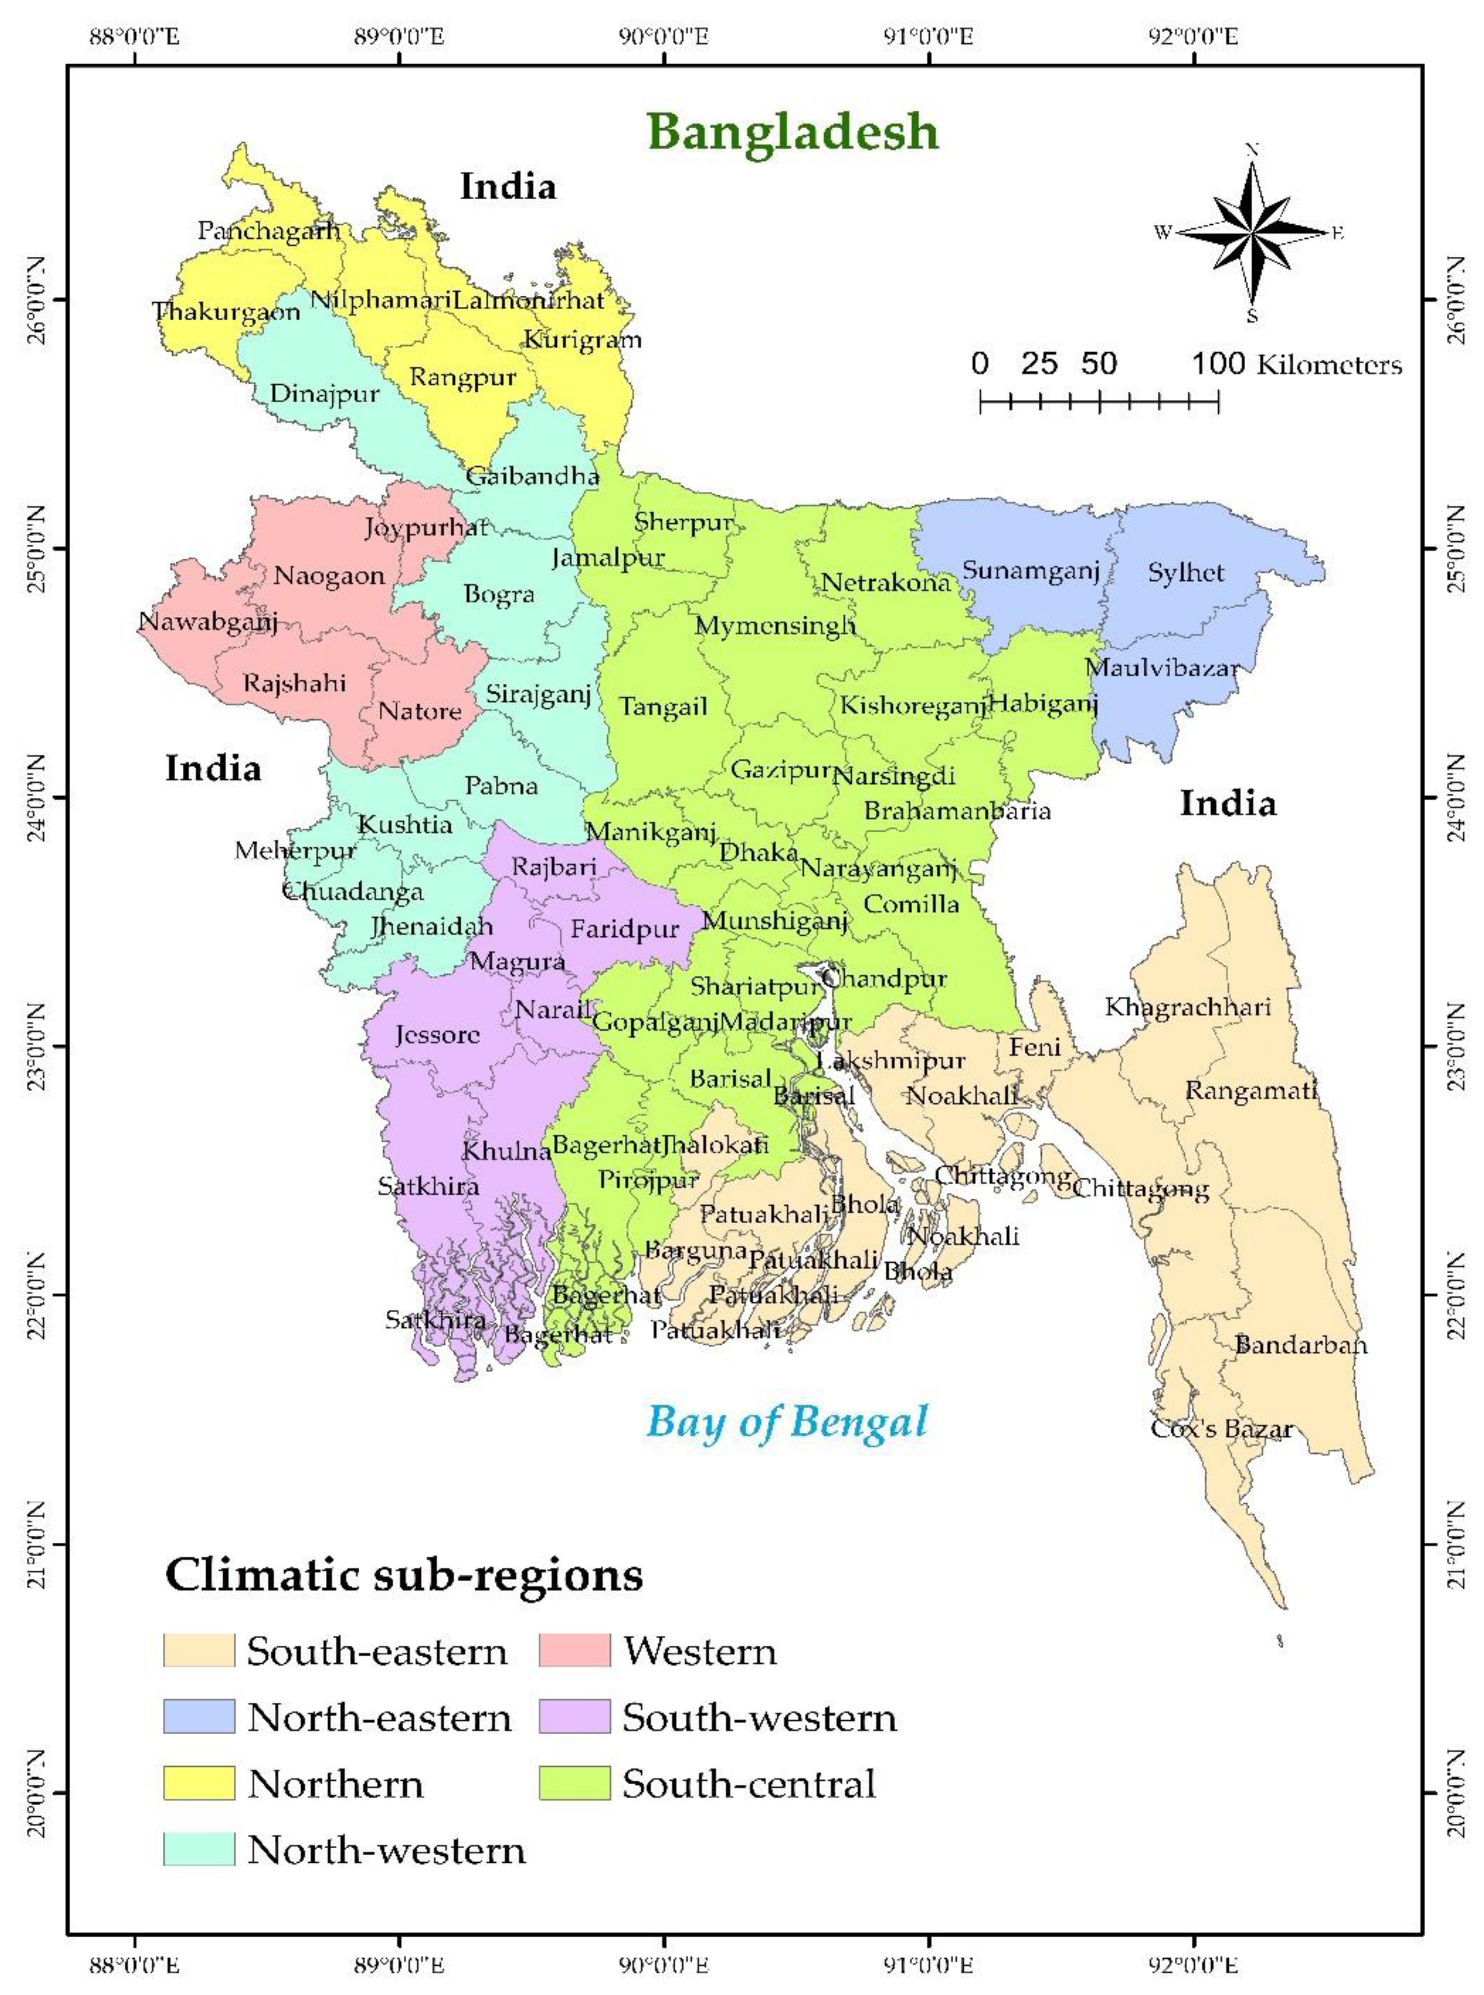
2.1. Study Area
2.2. Data Sources
2.2.1. Historical Data
2.2.2. Forecast Data
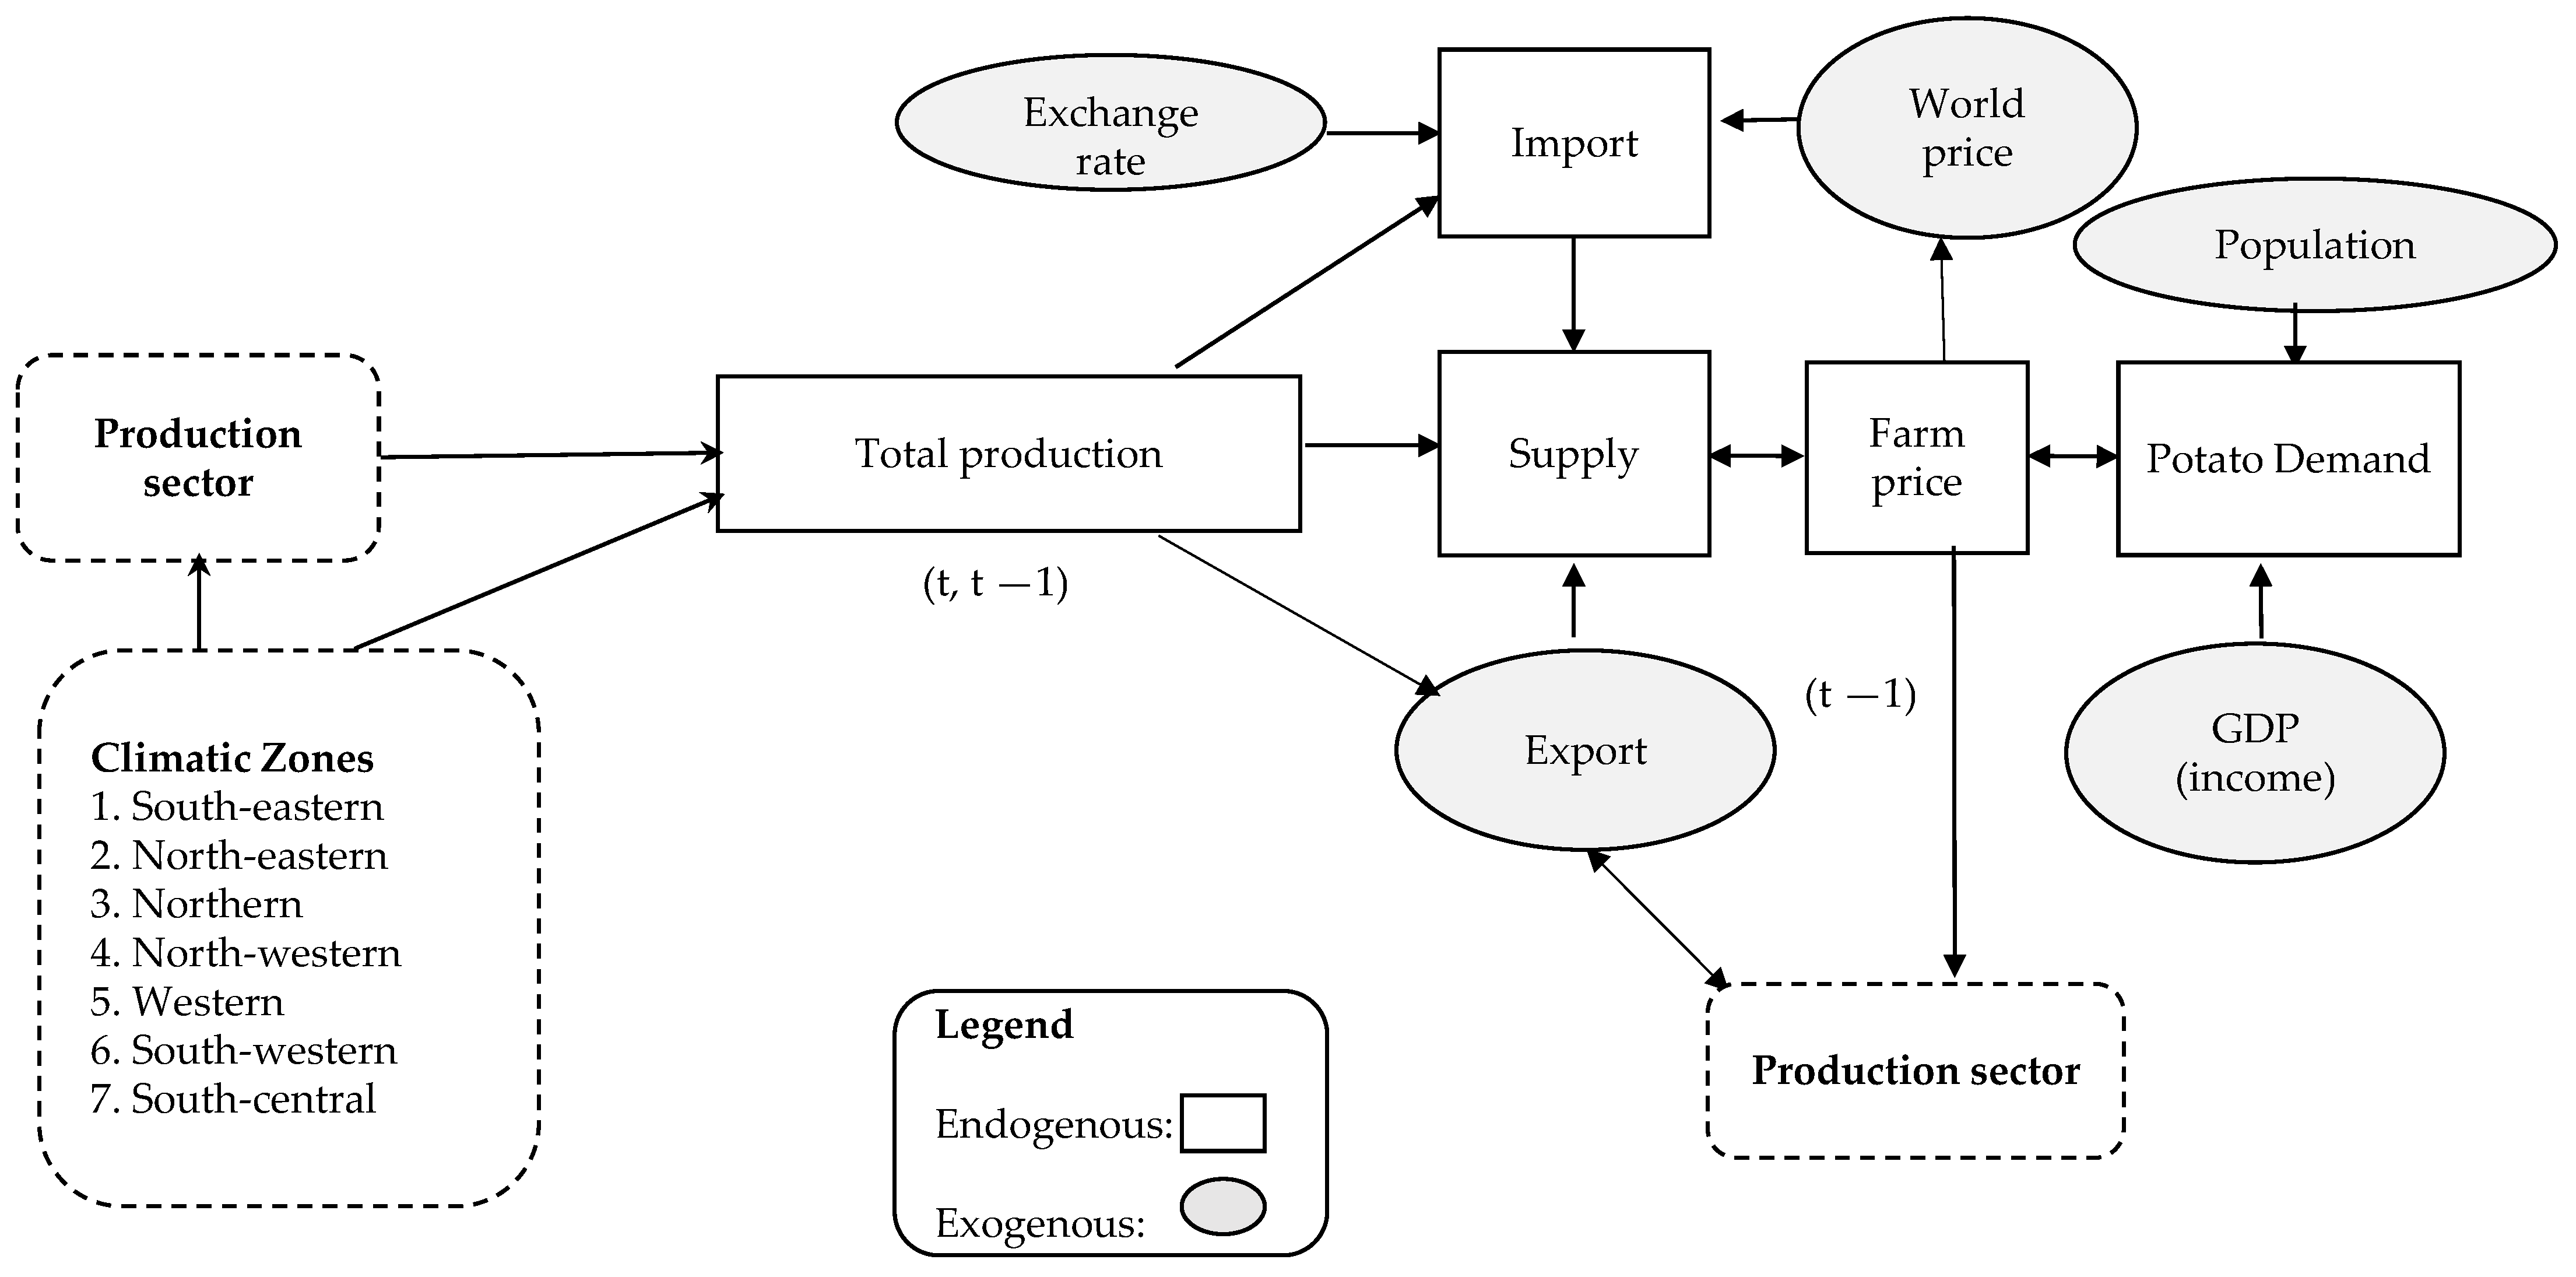
2.3. Supply and Demand Model of Potato
- SSt > DDt when ADVt became negative and FPt decreased;
- SSt < DDt when ADVt became positive and FPt went up;
- The iteration process was terminated when ADVt ≈ 0.
3. Results
3.1. Estimation of Functions of the Supply and Demand Model
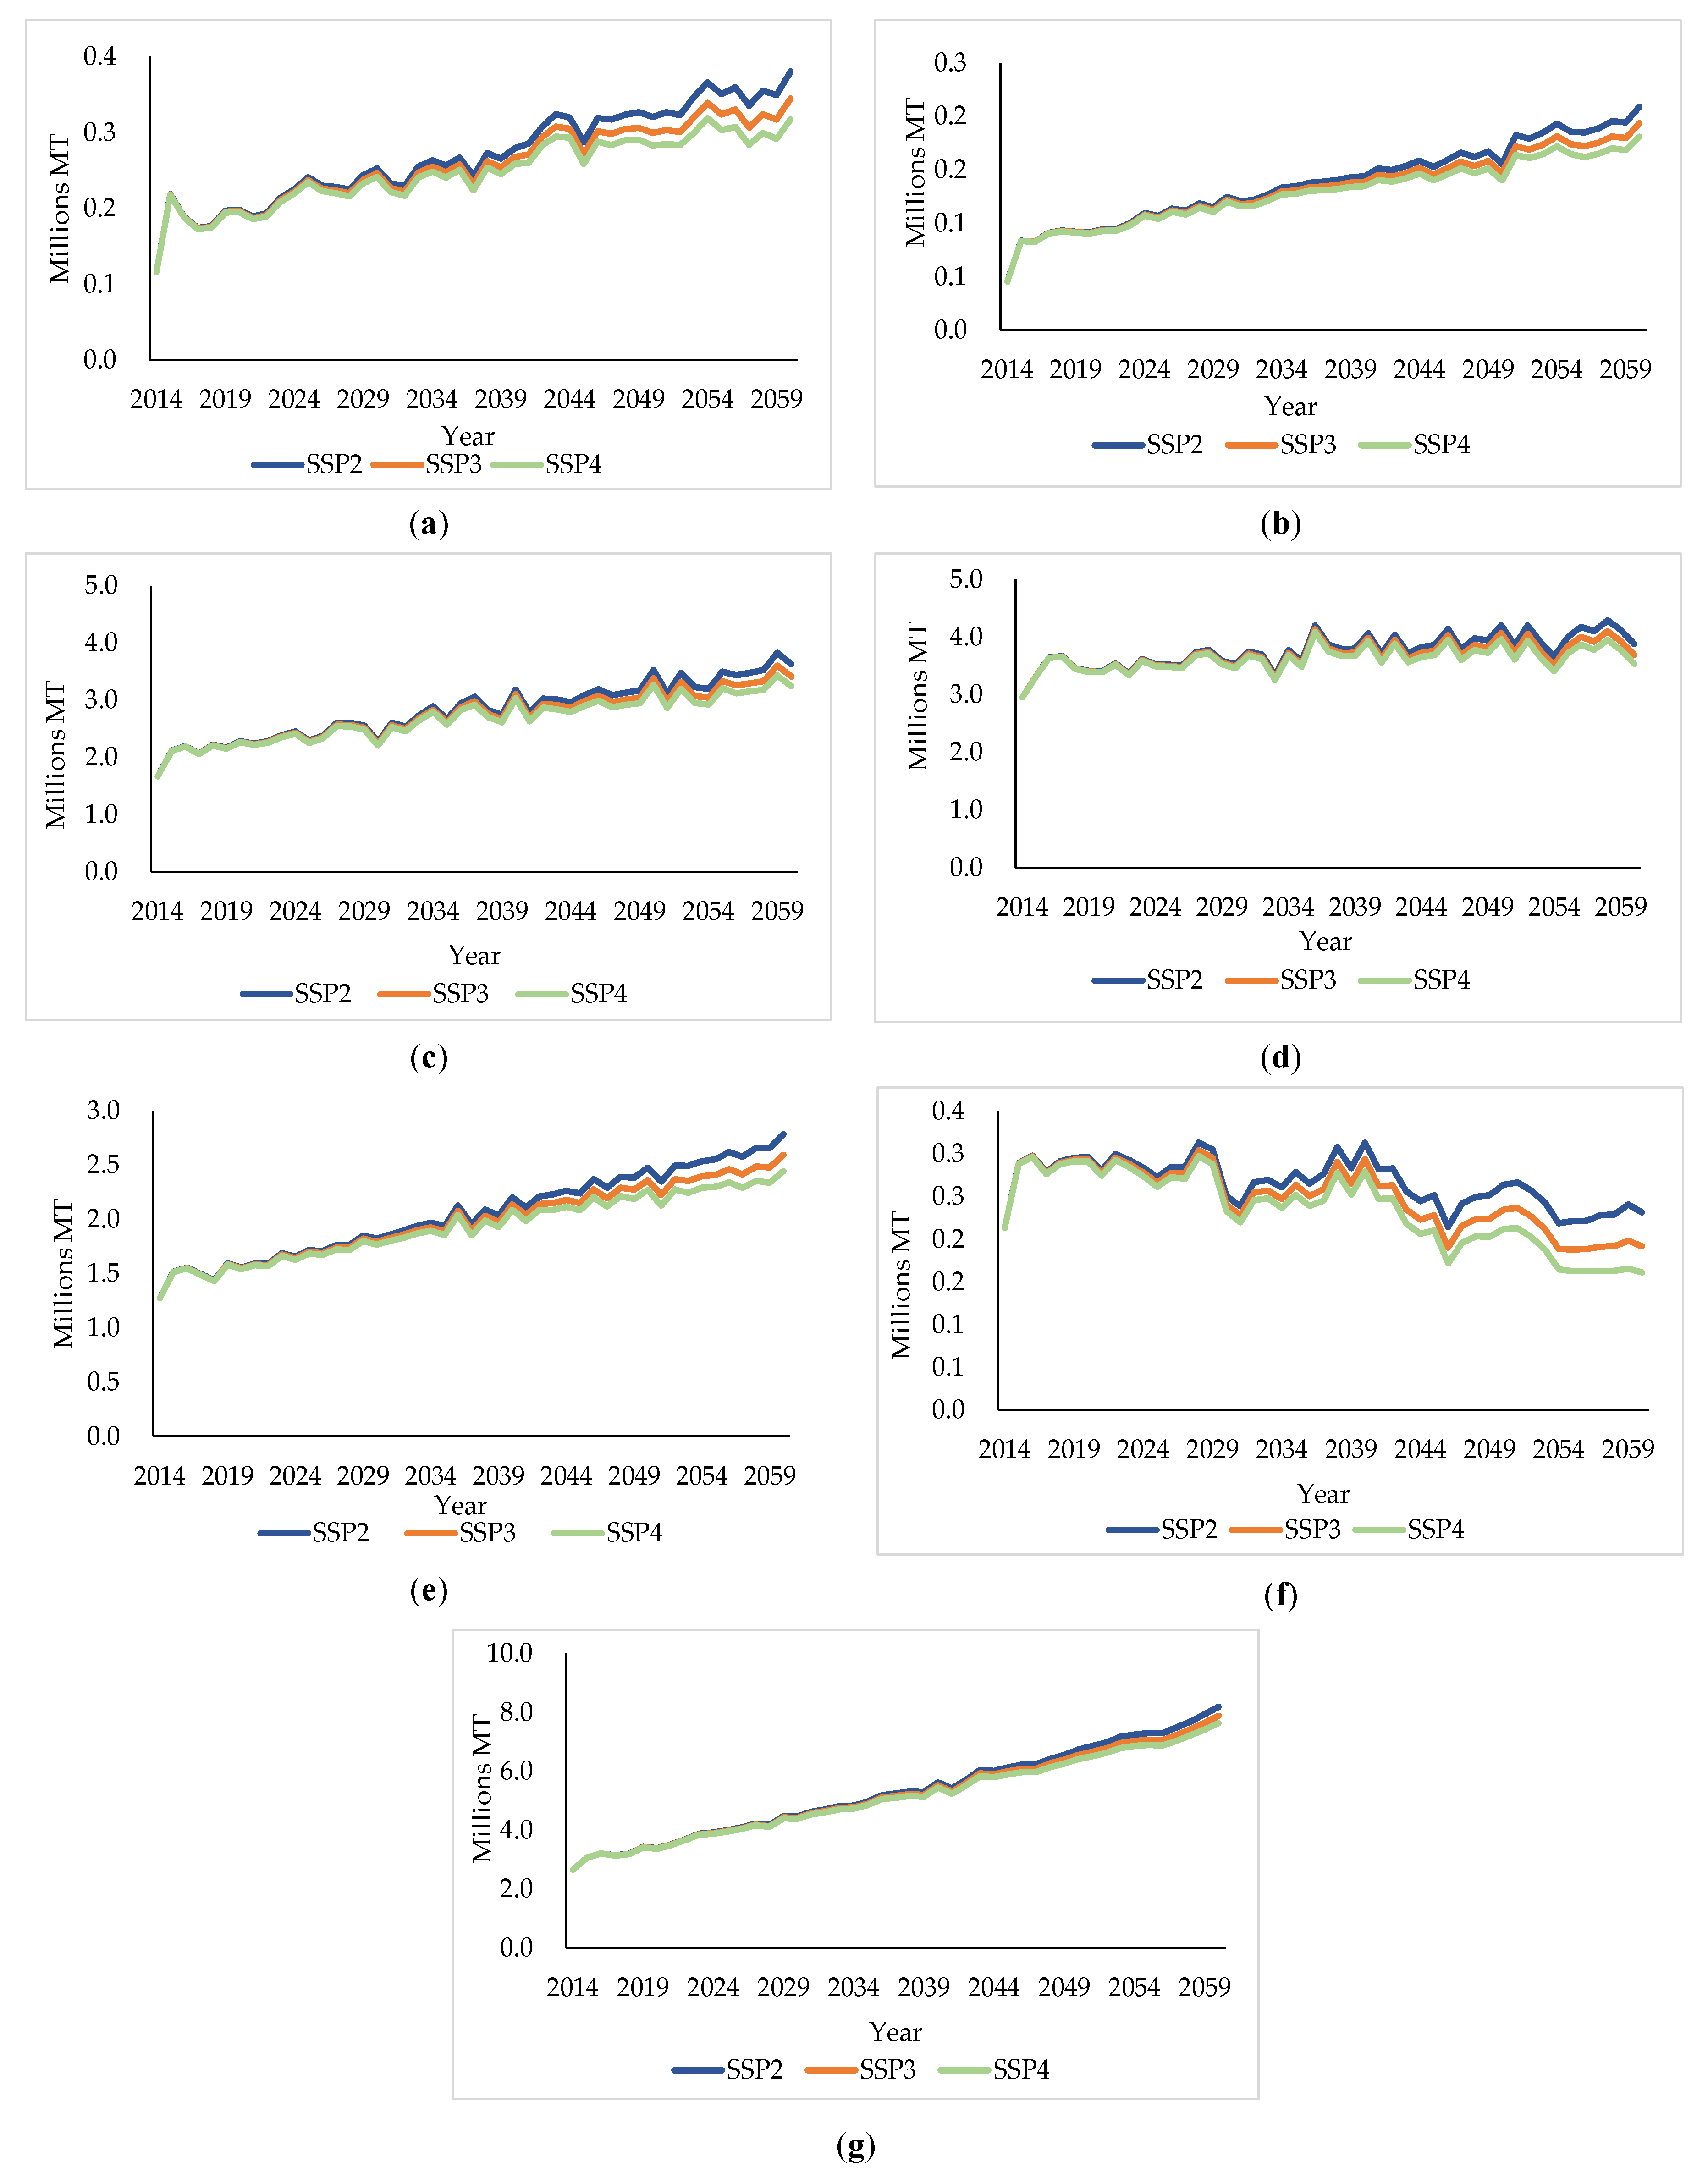
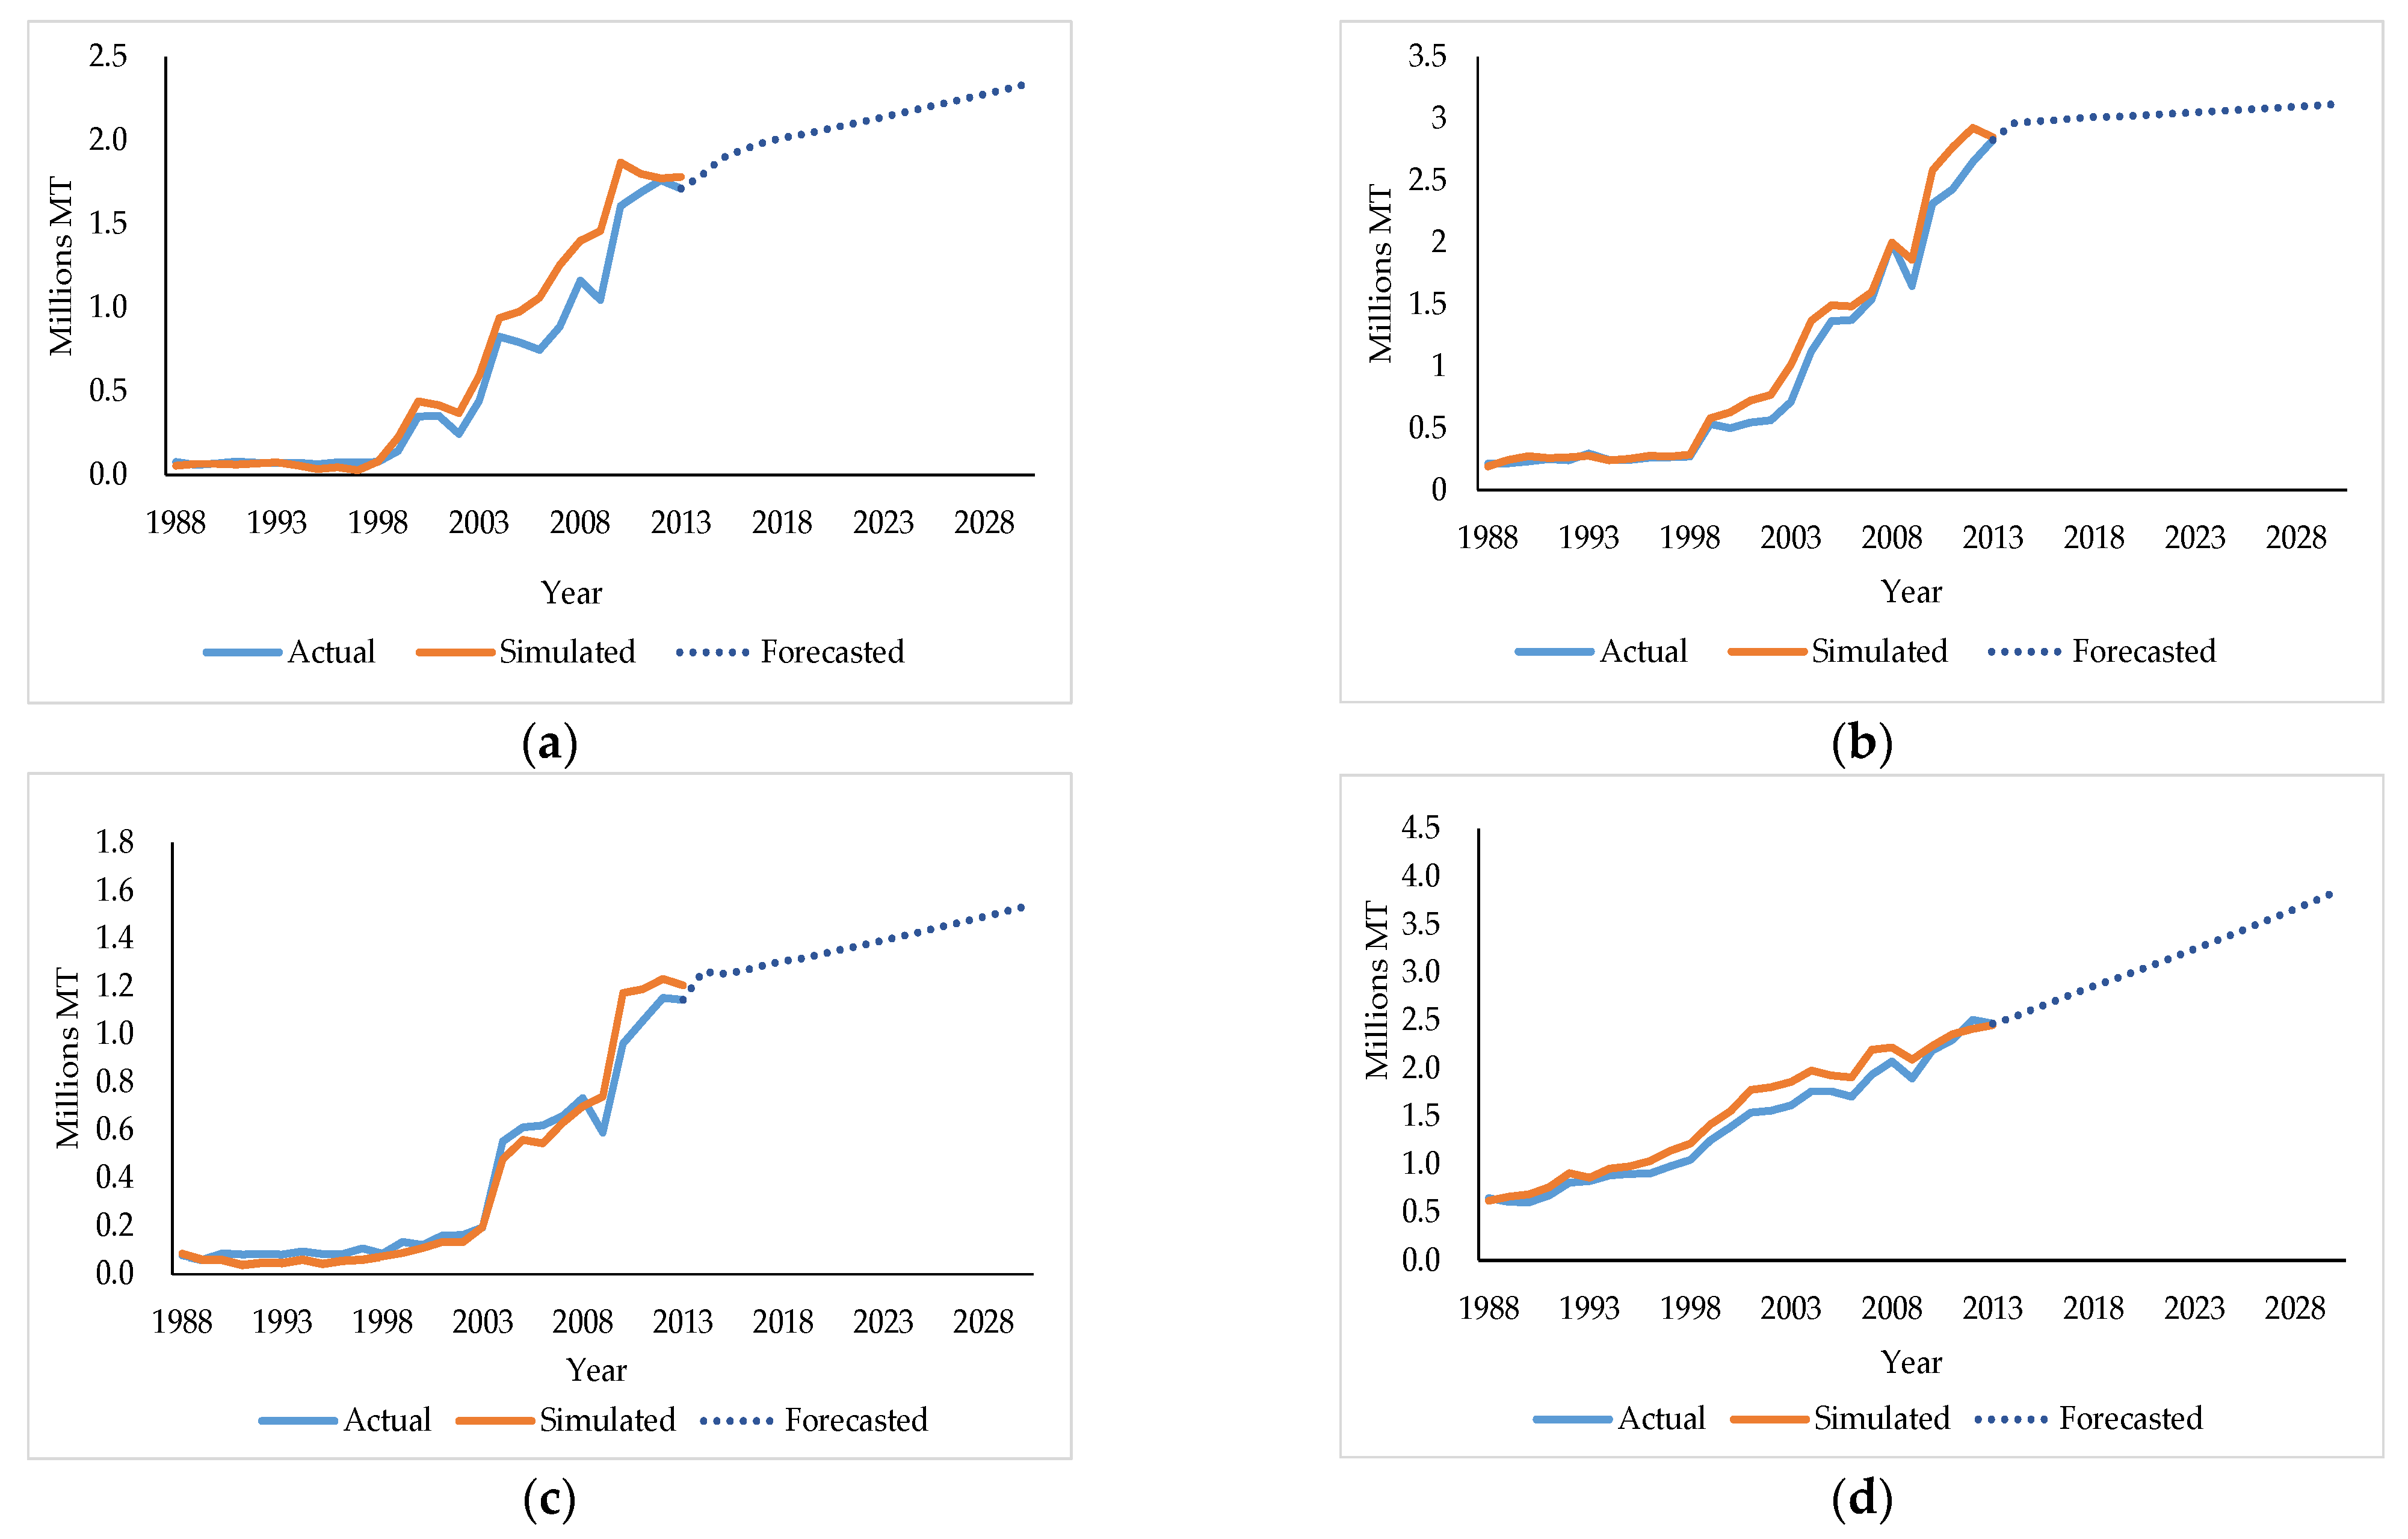
3.2. Simulation Analysis
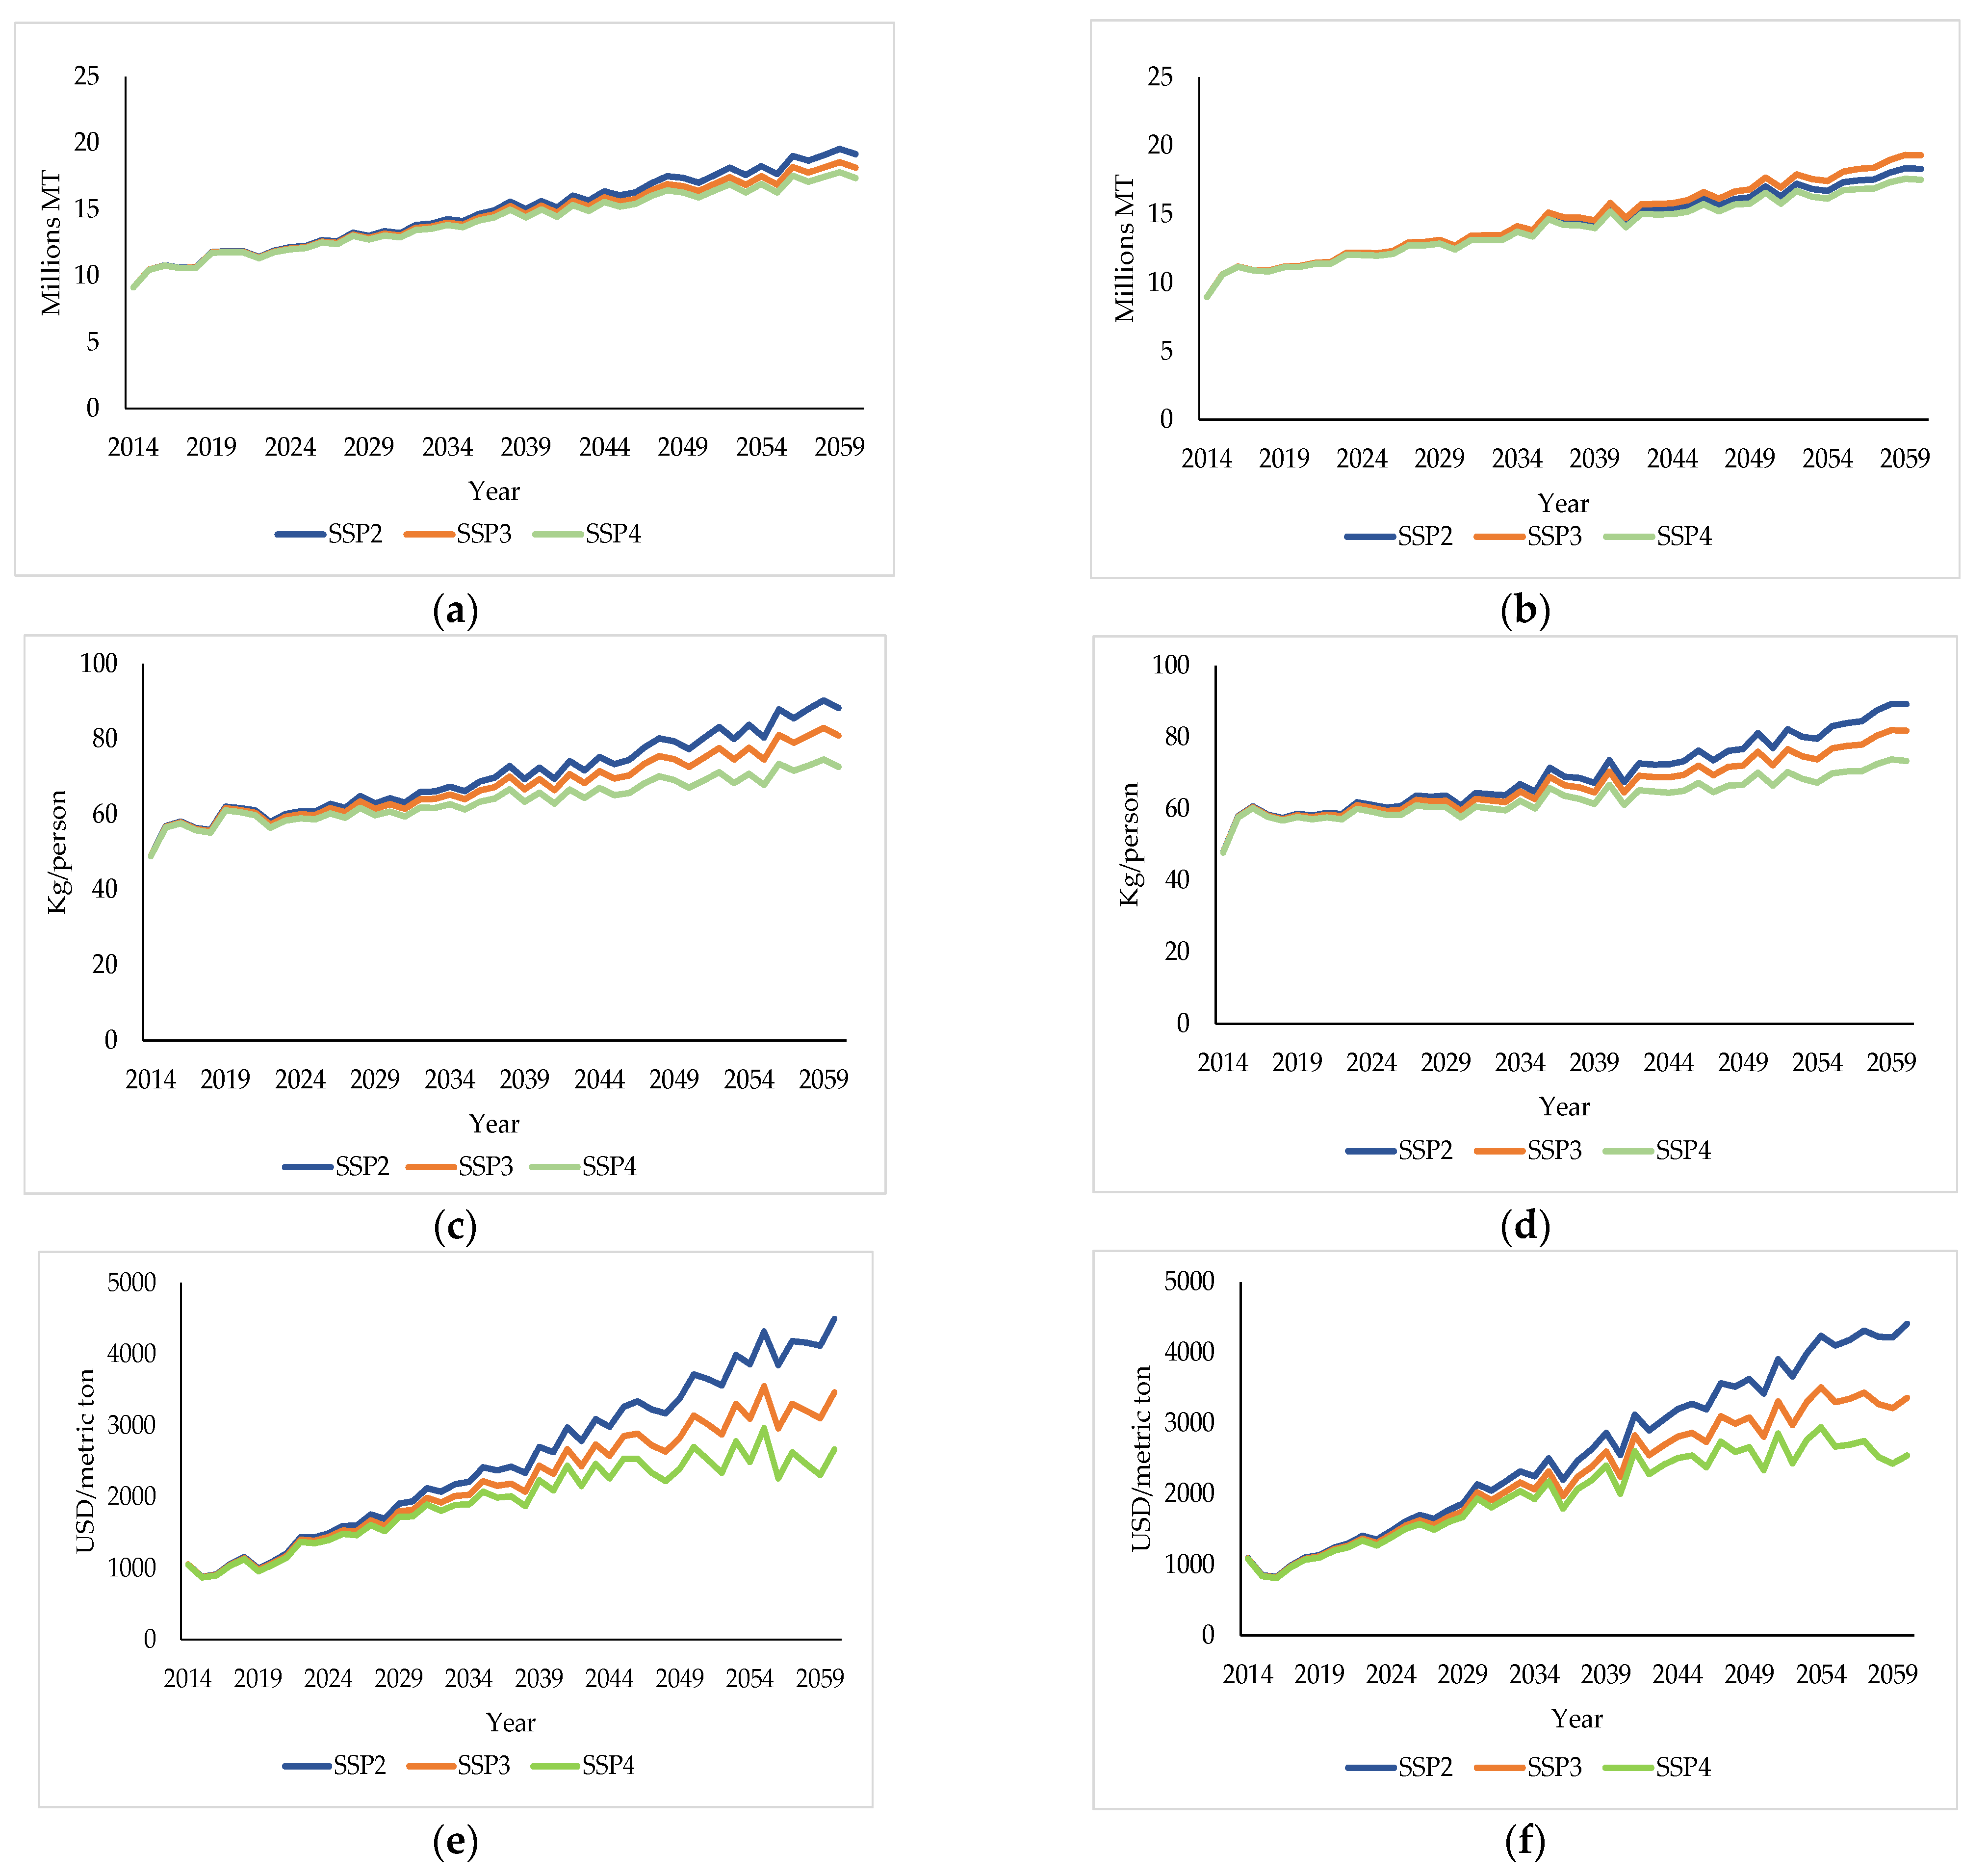
Potato Production Scenario under RCP 6.0 and RCP 8.5
4. Discussion
5. Conclusions
Author Contributions
Funding
Institutional Review Board Statement
Informed Consent Statement
Data Availability Statement
Acknowledgments
Conflicts of Interest
Appendix A

| Climate Region | Districts | Climate Characteristics |
|---|---|---|
| South-eastern (SE) | Bhola, Barguna, Patuakhali, Noakhali, Lakshmipur, Feni, Khagrachari, Rangamati, Chittagong, Bandarban, Cox’s Bazar, and Jhalakati | Heavy rainfall and a small mean temperature range |
| North-eastern (NE) | Sunamganj, Sylhet, and Moulvibazar | Mild summer temperatures, heavy rainfall, and cloudy, cold winters |
| Northern (N) | Panchagarh, Thakurgaon, Nilphamari, Rangpur, Kurigram, and Lalmonirhat | Heavy rainfall, hot summer temperatures, and cold winters |
| North-western (NW) | Dinajpur, Gaibandha, Bogra, Sirajganj, Pabna, Kushtia, Meherpur, Chuadanga, and Jhenaidah | Hot summer temperatures and moderate rainfall |
| Western (W) | Jaipurhat, Chapai Nawabganj, Naogaon, Natore, and Rajshahi | Very hot summer temperatures and low rainfall |
| South-western (SW) | Jessore, Khulna, Satkhira, Magura, Narail, Faridpur, and Rajbari | Hot summer temperatures and heavy rainfall |
| South-central (SC) | Barisal, Brahmanbaria, Chandpur, Comilla, Dhaka, Gazipur, Gopalganj, Habiganj, Jamalpur, Kishoreganj, Madaripur, Manikganj, Munshiganj, Mymensingh, Narayanganj, Narsingdi, Netrakona, Pirojpur, Shariatpur, Sherpur, Tangail, and Bagerhat | Mild summers and heavy rainfall |
Appendix B
| Production Activities | Jan | Feb | Mar | Apr | May | Jun | Jul | Aug | Sep | Oct | Nov | Dec |
|---|---|---|---|---|---|---|---|---|---|---|---|---|
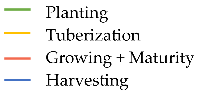 |  |  | ||||||||||
Appendix C
| Climate Zone | Yield | Area | ||||
|---|---|---|---|---|---|---|
| t Statistics | p Value | Decision | t Statistics | p Value | Decision | |
| SE | −2.905 | 0.008 | I (1) | −1.288 | 0.213 | I (1) |
| NE | −3.086 | 0.005 | I (1) | −1.307 | 0.203 | I (1) |
| N | −2.533 | 0.018 | I (1) | −1.794 | 0.085 | I (1) |
| NW | −1.809 | 0.083 | I (1) | −1.487 | 0.15 | I (1) |
| W | −1.822 | 0.081 | I (1) | −2.232 | 0.035 | I (1) |
| SW | −3.613 | 0.000 | I (0) | −1.417 | 0.169 | I (1) |
| SC | −3.381 | 0.002 | I (1) | −2.373 | 0.026 | I (1) |
Appendix D
| Variables | t Statistic | p-Value | Decision |
|---|---|---|---|
| GDP | 4.20 | 0.000 | I (0) |
| FOOD | −2.11 | 0.045 | I (1) |
| FP | −3.29 | 0.003 | I (1) |
| WP | −3.38 | 0.002 | I (1) |
| IMP | −2.69 | 0.013 | I (1) |
| EXP | 1.42 | 0.169 | I (1) |
| CPI | −3.92 | 0.001 | I (0) |
| LOSS | −1.95 | 0.062 | I (1) |
| SEED | −2.71 | 0.012 | I (1) |
Appendix E
| Climate Zone | January | February | March | November | December | |||||
|---|---|---|---|---|---|---|---|---|---|---|
| t Statistic | Decision | t Statistic | Decision | t Statistic | Decision | t Statistic | Decision | t Statistic | Decision | |
| Temperature | ||||||||||
| SE | −7.10 | I (0) | −5.02 | I (0) | −6.73 | I (0) | −4.83 | I (0) | −4.43 | I (0) |
| NE | −7.68 | I (0) | −5.55 | I (0) | −7.27 | I (0) | −5.02 | I (0) | −5.08 | I (0) |
| N | −6.31 | I (0) | −3.58 | I (1) | −7.25 | I (0) | −3.55 | I (1) | −4.75 | I (0) |
| NW | −6.66 | I (0) | −5.65 | I (0) | −7.28 | I (0) | −3.44 | I (1) | −4.88 | I (0) |
| W | −6.47 | I (0) | −5.23 | I (0) | −6.57 | I (0) | −3.68 | I (1) | −4.09 | I (0) |
| SW | −6.49 | I (0) | −5.03 | I (0) | −7.08 | I (0) | −3.59 | I (1) | −4.73 | I (0) |
| SC | −6.62 | I (0) | −5.41 | I (0) | −6.83 | I (0) | −4.33 | I (0) | −4.73 | I (0) |
| Rainfall | ||||||||||
| SE | −6.79 | I (0) | −4.05 | I (0) | −5.02 | I (0) | −6.02 | I (0) | −6.44 | I (0) |
| NE | −5.74 | I (0) | −4.82 | I (0) | −8.60 | I (0) | −6.42 | I (0) | −5.74 | I (0) |
| N | −4.82 | I (0) | −6.55 | I (0) | −5.20 | I (0) | −5.94 | I (0) | −5.74 | I (0) |
| NW | −5.21 | I (0) | −6.35 | I (0) | −6.94 | I (0) | −6.35 | I (0) | −5.98 | I (0) |
| W | −6.08 | I (0) | −7.08 | I (0) | −6.14 | I (0) | −5.44 | I (0) | −5.65 | I (0) |
| SW | −6.29 | I (0) | −4.61 | I (0) | −6.80 | I (0) | −7.47 | I (0) | −5.66 | I (0) |
| SC | −6.68 | I (0) | −4.76 | I (0) | −6.59 | I (0) | −7.46 | I (0) | −5.32 | I (0) |
| Solar radiation | ||||||||||
| SE | −4.49 | I (0) | −5.17 | I (0) | −4.91 | I (0) | −4.67 | I (0) | −4.28 | I (0) |
| NE | −4.94 | I (0) | −5.94 | I (0) | −5.74 | I (0) | −4.48 | I (0) | −3.00 | I (1) |
| N | −4.92 | I (0) | −3.93 | I (0) | −3.48 | I (1) | −6.11 | I (0) | −3.41 | I (1) |
| NW | −5.06 | I (0) | −4.99 | I (0) | −4.83 | I (0) | −5.11 | I (0) | −3.09 | I (1) |
| W | −5.58 | I (0) | −6.08 | I (0) | −4.16 | I (0) | −4.53 | I (0) | −3.07 | I (1) |
| SW | −4.67 | I (0) | −5.54 | I (0) | −3.89 | I (1) | −4.31 | I (0) | −4.13 | I (0) |
| SC | −4.83 | I (0) | −3.91 | I (0) | −4.82 | I (0) | −5.00 | I (0) | −3.80 | I (1) |
Appendix F


References
- Springmann, M.; Mason-D’Croz, D.; Robinson, S.; Garnett, T.; Godfray, H.C.J.; Gollin, D.; Scarborough, P. Global and regional health effects of future food production under climate change. Lancet 2016, 387, 1937–1946. [Google Scholar] [CrossRef] [Green Version]
- Badiane, O.; Makombe, T. Beyond a Middle-Income Africa: Transforming African Economies for Sustained Growth with Rising Employment and Incomes, ReSAKSS Annual Trends and Outlook Report 2014; International Food Policy Research Institute (IFPRI): Washington, DC, USA, 2015. [Google Scholar] [CrossRef]
- Mason-D’Croz, D.; Sulser, T.B.; Wiebe, K.; Rosegrant, M.W.; Lowder, S.K.; Nin-Pratt, A.; Willenbockel, D.; Robinson, S.; Zhu, T.; Cenacchi, N.; et al. Agricultural investments and hunger in Africa modeling potential contributions to SDG2—Zero Hunger. World Dev. 2019, 116, 38–53. [Google Scholar] [CrossRef] [PubMed]
- FAO (Food and Agriculture Organization). Climate is Changing. Food and Agriculture Must Too. World Food Day. 2016. Available online: http://www.fao.org/zhc/detail-events/en/c/413181 (accessed on 3 April 2020).
- Myers, S.S.; Zanobetti, A.; Kloog, I.; Huybers, P.; Leakey, A.D.; Bloom, A.J.; Carlisle, E.; Dietterich, L.H.; Fitzgerald, G.; Hasegawa, T.; et al. Increasing CO2 threatens human nutrition. Nature 2014, 510, 139–142. [Google Scholar] [CrossRef]
- Medek, D.E.; Schwartz, J.; Myers, S.S. Estimated effects of future atmospheric concentrations on protein intake and the risk of protein deficiency by country and region. Environ. Health Perspect. 2017, 125, 087002. [Google Scholar] [CrossRef] [PubMed]
- Myers, S.S.; Wessells, K.R.; Kloog, I.; Zanobetti, A.; Schwartz, J. Effect of increased concentrations of atmospheric carbon dioxide on the global threat of zinc deficiency: A modeling study. Lancet Glob. Health. 2015, 3, 639–645. [Google Scholar] [CrossRef] [Green Version]
- Smith, M.R.; Myers, S.S. Impact of anthropogenic CO2 emissions on global human nutrition. Nat. Clim. Chang. 2018, 8, 834–839. [Google Scholar] [CrossRef]
- Myers, S.S.; Smith, M.R.; Guth, S.; Golden, C.D.; Vaitla, B.; Mueller, N.D.; Dangour, A.D.; Huybers, P. Climate change and global food systems: Potential impacts on food security and undernutrition. Annu. Rev. Public Health 2017, 38, 259–277. [Google Scholar] [CrossRef] [PubMed]
- Lutaladio, N.B.; Ortiz, O.; Haverkort, A.; Caldiz, D. Sustainable Potato Production, Guidelines for Developing Countries; International Year of the Potato 2008; FAO, UN: Rome, Italy, 2009. [Google Scholar]
- Banholzer, S.; Kossin, J.; Donner, S. The impact of climate change on natural disasters. In Reducing Disaster: Early Warning Systems for Climate Change; Banholzer, S., Kossin, J., Donner, S., Eds.; Springer: Dordrecht, The Netherlands, 2014; pp. 21–49. [Google Scholar] [CrossRef]
- Faroque, M.; Asaduzamman, M.; Hossain, M. Sustainable agricultural development under climate change in Bangladesh. J. Sci. Found. 2013, 11, 17–28. [Google Scholar] [CrossRef] [Green Version]
- Roy, A.; Haider, M.Z. Stern review on the economics of climate change: Implications for Bangladesh. Int. J. Clim. Chang Str. 2019, 11, 100–117. [Google Scholar] [CrossRef]
- Hong, Z.; Fen, X.; Yu, W.; Hong-hai, H.; Xiao-feng, D. Progress of potato staple food research and industry development in China. J. Integr. Agric. 2017, 16, 2924–2932. [Google Scholar] [CrossRef]
- Chung, I.M.; Kim, J.K.; Jin, Y.I.; Oh, Y.T.; Prabakaran, M.; Youn, K.J.; Kim, S.H. Discriminative study of a potato (Solanum tuberosum L.) cultivation region by measuring the stable isotope ratios of bio-elements. Food Chem. 2016, 212, 48–57. [Google Scholar] [CrossRef]
- Arun, K.B.; Chandran, J.; Dhanya, R.; Krishna, P.; Jayamurthy, P.; Nisha, P. A comparative evaluation of antioxidant and antidiabetic potential of peel from young and matured potato. Food Biosci. 2015, 9, 36–46. [Google Scholar] [CrossRef]
- Haverkort, A.J.; van de Waart, M.; Bodlaender, K.B.A. The effect of early drought stress on numbers of tubers and stolons of potato in controlled and field conditions. Potato Res. 1990, 33, 89–96. [Google Scholar] [CrossRef]
- Stol, W.; de Koning, G.H.J.; Kooman, P.L.; Haverkort, A.J.; van Keulen, H.; Penning de Vries, F.W.T. Agroecological Characterization for Potato Production CABO Report, 155; CABO: Wageningen, The Netherlands, 1991; Volume 53. [Google Scholar]
- Reynolds, M.P.; Ewing, E.E. Effects of high air and soil temperature stress on growth and tuberization in Solanum tuberosum. Ann. Bot. 1989, 64, 241–247. [Google Scholar] [CrossRef]
- FAOSTAT. FAO Statistical Database; Food and Agricultural Organization of the United Nations (FAO): Rome, Italy, 2019; Available online: www.fao.org/faostat/en (accessed on 14 April 2020).
- BBS. Bangladesh Bureau of Statistics. Yearbook of Agricultural Statistics of Bangladesh. Statistics Division, Ministry of Planning, Government of the People’s Republic of Bangladesh. 2017. Available online: www.bbs.gov.bd (accessed on 19 November 2019).
- Talukder, R.K. Food security, self-sufficiency and nutrition gap in bangladesh, bangladesh development studies. BIDS 2005, 31, 35–62. Available online: https://ideas.repec.org/a/ris/badest/0470.html (accessed on 22 June 2020).
- FAO (Food and Agriculture Organization of the United Nations). The State of Food and Agriculture, Rome. 2015. Available online: http://bit.ly/KAn84P (accessed on 16 May 2020).
- Household Income and Expenditure Survey. Preliminary Report on Household Income and Expenditure Survey; Bureau of Statistics Division, Ministry of Planning, Government of the People’s Republic of Bangladesh: Dhaka, Bangladesh, 2010. [Google Scholar]
- FAO/WHO (Food and Agriculture Organization of the United Nations/World Health Organization). Bangladesh Country Nutrition Paper. In Proceedings of the International Conference on Nutrition 21 Years Later, Geneva, Switzerland, 19–21 November 2014. [Google Scholar]
- Hossain, M.M.; Abdulla, F. Forecasting potato production in Bangladesh by ARIMA model. J. Adv. Stat. 2016, 1, 191–198. [Google Scholar] [CrossRef]
- Kobayashi, S.; Furuya, J. Comparison of climate change impacts on food security of Bangladesh. Stud. Reg. Sci. 2011, 41. [Google Scholar] [CrossRef]
- Soora, N.K.; Aggarwal, P.K.; Saxena, R.; Rani, S.; Jain, S.; Chauhan, N. An assessment of the regional vulnerability of rice to climate change in India. Clim. Chang. 2013, 118, 683–699. [Google Scholar] [CrossRef]
- Salam, M.A.; Furuya, J.; Kobayashi, S. Climate effect on supply and market price stability of rice in Bangladesh: Assessment of climate and socioeconomic scenarios. Jpn. J. Agric. Econ. 2017, 19, 60–65. [Google Scholar] [CrossRef] [Green Version]
- Hung, C.; Zhou, L.; Furuya, J. Climate change effects on supply and demand of rice in India. Jpn. Agric. Res. Q. 2018, 52, 255–272. [Google Scholar] [CrossRef] [Green Version]
- Roberts, M.J.; Schlenker, W. Identifying supply and demand elasticities of agricultural commodities: Implications for the US ethanol mandate. Am. Econ. Rev. 2013, 103, 2265–2295. Available online: http://www.jstor.com/stable/42920650 (accessed on 27 December 2020). [CrossRef] [Green Version]
- Furuya, J.; Kobayashi, S.; Yamauchi, K. Impacts of climate change on rice market and production capacity in the Lower Mekong Basin. Paddy Water Env. 2014, 12, 255–274. [Google Scholar] [CrossRef]
- Stocker, T.F.; Qin, D.; Plattner, G.K.; Tignor, M.; Allen, S.K.; Boschung, J.; Nauels, A.; Xia, Y.; Bex, V.; Midgley, P.M. Climate Change 2013: The Physical Science Basis. Working Group I Contribution to the Fifth Assessment Report of the Intergovernmental Panel on Climate Change—Abstract for Decision-Makers: Groupe d’Experts Intergouvernemental Sur l’Evolution du Climat/Intergovernmental Panel on Climate Change-IPCC, C/O World Meteorological Organization; 7bis Avenue de la Paix, CP 2300 CH-1211 Geneva 2 (Switzerland); Cambridge University Press: Cambridge, UK, 2013. [Google Scholar]
- Alam, M.K.; Zaman, M.M.; Nazrul, M.I.; Alam, M.S.; Hossain, M.M. Performance of some exotic potato varieties under Bangladesh conditions. Asian J. Plant Sci. 2003, 2, 108–112. [Google Scholar] [CrossRef]
- Begum, M.M.; Saha, J.K.; Rahman, M.A.; Ahmed, M.R. An economic study of potato production in selected areas of Sylhet district. J. Sylhet Agric. Univ. 2017, 4, 129–136. [Google Scholar]
- Begum, F.; Kundu, B.; Hossain, M. Physiological analysis of growth and yield of potato in relation to planting date. J. Bangladesh Acad. Sci. 2015, 39, 45–51. [Google Scholar] [CrossRef] [Green Version]
- Sarker, M.; Alam, K.; Gow, J. Performance of rain-fed Aman rice yield in Bangladesh in the presence of climate change. Renew. Agric. Food Syst. 2019, 34, 304–312. [Google Scholar] [CrossRef]
- Rashid, H.E. Geography of Bangladesh; University Press: Dhaka, Bangladesh, 1991. [Google Scholar]
- Bangladesh Bureau of Statistics. Statistical Year Book of Bangladesh; Ministry of Planning, Government of the People’s Republic of Bangladesh: Dhaka, Bangladesh, 2014. [Google Scholar]
- BMD. Bangladesh Meteorological Department. Climate Data Library. Available online: http://iridl.ldeo.columbia.edu (accessed on 21 January 2020).
- WB. World Bank. World Development Indicators. Available online: https://datacatalog.worldbank.org/dataset/world-development-indicators (accessed on 19 December 2019).
- FAO-STAT. FAO Statistical Database. Available online: http://www.fao.org/faostat/en/#data (accessed on 19 December 2019).
- BARC. Bangladesh Agricultural Research Council. Climate Database: Climate Information Management System. Available online: http://climate.barcapps.gov.bd/dashboard (accessed on 26 November 2019).
- Moss, R.H.; Edmonds, J.A.; Hibbard, K.A.; Manning, M.R.; Rose, S.K.; Van Vuuren, D.P.; Meehl, G.A. The next generation of scenarios for climate change research and assessment. Nature 2010, 463, 747–756. [Google Scholar] [CrossRef]
- Van Vuuren, D.P.; Carter, T. Climate and socioeconomic scenarios for climate change research and assessment: Reconciling the new with the old. Clim. Chang. 2014, 122, 415–429. [Google Scholar] [CrossRef] [Green Version]
- O’Neill, B.C.; Kriegler, E.; Riahi, K.; Ebi, K.L.; Hallegatte, S.; Carter, T.R.; van Vuuren, D.P. A new scenario framework for climate change research: The concept of shared socioeconomic pathways. Clim. Chang. 2014, 122, 387–400. [Google Scholar] [CrossRef] [Green Version]
- Furuya, J.; Meyer, S.; Kageyama, M.; Jin, S. Development of supply and demand models of rice in lower mekong river basin countries: REMEW-Mekong. JIRCAS Work. Rep. 2010, 68, 91–117. [Google Scholar]
- Meyer, G.; Westhoff, P.; Binfield, J.; Kirsten, J.F. Model Closure and Price Formation under Switching Grain Market Regimes in South Africa. In Proceedings of the International Association of Agricultural Economist (lAAE) Conference, Gold Coast, QLD, Australia, 12–18 August 2006. [Google Scholar]
- Min, B.S.; Guna, R.B. Selecting appropriate methodological framework for time series data analysis. J. Financ. Data Sci. 2018, 4, 71–89. [Google Scholar] [CrossRef]
- Singha, U.; Maezawa, S. Production, marketing system, storage and future aspect of potato in Bangladesh. Rev. Agric. Sci. 2019, 7, 29–40. [Google Scholar] [CrossRef] [Green Version]
- Samanta, S.; Banerjee, S.; Mukherjee, A.; Patra, P.K.; Chakraborty, P.K. Determining the radiation use efficiency of potato using sunshine hour data: A simple and costless approach. SJAR 2020, 18, 2171–9292. [Google Scholar] [CrossRef]
- Adavi, Z.; Moradi, R.; Saeidnejad, A.H.; Tadayon, M.R.; Mansouri, H. Assessment of potato response to climate change and adaptation strategies. Sci. Hortic. 2018, 228, 91–102. [Google Scholar] [CrossRef]
- Rana, A.; Dua, V.K.; Chauhan, S.; Sharma, J. Climate change and potato productivity in Punjab—Impacts and adaptation. Potato Res. 2020, 63, 597–613. [Google Scholar] [CrossRef]
- Bangladesh Bureau of Statistics. Statistical Yearbook of Bangladesh; Ministry of Planning, Government of the People’s Republic of Bangladesh: Dhaka, Bangladesh, 2016. [Google Scholar]
- Li, Q.; Zhang, S. Impacts of recent climate change on potato yields at a provincial scale in northwest China. Agronomy 2020, 10, 426. [Google Scholar] [CrossRef] [Green Version]
- Shelley, I.; Takahashi-Nosaka, M.; Kano-Nakata, M.; Haque, M.S.; Inukai, Y. Rice cultivation in Bangladesh: Present scenario, problems, and prospects. J. Int. Coop. Agric. Dev. 2016, 14, 20–29. [Google Scholar] [CrossRef]
- Hajong, P.; Moniruzzaman, M.; Mia, M.I.A.; Rahman, M.M. Storage system of potato in Bangladesh. Uni. J. Agrl. Res. 2014, 2, 11–17. [Google Scholar] [CrossRef]
- Hall, C.; Brooker, J.; Eastwood, D.; Epperson, J.; Estes, E.; Woods, T. A marketing systems approach to removing distribution barriers confronting small-volume fruit and vegetable growers. Choices 2006, 21, 259–264. [Google Scholar]
- BIDA. Bangladesh Investment Development Authority. Potato processing. Publications on Agribusiness, potato: 1–7, Government of People’s Republic of Bangladesh. 2016. Available online: www.bida.gov.bd (accessed on 13 January 2021).
- Scott, B.; Ho, S.H.; Daniel, M.; Hwan, K.M.; Oh, K.B.; Su, C.Y.; Seob, L.D.; Hoon, K.T.; Duk, H.; Phil, K.K.; et al. Korean Agricultural Simulation Model and Livestock Quarterly Model; Food and Agricultural Policy Research Institute, University of Missouri (FAPRI-MU): Columbia, MO, USA, 2008; Available online: http://repository.krei.re.kr/handle/2018.oak/15373 (accessed on 17 February 2021).
- Exchange Rate, 2010. US Dollar to Bangladesh Taka Spot Exchange Rates for 2010. Available online: https://www.exchangerates.org.uk/USD-BDT-spot-exchange-rates-history-2010.html (accessed on 12 December 2010).
- Hoegh-Guldberg, O.; Jacob, D.; Taylor, M.; Bindi, M.; Brown, S.; Camilloni, I.; Diedhiou, A.; Djalante, R.; Ebi, K.L.; Engelbrecht, F.; et al. Impacts of 1.5 °C global warming on natural and human systems. In Global Warming of 1.5°C. An IPCC Special Report on the Impacts of Global Warming of 1.5°C Above Pre-Industrial Levels and Related Global Greenhouse Gas Emission Pathways, in the Context of Strengthening the Global Response to the Threat of Climate Change, Sustainable Development, and Efforts to Eradicate Poverty; Masson-Delmotte, V., Zhai, P., Pörtner, H.-O., Roberts, D., Skea, J., Shukla, P.R., Pirani, A., Moufouma-Okia, W., Péan, C., Pidcock, R., et al., Eds.; Korea Rural Economic Institute: Seoul, Korea, 2018; In Press. [Google Scholar]
- Mendelsohn, R. The impact of climate change on agriculture in developing countries. J. Nat. Resour. Policy Res. 2008, 1, 5–19. [Google Scholar] [CrossRef] [Green Version]
- Arora, N.K. Impact of climate change on agriculture production and its sustainable solutions. Environ. Sustain. 2019, 2, 95–96. [Google Scholar] [CrossRef] [Green Version]
- Haverkort, A.J.; Verhagen, A.; Grashoff, A.C.; Uithol, P.W.J. Potato-zoning: A decision support system on expanding the potato industry through agro-ecological zoning using the LINTUL simulation approach. In Decision Support Systems in Potato Production: Bringing Models to Practice; MacKerron, D.K.L., Haverkort, A.J., Eds.; Wageningen Academic: Wageningen, The Netherlands, 2004; pp. 29–44. [Google Scholar]
- Haverkort, A.J.; Verhagen, A. Climate change and its repercussions for the potato supply chain. Potato Res. 2008, 51, 223. [Google Scholar] [CrossRef]
- Colasante, A.; Palestrini, A.; Russo, A.; Gallegati, M. Adaptive expectations versus rational expectations: Evidence from the lab. Int. J. Forecast. 2017, 33, 988–1006. [Google Scholar] [CrossRef]
- Fei, C.J.; McCarl, B.A.; Thayer, A.W. Estimating the impacts of climate change and potential adaptation strategies on cereal grains in the United States. Front. Ecol. Evol. 2017, 5. [Google Scholar] [CrossRef] [Green Version]
- Arısoy, H.; Bayramoğlu, Z. Determination of the effect of price fluctuations on producer income—The case of potatoes. Turk. J. Agric. Food Sci. Technol. 2017, 5, 1342–1349. [Google Scholar] [CrossRef] [Green Version]
- Bor, O.; Ismihan, M.; Bayaner, A. Asymmetry in farm-retail price transmission in the Turkish fluid milk market. New Medit. 2014, 13, 2–8. Available online: http://www.iamb.it/share/img_new_medit_articoli/975_02bor.pdf (accessed on 19 November 2020).
- Tridge. Top Producing Countries of Potato. 2021. Available online: https://www.tridge.com/intelligences/potato/production (accessed on 1 April 2021).
- The Financial Express. Drive to Increase Potato Exports Reaches Landmark. 2020. Available online: https://www.thefinancialexpress.com.bd/trade/drive-to-increase-potato-exports-reaches-landmark-1584275314 (accessed on 30 November 2020).
- Sujan, H.; Islam, F.; Kazal, M.; Mondal, R. Profitability and resource use efficiency of potato cultivation in Munshiganj district of Bangladesh. SAARC J. Agric. 2018, 15, 193–206. [Google Scholar] [CrossRef] [Green Version]
- The Daily Star. Potato Glut Badly Hurts Growers. 2019. Available online: https://www.thedailystar.net/backpage/potato-production-in-bangladesh-glut-badly-hurts-growers-1748572 (accessed on 30 November 2020).
- Raymundo, R.; Asseng, S.; Robertson, R.; Petsakos, A.; Hoogenboom, G.; Quiroz, R.; Hareau, G.; Wolf, J. Climate change impact on global potato production. Eur. J. Agron. 2018, 100, 87–98. [Google Scholar] [CrossRef]
- Deena, C.M.; Hayath, C.A. Problems and prospects of potato cultivation in Bangladesh. Asian Bus. Consort. 2015, 5, 28–32. [Google Scholar] [CrossRef] [Green Version]
- Körner, C. Plant CO2 responses: An issue of definition, time and resource supply. New Phytol. 2006, 172, 393–411. [Google Scholar] [CrossRef]
- Kaminski, K.P.; Kørup, K.; Nielsen, K.L.; Liu, F.; Topbjerg, H.B.; Kirk, H.G.; Andersen, M.N. Gas-exchange, water use efficiency, and yield responses of elite potato (Solanum tuberosum L.) cultivars to changes in atmospheric carbon dioxide concentration, temperature, and relative humidity. Agric Meteorol. 2014, 187, 36–45. [Google Scholar] [CrossRef] [Green Version]
- FAO. GIEWS—Global Information and Early Warning System; Country Brief: Dhaka, Bangladesh, 2008. [Google Scholar]
| Climate Zones | Climate Variable | AdjR2 DW | ||||
|---|---|---|---|---|---|---|
| Nov. | Dec. | Jan. | Feb. | Mar. | ||
| SE | −0.336TMP ** (−2.40) | −0.005RAF ** (−1.80) −0.052SLR *** (−6.17) | 0.75 2.65 | |||
| NE | −0.246TMP ** (−2.38) | −0.023RAF *** (−3.58) −0.023SLR * (−1.69) | 0.55 2.16 | |||
| N | −0.022RAF ** (−2.35) | −0.771TMP *** (−3.20) | −0.032SLR * (−1.69) | 0.56 2.36 | ||
| NW | −0.170TMP * (−1.68) −0.028RAF *** (−3.6) | −0.048SLR ** (−3.17) | 0.67 2.12 | |||
| W | −0.233TEMP * (−1.70) | −0.012RAF ** (−2.3) −0.031SLR * (−1.68) | 0.60 1.89 | |||
| SW | −0.042SLR (−1.83) | −0.027RAF * (−1.67) | −0.567TMP ** (−2.57) | 0.47 2.40 | ||
| SC | −0.014RAF ** (−1.92) | −0.514TMP *** (−5.20) | 0.55 2.22 | |||
| Climate Zones | A (t − 1) | FP (t − 1) | Climate Variable | AdjR2 | ||||
|---|---|---|---|---|---|---|---|---|
| Nov. (t − 1) | Dec. (t − 1) | Jan. (t − 1) | Feb. (t − 1) | Mar. (t − 1) | ||||
| SE | 0.43 *** (3.38) [0.55] | 0.13 * (1.61) [0.11] | −688.71TMP ** (−2.65) [−1.67] | −16.77RAF ** (−2.40) [−0.04] −70.01SLR *** (−3.54) [−1.45] | 0.71 | |||
| NE | 0.32 *** (3.52) [0.31] | 0.06 * (1.84) [0.09] | −266.63TMP *** (−3.41) [−0.92] | −12.387SLR ** (−2.31) [−0.39] | 0.86 | |||
| N | 0.36 * (1.74) [0.32] | 0.53 * (1.66) [0.10] | −1181.40TMP ** (−2.75) [−0.59] −132.28SLR * (−2.41) [−0.52] | 0.69 | ||||
| NW | 0.30 ** (1.78) [0.26] | 0.51 ** (1.51) [0.07] | −133.96SLR * (−1.66) [−0.28] | −1593.89TMP *** (−2.35) [−0.37] −133.57RAF ** (−1.79) [−0.01] | 0.65 | |||
| W | 0.16 ** (1.59) [0.14] | 0.40 ** (2.02) [0.10] | −1696.66TMP *** (−4.55) [−1.01] −75.68RAF *** (−2.03) [−0.019] | −81.95SLR (−1.90) [−0.47] | 0.76 | |||
| SW | 0.47 ** (3.67) [0.41] | 0.12 ** (1.52) [0.12] | −53.59RAF *** (−3.15) [−0.02] | −515.31TMP * (−1.86) [−0.87] −46.28SLR * (−1.99) [−0.63] | −24.65RAF ** (−2.70) [−0.06] | 0.78 | ||
| SC | 0.36 ** (2.39) [0.35] | 0.35 * (1.74) [0.04] | −38.83RAF * (−1.93) [−0.01] −107.63SLR ** (−2.49) [−0.20] | −891.12TMP ** (−2.52) [−0.28] | 0.65 | |||
| Equations | Variable Estimate | AdjR2 DW | |
|---|---|---|---|
| Import | −0.0040TQ *** (−4.64) | −0.107WPRt * (−1.71) | 0.81 2.20 |
| Food demand (per capita) | −0.00065FP *** (−6.78) [−0.298] | −0.5371rGDPPC ** (−2.55) [−1.193] | 0.79 1.97 |
Publisher’s Note: MDPI stays neutral with regard to jurisdictional claims in published maps and institutional affiliations. |
© 2021 by the authors. Licensee MDPI, Basel, Switzerland. This article is an open access article distributed under the terms and conditions of the Creative Commons Attribution (CC BY) license (https://creativecommons.org/licenses/by/4.0/).
Share and Cite
Jannat, A.; Ishikawa-Ishiwata, Y.; Furuya, J. Assessing the Impacts of Climate Variations on the Potato Production in Bangladesh: A Supply and Demand Model Approach. Sustainability 2021, 13, 5011. https://doi.org/10.3390/su13095011
Jannat A, Ishikawa-Ishiwata Y, Furuya J. Assessing the Impacts of Climate Variations on the Potato Production in Bangladesh: A Supply and Demand Model Approach. Sustainability. 2021; 13(9):5011. https://doi.org/10.3390/su13095011
Chicago/Turabian StyleJannat, Arifa, Yuki Ishikawa-Ishiwata, and Jun Furuya. 2021. "Assessing the Impacts of Climate Variations on the Potato Production in Bangladesh: A Supply and Demand Model Approach" Sustainability 13, no. 9: 5011. https://doi.org/10.3390/su13095011