Article

Environmental Problem Shifting Analysis of Pollution Control Units in a Coal-Fired Powerplant Based on Multiple Regression and LCA Methodology

by
Harnpon Phungrassami
and
Phairat Usubharatana
*
Excellence Center of Eco-Energy, Department of Chemical Engineering, Thammasat School of Engineering, Thammasat University, Khlong Nueng, Khlong Luang, Pathumthani 12120, Thailand
*
Author to whom correspondence should be addressed.
Sustainability 2021, 13(9), 5142; https://doi.org/10.3390/su13095142
Submission received: 23 March 2021 / Revised: 20 April 2021 / Accepted: 27 April 2021 / Published: 4 May 2021
(This article belongs to the Section Energy Sustainability)

Abstract

:
Coal-fired power generation leads to serious environmental pollution, such as air and water pollution; thus, pollution control or treatment is necessary. However, end-of-pipe treatments are still indispensable approaches to reducing environmental stress, and focusing on each in turn leads to pollutant-by-pollutant features. The present study applies the LCA method to reveal the total direct and indirect environmental impacts from increasing significant pollution control units for a coal-fired power plant. From the results, it was found that increasing the performance of CCS and FGD units may result in higher overall environmental impacts due to their energy costs. Greater energy requirements result in greater global warming potential, human toxicity, and terrestrial acidification effects. LNB & OFA, SCR, and ESP units did not cause any other significant environmental impacts, while activated carbon used in the ACI unit is an additional source of indirect terrestrial acidification. Water depletion effects must be considered when increasing the use of CCS units. Policy makers can use the data from the present study to establish sustainable directions to resolve environmental problems at the macro-economic scale.

1. Introduction

Electricity is a crucial factor for almost all human activities and has a significant role in economic development. The Enerdata Global Energy Statistical Yearbook 2017 shows that in 2016, global electricity consumption had risen after halting in 2015, although this increase was below the long-term growth trend. Non-OECD Asia (China, India, Indonesia, Thailand, etc.), as a region, is the second ranked region contributing to the increasing world electricity consumption. Among these, China contributes over half of that increase. [1]. The framework for climate and energy in 2030 has left many countries setting important goals to address climate change issues. Those involve reducing greenhouse gas emissions and other environmental impacts. Reducing the environmental impact of electricity production is essential due to its importance for primary energy demand.
Coal plays a vital role in electricity generation worldwide. Coal-fired power plants currently fuel 37% of the global electricity. Since 2000, the world has doubled its coal-fired power capacity to around 2045 gigawatts (GW) after an explosive growth in China and India. A further 200 GW is being built and 300 GW is planned [2]. Coal will still generate 22% of the world’s electricity in 2040, retaining coal’s position as the single largest source of electricity worldwide. The promise of cheap electricity to fuel economic growth has driven this expansion. Despite several decades of knowledge about cold-fired powerplant contribution to environmental damage, our economies still rely on it. Focusing on the environmental and health-related externalities [3,4] of coal combustion will likely not be sufficient to phase out coal.
Coal-fired power generation leads to serious environmental pollution, such as air, water, and noise pollution [5,6,7,8,9]. The emissions from the burned coal contain pollutants, such as sulfur dioxide (SO2), sulfur trioxide (SO3), nitrogen oxides (NOx), nitrous oxide (N2O), carbon dioxide (CO2), particulate matter (PM), mercury (Hg), trace metals, and radioactive nucleoids [10]. The ratio of the above emissions depends on the type of coal. The emission of gases such as SOx and NOx react with atmospheric air to create acidic compounds, which precipitate as acid rain. Particulate matter may cause asthma and chronic bronchitis [11]. Coal-fired powerplants are also considered as one of the largest anthropogenic sources of mercury emission into the atmosphere [12]. Due to its high volatility, persistence, and bio-accumulation, mercury has become one of the most important Hazardous Trace Elements (HTEs), causing a range of diseases [13,14]. Carbon dioxide and nitrous oxide, the main emissions from coal-fired powerplants, are Greenhouse Gases (GHG). The amount of production, depending on the type of coal, is between 23.7–28.5 g C per MJ [15]. Therefore, legislation is becoming more stringent, requiring power providers or utility companies to either construct state-of-the-art, advanced powerplants, or to retrofit pollution control technologies into existing facilities. Investment in pollution control technologies is necessary to ensure the continued and reliable supply of electricity while reducing detrimental environmental impacts.
Pollution control technologies can have an impact on emissions and water and energy consumption at the same time [16,17,18]. Limestone-gypsum wet Flue Gas Desulphurization (FGD), Selective Catalytic Reduction (SCR), and Electrostatic Precipitators (ESP) are the most mature and widely applied end-of-pipe treatment processes against SO2, NOx, soot, and ashes, respectively [19,20,21,22]. It is estimated that 1 kg of SO2 emission reduction is accompanied by an extra generation of 4.64 kg CO2 and 0.016 kg NOx. Meanwhile, 1 kg NOx emission reduction is accompanied by an extra generation of 1.88 kg CO2 and 0.008 kg SO2 [23]. The limestone-gypsum wet flue gas desulfurization technology (LGM) consumes a significant 60–80 t/h of water for a 600 MW generator, and also reduces boiler efficiency [24,25]. Most ammonia-based SCR systems use anhydrous ammonia (NH3) as the reducing agent. However, due to the hazards of storing and handling NH3, many systems use aqueous ammonia [26]. Energy is required to provide an electrical charge and to overcome the pressure drop in ESP. It also has significant roles for increasing the efficiency of ESP and Fabric Filters (FF) [27]. Most of the existing studies investigate CO2 post-combustion capture configurations as the most suitable choice for GHG controlling. Amine-based chemical absorption is the most widely investigated option since it is the most mature carbon capture and storage (CCS) technology at present [28]. Regeneration step of amine-based process imposes severe energy, environmental impact, and cost penalties [29,30,31]. Mercury in flue gas from coal-fired powerplant is present in three forms: elemental mercury (Hg0), oxidized mercury (Hg2+), and particulate-bound mercury (HgP) [32]. Hg2+ can be easily captured by wet FGD devices because of its high solubility in water. HgP can be removed via dust control units, such as electrostatic precipitators (ESP) or fabric filters (FF) [33]. Therefore, increasing or decreasing the efficiency of FGD and ESP would affect the amount of total mercury removal. Currently, the Activated Carbon Injection (ACI)-based adsorption process is considered as one of the most effective technologies for Hg0 removal because of its high removal efficiency [34,35]. Nevertheless, the main disadvantages of ACI adsorption technology include its high operation costs and adsorbent loss [36].
Nonetheless, end-of-pipe treatments are still an indispensable approach to reducing environmental stress and focusing on them individually would lead to “pollutant-by-pollutant” features [37]. While the underlying assumption of this approach is to protect the whole system by protecting its parts individually, the risk of the environmental problem shifting between these interlinked parts arises. Kim and van Asselt (2016) defined the problem shifting to occur when “a solution for one problem backfires and generates one or more new problems at different times or locations” [37]. Possibly the most prominent example of environmental problem shifting is the Montreal Protocol. By promoting the substitution of ozone-depleting substances with potent greenhouse gas emitting Hydrofluorocarbons (HFCs), the problems with regards to climate change are simply shifted. Another prominent example is the substitution of gasoline with biofuels, shifting the environmental impacts from greenhouse gas emissions towards inter-alia increased eutrophication and water consumption [38]. Capaz et al. (2020) pointed at “the environmental trade-offs” of promoting plant-based renewable jet fuels to decrease aviation emissions, showing that they cause higher terrestrial acidification and air pollution than kerosene [39]. Another example is the environmental impacts of ocean fertilization, which aims to enhance the oceans’ capacity as a carbon sink by stimulating the growth of plankton, but causes ocean acidification and disruptions of the global carbon cycle [40]. In addition, actions to mitigate environmental impacts often burden already-marginalized communities disproportionately, creating additional social problems out of environmental ones [41]. However, to increase its feasibility, this article focuses solely on environmental problem shifting.
Life Cycle Assessment (LCA) has been proved to be useful for formulating recommendations about systems to reduce the problem shifting issue [42]. Nevertheless, most of the existing research related to the environmental assessment of coal-fired powerplants using the LCA method have focused on comparing the environmental impacts of electricity production with different technologies [43,44,45]. Many LCA practitioners have only considered CCS due to growing climate change concerns [46,47,48,49]. Various efforts have been made to introduce the LCA methodology to assess pollutant end-of-pipe treatment, such as SCR and FGD [50,51]. However, while achievements have been made in assessing the environmental performance of end-of-pipe treatment processes, reliable results of their inter-independent relationships remain very limited. None of the previous studies mention problem shifting of emission control systems in coal-fired powerplants. The present study evaluates the overall environmental impact caused by changing the efficiency of various pollution control systems for coal-fired powerplants. This work reveals both positive and negative impacts on the system as a whole by modifying the operation of one unit. The research results will help environmental policymakers to better understand the overall environmental perspective and help the creation of appropriate policies and regulations.

2. Methodology

The objective of this research is to evaluate the overall environmental impact by the varying efficiency of pollution prevention systems in coal-fired powerplants, using the procedures of factorial design, linear regression, and the LCA method. The boundaries of this research cover two types of net 650 MW Pulverized Coal (PC) powerplants: supercritical and ultra-supercritical, both with and without carbon capture units. The considered pollution control units of the representative system are Low NOx burners and Over Fired Air (LNB & OFA), SCR, ESP, FGD, and ACI. The data used in the study were extracted from the Integrated Environmental Control Model (IECM). IECM was developed for the US Department of Energy’s National Energy Technology Laboratory (NETL) and has been used by various studies as an environmental and energy management tool for powerplants [52,53,54,55]. 
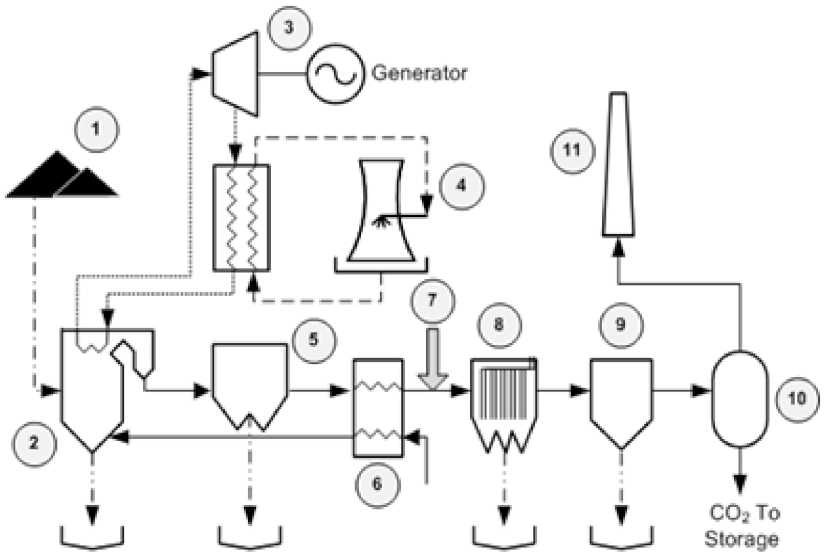
Figure 1 depicts the schematic model of the present study. Bituminous coal (1) is burned to generate heat in a furnace. (2) LNB replaces the upper coal nozzle of the standard two-nozzle cell burner with a secondary air-port. The LNB operates on the principle of staged combustion to reduce NOx emissions. Highly purified water which is pumped through pipes inside the furnace is turned into steam by the heat. Steam drives a turbine generator (3) to produce electricity which is fed to the transmission system. Cool water from the cooling tower (4) is pumped through a network of tubes running through the condenser. The cool water in the tubes converts the steam back into water to be used again by the plant. While fly ash is deposited from the furnace, flue gas is sent to the ammonia base SCR (5) to remove NOx. Hot flue gas is passed through the air heater (6), which transfers excess heat with input air before being sent to the ACI unit (7). Next, flue gas is sent to ESP (8), FGD (9), and CO2 post-combustion capture units, respectively, before being emitted from the stack (11).
Table 1, Table 2 and Table 3 presents the main configuration of the plant simulation.
The studied variables in this research were classified into independent and dependent variables, as shown in Table 4 and Table 5. The simulation was divided into four sets, based on the supercritical or ultra-supercritical systems, and either with or without the carbon capture unit. Full 2-level factorial design of individual interaction was applied to each set of the simulation to determine the number of simulation runs and independent variable for each run, using Design of Experiment (DOE) and the factorial design function of the Minitab software. The number of simulation runs for each simulation set are presented as a matrix in Table 6. Each simulation was processed using the IECM software by changing the independent variables (x1–x6) according to the DOE result. Each dependent variable (y1–y12) for each run was recorded. Multiple regression analysis was applied to generate relationships and their influence between the independent and dependent variables, using data analysis in the Excel software with a 95% confidence level. The regression results reveal the various coefficients of linear equation, which represent the influence of pollution controlling efficiency to raw material consumption and emission, as shown in Equation (1) to Equation (4):
y 1 = b 11 x 1 + b 12 x 2 + b 13 x 3 + + b 1 j x j + + b 1 n x n + c 1 y i = b i 1 x 1 + b i 2 x 2 + b i 3 x 3 + + b i j x j + + b i n x n + c i y m = b m 1 x 1 + b m 2 x 2 + b m 3 x 3 + + b m j x j + + b m n x n + c m
y i = j = 1 n ( b i j x j + c i )
Δ y i = j = 1 n ( b i j Δ x j + c i )
Δ y i j = b i j
where
y i = Dependent variable i
Δ y i = Total change of dependent variable i
Δ y i j = Shifting of dependent variable i per 1 percent changing of Δxj
x j = Independent variable j
Δ x j = Shifting of independent variable j
b i j = Regression coefficient
c i = Intersection i
m = Number of dependent variables
n = Number of independent variables.
The ISO/44 framework was adopted as the LCA methodology in this study. The goal of this study was to determine the influence of changing pollution control system efficiency on the environmental and human health impacts. The LCA inventory includes the related resources or energy inputs and the environmental emissions (dependent variable) from six pollution control units (LNB & OFA, SCR, ESP, FGD, ACI, and CCS). In this study, the impact of waste management is excluded. The reference flow of this study is 1 percent of the pollution control efficiency changes in a net 650 MW PC power plant. The regression coefficients of each run, b i j , which represent the effect of increasing 1 percent efficiency of pollution control unit j on the input–output variable i , were exported to the SimaPro LCA software for LCA analysis. The ReCiPe mid-point and end-point (H) V1.02 method—a recent and well-established model—was used to assess acidification (ADP), human toxicity (HT), particulate matter formation (PM), and water depletion (WD). For the climate change impact (GWP), IPCC 2007 GWP 100a V1.02 was used for the impact assessment. The total change of the environmental impact for any category k by changing the independent variable j can be evaluated using Equation (5):
Δ I k j = i = 1 m ( b i j × E F i k )
where
Δ I k j = Shifting of the environmental impact k per 1 percent change of Δxj
E F i k = Determined emission environmental impact factor of dependent variable i.

3. Results and Discussion

Table 7, Table 8, Table 9 and Table 10 show the regression results for all four of the studied scenarios. The coefficients in the tables show the relationships between the variable percentage for the removal of the pollution control units and the effects on the various dependent variables. In this case, the coefficients with a p-value greater than 0.05 were considered as a non-significant coefficient and assigned to be approximately zero ( 0). The final column indicates the maximum and minimum value of the associated dependent variable in the range of the independent variable. The minimum value for each dependent variable was obtained when the positive coefficients were at their minimum, while the negative coefficients were at their maximum. For instance, to minimize the electricity consumption of the ultra-supercritical powerplant with a CO2 capture unit, the removal percent of NOx control by SCR, PM, SO2, mercury, and CO2 should be set to 80, 95, 95, 0, and 90, respectively, while in the furnace, the NOx efficiency was 65. At first glance, the results in Table 7, Table 8, Table 9 and Table 10 indicate that for powerplants with carbon capture units—whether ultra-supercritical or supercritical—increasing the carbon dioxide removal percentage has positive impacts on almost every dependent variable. However, changing the removal percent of PM control unit ( b i , 3 ) is not significantly affect to dependent variables (excluded amount of PM emission, which changes according to the percentage removal), the removal percent of the furnace NOx control unit ( b i , 1 ) exhibiting a negative trend effect. Without a carbon capture unit, the most positive significant role-playing parameter was changing the percent removal of the FGD unit ( b i , 4 ), while the removal percent of the furnace NOx control unit ( b i , 1 ) still had negative effects on a few important dependent variables. However, the effect of changing the percent removal on all dependent variables was weaker when the supercritical plant was applied.
As mentioned in the results above, an increased CO2 removal percent results in increased use of powerplant resources. This means that some of the electrical energy generated by the powerplant is reduced (more own electricity consumption, b 1 , 6 ) due to a portion of heat from the coal combustion being drawn back to be used in the MEA regeneration column in the form of steam. Meanwhile, the decreasing electricity production when increasing the SOx removal percentage in the FGD unit ( b 1 , 4 ) was due to directly using the electricity produced by the powerplant. Since the MEA adsorption unit utilizes energy from steam for solvent regeneration, it is possible to observe the effect of CO2 removal percent on both coal and electricity consumption ( b 2 , 6 and b 2 , 6 ).
Increasing the efficiency of the in-furnace NOx control resulted in reduced ammonia consumption ( b 5 , 1 ) due to the reduced NOx removal burden at the SCR unit, which uses anhydrous ammonia (NH3) as the reducing agent solution. Additionally, increasing the efficiency of the in-furnace NOx control unit also resulted in a decreased amount of activated carbon used ( b 6 , 1 ) because activated carbon can absorb both mercury and NOx [61,62]. Generally, the remaining NOx from the in-furnace NOx control and SCR unit, presented in the ACI unit, is the mercury’s competitive substance, which causes additional activated carbon requirements. Moreover, the in-furnace NOx control unit uses a very small amount of energy ( b 1 , 1 ) compared to others unit; therefore, the electricity saving effect can be evidently observed. On the other hand, the NOx reduction by using the SCR unit efficiently to reduce NOx consumes more electricity and ammonia ( b 1 , 2 and b 5 , 2 ). Increasing the efficiency of the SCR unit reduces both NOx and SO2 ( b 10 , 2 and b 9 , 2 ). Consequently, the amount of limestone used in the FGD unit also decreased as the SO2 load decreased. The amount of activated carbon in this case did not decrease because the increased electricity consumption generated more mercury and more activated carbon usage.
With the CO2 capture scenario, increasing the FGD efficiency resulted in decreased MEA ( b 4 , 4 ) and makeup water consumption ( b 7 , 4 ), which are both used in the CO2 absorption unit. These results can be explained by some of the CO2 also being absorbed by the limestone [63]. The consequence of using activated carbon for mercury removal is the possibility of small particles at the micron level being blown out from the ACI unit to the ESP unit. These small particles interfere with the ESP system and increase the removal load, resulting in the remaining PM being released into the atmosphere.
Shifting of environmental impact k according to a percent changing of variable j can be calculated using Equation (5). The emission factor of the 12 dependent variables are shown in Table 11. The results of each impact category for every scenario are summarized in Figure 2, Figure 3, Figure 4, Figure 5 and Figure 6.

3.1. Global Warming Potential (GWP)

From the results, it is very clear that enhancement of the carbon dioxide capture unit results in a net decrease of the global warming impact. With the amine system of the CO2 capture unit for both the ultra-super critical and super critical scenario, more than five tons of CO2 emission was reduced per one percent of removal efficiency increasing. Scenarios 3 and 4 are not represented in Figure 2, since those cases did not have a carbon dioxide capture unit. The results of this research also reveal that efforts to reduce the environmental global warming impact through the use of amine systems can create others indirect environmental impacts. This is largely due to the high energy penalty from the equivalent electricity consumed in the solvent regeneration reboiler column. Powerplants require greater coal consumption to compensate for the energy used in this process; thus, the global warming effect from acquiring and burning the larger amount of coal required releases more GHGs into the atmosphere. Another indirect source of the global warming impact of carbon dioxide capture units is the amount of amine solution added into the system, which increases as the load of carbon dioxide increases. Although the effects of this amine solution are relatively low compared to electricity and coal, they can be avoided. The aforementioned indirect impact is about 25% of the amount that can be directly captured by a carbon capture unit. For the global warming impact from the mercury capture process by activated carbon, it was found that increased activated carbon consumption resulted in a significant, indirect global warming impact, while the effect of energy usage is not singificant. Meanwhile, the energy used to enhance the efficiency of SO2 removal by the FGD unit is also a global warming impact source. Nonetheless, increasing the efficiency of the FGD unit also contributes to reduce trivial global warming impacts, since reduced levels of sulfur dioxide in the exhaust gas entering the carbon dioxide capture system reduces the use of the amine solution usage, and subsequently, indirectly diminishes the global warming impact. It is clear that increasing the efficiency of the remaining units has almost no effect on global warming.

3.2. Human Toxicity (HT)

Mercury had the most significant role in affecting human toxicity. Increasing the efficiency of the mercury capture of ACI unit could reduce the impact of 400–500 kg per percentage increase in efficiency. However, obtaining the activated carbon used in this process also brought an additional human toxicity impact, about 1/3 of the total impact. The aforementioned results are consistent with many studies which indicated that the production of activated carbon potentially impacts the environment, especially in terms of human toxicity [64,65,66]. Increasing the carbon capture performance also affects the human toxicity impact due to the increased amount of coal required and the surplus electric power usage. There is no obvious side effect of human toxicity impact when increasing the performance of the other remaining units.

3.3. Particulate Matter (PM)

Increasing particulate matter control efficiency in the ESP unit does not create an additional PM impact, while increasing the efficiency of mercury removal directly results in increasing this impact. Since NOx is a component that causes the PM impact, increasing the efficiency of NOx removal deducts the environmental impact on the PM impact as well. Since NOx is a component that causes the PM impact, increasing the efficiency of NOx removal reduces the environmental impact on PM impact as well. Additionally, the same behavior occurs with the case of FGD units, since SO2 is also cause of PM impact.

3.4. Acidification Potential (ADP)

Both SO2 and NOx in flue gas have potential acidification impacts on the environment. Therefore, increasing the efficiency of those gas removal units—LNB & OFA, SCR, and FGD—directly affects the acidification impact. Yet, based on the fact that the acidification impact per unit mass of gas SO2 is greater than gas NOx, efforts to reduce SO2 have more noticeable effects than reducing NOx for this impact aspect. The capture of mercury and carbon dioxide indirectly affects the acidity in the atmosphere through the process of obtaining and utilizing activated carbon, coal, and electricity.

3.5. Water Depletion (WD)

Among the pollution control units, CCS units had the most direct water consumption unit, therefore increasing the efficiency of the CCS units directly affects the WD problem. Yet, it can be seen that small amounts of water depletion reduced when increasing the performance in the LNB & OFA, SCR, and FGD units. Enhancing the capacity of those units also meant removing the burden of energy requirement, as SO2 and NOx can be absorbed by the MEA solvent.

3.6. End-Point Impact Analysis (Pt)

To compare how increasing the performance of various pollution control units affects the overall environmental aspects simultaneously, end-point analysis using the ReCiPe method was applied to the mid-point result. Since it can be seen that the thermal efficiency of the ultra-supercritical powerplants is better than the supercritical powerplants, only the results for the ultra-supercritical powerplants with a carbon capture unit are shown in Figure 7. After normalization and weighing, all the mid-point impact unit dimensions were converted into identical unit—Point (Pt)—so that they could be combined. It is evident that increasing the efficiency of pollution control units, in addition to directly reducing the environmental impact of their primary functions, also affects other indirect environmental impacts. The overall environmental impact (black bars in Figure 7) is an indicator of whether pollution control units are environmentally friendly, from the perspective of the considered environmental aspects. For the LNB & OFA and SCR units, in addition to directly reducing the environmental impact of terrestrial acidification, the units can also reduce particulate matter. Moreover, increasing their efficiency has less impact on other environmental aspects, making their overall environmental impact low. In the case of the ESP unit, its direct function (PM capture) is the only thing that reduced its environmental impact. Similar to the LNB & OFA and SCR units, the operation of the ESP unit did not cause any other consequential environmental impacts. The main function of the FDG unit is to reduce the human toxicity impact, yet it is inevitable that it can cause other effects, including a global warming potential and acidification potential due to its higher energy requirement. This result is the reverse of the carbon capture unit, which has a key function of reducing global warming, but in turn, human toxicity, acidification, and particulate matter effects are unavoidable. A similar outcome of both units is that they produce higher overall environmental impacts. For mercury capture units, increasing its efficiency directly reduces the human toxicity impact and other indirect disadvantages from activated carbon acquisition and particulate matter, which account for around 20%. However, there are no results for the pollution control units which indicate a water depletion impact, since the normalization value of water depletion using the ReCiPe method is zero.

3.7. Economic Analysis

From the results mentioned above, control units in which the problem shifting clearly occurred were FGD and CCS. While FGD and other remaining control units are still requirement due to the emission control law and regulation, it is not for the CCS unit. The economic point of view is another aspect that stakeholders should know before deciding whether the CCS unit is still required. Table 12 is the annual cost comparison of ultra-supercritical with and without carbon capture unit. It can be concluded from the data that the total annual cost of a plant with a CCS unit is more expansive than a plant without CCS, almost 90%. This difference could be smaller if a carbon tax is considered. Additional expenses are not only directly from CCS, but is also from additional burden on other control units. It can be seen that about 20–30% of the costs increase in the ESP and FGD units. This increased expenditure can be divided into three categories: fixed O&M, variable O&M, and annualized capital. Among these, annualized capital is major while fixed O&M is minor. It can imply that other impacts from the construction phase and acquisition of construction materials, excluded from this study, are also significant potential to be consider. This results also show that the boundary of problem shifting is not only limited to the environmental aspect, but also to other aspects, i.e., the economic aspect.

4. Conclusions

Pollution prevention units are necessary for coal-fired powerplants. Each unit has a primary function to reduce one environmental aspect. Increasing the efficiency of those pollution control units can reduce the environmental impact further, yet there is a tradeoff since increasing that performance has greater other environmental impacts that should be considered. Increasing the performance of the CCS and FGD units resulted in higher overall environmental impacts due to their energy penalties. The ACI unit can reduce the human toxicity effects, but it also increases the particulate matter and has greater impacts from activated carbon production. Therefore, it can be seen that the environmental assessment using the LCA method provides a comprehensive overview of the impact, which is better than considering only the direct impacts. If this methodology is applied to other processes rather than a coal-fired power plant with pollution control units, it will provide additional information about the indirect environmental impacts. This will provide policymakers with the opportunity to establish sustainable directions for environmental problem solving at the macro-economic scale.

Author Contributions

H.P. and P.U. substantially contributed in conceptualization, methodology, formal analysis, original draft preparation, and supervision. All authors have read and agreed to the published version of the manuscript.

Funding

This research was supported by Thammasat School of Engineering, Thammasat University.

Institutional Review Board Statement

Not applicable.

Informed Consent Statement

Not applicable.

Data Availability Statement

The datasets generated during and analysed during the current study are not publicly available due to restrictions of publishing the database from Licensed Software, but are available from the corresponding author on reasonable request.

Acknowledgments

The authors gratefully acknowledge the financial support provided by Thammasat School of Engineering, Thammasat University.

Conflicts of Interest

The authors declare no conflict of interest.

References

  1. Enerdata. Global Energy Statistical Yearbook. 2017. Available online: https://yearbook.enerdata.net/electricity/electricity-domestic-consumption-data.html (accessed on 31 January 2018).
  2. Li, M.; Zhang, D.; Li, C.-T.; Selin, N.E.; Karplus, V.J. Co-benefits of China’s climate policy for air quality and human health in China and transboundary regions in 2030. Environ. Res. Lett. 2019, 14, 084006. [Google Scholar] [CrossRef]
  3. Muller, N.Z.; Mendelsohn, R.; Nordhaus, W.D. Environmental Accounting for Pollution in the United States Economy. Am. Econ. Rev. 2011, 101, 1649–1675. [Google Scholar] [CrossRef] [Green Version]
  4. Jakob, M.; Steckel, J.C.; Jotzo, F.; Sovacool, B.K.; Cornelsen, L.; Chandra, R.; Edenhofer, O.; Holden, C.; Löschel, A.; Nace, T.; et al. The future of coal in a carbon-constrained climate. Nat. Clim. Chang. 2020, 10, 704–707. [Google Scholar] [CrossRef]
  5. Andrae, A.; Ab, S.K. Comparative screening life cycle impact assessment of renewable and fossil power supply for a radio base station site. Int. J. Green Technol. 2015, 1, 21–34. [Google Scholar] [CrossRef] [Green Version]
  6. Cristóbal, J.; Guillén-Gosálbez, G.; Jiménez, L.; Irabien, A. Optimization of global and local pollution control in electricity production from coal burning. Appl. Energy 2012, 92, 369–378. [Google Scholar] [CrossRef]
  7. Rigotto, R.M. The inclusion of health in environmental impact studies: Case report of a coal-fired power plant in Ceará State. Ciên. Saúde Colet. 2009, 14, 2049–2059. [Google Scholar] [CrossRef] [PubMed]
  8. Song, Q.; Li, J. Greenhouse gas emissions from the usage of typical e-products by households: A case study of China. Clim. Chang. 2015, 132, 615–629. [Google Scholar] [CrossRef]
  9. Zhou, J.S.; Luo, Z.Y.; Zhu, Y.Q.; Fang, M.X. Mercury Emission and its Controlling Pollutants in Coal-Fired Power Plants in China. In Advanced Topics in Science and Technology in China; Springer: Berlin, Germany, 2013. [Google Scholar]
  10. Shahzad, B.K.; Yousaf, M. Coal Fired Power Plants: Emission Problems and Controlling Techniques. J. Earth Sci. Clim. Chang. 2017, 8, 404. [Google Scholar] [CrossRef] [Green Version]
  11. Grahame, T.J.; Schlesinger, R.B. Health Effects of Airborne Particulate Matter: Do We Know Enough to Consider Regulating Specific Particle Types or Sources? Inhal. Toxicol. 2007, 19, 457–481. [Google Scholar] [CrossRef] [PubMed]
  12. Information Collection Request. Available online: http://www.epa.gov/ttn/atw/utility/utilitypg.html (accessed on 13 March 2019).
  13. Ribeiro, J.; Taffarel, S.R.; Sampaio, C.H.; Flores, D.; Silva, L.F. Mineral speciation and fate of some hazardous contaminants in coal waste pile from anthracite mining in Portugal. Int. J. Coal Geol. 2013, 109–110, 15–23. [Google Scholar] [CrossRef]
  14. Tian, H.Z.; Lu, L.; Hao, J.M.; Gao, J.J.; Cheng, K.; Liu, K.Y.; Qiu, P.P.; Zhu, C.Y. A Review of Key Hazardous Trace Elements in Chinese Coals: Abundance, Occurrence, Behavior during Coal Combustion and Their Environmental Impacts. Energy Fuels 2013, 27, 601–614. [Google Scholar] [CrossRef]
  15. GAINS. Greenhouse Gas and Air Pollution Interactions and Synergies - South Asia Program; International Institute of Applied Systems Analysis: Laxenburg, Austria, 2012; Available online: https://iiasa.ac.at/web/home/research/researchPrograms/air/Asia.html (accessed on 27 April 2019).
  16. Feeley, T.J.; Skone, T.J.; Stiegel, G.J.; McNemar, A.; Nemeth, M.; Schimmoller, B.; Murphy, J.T.; Manfredo, L. Water: A critical resource in the thermoelectric power industry. Energy 2008, 33, 1–11. [Google Scholar] [CrossRef]
  17. Wang, Z.; Cen, K.; Zhou, J.; Fan, J. Application and Economic Analysis of the Multi-Pollutants Removal Technology Incor-porated with Ozone Oxidization and Alkali Solution Adsorption. In Simultaneous Multi-Pollutants Removal in Flue Gas by Ozone; Springer: Berlin/Heidelberg, Germany, 2014; pp. 95–106. [Google Scholar]
  18. Wu, X.; Wu, K.; Zhang, Y.; Hong, Q.; Zheng, C.; Gao, X.; Cen, K. Comparative life cycle assessment and economic analysis of typical flue-gas cleaning processes of coal-fired power plants in China. J. Clean. Prod. 2017, 142, 3236–3242. [Google Scholar] [CrossRef]
  19. Córdoba, P. Status of Flue Gas Desulphurisation (FGD) systems from coal-fired power plants: Overview of the physic-chemical control processes of wet limestone FGDs. Fuel 2015, 144, 274–286. [Google Scholar] [CrossRef]
  20. Franco, A.; Diaz, A.R. The future challenges for “clean coal technologies”: Joining efficiency increase and pollutant emission control. Energy 2009, 34, 348–354. [Google Scholar] [CrossRef] [Green Version]
  21. Han, J.; Wang, L.; Li, J. Selection and application of technology of high efficient removal for flue gas of coal-fired power plant. J. Environ. Sci. Manag. 2011, 36, 86–89. Available online: http://search.cnki.net/down/default.aspx?filename=BFHJ201101024&dbcode=CJFD&year=2011&dflag=pdfdown (accessed on 2 September 2019).
  22. Pui, D.Y.; Chen, S.-C.; Zuo, Z. PM2.5 in China: Measurements, sources, visibility and health effects, and mitigation. Particuology 2014, 13, 1–26. [Google Scholar] [CrossRef]
  23. Mao, X.; Zeng, A.; Hu, T.; Xing, Y.; Zhou, J.; Liu, Z. Co-control of local air pollutants and CO2 from the Chinese coal-fired power industry. J. Clean. Prod. 2014, 67, 220–227. [Google Scholar] [CrossRef]
  24. Ma, S.; Chai, J.; Jiao, K.; Ma, L.; Zhu, S.; Wu, K. Environmental influence and countermeasures for high humidity flue gas discharging from power plants. Renew. Sustain. Energy Rev. 2017, 73, 225–235. [Google Scholar] [CrossRef]
  25. Xiong, Y.; Niu, Y.; Wang, X.; Tan, H. Pilot Study on In-depth Water Saving and Heat Recovery from Tail Flue Gas in Lignite-fired Power Plant. Energy Procedia 2014, 61, 2558–2561. [Google Scholar] [CrossRef] [Green Version]
  26. Wu, J. The development and application of SCR denitrification technology in power plant. In IOP Conference Series: Earth and Environmental Science; IOP Publishing: Bristol, UK, 2017; Volume 100, p. 12033. [Google Scholar]
  27. Moretti, A.L.; Jones, C.S. Advanced Emissions Control Technologies for Coal-Fired Power Plants. Presented at Power-Gen Asia, Bangkok, Thailand. 2012. Available online: https://andymaypetrophysicist.files.wordpress.com/2017/01/advanced_emissions_control_coal_br-1886.pdf (accessed on 30 June 2019).
  28. Fang, J.; Jin, X.; Huang, K. Life cycle analysis of a combined CO2 capture and conversion membrane reactor. J. Membr. Sci. 2018, 549, 142–150. [Google Scholar] [CrossRef]
  29. Thitakamol, B.; Veawab, A.; Aroonwilas, A. Environmental impacts of absorption-based CO2 capture unit for post-combustion treatment of flue gas from coal-fired power plant. Int. J. Greenh. Gas. Control. 2007, 1, 318–342. [Google Scholar] [CrossRef]
  30. Mores, P.; Scenna, N.; Mussati, S. Post-combustion CO2 capture process: Equilibrium stage mathematical model of the chemical absorption of CO2 into monoethanolamine (MEA) aqueous solution. Chem. Eng. Res. Des. 2011, 89, 1587–1599. [Google Scholar] [CrossRef]
  31. Rodríguez, N.; Mussati, S.; Scenna, N.J. Optimization of post-combustion CO2 process using DEA–MDEA mixtures. Chem. Eng. Res. Des. 2011, 89, 1763–1773. [Google Scholar] [CrossRef]
  32. Zhao, B.; Yi, H.; Tang, X.; Li, Q.; Liu, D.; Gao, F. Copper modified activated coke for mercury removal from coal-fired flue gas. Chem. Eng. J. 2016, 286, 585–593. [Google Scholar] [CrossRef]
  33. Du, W.; Yin, L.; Zhuo, Y.; Xu, Q.; Zhang, L.; Chen, C. Performance of CuOx-neutral Al2O3 sorbents on mercury removal from simulated coal combustion flue gas. Fuel Process. Technol. 2015, 131, 403–408. [Google Scholar] [CrossRef]
  34. Liu, Y.X.; Zhang, J.; Sheng, C.D.; Zhang, Y.C.; Yuan, S.J. New research progress in sorbents for removal of mercury in coal-fired flue gas. Mod. Chem. Ind. 2008, 11, 19–25. Available online: https://pay.cnki.net/zscsdoc/download?flag=cnkispace&plat=cnkispace&filename=XDHG200811003&dbtype=CJFD&year=2008&dtype=pdf (accessed on 5 June 2019).
  35. Zheng, Y.; Jensen, A.D.; Windelin, C.; Jensen, F. Dynamic measurement of mercury adsorption and oxidation on activated carbon in simulated cement kiln flue gas. Fuel 2012, 93, 649–657. [Google Scholar] [CrossRef]
  36. Tan, Z.Q.; Sun, L.S.; Xiang, J.; Zeng, H.C.; Liu, Z.H.; Hu, S.; Qiu, J.R. Gas-phase elemental mercury removal by novel carbon-based sorbents. Carbon 2012, 50, 362–371. [Google Scholar] [CrossRef]
  37. Kim, R.E. Global governance: Problem shifting in the Anthropocene and the limits of international law. In Research Handbook on International Law and Natural Resources; Morgera, E., Kulovesi, K., Eds.; Edward Elgar Publishing: Cheltenham, UK, 2016. [Google Scholar]
  38. Yang, Y.; Bae, J.; Kim, J.; Suh, S. Replacing Gasoline with Corn Ethanol Results in Significant Environmental Problem-Shifting. Environ. Sci. Technol. 2012, 46, 3671–3678. [Google Scholar] [CrossRef] [PubMed]
  39. Capaz, R.S.; de Medeiros, E.M.; Falco, D.G.; Seabra, J.E.; Osseweijer, P.; Posada, J.A. Environmental trade-offs of renewable jet fuels in Brazil: Beyond the carbon footprint. Sci. Total. Environ. 2020, 714, 136696. [Google Scholar] [CrossRef]
  40. Williamson, P.; Wallace, D.W.; Law, C.S.; Boyd, P.W.; Collos, Y.; Croot, P.; Denman, K.; Riebesell, U.; Takeda, S.; Vivian, C. Ocean fertilization for geoengineering: A review of effectiveness, environmental impacts and emerging governance. Process. Saf. Environ. Prot. 2012, 90, 475–488. [Google Scholar] [CrossRef]
  41. Jones, N. Safeguarding Against Environmental Injustice: 1.5 °C Scenarios, Negative Emissions, and Unintended Consequences. Carbon Clim. Law Rev. 2018, 12, 23–30. [Google Scholar] [CrossRef]
  42. Xue, B.; Mitchell, B.; Geng, Y.; Ren, W.; Müller, K.; Ma, Z.; de Oliveira, J.A.P.; Fujita, T.; Tobias, M. A review on China’s pollutant emissions reduction assessment. Ecol. Indic. 2014, 38, 272–278. [Google Scholar] [CrossRef]
  43. Pehnt, M.; Henkel, J. Life cycle assessment of carbon dioxide capture and storage from lignite power plants. Int. J. Greenh. Gas. Control. 2009, 3, 49–66. [Google Scholar] [CrossRef]
  44. Sebastián, F.; Royo, J.; Gómez, M. Cofiring versus biomass-fired power plants: GHG (Greenhouse Gases) emissions savings comparison by means of LCA (Life Cycle Assessment) methodology. Energy 2011, 36, 2029–2037. [Google Scholar] [CrossRef]
  45. Oró, E.; Gil, A.; de Gracia, A.; Boer, D.; Cabeza, L.F. Comparative life cycle assessment of thermal energy storage systems for solar power plants. Renew. Energy 2012, 44, 166–173. [Google Scholar] [CrossRef]
  46. Hondo, H. Life cycle GHG emission analysis of power generation systems: Japanese case. Energy 2005, 30, 2042–2056. [Google Scholar] [CrossRef]
  47. Odeh, N.A.; Cockerill, T.T. Life cycle GHG assessment of fossil fuel power plants with carbon capture and storage. Energy Policy 2008, 36, 367–380. [Google Scholar] [CrossRef]
  48. Schakel, W.; Meerman, H.; Talaei, A.; Ramírez, A.; Faaij, A. Comparative life cycle assessment of biomass co-firing plants with carbon capture and storage. Appl. Energy 2014, 131, 441–467. [Google Scholar] [CrossRef]
  49. Viebahn, P.; Vallentin, D.; Höller, S. Prospects of carbon capture and storage (CCS) in India’s power sector—An integrated assessment. Appl. Energy 2014, 117, 62–75. [Google Scholar] [CrossRef] [Green Version]
  50. Van Caneghem, J.; De Greef, J.; Block, C.; Vandecasteele, C. NOx reduction in waste incinerators by selective catalytic reduction (SCR) instead of selective non catalytic reduction (SNCR) compared from a life cycle perspective: A case study. J. Clean. Prod. 2016, 112, 4452–4460. [Google Scholar] [CrossRef]
  51. Feng, C.; Gao, X.; Tang, Y.; Zhang, Y. Comparative life cycle environmental assessment of flue gas desulphurization technologies in China. J. Clean. Prod. 2014, 68, 81–92. [Google Scholar] [CrossRef]
  52. Mantripragada, H.C.; Zhai, H.; Rubin, E.S. Boundary Dam or Petra Nova—Which is a better model for CCS energy supply? Int. J. Greenh. Gas. Control. 2019, 82, 59–68. [Google Scholar] [CrossRef]
  53. Zhai, H.; Rubin, E.S. Systems Analysis of Physical Absorption of CO2 in Ionic Liquids for Pre-Combustion Carbon Capture. Environ. Sci. Technol. 2018, 52, 4996–5004. [Google Scholar] [CrossRef] [PubMed]
  54. Zhai, H.; Rubin, E.S. A Techno-Economic Assessment of Hybrid Cooling Systems for Coal- and Natural-Gas-Fired Power Plants with and without Carbon Capture and Storage. Environ. Sci. Technol. 2016, 50, 4127–4134. [Google Scholar] [CrossRef] [PubMed]
  55. Zhai, H.; Ou, Y.; Rubin, E.S. Opportunities for Decarbonizing Existing U.S. Coal-Fired Power Plants via CO2 Capture, Utilization and Storage. Environ. Sci. Technol. 2015, 49, 7571–7579. [Google Scholar] [CrossRef] [PubMed]
  56. Bell, R.D.; Buckingham, F.P. An overview of technologies for reduction of oxides of nitrogen from combustion furnaces. Alexandria: MPR Assoc 8 (2010): 2016. Available online: http://www.mrp.com/uploads/news/nox-reduction-coal-fired.pdf (accessed on 4 March 2019).
  57. Sorrels, J.L.; Randall, D.D.; Schaffner, K.S.; Fry, C.R. Selective Catalytic Reduction. In EPA Air Pollution Control Cost Manual; 2019. Available online: https://www3.epa.gov/ttn/ecas/docs/SCRCostManualchapter7thEdition_2016.pdf (accessed on 4 August 2019).
  58. United States Environmental Protection Agency, US.EPA. CAM Protocol for an ESP controlling PM from a Coal-Fired Boiler. 2016. Available online: https://www3.epa.gov/ttnemc01/cam/espcam.pdf (accessed on 4 March 2019).
  59. Air, P. Advanced Technologies for the Control of Sulfur Dioxide Emissions from Coal-Fired Boilers. 1999. Available online: https://pdfs.semanticscholar.org/4196/36dada5f3d2a235b99b834ebefb5a2f01d4a.pdf (accessed on 4 March 2019).
  60. Tan, L.; Shariff, A.; Lau, K.; Bustam, M. Factors affecting CO2 absorption efficiency in packed column: A review. J. Ind. Eng. Chem. 2012, 18, 1874–1883. [Google Scholar] [CrossRef]
  61. Rezaei, F.; Rownaghi, A.A.; Monjezi, S.; Lively, R.P.; Jones, C.W. SOx/NOx Removal from Flue Gas Streams by Solid Adsorbents: A Review of Current Challenges and Future Directions. Energy Fuels 2015, 29, 5467–5486. [Google Scholar] [CrossRef]
  62. Bamdad, H.; Hawboldt, K.; MacQuarrie, S. A review on common adsorbents for acid gases removal: Focus on biochar. Renew. Sustain. Energy Rev. 2018, 81, 1705–1720. [Google Scholar] [CrossRef]
  63. Valverde, J.; Sanchez-Jimenez, P.; Perez-Maqueda, L. Ca-looping for postcombustion CO2 capture: A comparative analysis on the performances of dolomite and limestone. Appl. Energy 2015, 138, 202–215. [Google Scholar] [CrossRef] [Green Version]
  64. Alade, A.O.; Amuda, O.S.; Bello, M.O. Life Cycle Inventory Analysis (LCIA) of production of activated carbons from selected agricultural materials. Pollution 2012, 44, 7275–7279. Available online: https://www.researchgate.net/publication/272973462_Life_Cycle_Inventory_Analysis_LCIA_of_production_of_activated_carbons_from_selected_agricultural_materials (accessed on 5 July 2019).
  65. Hjaila, K.; Baccar, R.; Sarrà, M.; Gasol, C.; Blánquez, P. Environmental impact associated with activated carbon preparation from olive-waste cake via life cycle assessment. J. Environ. Manag. 2013, 130, 242–247. [Google Scholar] [CrossRef] [PubMed]
  66. Yahya, M.A.; Al-Qodah, Z.; Ngah, C.Z. Agricultural bio-waste materials as potential sustainable precursors used for activated carbon production: A review. Renew. Sustain. Energy Rev. 2015, 46, 218–235. [Google Scholar] [CrossRef]
Figure 1. Plant configuration.
Sustainability 13 05142 g001
Figure 2. GWP impact of each pollution control unit per increasing percent of performance.
Sustainability 13 05142 g002
Figure 3. HT impact of each pollution control unit per increasing percent of performance.
Sustainability 13 05142 g003
Figure 4. PM impact of each pollution control unit per increasing percent of performance.
Sustainability 13 05142 g004
Figure 5. ADP impact of each pollution control unit per increasing percent of performance.
Sustainability 13 05142 g005
Figure 6. WD impact of each pollution control unit per increasing percent of performance.
Sustainability 13 05142 g006
Figure 7. End-point analysis of each pollution control unit.
Sustainability 13 05142 g007
Table 1. Plant design configuration.
Combustion Controls
Fuel Type CoalCoal
NOx ControlIn-Furnace Controls
Post-Combustion Controls
NOx ControlHot-Side SCR
MercuryCarbon Injection
ParticulatesCold-Side ESP
SO2 ControlWet FGD
CO2 CaptureAmine System
Water and Solids Management
Cooling SystemWet Cooling Tower
WastewaterAsh Pond
Fly Ash DisposalNo Mixing
Table 2. Overall plant performance.
Gross Electrical Output (MW)650
Capacity Factor (%)85
Ambient Air Temp. (°C)27.91
Ambient Pressure (MPa)0.1013
Relative Humidity (%)73
Table 3. Coal properties.
Coal RankSub-Bituminous
Coal NameWyodak-Anderson
High Heating Value (kJ/kg)1.96 × 104
Carbon (wt%)49.21
Hydrogen (wt%)3.51
Oxygen (wt%)11.67
Sulfur (wt%)0.45
Nitrogen (wt%)0.73
Ash (wt%)6.31
Moisture (wt%)28.09
Table 4. Independent variables.
Independent VariableRange (Min–Max), A or N/A
x1Efficiency of in-furnace NOx control system (%) [56]60–65
x2Efficiency of NOx control by SCR (%) [57] 80–90
x3Efficiency of PM control by ESP (%) [58]95–99.9
x4Efficiency of SO2 control by FGD (%) [59]95–98
x5Mercury control by carbon injection (%)N/A * or completely removed
x6Efficiency of CO2 control by MEA absorption (%) [60]A* or N/A, 90–96
* A is available. N/A is not available.
Table 5. Dependent variables.
Dependent VariableUnit
Input
y1Electrical consumptionMW
y2Coal consumptionton/h
y3Limestone consumptionton/h
y4MEA consumptionton/h
y5Ammonia consumption ton/h
y6Activated carbon consumptionton/h
y7Makeup waterton/h
Output
y8CO2 emissionkg/h
y9SO2 emissionkg/h
y10NO2 emissionkg/h
y11PM emissionkg/h
y12Mercury emissionkg/h
Table 6. Simulation sets and runs.
Type of SystemNumber of Independent Variable/Number of Runs
With Carbon Capture UnitWithout Carbon Capture Unit
Supercritical6/64 (Set 1)5/32 (Set 3)
Ultra-supercritical6/64 (Set 2)5/32 (Set 4)
Table 7. Regression coefficient of an ultra-supercritical powerplant with a CO2 capture unit.
Dependent Variablebi,1bi,2bi,3bi,4bi,5bi,6Interc.Max/Min
y1 (MW)−8.1 × 10−33.4 × 10−31.6 × 10−11.51.3 × 10−11.2−1.2 × 102149.3/162.0
y2 (T/h) 0 0 0 0 01.42.2 × 102347.5/355.8
y3 (T/h)4.5 × 10−4−6.7 × 10⁻⁴ 04.8 × 10⁻² 01.8 × 10⁻²−1.64.482/4.743
y4 (T/h)−4.5 × 10−4 0 0−2.6 × 10⁻² 01.9 × 10−22.31.392/1.585
y5 (T/h)−8.3 × 10−33.7 × 10−3 0 0 01.2 × 10−34.1 × 10−10.2737/0.3592
y6 (T/h)−1.1 × 10−55.4 × 10−6 02.8 × 10−61.5 × 10−19.5 × 10⁻⁴−4.4 × 10−20.0424/0.2021
y7 (kg/h)−1.3 × 10−16.4 × 10−2 0−1.9 × 10⁻¹ 07.91.4 × 1032052/2102
y8 (kg/h)9.1 × 10−1−3.6 × 10⁻¹ 01.0 0−6.2 × 1036.2 × 10525,737/62,845
y9 (kg/h)−4.6 × 10−48.7 × 10−45.2 × 10⁻⁵−4.1 × 10−22.6 × 10−41.5 × 10−34.20.3233/0.4683
y10 (kg/h)−3.9−9.8 01.3 × 10⁻³ 05.8 × 10−11.2 × 10390.09/210.8
y11 (kg/h) 0 0−3.9 × 101 09.8 × 10−14.0 × 10−13.9 × 1033.871/200.1
y12 (kg/h) 0 0 0 0−8.9 × 10−34.5 × 10−51.2 × 10−20.0069/0.0161
Table 8. Regression coefficient of a supercritical powerplant with a CO2 capture unit.
Dependent Variablebi,1bi,2bi,3bi,4bi,5bi,6Interc.Max/Min
y1(MW)−5.0 × 10−32.5 × 10−31.6 × 10−11.71.3 × 10−11.4−1.4 × 102166.9/181.4
y2 (T/h)5.0 × 10−3−2.5 × 10⁻³ 0 0 01.82.3 × 102391.7/402.3
y3 (T/h)4.5 × 10−4−7.0 × 10⁻⁴ 05.4 × 10⁻² 02.3 × 10⁻²−2.15.053/5.362
y4 (T/h)−5.5 × 10−4 0 0−2.9 × 10⁻² 02.2 × 10−22.51.569/1.793
y5 (T/h)−9.4 × 10−34.1 × 10−3 0 0 01.6 × 10−34.4 × 10−10.3083/0.4061
y6 (T/h)−1.2 × 10−56.0 × 10−6 08.3 × 10−71.7 × 10−11.1 × 10⁻³−5.6 × 10−20.0478/0.2285
y7 (kg/h)−1.3 × 10−16.3 × 10−2 0−2.0 × 10⁻¹ 01.1 × 1011.5 × 1032494/2561
y8 (kg/h)8.8 × 10−1−4.4 × 10⁻¹ 01.7 0−7.0 × 1037.0 × 10529,099/70,844
y9 (kg/h)−5.2 × 10−49.8 × 10−45.9 × 10⁻⁵−4.7 × 10−22.9 × 10−41.9 × 10−34.70.3645/0.5294
y10 (kg/h)−4.4−1.1 × 101 01.1 × 10⁻³ 07.3 × 10−11.3 × 103101.58/238.36
y11 (kg/h) 0 0−4.4 × 101 01.15.0 × 10−14.4 × 1034.364/226.3
y12 (kg/h) 0 0 0 0−1.0 × 10−25.8 × 10−51.3 × 10−20.0078/0.0182
Table 9. Regression coefficient of an ultra-supercritical powerplant without a CO2 capture unit.
Dependent Variablebi,1bi,2bi,3bi,4bi,5Interc.Max/Min
y1 (MW) 0 01.6 × 10−11.28.8 × 10−2−7.9 × 10146.8/51.2
y2 (T/h) 0 0 0 0 02.7 × 102273.5
y3 (T/h)2.5 × 10−4−4.2 × 10⁻⁴ 03.7 × 10⁻² 02.8 × 10−23.528/3.645
y4 (T/h)-------/-
y5 (T/h)−6.5 × 10−32.8 × 10−3 0 0 04.1 × 10−10.2154/0.2761
y6 (T/h)−5.0 × 10−62.5 × 10−6 0 01.2 × 10−11.0 × 10−40/0.1197
y7 (kg/h) 0 0 0 0 01.4 × 1031461/1459
y8 (kg/h) 0 0 0 0 04.9 × 105494,567/494,550
y9 (kg/h)−6.4 × 10−21.3 × 10−1 0−2.1 × 101 02.1 × 10350.90/116.20
y10 (kg/h)−3.1−7.7 0 0 09.6 × 10271.77/164.12
y11 (kg/h) 0 0−6.1 × 101 01.56.1 × 1036.094/307.6
y12 (kg/h) 0 0 0 0−6.9 × 10−31.2 × 10−20.0054/0.0124
Table 10. Regression coefficient of an ultra-supercritical powerplant without a CO2 capture unit.
Dependent Variablebi,1bi,2bi,3bi,4bi,5Interc.Max/Min
y1 (MW) 0 01.6 × 10−11.31.0 × 10−1−8.5 × 10151.3/55.9
y2 (T/h) 0 0 0 0 03.0 × 102300.2
y3 (T/h)3.0 × 10−4−5.0 × 10⁻⁴ 04.1 × 10⁻² 05.1 × 10−23.872/4.0
y4 (T/h)-------/-
y5 (T/h)−7.1 × 10−33.1 × 10−3 0 0 04.5 × 10−10.2363/0.3030
y6 (T/h)−1.0 × 10−55.0 × 10−6 0 01.3 × 10−12.0 × 10−40/1314
y7 (kg/h) 0 0 0 0 01.6 × 1031631/1627
y8 (kg/h) 0 0 0 0 05.4 × 105542,824/542,809
y9 (kg/h)−7.0 × 10−21.4 × 10−1 0−2.3 × 101 02.3 × 10355.87/127.54
y10 (kg/h)−3.4−8.4 0 0 01.1 × 10378.77/180.13
y11 (kg/h) 0 0−6.7 × 101 01.76.7 × 1036.689/337.6
y12 (kg/h) 0 0 0 0−7.6 × 10−31.4 × 10−20.0060/0.0136
Table 11. Emission factor of the dependent variables.
Dependent
Variable
GWP
kg CO2-eq
HT
kg 1,4-DB-eq
PM
kg PM10-eq
ADP
kg SO2-eq
WD
m3
Per Unit
y16.1 × 1022.4 × 10−42.3 × 10−17.2 × 10−20MWh
y21.6 × 1025.6 × 1019.7 × 10−23.6 × 10⁻¹⁰ton
y36.55.3 × 10−18.7 × 10−33.2 × 10−20ton
y43.4 × 1038.7 × 1024.01.3 × 1011.0 × 101ton
y53.1 × 10203.4 × 10−29.0 × 10⁻²⁰ton
y63.0 × 1031.2 × 10305.0 × 1010ton
y700001.0ton
y81.00000kg
y9002.0 × 10−11.00kg
y10002.2 × 10−15.6 × 10⁻¹⁰kg
y11001.000kg
y1205.7 × 104000kg
Table 12. Comparison of the overall ultra-supercritical plant cost with and without a CCS unit.
UnitFixed O&M *Variable O&MAnnulized CapitalTotal Annual Cost
M$/yr **
ww/oww/oww/oww/o
LNB & OFA0.1390.139001.0481.0481.1871.187
SCR0.8480.7512.3861.6023.7143.0976.9485.45
ACI0.0860.0860.0340.0210.0090.0110.1290.118
ESP1.0390.9623.5082.5115.7264.59010.278.063
FGD11.249.81214.357.35820.1116.7145.7033.88
CCS18.98098.11080.300187.40
Base Plant26.6823.9345.3164.68117.3101.4189.3190
Land00000.1140.1140.1140.114
Total59.0135.68163.776.17228.3126.9451238.8
* Operation and Maintenance, ** Million dollar per year.
Publisher’s Note: MDPI stays neutral with regard to jurisdictional claims in published maps and institutional affiliations.

