Article

Understanding the Spread of COVID-19 in China: Spatial–Temporal Characteristics, Risk Analysis and the Impact of the Quarantine of Hubei Province on the Railway Transportation Network

1
School of Public Administration, Inner Mongolia University, Hohhot 010070, China
2
Institute of Geographic Sciences and Natural Resources Research, Chinese Academy of Sciences, Beijing 100101, China
*
Author to whom correspondence should be addressed.
Sustainability 2021, 13(9), 5163; https://doi.org/10.3390/su13095163
Submission received: 1 April 2021 / Revised: 30 April 2021 / Accepted: 3 May 2021 / Published: 5 May 2021

Abstract

:
The rapid spread of COVID-19 and its global growth constitutes an international public-health emergency, posing a serious threat to global health, safety, and social economy. In this paper, we systematically studied the temporal and spatial characteristics of COVID-19, infectivity, and the impact of Hubei province’s quarantine on the national railway system on the basis of epidemic and national train data. This study found the following: (1) The overall growth of the epidemic was exponential, and the outbreak of Hubei had a strong spread in the eastern and southern directions. The epidemic was generally more serious in the capital or developed cities in each province, and the epidemic outside Hubei was under control after the imported growth ended. (2) On the basis of analyzing the disturbance of the spread of the epidemic by traffic control, the average incubation period of COVID-19 was approximately 4 days. The ratio of the number of cured people to the number of deaths gradually increased, indicating that, given sufficient medical service, the cure rate can be greatly improved. (3) The quarantine of Hubei had greater impact on cities with higher centrality, especially in the Yangtze River Delta region, and smaller impact on the overall connectivity of the national railway network. For local people, quarantine had great impact on the outflow of local people to neighboring provinces.

1. Introduction

Wuhan is the capital of the province Hubei and is located in the central region of China. It is an important transportation hub that connects important domestic transportation routes in China. On 31 December 2019, the Wuhan Municipal Health Commission issued the first report of the pneumonia epidemic of the new coronavirus infection (COVID-19). After that, the epidemic quickly spread from Wuhan to the whole of China and the entire globe. The outbreak of COVID-19 hugely impacted individuals, countries, and the world as a whole. Wuhan limited the inflow and outflow of people on 23 January 2020, and cities in Hubei were then successively sealed off. Each province in China successively initiated a first-level response to the major public-health emergency. On 31 January, the World Health Organization announced COVID-19 as a public-health emergency of international concern. On 8 April 2020, the Wuhan leaving control was officially lifted, providing important results in epidemic prevention and control, and marking a new stage in the defense of Hubei and Wuhan.
Scholars have launched a series of exploratory studies on COVID-19. The first type of study is related to bioinformatics, including viral RNA sequence detection, viral genetic analysis, and viral host research [1,2]. For example, Zhang et al. (2020) suggested that intermediate hosts of COVID-19 may be mammals and birds, and the new inserted sequences observed in the spike protein are naturally evolved from bat coronaviruses [3]. The second type focuses on clinical treatment, including the properties and clinical characteristics of infected people, the effects of antiviral drugs, mechanical ventilation, or traditional Chinese medicine [4]. For example, Guan et al. conducted statistical analysis of 1099 clinical cases, and found that the median incubation period of COVID-19 was 4 days and the longest was 24 days [5]. Clinical diagnosis characteristics were analyzed, such as the computed-tomography (CT) examination of individual infected patients. Epidemiological research is the third category. Many scholars employed SIR or SEIR models to simulate the spread of the epidemic, focusing on its development trend, growth rate, and inflection point [6]. However, the majority of studies were bottom–up and clinical statistical analyses based on limited samples, with differing conclusions. For example, the basic regeneration number of COVID-19 was stated as either 3.24 or 2.2 [7,8,9,10,11].
Scholars have also attempted to explore the spread of the epidemic from the perspective of geography. For example, Kuchler et al. (2020) forecast the geographic spread of communicable COVID-19 in the USA and Italy on the basis of social-media analysis, and found that areas with stronger social ties to early COVID-19 “hotspots” had more confirmed COVID-19 cases [12]. Engle et al. (2020) found that an increase in the local infection rate from 0% to 0.003% was associated with a mobility reduction of 10.2% in the United States [13]. Gilbert et al. (2020) focused on African countries and estimated the risk of importing COVID-19, and found that risks associated with local infections had been highly underestimated [14]. Christidis and Christodoulou (2020) assessed the risk of spreading COVID-19 outside China and found that the risk for countries with a low number of passengers from Hubei appeared to be low [15]. Several researchers used compartmental metapopulation models for making predictions about the extent of the arrival of COVID-19 in different regions [16,17].
At the same time, some studies in China on dissemination risk in the early stage of the spread of the pandemic were also conducted. For example, Wei (2020), Zhang (2020), and Xiang (2020) used Baidu migration data to review or simulate the spatial trend of the development of the epidemic from the perspective of population outflow [18,19,20]. Liu (2020) analyzed the relationship between population mobility, transportation links, business tourism, the development level, and the number of confirmed diagnoses in each province with a regression model, and found that the regression coefficient of the impact of traffic on the spread of the epidemic was negative. Stops via Wuhan were not highly problematic [21]. Du et al. (2020) discussed the impact of the epidemic on the connectivity of China’s international aviation network and regional differences from the perspective of global aviation networks [22]. Scholars were also concerned about the spread of the epidemic in a particular province or region. For example, Miao (2020) analyzed the spatiotemporal characteristics of the spread of the epidemic in the province of Henan [23]; Wang et al. (2020) analyzed the temporal and spatial evolution, and the risks of the epidemic in the province of Shaanxi [24]; Liu (2020) discussed the characteristics of the spread of the epidemic in the province of Guangdong, and suggested scientifically dividing risk-prevention and control areas within the province, and implementing hierarchical control [25].
Studies in relation to the relationships between traffic and the epidemic situation are far from systematic. When the epidemic broke out in Wuhan (an important transportation hub of China), Hubei, it was just at the peak of the Spring Festival travel hush. Therefore, what the relationships between epidemic spread and traffic impact exactly are remains underexplored. The limited inflow and outflow of people of Wuhan and even the province of Hubei were part of the largest isolation in history to prevent the spread of infectious diseases. How effective was such a major measure in preventing and controlling the epidemic? In turn, how did it affect the transportation of the entire country? With these concerns, in this article, we systematically analyzed the spatiotemporal characteristics, hazards, and the growth trend of the spread of COVID-19 from a macroscopic and full-sample perspective, so as to provide a comprehensive understanding for epidemic prevention and control in China and abroad.

2. Data and Methods

2.1. Study Areas and Data Sources

The study area of this paper was China, where the COVID-19 epidemic broke out, including the mainland and Hong Kong, Macao, and Taiwan. The data of COVID-19 cases were derived from the National Health and Health Commission, provincial and municipal health committees, provincial and municipal governments, and the official channels of Hong Kong, Macao, and Taiwan. Hubei was the birthplace of the epidemic and the most seriously affected area in China. In order to more clearly show the information, the counties directly governed by Hubei are separately listed. Official Wuhan channels, as early as 31 December 2019, reported 27 confirmed cases of COVID-19. It was not until 15 January 2020 that regular infection reporting began. Other cities began reporting COVID-19 infections as early as 19 January 2020 (five cases in Beijing and one case in Shenzhen). Therefore, this article uses data from 20 January 2020, as the Wuhan leaving control was officially lifted on 8 April.
Transportation is regarded to be an important channel of spreading an epidemic, as human mobility has become increasingly dependent on it. Among all modes of transportation, the railway is one of the main choices for interregional travel in China, especially for medium-to-long-distance travel. In 2019, China’s railway passenger turnover was 1470.66 billion person-km, while those of civil aviation and highway were 1170.51 billion and 885.71 billion person-km, respectively (Statistical Bulletin of National Economic and Social Development, 2019. http://www.stats.gov.cn/tjsj/zxfb/202002/t20200228_1728913.html (accessed on 2 March 2021)). Flight is point-to-point transportation, and the Hubei quarantine did not affect basic intercity aviation traffic links outside of Hubei. Usually, road transportation does not require official unified scheduling, and drivers can adjust the route by themselves. Railway transportation was, therefore, most severely affected by the lockdown of Hubei. Hubei plays a major role in the Chinese railway network, bridging both the north–south and the east–west parts of China. This study, therefore, focused on the impact of the lockdown of Hubei on railway transportation. Railway data were derived from the official website of the China National Railway Group Co., Ltd. (Beijing, China, https://www.12306.cn/index/ (accessed on 10 October 2019)), including all passenger train times and route site information. Figure 1 shows the railway transport network and the main node cities, i.e., provincial capitals and municipalities.

2.2. Main Research Methods

In this paper, we studied the change in the connectivity of the national railway network after Hubei was sealed off using the complex-network analysis method. Complex networks have small-world properties and nonscaleable characteristics between fully regular and fully random networks [26]. Abstracting China’s train operation network into a network G:
G = ( V ,   E ) ,
where V = {vi: i = 1, 2, …, n}, vi is a node of the network (vertices), n represents the number of nodes, E = {ei: 1, 2, …, m}, ei is an edge, and m represents the number of edges. The above network can be represented by an n-order matrix (An · n). When there is a direct connection (no transfer required) between cities i and j, the two are connected, corresponding to matrix elements aij = 1 or aij = 0.

2.2.1. Node-Degree Centrality

The centrality of the network node refers to the number of edges that the node shares with other nodes [27], which characterizes the importance of the node in the network [28] and reflects the connectivity of the node in the network. The evaluation method of node centrality is as follows:
D i = j = 1 n a i j ,
where aij is an element in Matrix A.

2.2.2. Average Network Path Length

Average path length (L) is the average length of the shortest path between all nodes [29]:
L = 1 1 2 n ( n 1 ) i > j l i j ,
where lij characterizes the length of the shortest path between nodes i and j.

2.2.3. Overall Network Characteristic Evaluation Index

To reflect the overall characteristics of the network, network diameter, beta index, or gamma index can also be used. The diameter of the network refers to the longest of the shortest paths between nodes. The beta index refers to the average number of edges per node, i.e., the total number of edges divided by the total number of nodes. The gamma index refers to the actual number of edges of the network divided by the maximum possible number of edges. The larger the beta and gamma indices are, the better the connectivity of the network is.

3. Analysis of Temporal and Spatial Processes of Epidemic Growth

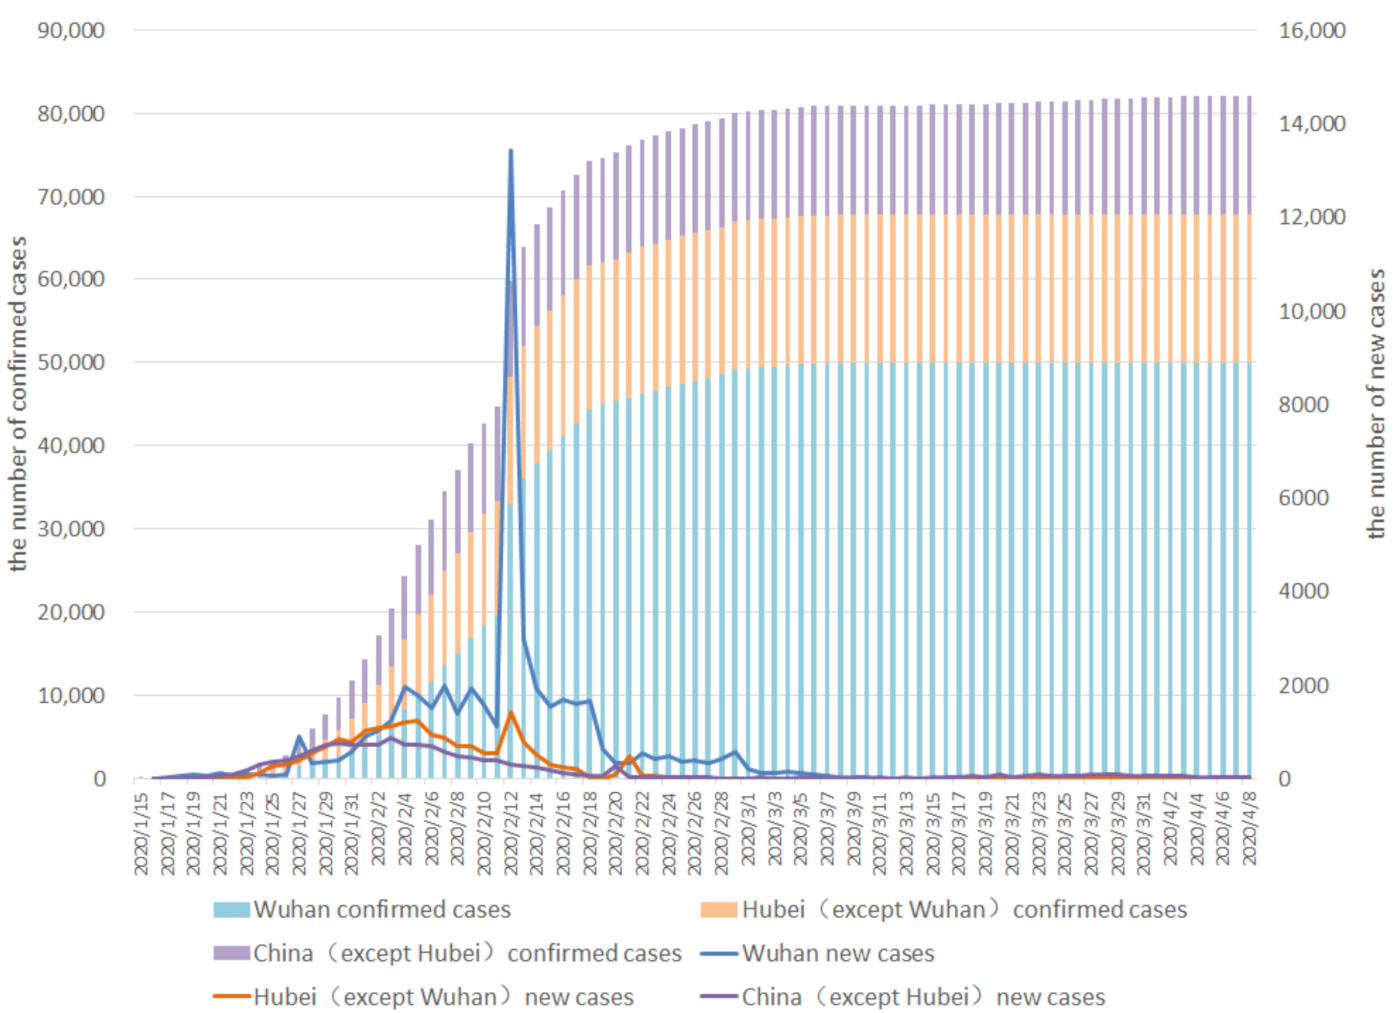
3.1. The Epidemic Situation Showed an S-Shaped Curve

As of 00:00 on 8 April, a total of 82,133 confirmed cases were reported nationwide, of which the number of cases suddenly rose sharply as a result of changes in the statistical caliber due to the clinical diagnosis being included in the diagnosis on 12 February. Figure 2 shows that new confirmed cases in Wuhan and Hubei were fluctuating at high levels from early February, with other areas outside Hubei falling for 16 consecutive days from 3 February. Overall, the epidemic in Wuhan was still relatively severe in April, and the control of the epidemic in other regions began to show initial results.
Looking at the overall national epidemic situation, the growth rate continued to rise at the beginning and then declined, and the epidemic showed an S-shaped curve, which was in line with the logistic distribution law. We used a 3-parameter logistic function to fit: y = b1/(1 + exp(−b2 × (t − b3))); results are shown in Table 1. We adjusted R2 to 0.9988.

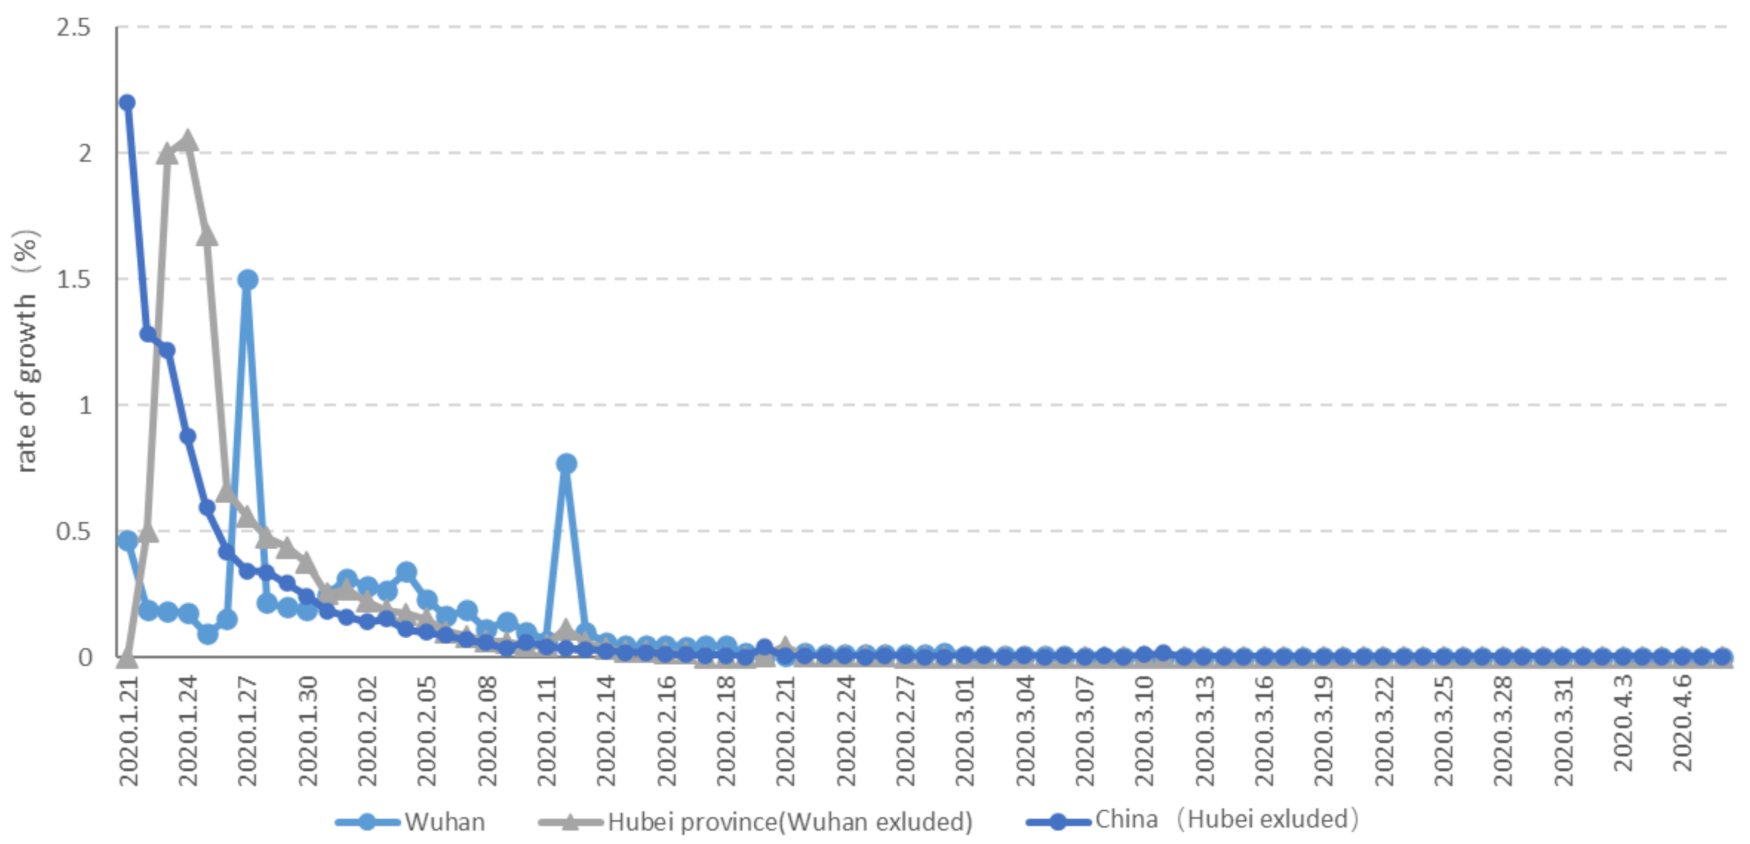
3.2. Epidemic Growth Rate in Hubei Declined Steadily after 12 February

The inflection point of epidemic growth is an important time point for the development of the epidemic, that is, the point where the epidemic is controlled and growth begins to slow down. The estimation of the inflection point generally uses the increment per unit time, that is, the derivative of the cumulative total of confirmed diagnoses with respect to time. However, for an epidemic that is in line with exponential growth, the growth of its cases is greatly affected by the base number. Even with a daily increase in new cases, the growth rate may have slowed down. Therefore, we used the day-on-day growth rate of confirmed cases (i.e., the ratio of newly confirmed cases daily to the total number of confirmed cases the day before) to respectively analyze the development stages and turning points of the epidemic situation in Wuhan, Hubei (except Wuhan), and regions outside of Hubei (Figure 2).
As shown in Figure 3, the growth rate in Wuhan greatly fluctuated. The day-to-day growth rate experienced two substantial increases on 27 January and 12 February 2020. On the one hand, this was due to the rapid increase in the number of infected people in Wuhan, and with limited medical resources, it was difficult to effectively respond. On the other hand, the diagnostic criteria changed. Other regions in Hubei peaked on day-on-day growth on 24 January, and then declined, but also fluctuated once on 12 February. In areas outside of Hubei, the day-to-day growth rate of confirmed cases declined rapidly and stabilized after 27 January. The reason is that cases outside Hubei during this period were dominated by imported first-generation cases. As the base number continued to increase, the growth rate inevitably decreased. Later, due to the quarantine of Wuhan, the epidemic situation in areas outside Hubei became spread states, and the continued decline in the epidemic growth rate showed that epidemic prevention and control measures played a strong role. After that, the epidemic did not deteriorate further.
On the basis of the above analysis, epidemic situations in Wuhan, Hubei (excluding Wuhan), and China (excluding Hubei) showed overall improvement after mid-February. The growth rate of China (excluding Hubei) showed a downward trend, indicating that the epidemic was under control. The epidemics in Wuhan and Hubei (excluding Wuhan) greatly fluctuated, but declined steadily after 12 February.

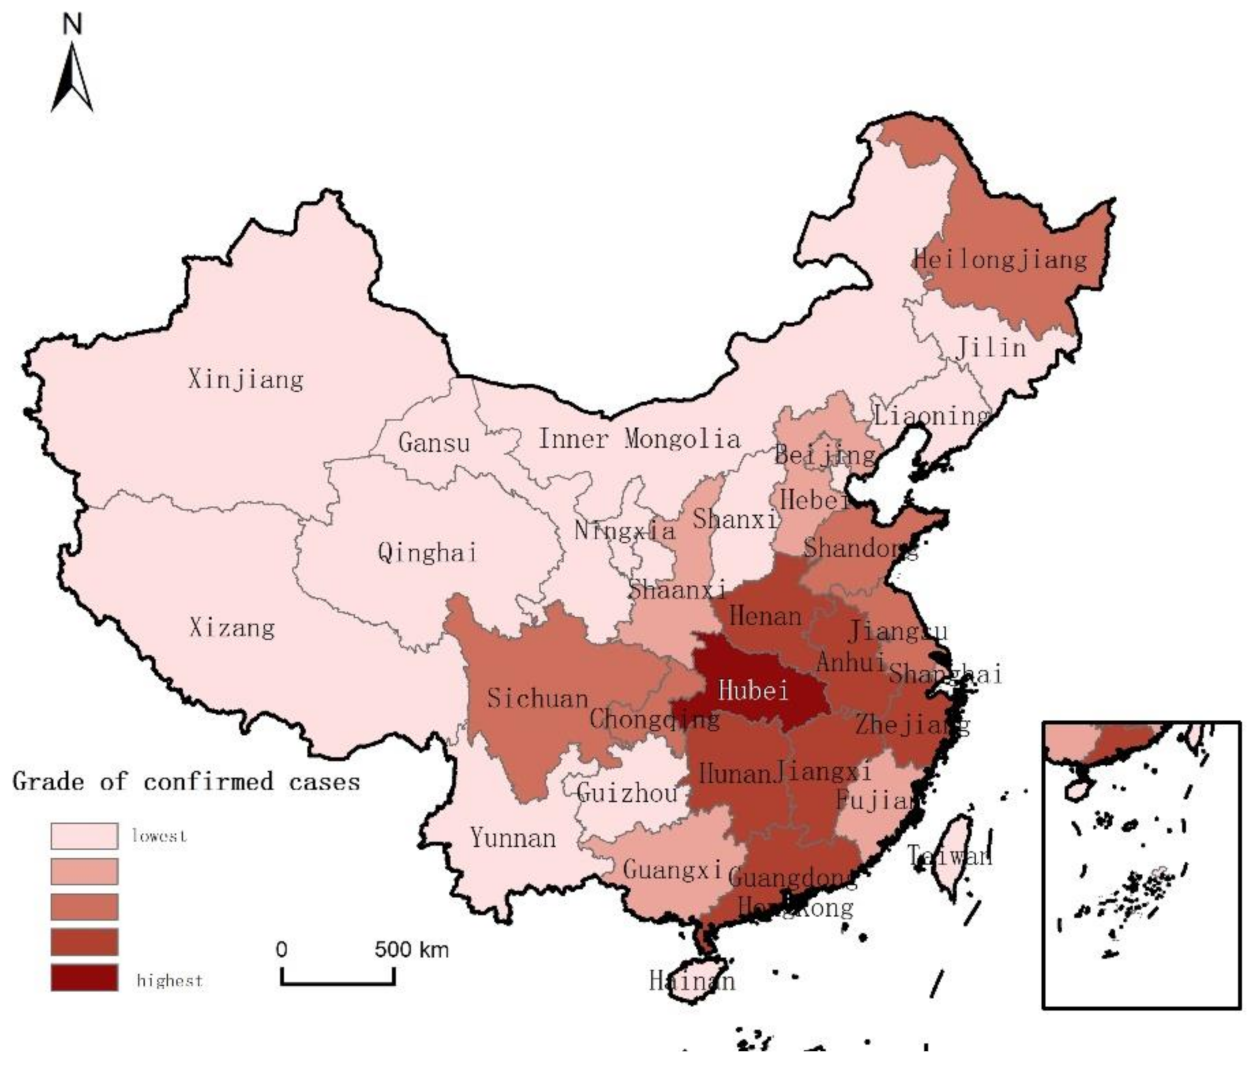
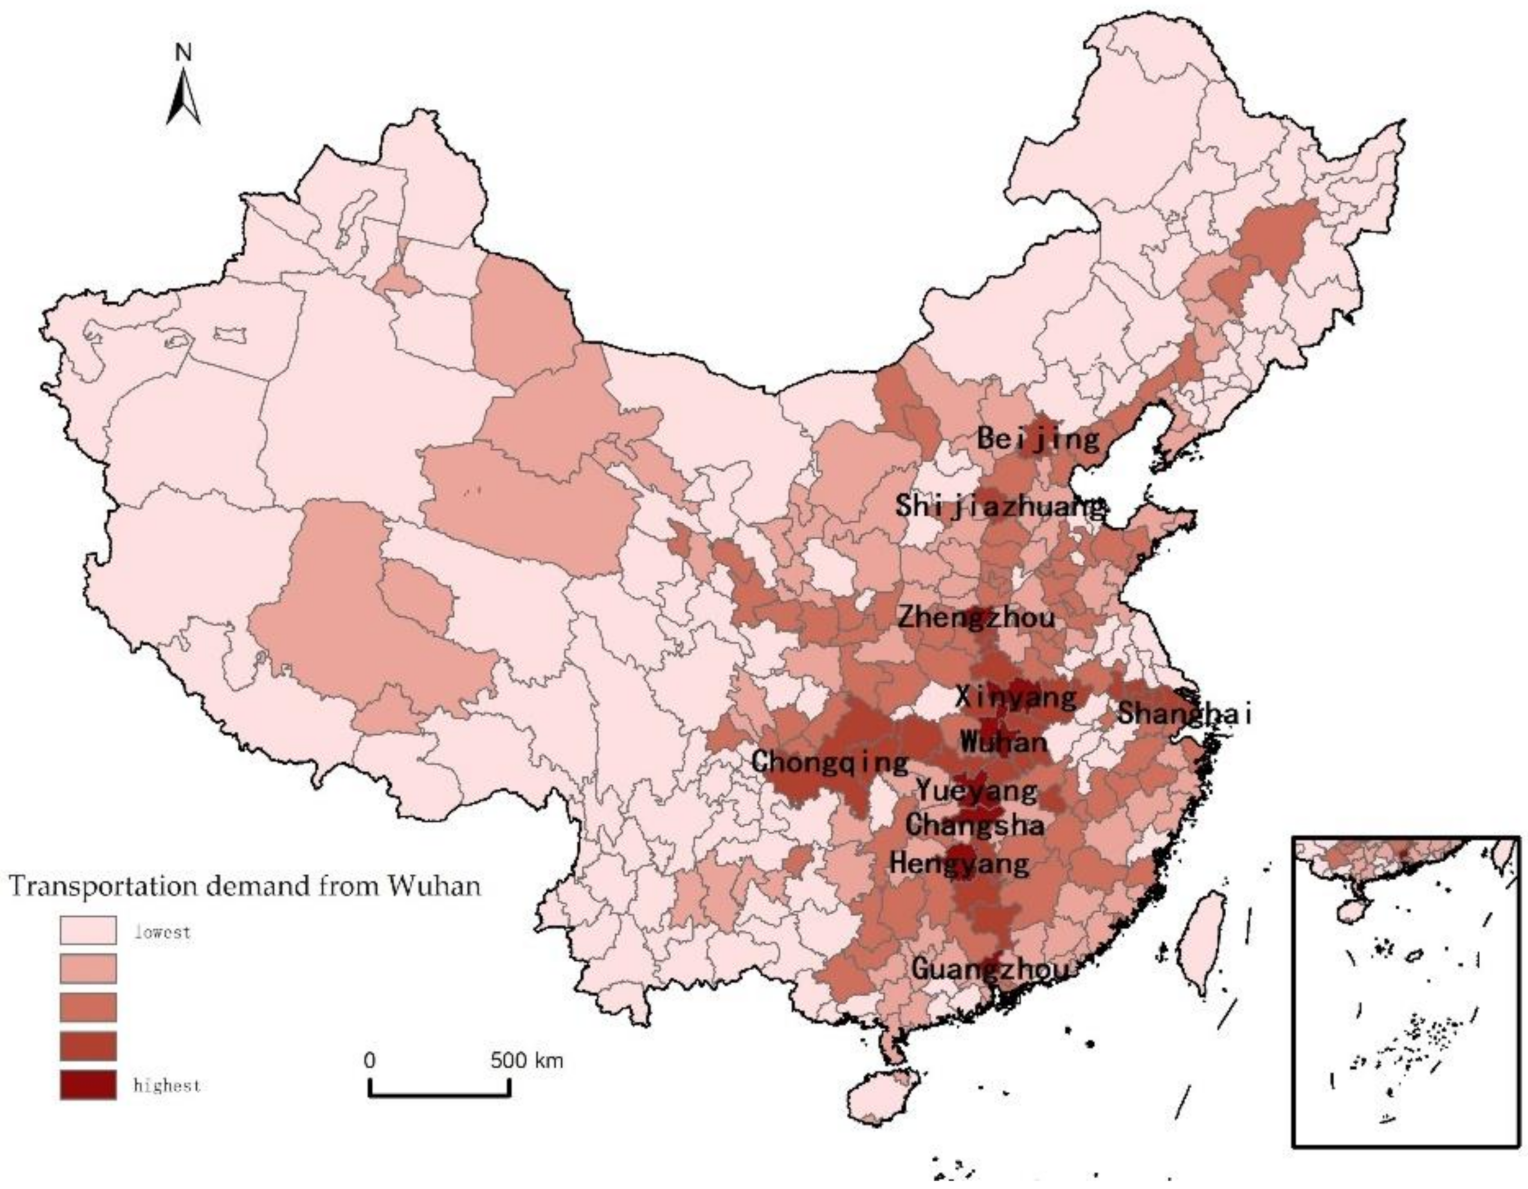
3.3. The Outbreak Was More Serious in Surrounding Areas of Hubei and in Cities with Higher Economic-Activity Intensity

On the basis of the total number of confirmed cases as of 8 April, we divided the provinces from low to high into five categories using the natural breakpoint classification. As shown in Figure 4, the source of the epidemic was the highest in Hubei, and the outbreak was more serious in surrounding areas of Hubei, including Henan, Anhui, Hunan, Jiangxi, Zhejiang, and Guangdong. In terms of spreading direction, spreading intensity from Hubei to the east and south was relatively large, and was distributed in provinces from Hubei to the Yangtze River Delta and along the Beijing–Guangzhou line.
In order to further analyze the distribution of the epidemic in each province and explore the common characteristics between provinces, we analyzed the type of city with the largest number of confirmed cities in each province, and found that, in addition to Beijing, Shanghai, Tianjin, and Chongqing, the four municipalities directly under the Central Government confirmed a high number; in most provinces, the worst-hit city was the provincial capital (Table 2).
In addition, in some provinces, the worst-hit cities were the economically developed cities, followed by provinces of which the worst-hit cities were those with more business people. For example, the epidemic in Wenzhou, Zhejiang was particularly serious, even more serious than that in some prefecture-level cities in Hubei. As of 8 April, the number of confirmed cases had reached 504, which was mainly due to a very large number of Wenzhou individuals conducting business in Wuhan and returning home for the Spring Festival, which caused the epidemic to spread. Xinyang was the most severely hit city in the province of Henan, as the city Xinyang is spatially close to Hubei, and many workers in Hubei return home during the Spring Festival. Jinzhong was the most seriously hit city in the province of Shanxi, especially in Pingyao county. Similar to Wenzhou, there were also many Shanxi merchants in Pingyao who conduct business in Wuhan, and Shanxi merchants return to their hometown during the Spring Festival. Due to an internal infection outbreak in Jining Prison on 20 February, Shandong province, the number of confirmed cases suddenly increased (207 cases).

4. Epidemic-Risk Analysis

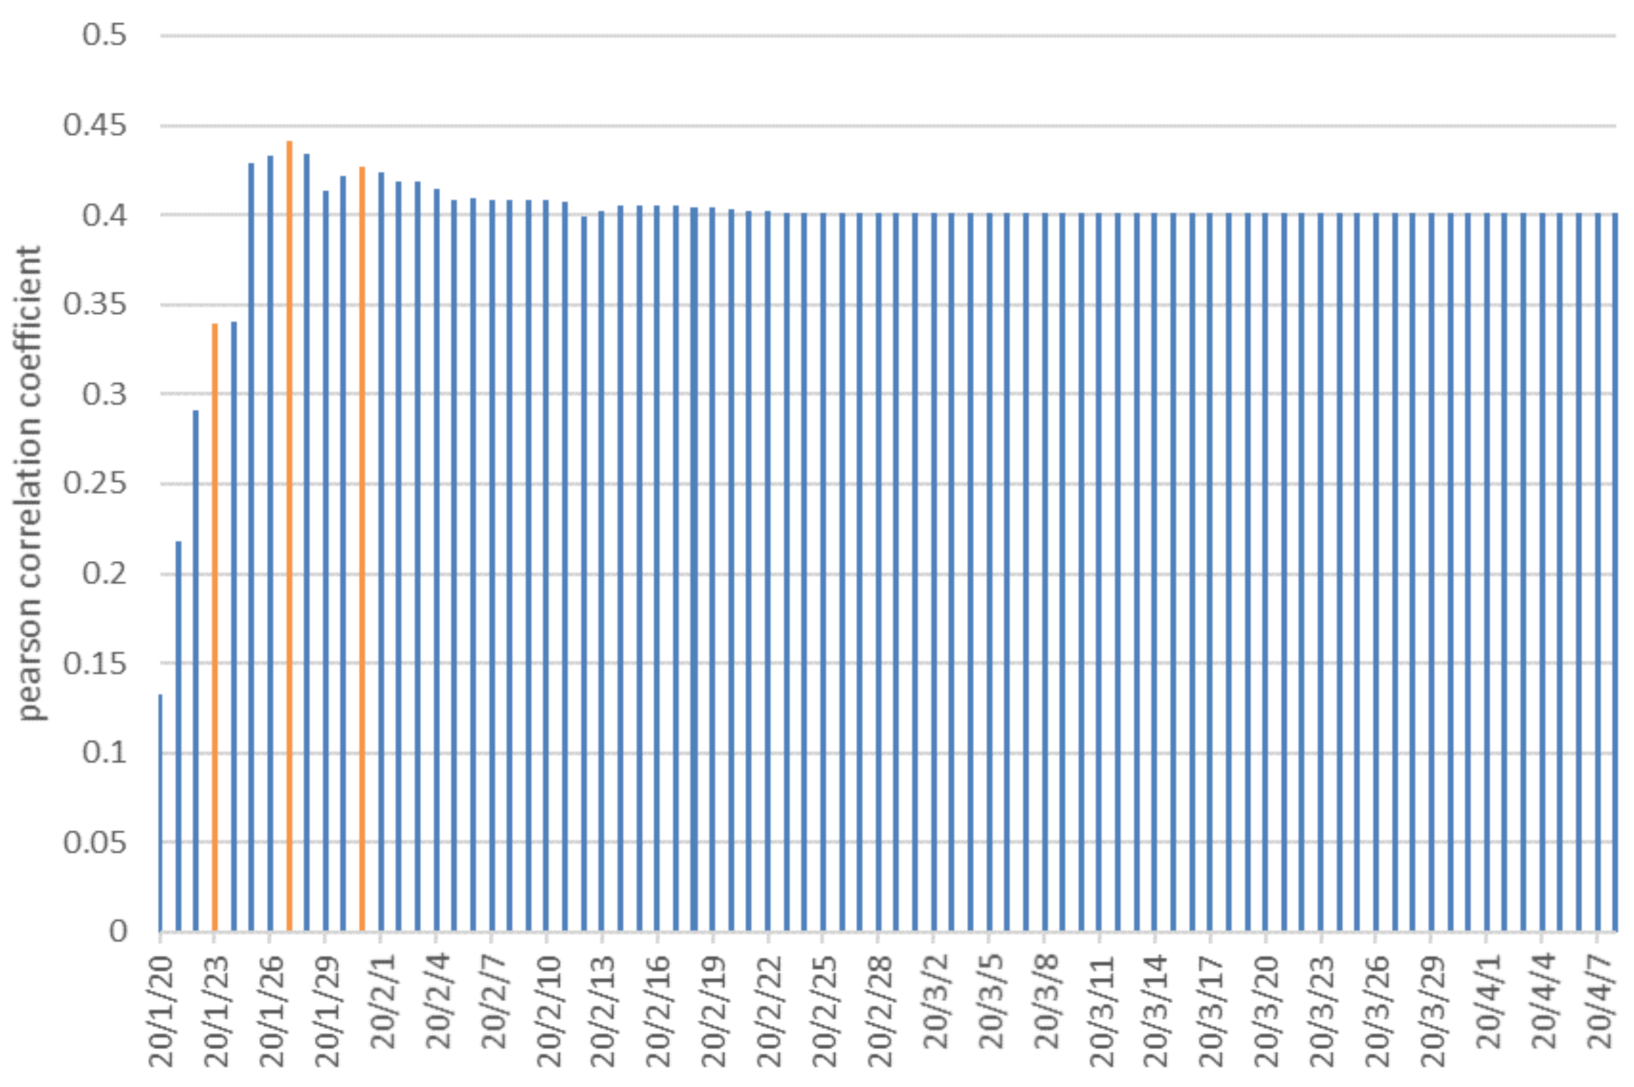
4.1. Average Incubation Period of COVID-19 Is Approximately 4 Days

Major prevention and control measures significantly disturb the spread of an epidemic. Under these disturbances, the macroscopic characteristics of the spread of the epidemic must be related to its incubation period. Therefore, this study analyzes the incubation period on the basis of the impact of traffic control on the spread of the epidemic.
The government considers the distribution of travel demand when laying out train routes. As such, train routes can represent passenger flow and the strength of connections between cities, so the frequency of trains travelling from Wuhan to other cities in one day represents travel demand from Wuhan to these cities. As shown by Figure 5, the cities with higher traffic demand from Wuhan were on the Beijing–Guangzhou and Shanghai–Chongqing routes, showing cross-shaped distribution and a corridor effect.
Under normal circumstances, train frequencies remain the same from day to day in China. Due to the epidemic, Wuhan was quarantined at 10:00 on 23 January 2020, cutting off its transportation links with all the other cities, so all trains passing through Wuhan ceased operation. Such large-scale isolation measures inevitably disturb the spreading trend of the epidemic. As such, the Pearson correlation test was employed for analyzing the relations between the frequency of trains travelling from Wuhan to other cities under normal circumstances and the distribution of confirmed cases by city (Figure 6). Results showed that there was positive correlation between them (two-tailed significance tests were all less than 0.05).
Figure 6 shows that the number of imported cases from Wuhan in each city continued to increase, and the Pearson correlation coefficient gradually increased from 0.13 on 20 January to 0.34 on 23 January. Afterwards, it continued rising and reached the maximum of 0.44 on the fourth day after the quarantine, i.e., 27 January; then, it began to decline. Pearson correlation shows that the number of the patients who became ill on 27 January had a very obvious relationship with the frequency of trains travelling from Wuhan to the cities where patients were located. The effect of the quarantine measures on the spread of the epidemic became obvious. From a macroperspective, the average incubation period of COVID-19 was about 4 days. After 27 January, subsequent transmission was mostly affected by the local population base and epidemic control. Therefore, the Pearson correlation coefficient slightly dropped. A small peak occurred on 31 January, which may have been because of the second generation of infected people imported from Wuhan on 27 January. This once again verified the incubation period of about 4 days. After that, the correlation coefficient stabilized.
From a macro-point of view, after two average incubation periods, national control achieved significant results. This finding is highly consistent with the statistical analysis of more than a thousand clinical data by academician Zhong Nanshan and other scholars, who had concluded that the median incubation period was 4 days (Guan, et al., 2020).

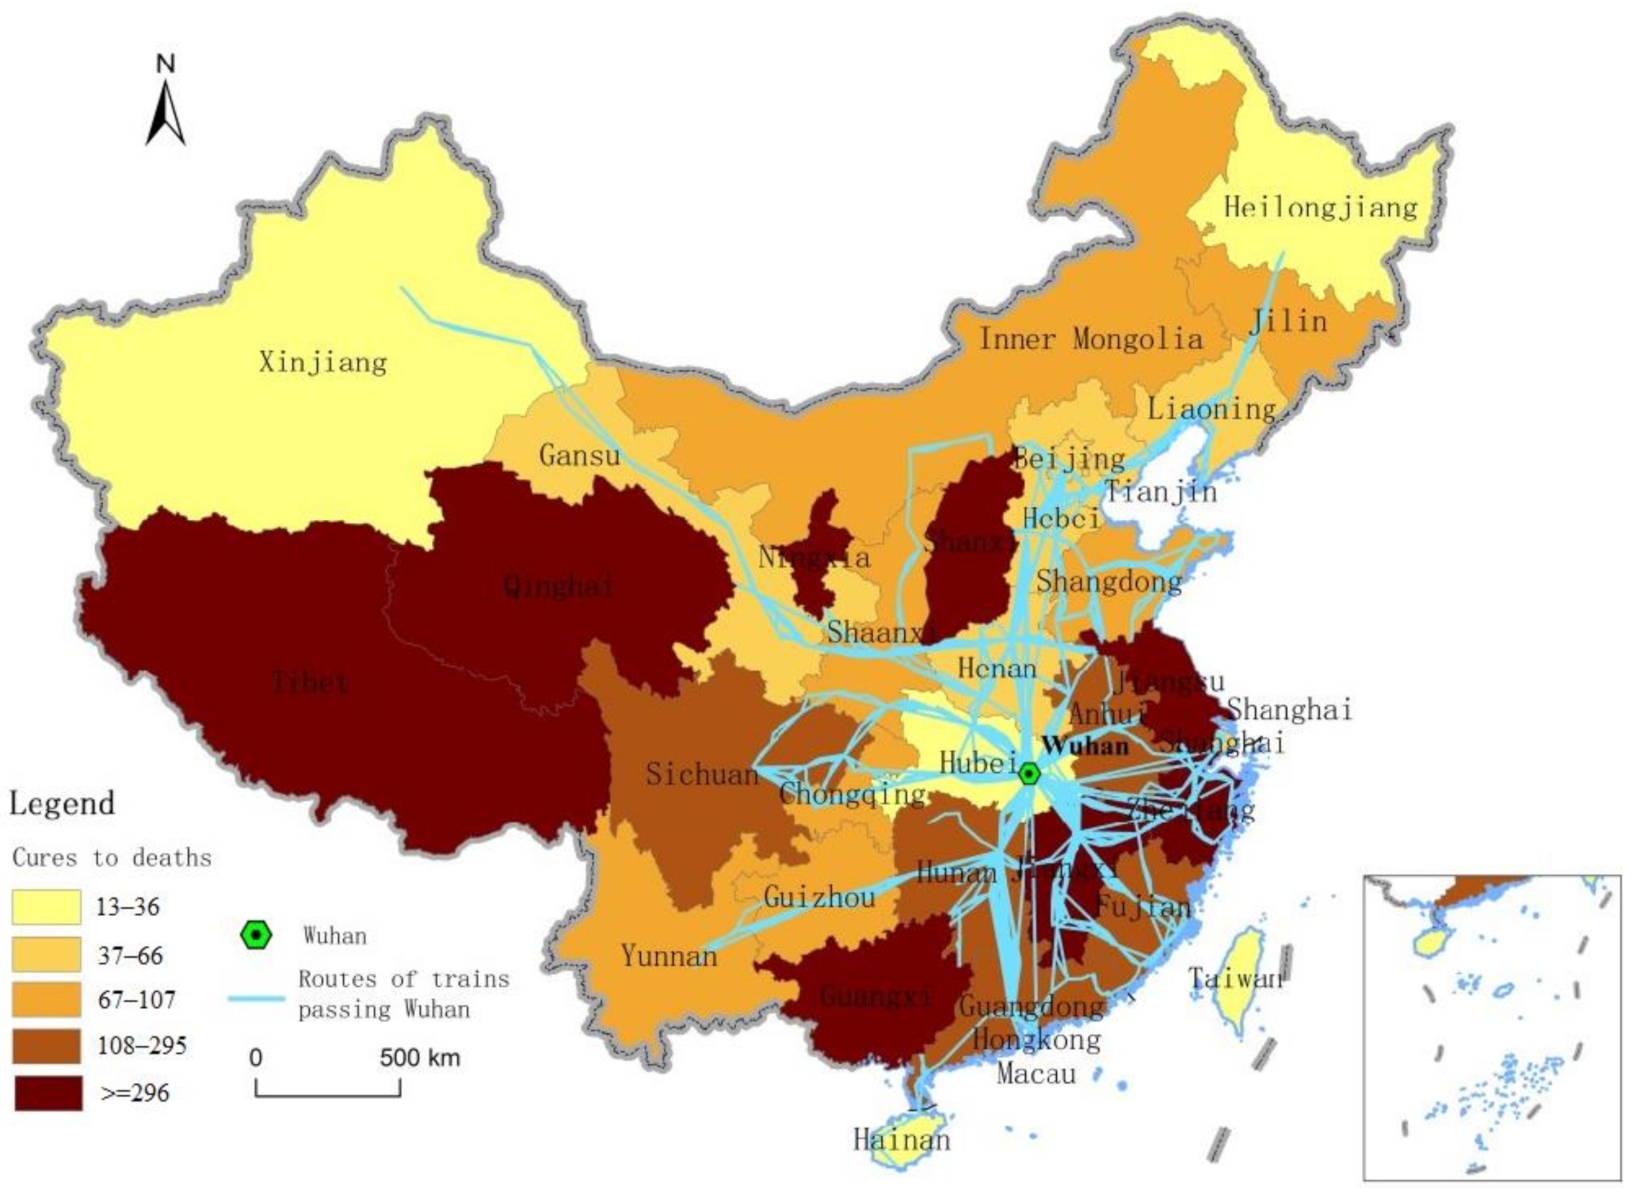
4.2. Ratio of Number of Cured People to That of Deaths Gradually Increased, Indicating That, Given Sufficient Medical Resources, the Cure Rate Can Be Greatly Improved

Lethality—the number of deaths divided by the total number of diagnosed patients—is always used to characterize the risk of an epidemic situation. However, due to the huge number of diagnosed COVID-19 patients, there was no distinction of diagnosis time among confirmed cases and no fixed disease cycle; thus, current mortality could not be accurately estimated. Therefore, the ratio of the number of cures to the number of deaths (RNCND) was applied to represent the danger of COVID-19.
As of 8 April, China (excluding Hubei) had a declining ratio of the number of cures to the number of deaths (RNCND) of 26.76, which was much higher than Hubei’s 19.96. This is because in the early stage of the outbreak, Hubei had a sharp increase in patients and relative lack of medical resources, making it difficult to ensure that each patient was treated in time, while other provinces and cities had relatively sufficient medical resources due to fewer patients. In addition, judging from the change process of the national RNCND (Figure 7), it gradually increased after a small decline in the initial stage. This is due to the continuous increase in funding for Hubei medical resources from all over the provinces, and the continuous increase in the number of people cured in Hubei. This indicates that, given sufficient medical resources, the cure rate of patients can be greatly improved.
Figure 8 shows the spatial distribution of the ratio of cures to deaths by province. Hubei, Xinjiang, and Heilongjiang had the lowest ratios, indicating that the medical-treatment effect was poor. Xinjiang and Heilongjiang are the two provinces farthest from Hubei, located in the northwest and northeast, respectively. In contrast, except for Tibet and Qinghai, which had fewer confirmed cases (1 and 18, respectively), regions with better treatment were mostly located in the southeastern coastal areas. Southeast China is much more economically developed, with better medical service. This once again proves that the cure rate is greatly improved in regions with better medical resources. At the same time, correlation analysis showed that the ratios of cures to deaths of the epidemic in a region had nothing to do with the transportation link between the region and Hubei, where cases were first detected.

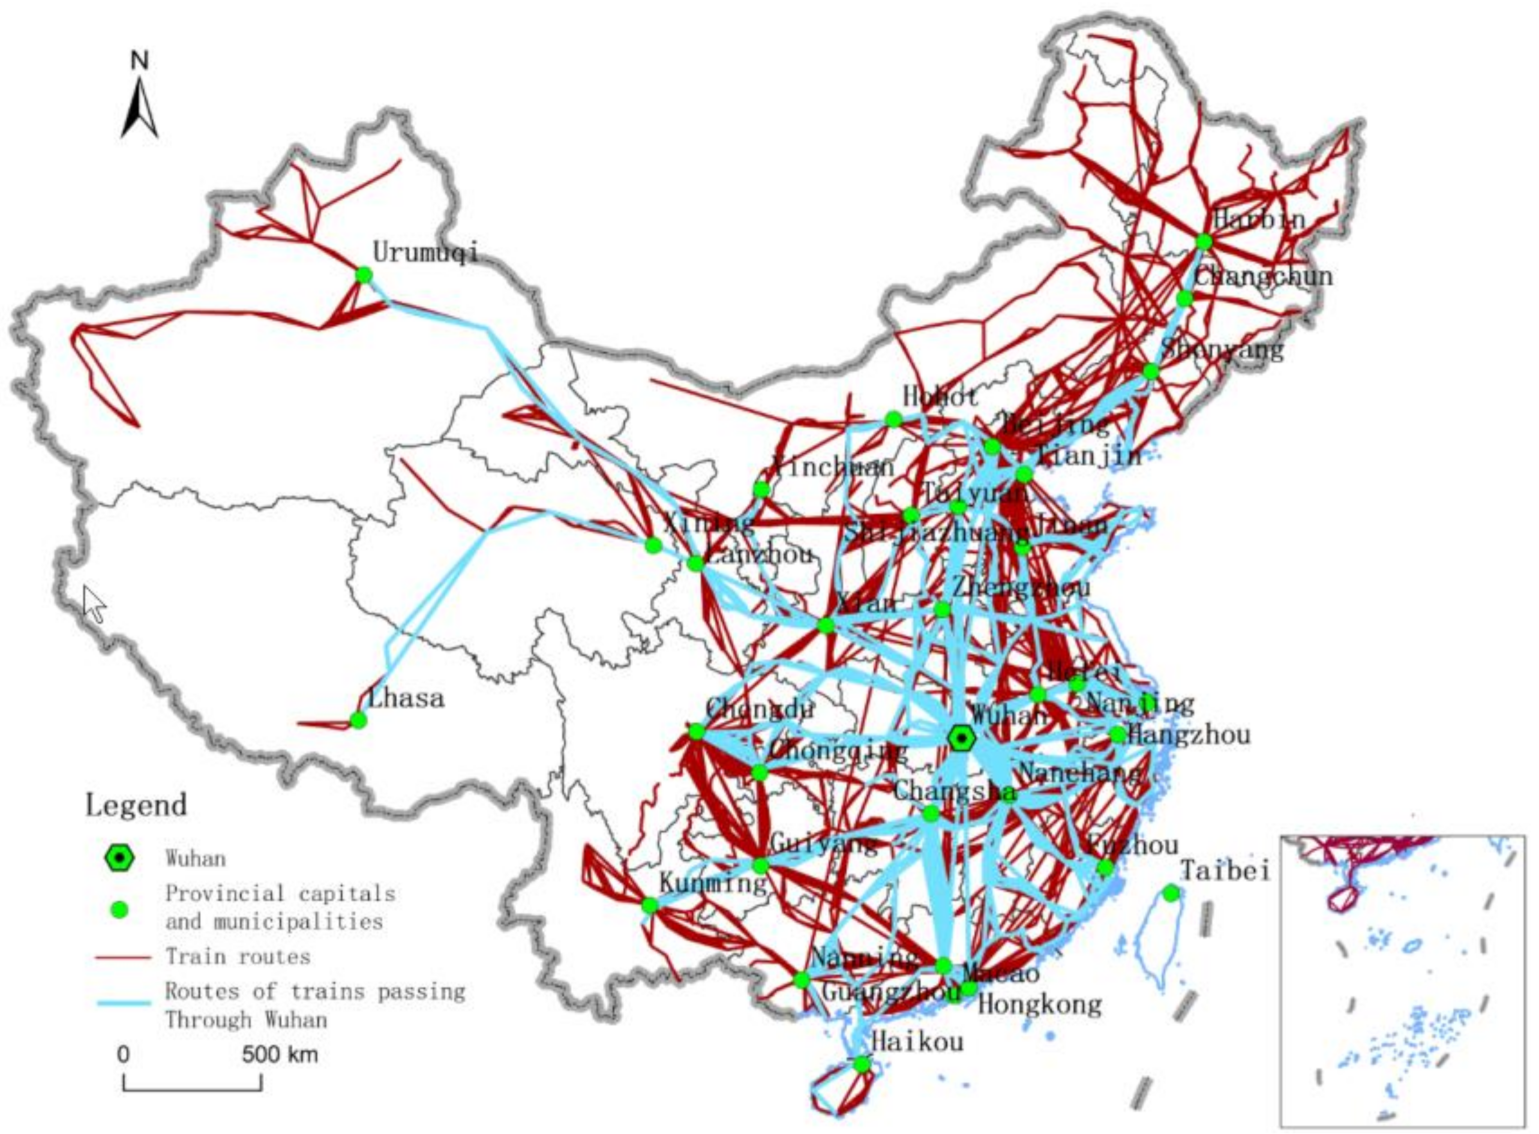
5. Impact of Provincial Quarantine Measures on China’s Railway Traffic

Immediately after the quarantine of Wuhan, other cities in Hubei also implemented lockdown. The isolation of Hubei was the greatest in human history to prevent the spread of infectious diseases. How did the suspension of this important transportation hub affect China’s railway transportation system? How did it affect residents’ travel? We used the complex-network algorithm to evaluate the effect of isolation on the railway transportation system on the basis of the importance of urban nodes in network and the railway network structure. Applied indicators included node centrality, network degree distribution, the average shortest path of the network, and the network aggregation coefficient.

5.1. Quarantine in Hubei Had Greater Impact on Cities with Higher Centrality

The centrality of the network node city reflects the importance of the city in the transportation network, and its transfer and connection capabilities. The total degree centrality of the top 20 cities declined by about 6%, and 18 of the top 20 cities were the same after Hubei had been sealed off (Table 3). The most affected cities were mainly located in the Beijing–Guangzhou route and the Yangtze River Delta.
Change in the last 20 cities was smaller, indicating that Hubei had a great effect on the cities’ transportation, with higher degree centrality (Table 4). This also implies that Hubei had closer connections with cities that have higher traffic-node importance.

5.2. Hubei Quarantine Had Weak Impact on Overall Connectivity of National Railway Network

Before the quarantine of Hubei, the average shortest-path length of China’s railway network was 1.84, and the average shortest-path length after isolation was 1.85. The proportion of cities that could be reached directly or through one transfer before quarantine was 88.0%, and the proportion of cities that could be reached directly or through one transfer after quarantine was 87.8%. In addition, the numbers of railway-network edges before and after the quarantine of the province were 28,714, and 25,438, respectively. The beta-index values of the railway network were 90.30 and 84.23, and the gamma-index values were 0.57 and 0.56, respectively. All declined, but the decline was not large. These results indicate that Hubei plays an important role in China’s railway network, but the quarantines of the province did not fundamentally impact the connectivity of the entire railway network. In other words, the railway network in China did not need to be large-scale adjusted due to the quarantine of Hubei.

5.3. Quarantine in Hubei Province Had Great Impact on the Outflow of Local People to Neighboring Provinces

As discussed earlier, train routes can represent the passenger flow and the travel demand. On the basis of train routes between cities in Hubei and other cities outside Hubei in China, the travel demand of local people in Hubei was analyzed (Figure 9). According to Figure 9, people in Hubei had the greatest travel demand in neighboring provinces, such as Hunan, Henan, and Anhui, and cities in nearby economically developed provinces and municipalities, such as Jiangsu, Beijing, and Shanghai. Therefore, the quarantine of Hubei had greater impact on the outflow of local people to cities in these provinces.

6. Discussion and Conclusions

In this paper, we systematically studied the spatiotemporal characteristics and the trend of the COVID-19 pneumonia epidemic in China, and the relationship between the epidemic and the national railway transportation system from a geographical point of view. We found the following:
(1) The overall growth of the epidemic was exponential. The outbreak of Hubei had a strong spread in the eastern and southern directions, and the epidemic was generally more serious in the capital or developed cities in each province. Regions outside Hubei did not break out after the end of the imported case growth, and maintained control.
(2) On the basis of analyzing the disturbance of the spread of the epidemic by traffic control, the average incubation period of COVID-19 was approximately 4 days. The ratio of the number of cured people to that of deaths in Hubei gradually increased, indicating that, given sufficient medical resources, the cure rate can be greatly improved.
(3) The quarantine policy of Hubei had greater impact on cities with higher centrality, especially in the Yangtze River Delta region, and smaller impact on the overall connectivity of the national railway network. The quarantine of Hubei greatly impacted the outflow of local people to neighboring provinces.
Lastly, we highlight several analytical challenges for future work. First, analysis in this article was based on publicly available data; however, there are many uncertainties in this epidemic. The resumption of work and school will generate a huge flow of people, which will bring challenges to the control of the epidemic for China. To deal with these new challenges, we must continue to deepen our understanding of COVID-19. Second, in this study, travel demand was approximated by means of the intensity of the travel frequencies of the trains. However, the capacity of each train is not same, and the occupancy rate of each train is not stable, so demand data from Wuhan are just an approximation and not completely accurate, so more accurate data and methods remain to be explored in future research.

Author Contributions

This study was conducted under cooperation between F.W. and F.N. Writing original draft preparation, F.W.; visualization, F.N.; supervision, F.N. All authors have read and agreed to the published version of the manuscript.

Funding

This research was funded by the National Natural Science Foundation of China, grant number 41801149 and 42071153; Young Talents of Science and Technology in Universities of Inner Mongolia, grant number NJTY-20-B09.

Institutional Review Board Statement

Not applicable.

Informed Consent Statement

Not applicable.

Data Availability Statement

Publicly available datasets were analyzed in this study. This data can be found here: [http://www.nhc.gov.cn/xcs/xxgzbd/gzbd_index.shtml (accessed on 5 March 2020); https://www.12306.cn/index/] (accessed on 5 March 2020).

Conflicts of Interest

The authors declare no conflict of interest.

References

  1. Wang, J.; Zhao, S.M.; Liu, M.; Zhao, Z.; Xu, Y.; Wang, P.; Lin, M.; Xu, Y.; Huang, B.; Zuo, X.; et al. ACE2 expression by colonic epithelial cells is associated with viral infection, immunity and energy metabolism. MedRxiv 2020. [Google Scholar] [CrossRef] [Green Version]
  2. Zhu, Z.; Meng, K.; Meng, G. A database resource for genome-wide dynamics analysis of coronaviruses on a historical and global scale. MedRxiv 2020. [Google Scholar] [CrossRef] [Green Version]
  3. Zhang, C.; Zheng, W.; Huang, X.; Bell, E.W.; Zhou, X.; Zhang, Y. Protein structure and sequence re-analysis of 2019-nCoV genome does not indicate snakes as its intermediate host or the unique similarity between its spike protein insertions and HIV-1. J. Proteome Res. 2020. [Google Scholar] [CrossRef]
  4. Chang, D.; Lai, M.; Li, W.; Xie, L.; Zhu, G.; Cruz, C.S.D.; Sharma, L. Epidemiologic and Clinical Characteristics of Novel Coronavirus Infections Involving 13 Patients Outside Wuhan, China. JAMA J. Am. Med. Assoc. 2020, 323, 1092–1093. [Google Scholar] [CrossRef] [PubMed]
  5. Guan, W.J.; Ni, Z.Y.; Hu, Y.; Liang, W.H.; Ou, C.Q.; He, J.X.; Liu, L.; Shan, H.; Lei, C.L.; Hui, D.S.C.; et al. Clinical Characteristics of Coronavirus Disease 2019 in China. N. Engl. J. Med. 2020, 382, 1708–1720. [Google Scholar] [CrossRef]
  6. Joseph, T.W.; Kathy, L.; Gabriel, M.L. Nowcasting and forecasting the potential domestic and international spread of the 2019-nCoV outbreak originating in Wuhan, China: A modelling study. Lancet 2020, 395, 689–697. [Google Scholar]
  7. Cao, Z.; Zhang, Q.; Lu, X.; Pfeiffer, D.; Wang, L.; Song, H.; Pei, T.; Jia, Z.; Zeng, D.D. Incorporating Human Movement Data to Improve Epidemiological Estimates for 2019-nCov. MedRxiv 2020. [Google Scholar] [CrossRef] [Green Version]
  8. Park, S.W.; Bolker, B.M.; Champredon, D.; Earn, D.J.; Li, M.; Weitz, J.S.; Grenfell, B.T.; Dushoff, J. Reconciling early-outbreak preliminary estimates of the basic reproductive number and its uncertainty: Anew framework and applications to the novel coronavirus (2019-nCoV) outbreak. MedRxiv 2020. [Google Scholar] [CrossRef] [Green Version]
  9. Anderson, R.M.; May, R.M. Infectious Diseases of Humans: Dynamics and Control; Oxford University Press: Oxford, UK, 1991. [Google Scholar]
  10. Roberts, M.G.; Heesterbeek, J.A.P. A new method for estimating the effort required to control an infectious disease. Proc. R. Soc. B 2003, 2709, 1359–1364. [Google Scholar] [CrossRef] [PubMed]
  11. Heffernan, J.M.; Smith, R.J.; Wahl, L.M. Perspectives on the basic reproductive ratio. J. R. Soc. Interface 2005, 2, 281–293. [Google Scholar] [CrossRef]
  12. Kuchler, T.; Russel, D.; Stroebel, J. Insight: The geographic spread of COVID-19 correlates with the structure of social networks as measured by Facebook—ScienceDirect. J. Urban. Econ. 2021. [Google Scholar] [CrossRef]
  13. Engle, S.; Stromme, J.; Zhou, A. Staying at Home: Mobility Effects of COVID-19; Available at SSRN. 2020. Available online: https://papers.ssrn.com/sol3/papers.cfm?abstract_id=3565703 (accessed on 5 March 2020).
  14. Gilbert, M.; Pullano, G.; Pinotti, F.; Valdano, E.; Poletto, C.; Boëlle, P.-Y.; D’Ortenzio, E.; Yazdanpanah, Y.; Eholie, S.P.; Altmann, M.; et al. Preparedness and vulnerability of African countries against importations of COVID-19: A modelling study. Lancet 2020, 395, 871–877. [Google Scholar] [CrossRef] [Green Version]
  15. Christidis, P.; Christodoulou, A. The Predictive Capacity of Air Travel Patterns during the Global Spread of the COVID-19 Pandemic: Risk, Uncertainty and Randomness. Int. J. Environ. Res. Pub. Health 2020, 17, 3356. [Google Scholar] [CrossRef] [PubMed]
  16. Nikolaou, P.; Dimitriou, L. Identification of critical airports for controlling global infectious disease outbreaks: Stress-tests focusing in Europe. J. Air Transp. Manag. 2020, 85, 101819. [Google Scholar] [CrossRef]
  17. Gómez-Ríos, D.; Ramirez-Malule, D.; Ramirez-Malule, H. The effect of uncontrolled travelers and social distancing on the spread of novel coronavirus disease (COVID-19) in Colombia. Travel. Med. Infect. Dis. 2020, 35, 101699. [Google Scholar] [CrossRef]
  18. Wei, Y. Provincial Transmission of 2019-nCoV Simulation Based on Multi-Agent Network and Big Data of Population Mobility during. 2020. Available online: https://mp.weixin.qq.com/s?__biz=MzIyNDY0ODAxOQ==&mid=2247483994&idx=1&sn=7cb7533ba7d9f1f69a0a0547467cc6f2&scene=21#wechat_redirect (accessed on 5 March 2020). (In Chinese).
  19. Zhang, Y.; Gao, J. Which Urban Outbreaks are Likely to be Underestimated?—Prediction of Potential Infected Person Based on Population Flow and Confirmed Data. 2020. Available online: https://mp.weixin.qq.com/s/2Q8HmyQ8BhptoxrJ0A0_KA (accessed on 5 March 2020). (In Chinese).
  20. Xiang, Y.; Wang, S. Spatial Relationship between Epidemic Spread and Population Outflow of the Corona Virus Disease 2019 (COVID-19) That Impacted Chinese Urban Public Health Classification. Trop. Geogr. 2020, 40, 408–421. (In Chinese) [Google Scholar]
  21. Liu, T.; Jin, Y. The closer to Wuhan, the higher the incidence rate of. The reality may be more complicated. 2020. Available online: https://mp.weixin.qq.com/s/C8oCHG4ciMvTCrNkyuaPBA+ (accessed on 5 March 2020). (In Chinese).
  22. Du, F.; Wang, J.; Wang, H. The Impacts of COVID-19 on the Connectivity of China’s International Air Transport Network and the Spatial Differences. Trop. Geogr. 2020, 40, 386–395. (In Chinese) [Google Scholar]
  23. Miao, C.; Liu, Y.; Dong, G.; Yang, D.; Zhang, H.; Han, Y.; Ren, H.; Qi, Y. Analysis of 2019-nCoV epidemic situation in Henan Province. 2020. Available online: https://mp.weixin.qq.com/s/dU9xBm4LjLmXubzVODM1yw (accessed on 20 February 2020). (In Chinese).
  24. Wang, J.; Li, G.; Wang, J.; Qiang, J.; Zhu, D. Spatiotemporal Evolution and Risk Profiling of the COVID-19 Epidemic in Shaanxi Province. Trop. Geogr. 2020, 40, 432–445. (In Chinese) [Google Scholar]
  25. Liu, Y.; Li, Y.; Li, Z. Diffusion Characteristics of the Coronavirus Disease 2019 (COVID-19) Outbreak in Guangdong Province. Trop. Geogr. 2020, 40, 367–374. (In Chinese) [Google Scholar]
  26. Albert, R.; Barabási, A.L. Statistical mechanics of complex networks. Rev. Mod. Phys. 2002, 74, 47. [Google Scholar]
  27. Barabási, A.; Albert, R. Emergence of scaling in random networks. Science 1999, 286, 509–512. [Google Scholar] [CrossRef] [PubMed] [Green Version]
  28. Freeman, L.C. Centrality in social networks: Conceptual clarification. Soc. Netw. 1979, 1, 215–239. [Google Scholar] [CrossRef] [Green Version]
  29. Watts, D.J.; Strogatz, S.H. Collective dynamics of ‘small-world’ networks. Nature 1998, 393, 440–442. [Google Scholar] [CrossRef] [PubMed]
Figure 1. Railway transportation network in mainland China (network was generated by overlapping the routes of all trains. Train routes were formed by connecting train stations in sequence. All routes of trains passing through Wuhan are shown in blue; those of other trains are shown in red).
Sustainability 13 05163 g001
Figure 2. Epidemic-growth trend at a national scale.
Sustainability 13 05163 g002
Figure 3. Epidemic outbreak velocity by region.
Sustainability 13 05163 g003
Figure 4. Provincial epidemic grade on 8 April 2020.
Sustainability 13 05163 g004
Figure 5. Intensity of travel demand from Wuhan to other cities (color shade of each city represents travel demand from Wuhan to that city).
Sustainability 13 05163 g005
Figure 6. Correlation between travel demand from Wuhan to each city and severity of epidemic in each city in mainland China.
Sustainability 13 05163 g006
Figure 7. Ratio of cures to deaths by region.
Sustainability 13 05163 g007
Figure 8. Total number of cures to total number of deaths by province (the higher the ratio is, the better the local situation is).
Sustainability 13 05163 g008
Figure 9. Top 25 cities by demand of local people in Hubei for travel to other cities.
Sustainability 13 05163 g009
Table 1. Nationwide epidemic-growth simulation.
Coef.Std.Err.t
b180,881.31525.7646153.840
b20.2252680.00658734.20
b320.279610.152884132.650
Table 2. Types of cities with highest number of diagnoses by province on 8 April 2020.
Provinces of Which Most Affected Area Was the Provincial Capital (Including Municipalities Directly under Central Government, Special Administrative Regions)Provinces of Which Most Affected Areas Were Economically Developed CitiesOthers of Which Worst-Hit City Was the City with More Business People
Hubei, Beijing, Shanghai, Chongqing, Tianjin, Heilongjiang, Jilin, Liaoning, Shaanxi, Gansu, Ningxia, Tibet, Yunnan, Guizhou, Jiangsu, Sichuan, Hunan, Anhui, Guizhou, Jiangxi, Qinghai, Fujian, Guangxi, Hong Kong, Macao, TaiwanGuangdong, Xinjiang, Inner Mongolia, HebeiHenan, Zhejiang, Shanxi, Shandong
Table 3. Top 20 cities by degree centrality.
Before Province Quarantine After Province Quarantine
CityCentralityCityCentrality
Beijing250Beijing235
Shanghai224Shanghai208
Zhengzhou220Xuzhou (rise)208
Xuzhou215Zhengzhou (drop)205
Shijiazhuang212Tianjin (rise)199
Nanjing208Shijiazhuang (drop)197
Tianjin208Nanjing (drop)195
Zhuzhou207Zhuzhou195
Nanchang203Shenyang (rise)193
Shenyang202Jinan (rise)193
Guangzhou201Bengbu (rise)189
Jinan200Nanchang (drop)188
Hangzhou198Guangzhou (drop)188
Jiujiang192Hangzhou (drop)183
Bengbu192Shangqiu (rise)179
Suzhou188Jiujiang (drop)178
Changzhou187Jining176
Wuxi187Qinhuangdao (rise)175
Shangqiu186Suzhou (drop)175
Qinhuangdao184Jinzhou175
Table 4. Bottom 20 cities of degree centrality.
Before Province Quarantine After Province Quarantine
CityCentralityCityCentrality
Daxinganling region6Daxinganling region6
Chuxiong Yi autonomous prefecture6Chuxiong Yi autonomous prefecture6
Alxa Left Banner 6Alxa Left Banner 6
Wanning5Wanning5
Beihai5Beihai5
Bazhong5Wenchang5
Wenchang5Qionghai5
Qionghai5Qinzhou5
Qinzhou5Lingshui Li autonomous county5
Lingshui Li autonomous county5Bazhong4
Jixi4Jixi4
Qitaihe3Qitaihe3
Lijiang3Lijiang3
Xiushan Tu autonomous county2Xiushan Tu autonomous county2
Honghe Hani and Yi autonomous profecture 2Honghe Hani and Yi autonomous profecture 2
Laiwu 2Laiwu2
Fangchenggang2Fanggangcheng2
Dali Bai autonomous prefecture1Dali Bai autonomous prefecture1
Chongzuo1Chongzuo1
Rikaze1Rikaze1
Publisher’s Note: MDPI stays neutral with regard to jurisdictional claims in published maps and institutional affiliations.

