Article

Ecological Compensation Standard of a Water-Receiving Area in an Inter-Basin Water Diversion Based on Ecosystem Service Value and Public Willingness: A Case Study of Beijing

College of Hydraulic Science and Engineering, Yangzhou University, Yangzhou 225009, China
*
Author to whom correspondence should be addressed.
Sustainability 2021, 13(9), 5236; https://doi.org/10.3390/su13095236
Submission received: 23 April 2021 / Accepted: 4 May 2021 / Published: 7 May 2021
(This article belongs to the Special Issue Sustainable Water, Economic Management and Governance Issues)

Abstract

:
Ecological compensation has recently gained significant attention as an economic incentive promoting natural resource management. However, there remain several challenges to its application. A key issue is the lack of a method clearly define the standard of ecological compensation. This study established an accounting methodology for the ecological compensation standard for the water-receiving area in an inter-basin water diversion in China. Beijing, a major water-receiving area of the South-to-North Water Diversion Project, was used as an example of the application of this approach. First, the evaluation index of ecosystem service value of the water-receiving area was selected, then, emergy theory was used to calculate the increment of ecological service value based on the characteristics of each indicator. The ecological service value due to the project was calculated to be 3.898 billion RMB, while the willingness-to-pay by the public was estimated at 915 million RMB. Therefore, the increment of ecological service value was the highest standard of compensation, and the public’s willingness-to-pay was the lower limit of ecological compensation. The final compensation standard can be determined through negotiation between suppliers and beneficiaries under the leadership of relevant governments and water-transfer authorities. Thus, this study aimed to provide a scientific basis for the construction of diversified ecological compensation mechanisms and promote sustainable development of the region.

1. Introduction

During rapid development of the global economy, the disequilibrium between the population, economy, resources and the environment is very severe. In the management of inter-basin water transfers, the utilization and protection of water resources remain poorly coordinated. Because economic and social welfare of water-receiving areas continue to develop, [1], and the development of the water-transfer areas is restricted due to ecological protection, social harmony and public security are threatened. The implementation of inter-basin ecological compensation is an effective means to solve these problems [2]. Due to the need for coordinated development of the ecology and social economy in water-receiving areas, it is particularly important to establish an ecological compensation mechanism in the water-receiving area of an inter-basin water-transfer diversion.
Ecological compensation can be implemented to meet both economic and environmental objectives and demands. The basic concept is that the beneficiaries of ecological services should compensate the providers, to regulate the relationship between social development and ecological protection through economic means. This could enable ecological protection and restoration to form a virtuous circle [3,4,5]. Despite significant achievements in ecological compensation, some deficiencies remain in design and implementation, wherein the key issue is the compensation standard [6]. The quantification of the ecological compensation standard is crucial for the establishment of a mechanism for ecological compensation, which is not only directly related to the feasibility and effects of ecological compensation, but also provide a reference for governments to conduct negotiations in market transactions.
At present, the standard of ecological compensation is mainly determined by three considerations. First, the ecosystem service value of the water-receiving area, generated by the ecosystem and provided to the beneficiaries. Second, the cost that ecological beneficiaries are willing to pay, and finally, the direct investment and opportunity cost of the water-transfer areas. Since the compensation costs of water-transfer areas should be borne by multiple water-receiving areas, the determination of ecological compensation standards for water-receiving areas mainly considers the ecosystem service value of water-receiving areas and the willingness-to-pay of ecological beneficiaries.
The valuation methods of ecosystem services mainly include the following three approaches: (1) socio-economic value assessment: The market-value method was used to calculate the value of ecological services provided by the upstream region of the basin to the downstream region [7]. The basis of this method is a well-developed and standardized natural resource market. However, the water resource market in China remains poorly developed, and therefore the market price method cannot be effectively applied. Other methods include opportunity cost methods [8], water supply input accounting methods [6], computable general equilibrium models [9], among others. As these assessment methods are traditional economic methods, they do not consider the ecological background of value generation and therefore are not applicable to ecological economic problems. (2) Emergy theory: The emergence of emergy theory enabled researchers to quantitatively evaluate the ecological environment within a unified measurement standard. Emergy theory provides the link between ecology and economics by synthesizing energy flow, material flow, monetary flow and their interconversions [10]. Emergy theory has been widely used in analyses of watershed environmental resources, environmental policies, environmental management, and development models [11,12]. (3) Other methods: Assessments of ecological footprints provide a clear accounting of the excessive consumption of capital and the relative pressures on a country’s, or region’s, carrying capacity [13]. However, the calculation parameters of ecological footprint model are not sufficiently flexible. Most directly refer to the results of classical studies, which cannot reflect the particularity of a study area. Furthermore, such models overly emphasize the productivity and quantity of land and give insufficient attention to the function and quality of water resources [14]. In China, the compensation standard of Xin’an River, Poyang Lake and Taihu Lake were calculated using the water quality method, with models based on water quality and quantity of transboundary sections reflecting the property rights of water resources. However, most studies focus on the compensation of external benefits (losses) brought by one aspect of water quantity or water quality, failing to take water quality and quantity sufficiently into account, and failing to reflect the influence of human activities and natural factors on water resources of transboundary sections [15]. Ecosystem service value assessment is an important reference for the formulation of ecological compensation standards in water-receiving areas [16]. Some researchers and research institutions believe that it is the highest standard of ecological compensation, but this method of calculation does not incorporate the willingness to pay (WTP) of the recipients. Consequently, the research results are unable to guide policy making because they are far beyond the ability and willingness of the beneficiaries to pay the compensation.
WTP is the amount of economic compensation that a water-receiving area is willing to pay for the services provided by a water-transfer project, which is closely related to the social characteristics of stakeholders in the water-receiving area, their understanding of the project, and their personal income level. Kerr [17] believed that the WTP of ecological service users for watershed ecological compensation was an important theoretical basis for establishing social and economic links between the upper and lower reaches of the watershed. Hecken et al. [18] investigated the WTP of the downstream residents in Matiguás area of Nicaragua for obtaining clean water and found that the downstream residents had a higher WTP than upstream.
In recent years, China’s ecological compensation policy for inter-basin water diversion projects has primarily relied on the limited transfer payment from the government, rather than compensation between water-receiving and water-transfer areas. For example, the city of Zhangzhou calculated the compensation standard according to revenue and water consumption, through the county government in the lower reaches of the river basin, and municipal financial support. In the Beijing-Hebei region, the project of “returning rice to drought,” a subsidy given by the municipal government to farmers to obtain water, reflected the value of water resources and the willingness of farmers to be compensated. However, the evaluation of water resources in this project was inadequate, and only unified standards were used to subsidize farmers, leading to insufficient evaluation of the water-transfer price and low satisfaction of farmers. This causes the water-transfer areas to incur a high cost for protecting water resources, which seriously affects the progress and sustainability of local economic development.
In this study, we developed an ecological compensation standard model by establishing an accounting framework and methodology. The main contributions of this work can be summarized as follows:
  • The flow of water resources from the water-transfer area to the water-receiving area has resulted in an increase of ecosystem service value. The evaluation index of ecosystem service value of the water-receiving area was determined by comprehensively considering the local characteristics, engineering characteristics, socio-economic development, natural environmental conditions, and other factors, of the study area, and combining these with expert opinions. Emergy theory was then used to calculate the increment of ecosystem service value in the water-receiving area.
  • The WTP of the public in Beijing was obtained by the contingent valuation method (CVM), taking into account the economic affordability of the public of the water-receiving area (i.e., Beijing).
  • The ecological compensation standard can be decided based on the increment of ecosystem service value of the water-receiving area and public payment after consultation between the ecological function providers and beneficiaries under the leadership of the relevant government and management authority.
In this paper, the emergy theory, used to evaluate the increment of ecosystem service value in the water-receiving area, is presented. The CVM was adopted in this study to obtain the WTP of the public in water-receiving areas, taking into account the economic affordability of the public of the water-receiving area (i.e., Beijing). The ecological compensation standard was then obtained, based on the value of the ecosystem service value and public-WTP. Last, suggestions for further improvement are provided.

2. Materials and Methods

2.1. Study Area

The South-to-North Water Diversion Project (SNWDP) in China is the largest and longest water-transfer project in the world. The middle route of the SNWDP, with a total length of 1277 km, primarily mitigates water shortage in more than 20 large and medium-sized cities along the route, including Beijing, Tianjin, Shijiazhuang, and Zhengzhou (Figure 1). Beijing is not only the political and cultural center of China, but also a famous ancient capital and a modern international metropolis, with a total area of 16,700 km2. In the past, water availability was a restrictive factor affecting the economic development and environmental conditions of Beijing [19,20]. Before water from the SNWDP was diverted to Beijing, the city relied on excessively exploited underground water sources [21]. Over the past six years, Beijing has cumulatively received over 6 billion m3 of water, benefiting 13 million residents. The water-receiving area has clean water resources and generates large socio-economic benefits. Therefore, there is an urgent requirement to clearly define the ecological compensation standard, promote the horizontal compensation relationship between the demand and transfer areas, and promote sustainable development.

2.2. Emergy Analysis

The increment of ecosystem service value of the water-receiving area refers to the increasing amount of ecological and environmental functions generated by the ecosystem on the basis of the original functions after the water diversion. We explored the composition of the ecological and environmental value of the water diversion project and applied a quantitative calculation to each sub-value based on emergy theory [22,23]. The basis for calculating the emergy value of the ecosystem is the emergy system diagram (Figure 2), which schematically represents the energy flow, transformation, and interactive relationships of water resource systems in water-transfer projects. The emergy transformity is the key factor in energy value analysis, which provides data required for accurate calculation of the emergy value. Furthermore, the Emdollar ratio relates the ecological and environmental settings to social economy, transforming natural resources into the monetary value of social and economic systems, and helps achieve specific and easily-understood results.

2.2.1. Emergy Diagram

The value of ecosystem services was obtained from the perspective of ecological economics and emergy theory [22] was used to calculate the value of each ecosystem service index. The water resources system of the water diversion project is a part of the natural–artificial composite water circulation system. The emergy system diagram of the receiving area of the water-transfer project is shown in Figure 2, indicating the relationship between the main energy supply, material input, and output of the water-receiving project, representing the process of various energy flows, transformations, and storage. We used the Delphi method to select the ecosystem service indices that indicated the increment of ecosystem service value in Beijing due to the SNWDP, using the characteristics of the research area and the structure of the ecological and environmental setting of the receiving areas. According to the characteristics of each index, the emergy/monetary value of each index was calculated.

2.2.2. Emdollar Ratio

We obtained Beijing’s ecological economic emergy table using the “Beijing Statistical Yearbook”, “Beijing Water and Soil Conservation Bulletin,” and other relevant data. The total emergy of Beijing City in 2015 was 9.77 × 10²³ sej (Table 1), including the emergy of renewable resources, non-renewable resources, and imports The 2015 gross domestic product (GDP) of Beijing was RMB 2301.46 billion and therefore the conversion ratio of USD/RMB in 2015 was 6.39. Consequently, the Emdollar ratio of Beijing in 2015 was 2.71 × 10¹² sej/$.

2.2.3. Emergy Assessment of Each Index

Water Supply

Water supply is the primary function of water resources, as they provide local, domestic, and industrial water. Its emergy can be calculated as:
E M w = Q W T W
where E M w is the emergy of water supply, Q W is the total volume of water supply, and T W is the emergy transformity of surface water.
In 2015, the SNWDP provided 686 million m3 of water to domestic industry, and the emergy transformity of surface water was 8.50 × 10¹¹ sej/m3 [22]; the resulting emergy of water supply was 5.83 × 10²⁰ sej.

Water Regulation and Storage

Reservoirs and groundwater storage can regulate water volume and store water resources, which play a vital role in maintaining the structure, function, and ecological processes of water ecosystems. The emergy of water resource regulation and storage was calculated from:
E M s = Q s T n
where E M s is the emergy of water resource regulation and storage, Q s is the total amount of water resource regulation and storage, and T W is the emergy transformity of storage water.
In 2015, the natural water supply of Beijing central city was 0.7 billion m3. Because of the SNWDP, groundwater reserves increased by 202 million m3, and the emergy transformity of storage water was 1.64 × 10¹¹ sej/m3 [22], equivalent to 4.46 × 10¹⁹ sej.

Net Primary Productivity and Biomass

All of the different areas within the water-receiving region need to be classified and analyzed. The emergy of net primary productivity and biomass was calculated from:
E M p = Q p T t
where E M p is the emergy of net primary productivity and biomass, Q p is the total amount of net primary productivity and biomass, and T t is the emergy transformity of net primary productivity and biomass.
The emergy transformity of net primary productivity is 5.78 × 10⁷ sej/g, and the emergy transformity of biomass is 5.11 × 10⁶ sej/g [25]. The average net primary productivity of lakes and rivers is 500 g/m2/a and the biomass is 103 g/m2 [26]. The water surface area considered here was the increased water surface area in Beijing due to the SNWDP, including Daning storage reservoir, TuanCheng lake basin, and TuanCheng open channel. The water area calculated using the relevant data and Google Earth was 1.77 km2. Data from the Miyun Reservoir Management Office showed that the water area of Miyun Reservoir expanded from 74 km2 before the SNWDP to 114 km2, with an added water area of 41.77 km2. The emergy of net primary productivity increased by 1.21 × 10¹⁸ sej, while the emergy of biomass increased by 2.14 × 10¹⁷ sej.

Prevention of Land Subsidence

Land subsidence refers to the reduction of ground elevation due to the combined action of natural and manmade factors. It is characterized as a slow and delayed reaction, and the rate of subsidence is measured in millimeters. These slow and degenerative geological disasters have a long formation cycle, generate a wide range of impacts, and are not easily detected; they are also not easily recoverable. Moreover, several factors affect land subsidence, but the overexploitation of groundwater is a primary cause in northern China. Thus, excessive exploitation of groundwater has resulted in land subsidence in numerous large and medium-sized cities, including Beijing, Shanghai, and Tianjin. If existing reserves of groundwater undergo further exploitation, multiple economic losses may occur due to land subsidence, and the sum of these losses can be regarded as the indirect economic value of groundwater to prevent land subsidence. The emergy of preventing land subsidence can be calculated from:
E M g = Q g T g
where E M g is the emergy of preventing land subsidence, Q g is the increased groundwater reserves, and T g is the emergy transformity of underground water.
Land subsidence surveys and monitoring data of the North China Plain in 2010, estimated that the direct losses caused by land subsidence in Beijing amounted to 4.4794 billion RMB, the indirect losses accounted for 3.975 billion RMB, generating a total economic loss 8.4544 billion RMB. The multi-year storage variable of groundwater was estimated to be 7.766 billion tonnes. Due to the south-to-north water diversion, groundwater reserves increased by 432 million m3 and the emergy transformity of underground water is 3.38 × 10¹¹ sej/m3 [27]; therefore, the emergy was 1.46 × 10²⁰ sej.

Biodiversity

Biodiversity value refers to the value of maintaining the stability of the number and composition of species and providing biological carriers for material circulation and energy flow in the system [28]. The emergy of maintaining biodiversity can be calculated from the following:
E M b = Q b T b
where E M b is the emergy of maintaining biodiversity, Q b is the number of biological species in the study area, and T b is the emergy transformity of biological species.
Wetlands provide an environment for the breeding and growth of fish, aquatic plants, waterfowl, and other animals and plants, which is conducive to the protection and support of biodiversity and represents the biodiversity value of the SNWDP in Beijing. According to the average solar emergy of each species (1.26 × 1025 sej/species) [29], the emergy was calculated by multiplying the average solar emergy of each species with the proportion of the study area expressed as a fraction of the surface area of the Earth (5.21 × 10⁸ km2).
A total of 49 species of fish, comprising economic fish, including grass carp, silver carp, Bighthys nobilis, rainbow trout, male gurnard, and megalobrala, and 43 species of native wild fish belonging to 6 orders, 12 families, and 36 genera, were identified in natural and semi-natural water bodies in Beijing [30].
12 kinds of aquatic plants (including floating, emergent and submerged plants) were identified in the Miyun Reservoir [31] and 15 species of benthic fauna were also identified in Miyun Reservoir, including 7 families and 71 genera of phytoplankton and 71 species of zooplankton [32].
91 species of birds, including seven species under first-class national protection (for example, golden eagles and the IUCN endangered species of while crane), and multiple national level 2 protected animals, including green-winged teal, and white-tailed eagle, have been identified in the Miyun Reservoir through field surveys.
In summary, there are approximately 309 species, and the calculated emergy of maintaining the biodiversity was 3.12 × 10²⁰ sej (Table 2).

Ecological Replenishment of River Water

Artificial water replenishment in lakes and wetlands through water diversion and other engineering measures can dilute and purify water to improve the environment. The emergy of river ecological replenishment ( E M r ) can be calculated as the product of the volume of artificial water replenishment and the emergy transformity:
E M r = Q r T r
where E M r is the emergy of river ecological replenishment, Q r is the volume of artificial water replenishment, and T r is the emergy transformity of water replenishment.
The emergy transformity was determined according to the source of water replenishment. If water replenishment occurred from surface water, the emergy transformity of surface water was used; if water replenishment was from reclaimed water, the emergy transformity of reclaimed water was used.
The water from the SNWDP replenished 225 million m3 of urban rivers and lakes, including Lugou Xiaoyue Lake and Garden Expo Park, restoring the beauty of Lugou Xiaoyue. The surplus water of Miyun Reservoir was approximately 170–320 million m3 for ecological replenishment of the North Canal and Chaobai River. For the calculation, 250 million m3 was taken as the ecological water replenishment, and the surface emergy transformity was 8.50 × 10¹¹ sej/m3, and the emergy of ecological replenishment was 2.13 × 10²⁰ sej.

Climate Regulation

The value of climate regulation primarily refers to the influence of atmospheric humidity and temperature on water surface evaporation. The emergy of climate regulation was calculated from the following:
E M t = Q t T t
where E M t is the emergy of climate regulation, Q t is the heat absorbed by evaporation from the water surface, and T t is the emergy transformity of water vapor. Table 3 presents the partial emergy transformity of surface water vapor based on altitude.
Average annual evaporation from Beijing is 1100 mm. Based on the calculation of net primary productivity in Section 3, the increase in water surface area arising from the water diversion project was 41.77 km2, and the amount of evaporated water was 4.59 × 10⁷ m3. The heat of vaporization of water at 100 °C and one standard atmospheric pressure was 2260 KJ/kg. Therefore, the heat absorbed was 1.04 × 10¹⁴ KJ.
Because the altitude of the plain in Beijing is 20–60 m and that of the mountain is 1000–1500 m, the average altitude is 43.7 m and the emergy transformity at 43.7 m is 12.20 sej/J. Thus, the emergy of climate regulation was 1.27 × 10¹⁸ sej.

Water Purification

Through a series of biochemical and physical processes, including filtration, dilution, diffusion, adsorption, oxidation, and decomposition, water bodies can effectively degrade and remove the waste discharged by humans to the natural environment. Assuming the water pollutant content in the upstream section as M 1 (g/m3 or mg/L), and that in the downstream section as M 2 (g/m3 or mg/L), the difference between the upstream and downstream can be regarded as the purification effect of a water body on pollutants. The emergy consumed by pollutants in water purification is equal to the difference between the emergy of the upper and lower water bodies, which is defined as the emergy of water purification ( E M j ) , calculated using the following:
E M j = E M 1 E M 2 = M 1 τ 1 M 2 τ 2
where M 1 and M 2 are the contents of pollutants in the upper and lower water bodies, respectively; τ 1 and τ 2 are the emergy transformities of pollutants in the upper and lower water bodies, respectively; and E M 1 and E M 2 are the emergy of the upper and lower water bodies, respectively. The water from the SNWDP in Beijing is a high-quality water source. After entering the water bodies of rivers and lakes in Beijing, the self-purification capacity and environmental quality of the rivers and lakes are significantly improved. Due to limited data, Daning Reservoir was selected for this calculation. Gao [33] showed that the Daning Reservoir had the highest annual average NH3-N content in the upstream section (0.13 mg/L), while the annual average NH3-N content in the downstream section was comparatively low (0.10 mg/L), and the NH3-N removal rate was 23%. Nitrification of NH3-N content occurred, as indicated by the water quality index in the water transfer. The annual average total nitrogen (TN) content of the upstream section was 1.92 mg/L, and the annual average TN content of the downstream section was 0.95 mg/L. The hardness of tap water decreased from 380 mg/L to 120–130 mg/L, and the emergy of water purification was 2.74 × 10²⁰ sej (Table 4).

Carbon Fixation and Oxygen Release

Aquatic plants absorb CO2 from the atmosphere through photosynthesis and release O2, and their tissues can store organic materials produced by photosynthesis. A large amount of carbon is stored when soil organic matter accumulated in peat bogs, influencing carbon fixation and storage. Therefore, the water ecosystem can significantly buffer the increase in CO2 concentration. Photosynthesis can be summarized as follows:
6 C O 2 + 6 H 2 O = 6 O 2 + C 6 H 12 O 6
Thus, the emergy is calculated as follows:
E M c o 2 = Q C O 2 T C O 2
E M o 2 = Q O 2 T O 2
where E M c o 2 and E M o 2 are the emergy of carbon fixation and oxygen release, respectively; Q C O 2 and Q O 2 are the amounts of C O 2 and O 2 respectively; and T C O 2 and T C O 2 are the emergy transformities of C O 2 and O 2 , respectively.
From the photosynthesis of plants given by Equation (9), it is known that plants can fix 1.47 g C O 2 and release 1.06 g O 2 for every 1 g of dry matter produced. The calculated net primary productivity was 2.09 × 10¹⁰ g (dry weight) and therefore the amount of fixed C O 2 was 3.07 × 10¹⁰ g, and the amount of released O 2 was 2.21 × 10¹⁰ g. Furthermore, the emergy transformation of C O 2 is 3.78 × 10¹⁰ sej/kg, and the emergy transformity of O 2 is 5.11 × 10¹⁰ sej/kg; thus, the value of carbon fixation and oxygen release was 2.29 × 10¹⁷ sej.

Recreational Value

The recreational value of water is primarily embedded in two aspects. The first is the aesthetic value, which includes the water body and the landscape along the river, including canyons, waterfalls, and rapids. The second is the entertainment value, including boating, swimming, rafting, fishing and hunting, camping, hiking, photographing, and picnicking along the riverbank. These not only provide a place for rest and entertainment but also add to the spiritual value for humans. Therefore, the value of water recreation can be measured by the income of the tourism sector, which is affected by infrastructure, geographical location, resident income, and natural conditions around the water source. According to Liu Qing [34], water-related tourism accounts for 12.3% of tourism revenue. The emergy of recreation can be calculated from the following:
E M y = I × 12.3 % × E D R
where E M y is the emergy of recreation and EDR is the Emdollar ratio of the region.
The relevant scenic spots benefiting from the SNWDP are presented in Table 5.
According to the Beijing Tourism official website, there are 292 scenic spots in Beijing, comprising 32 scenic spots of 5A (The quality level of scenic spots in China can be divided into five levels, from high to low: 5A,4A,3A,2A and 1A), 82 scenic spots of 4A, 114 scenic spots of 3A, 56 scenic spots of 2A, and 8 scenic spots of 1A. In 2015, the tourism revenue of Beijing was 72.211 billion RMB, and therefore revenue of scenic spots impacted by the SNWDP in Beijing was 1.484 billion RMB (12.3 % of the total) and, from Equation (12), the recreational emergy was 7.74 × 10¹⁹ sej.

3. Results

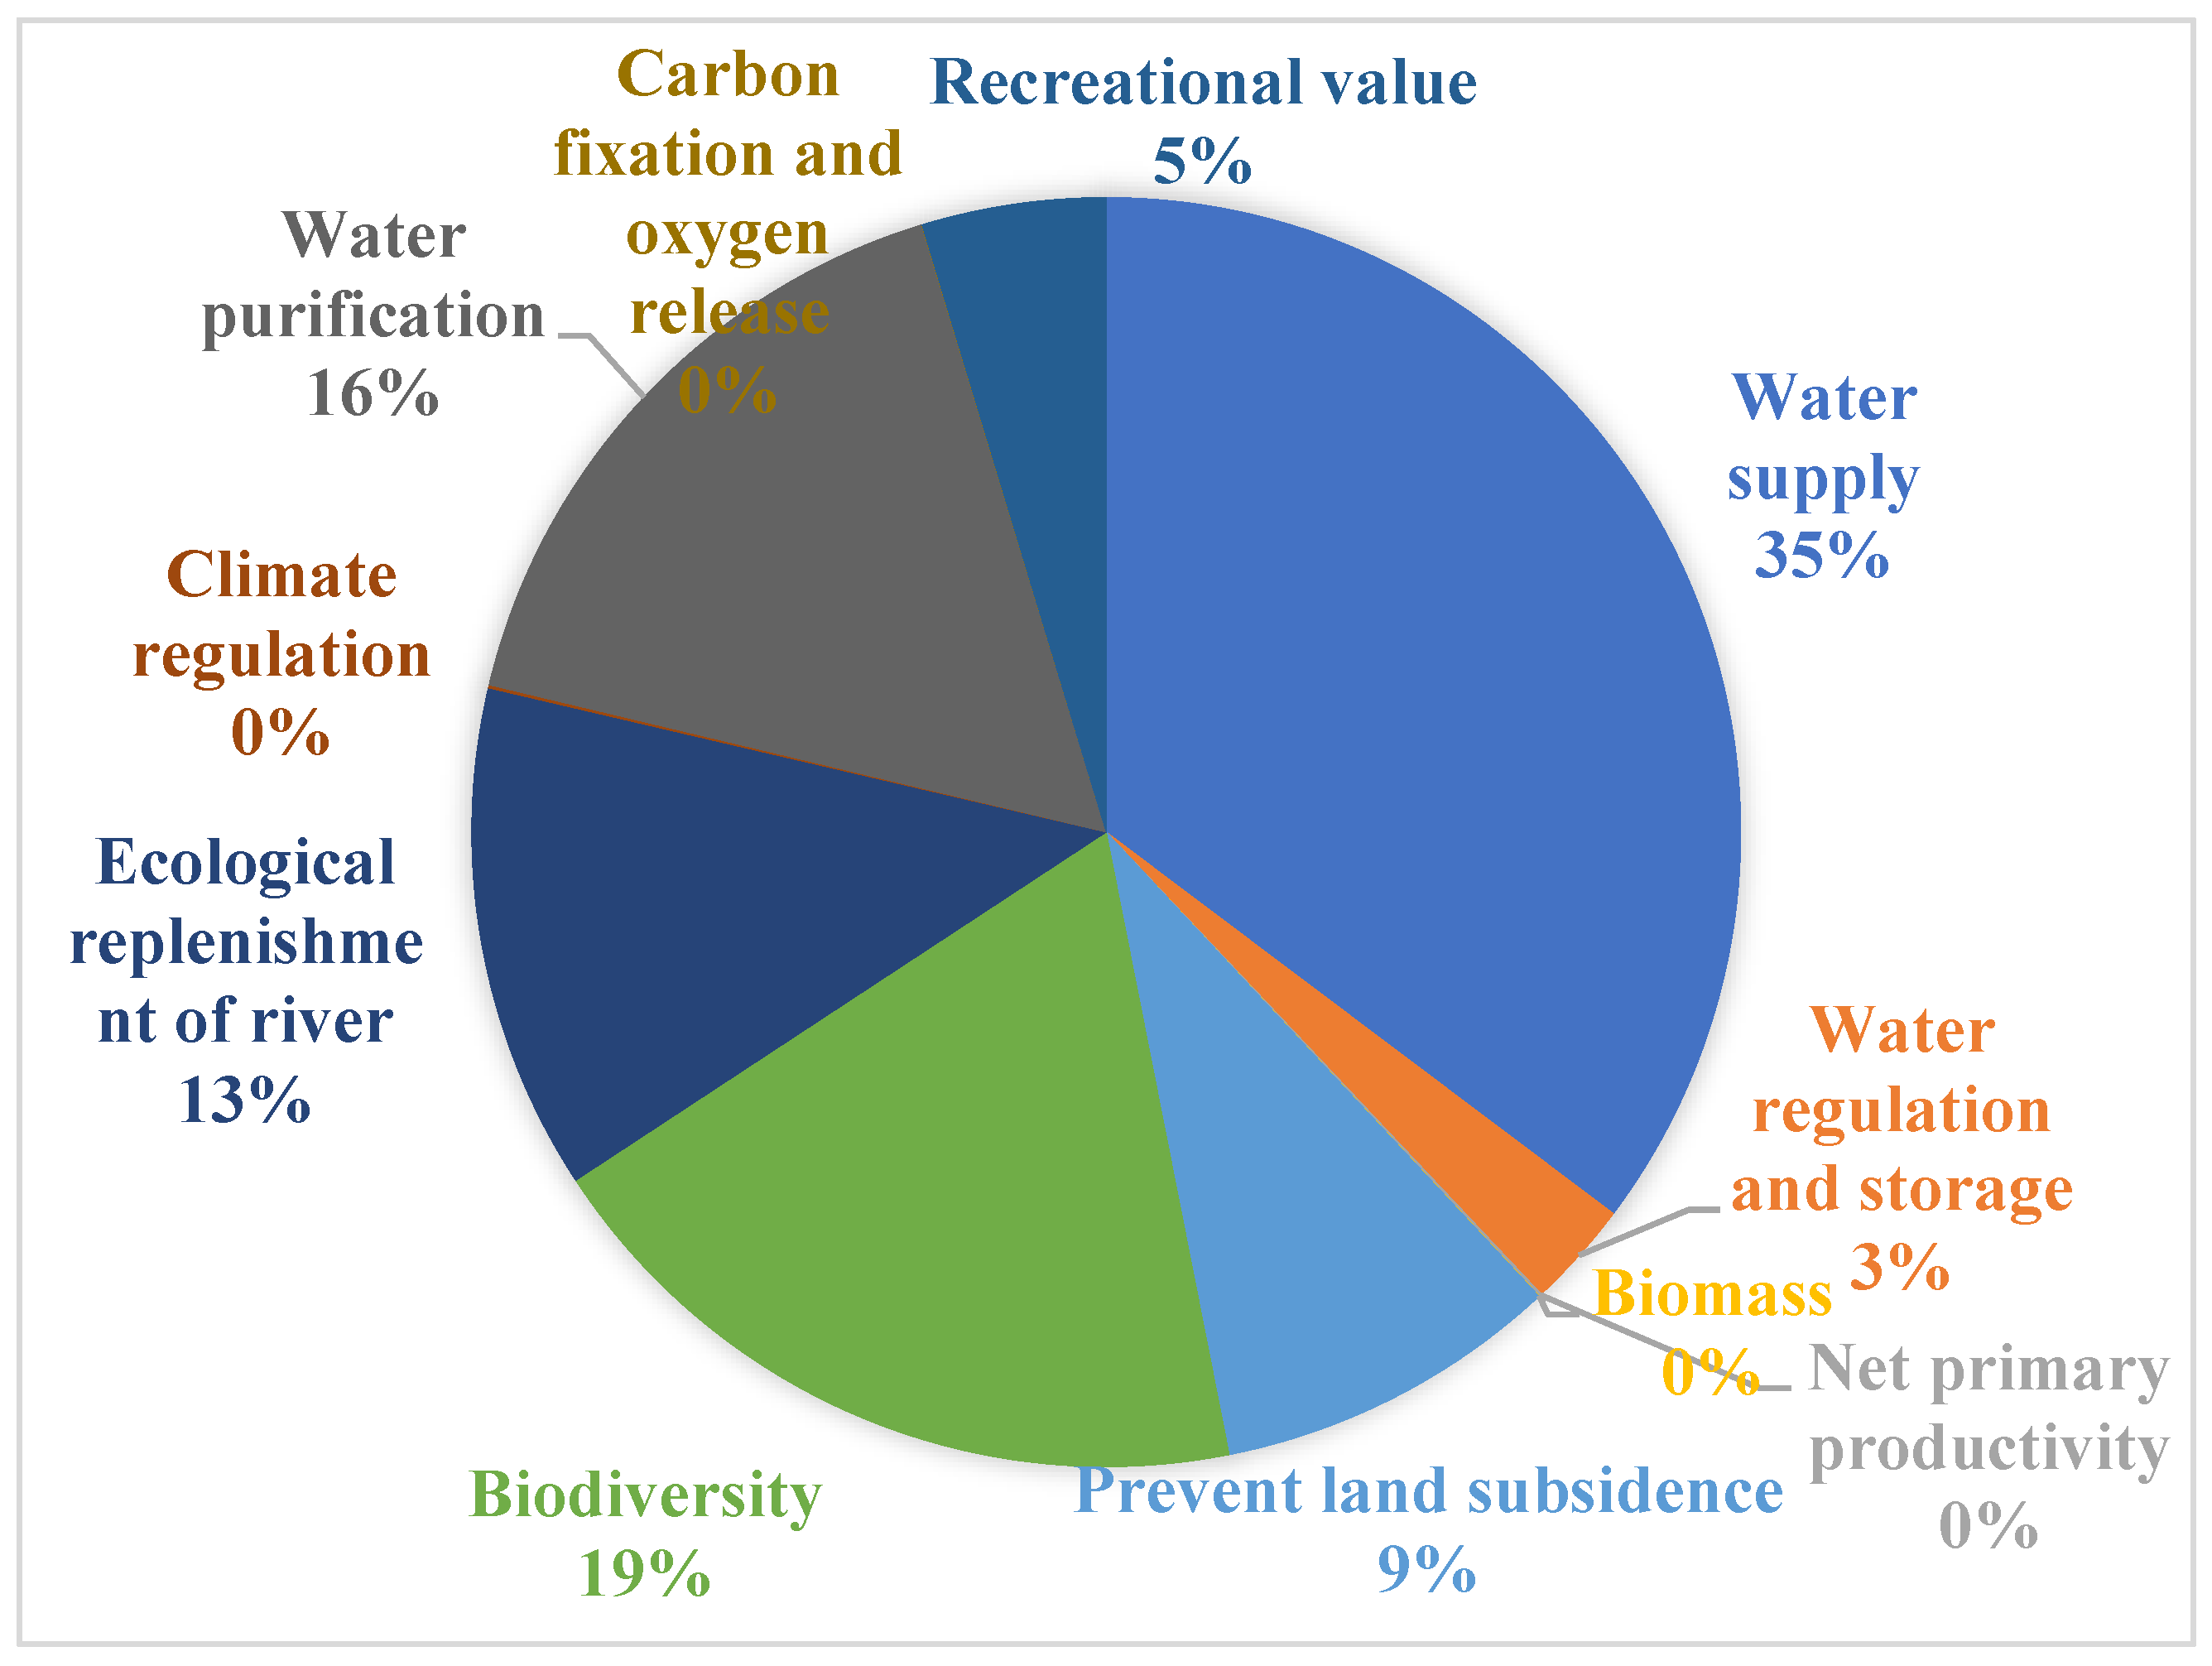
3.1. Increment of Ecosystem Service Value

The increment of ecosystem services attributable to the SNWDP in Beijing are shown in Table 6, with a total value of $610 million. The exchange rate was 6.39 RMB to the US dollar in 2015, which was calculated as 3.898 billion RMB.

3.2. WTP of Residents

A CVM was adopted to construct a hypothetical market scenario, using a questionnaire survey to obtain the WTP of stakeholders, with respect to the provision of ecological services. WTP is closely related to the social characteristics of stakeholders in the water demand area, their understanding of the project, and their personal income level. The WTP of the users of ecosystem service is an important theoretical basis for establishing the social and economic relationship between the upstream and downstream of the “watershed”.
The questionnaire survey on WTP of residents for water reserves impacted by the SNWDP in Beijing had three components: the social identity of the respondents, background knowledge, and WTP. The first part involved collecting relevant social background information, including age, sex, educational background, income, occupation, and residence type. The second part consisted of investigating the knowledge of the individuals surveyed regarding the SNWDP and water reserves. The third part aimed to determine each individual’s WTP. The questionnaire was designed with reference to previous applications and advice from experts and engineers. The survey used a computer-assisted telephone interviewing system to interview permanent residents of Beijing aged 20 to 70 years and who had resided in the city continuously for over half a year.
A total of 906 data samples were obtained, of which 776 were valid. Excluding 0 WTP, respondents willing to pay 6–20 RMB constituted the largest percentage (25.77%). Those willing to pay 21–100 RMB constituted 24.36% and those willing to pay over 100 RMB constituted the smallest percentage (3.4%). The average sum that people were willing to pay was 42.15 RMB. The permanent resident population of Beijing was 21.705 million in 2015 (Statistical Yearbook of Beijing) and therefore the annual WTP of residents for the water resources reserve of the SNWDP was 915 million RMB. Relevant research results have been previously reported by Peng et al. [35].

4. Discussion

Figure 3 shows the proportional value of each ecological and environmental index to the total ecosystem service value. The total value of ecosystem services attributable to the SNWDP in Beijing was very large. The value of water supply was the largest, accounting for 35.26% of the total, followed by biodiversity (18.86%). The proportion of the value attributable to climate regulation, net primary productivity, carbon sequestration, oxygen release, and biomass, were less than 0.1%, which indicated that the SNWDP positively influences the water supply function and the maintenance of biodiversity in Beijing, while having minimal impact on climate regulation, net primary productivity, carbon sequestration, oxygen release, and biomass accumulation. The indices directly related to the volume of water transferred were water supply, water purification, ecological replenishment of rivers, water regulation and storage, prevention of land subsidence, and these accounted for 76.27% of the total eco-environmental value. Therefore, the volume of water transferred played a decisive role in the value of ecosystem services. Beijing has a wide variety of animals and plants, and the diversion of water from the SNWDP will provide favorable conditions for maintaining biodiversity. The small amount of climate regulation, carbon fixation and oxygen release may be related to local environmental governance and global warming. From the perspective of recreational value, as a tourist city, the SNWDP water has recreated many valuable tourist attractions of Beijing, and income from tourism will increase annually and this proportion will also continue to rise.
The Emdollar ratio of Beijing in 2004 was 1.16 × 10¹³ sej/USD [36], and in 2005 was 4.48 × 10¹² sej/USD [37]. We found that the Emdollar ratio in 2015 was 2.71 × 10¹² sej/USD. Thus, the Emdollar ratio of Beijing has declined and was similar to that of developed countries, which is possibly related to the increasing value of imported goods, rapid growth of the GDP of Beijing, and the exchange rate of RMB. The Emdollar ratio of Beijing was smaller than that of cities in the Yangtze River Delta and Pearl River Delta in China [37], which demonstrates the development potential and highlights the potential for new development opportunities, along with large-scale investment.
The contradiction between water supply and demand in Beijing was the most prominent in the years before the SNWDP entered Beijing in 2014. The value of water resource ecosystem services in Beijing in 2008 was evaluated by Meng [38], which totaled 287.073 billion yuan. This study shows that after the SNWDP was put into operation in 2015, the increment of ecosystem service value was 3.898 billion RMB, an increase of about 1.4%, which is not a big increase, which may be related to the water transfer project just started operation. Because the middle route of the SNWDP officially started transferring water to Beijing on 27 December 2014, the time period of water transfer has been from 2015 to the present. Consequently, this study evaluated the water resource value in 2015 and did not develop a long-term series of water resource value assessments and prediction. As a national strategic project, the middle route of the SNWDP will continue for a long time and the amount of water transferred will also vary annually. Consequently, we plan to evaluate the annual water resource value of the SNWDP in Beijing.
The increment of ecosystem service value in Beijing due to the SNWDP was 3.898 billion RMB, while the WTP by the public was 915 million RMB. The public’s WTP was much lower than the increment of ecosystem service value. As the survey of WTP is always undertaken in a certain geographical area, its results are closely related to the political system, economic level, environmental awareness, environmental management mode, and supply mode of public goods in the surveyed area [39,40]. The practice of CVM in China is not widespread, especially in aspects of national measures and public facilities. The public has no experience in being consulted about public facilities and the WTP value obtained was relatively low [41]. Public awareness should be enhanced so that the public can truly understand the current status of water resources and the significance of the SNWDP project. Previous field investigations and regarding ecological compensation on the water-transfer area of SNWDP in 2010 demonstrated that the weighted minimum willingness-to-accept (WTA) to urban residents was 328 RMB/month, and the weighted minimum WTA to farmers was 342 RMB/month [42]. How to balance the differences between WTP and WTA is the direction of our group’s next research on ecological compensation.

5. Conclusions

Our analysis demonstrated that the increment of ecosystem service value in Beijing due to the SNWDP was 3.898 billion RMB, while the WTP by the public was 915 million RMB. Therefore, the increment of ecosystem service value was the highest standard of compensation, and the public’s WTP was the lower limit of ecological compensation. The public’s WTP was significantly lower than the increase in ecological environment value. Therefore, Beijing’s ecological compensation should be based on government compensation and supplemented by public compensation. Subsequently, the compensation standard can be established through negotiation between the suppliers and beneficiaries under the guidance of the relevant government and administrative agencies.
The following are suggestions to further improve the mechanism of ecological compensation.
  • Constructing an incentive mechanism for ecological compensation: incentives should be established for market entities and to encourage the public to participate in ecological compensation. Water-receiving areas should encourage industries that benefit from improved water quality. Such companies should share compensation to ease the financial pressure on governments. Furthermore, they should provide policy support or financial incentives to public organizations that actively participate in ecological compensation on the basis of obtaining ecological benefits.
  • Reducing the need for compensation in water-receiving areas: A focus on advantages of advanced industries and talents is required and the water-transfer areas should be assisted to reduce maintenance costs. The adjustment of industrial structures requires acceleration and industries with high water consumption and low output value should be regulated. A circular economy should be encouraged and the use of unconventional water resources should be extensively studied, with efforts made to develop and seek alternative water sources.
  • Establish a multi-subject regulatory evaluation system: public disclosure of financial status, the construction of public goods and achievements, and other measures should be implemented to enhance public trust, improve supervision and strengthen the audit and supervision duties of financial and audit departments. The compensation process should be regularly evaluated to protect the interests of the object of compensation and to verify the compensation standard. The results of ecological compensation evaluation and environmental monitoring can be included in the performance appraisal of the government.

Author Contributions

Conceptualization, Z.P.; methodology, Z.P.; H.W.; software, Z.P.; M.D. and M.L.; validation, Z.P.; formal analysis, Z.P.; investigation, X.H.; R.Z. and L.X.; resources, Z.P.; X.H.; R.Z. and L.X.; data curation, Z.P.; writing—original draft preparation, Z.P.; writing—review and editing, Z.P.; H.W.; X.H.; R.Z. and L.X.; visualization, Z.P.; supervision, Z.P.; project administration, Z.P.; funding acquisition, Z.P. All authors have read and agreed to the published version of the manuscript.

Funding

This research was funded by Natural Science Foundation of Jiangsu Province, grant number BK20200942 and Natural Science Research Project of Higher Education Institutions of Jiangsu Province, grant number 20KJB570003.

Institutional Review Board Statement

Not applicable.

Informed Consent Statement

Not applicable.

Data Availability Statement

Not applicable.

Conflicts of Interest

The authors declare no conflict of interest.

References

  1. Matete, M.E. The Ecological Economics of Inter-Basin Transfers: The Case of the Lesotho Highlands Water Project; University of Pretoria: Pretoria, South Africa, 2004. [Google Scholar]
  2. Yang, H.; Zehnder, A.J.B. The south-north water transfer project in China. Water Int. 2005, 30, 339–349. [Google Scholar] [CrossRef]
  3. Pagiola, S.; Bishop, J.; Landell Mills, N. Paying for water services in Central America: Learning from Costa Rica. In Selling Forest Environmental Services: Market-Based Mechanisms for Conservation and Development; Earthscan: Londers, Russia, 2002; pp. 37–61. [Google Scholar]
  4. Savy, C.E.; Turpie, J.K. Payments for Ecosystem Services: A Review of Existing Programmers and Payment Systems; Ahchor Environmental Consultants CC: Cape Town, South Africa, 2004. [Google Scholar]
  5. Fu, Y.; Zhang, J.; Zhang, C.; Zang, W.; Guo, W.; Qian, Z.; Liu, L.; Zhao, J.; Feng, J. Payments for Ecosystem Services for Watershed Water Resource Allocations. J. Hydrol. 2017, 556, 689–700. [Google Scholar] [CrossRef]
  6. Dong, Z.; Yan, Y.; Duan, J.; Fu, X.; Zhou, Q.; Huang, X.; Zhu, X.; Zhao, J. Computing payment for ecosystem services in watersheds: An analysis of the Middle Route Project of South-to-North Water Diversion in China. J. Environ. Sci. 2011, 23, 2005–2012. [Google Scholar] [CrossRef]
  7. Pattanayak, S.K. Valuing Watershed Services: Concepts and Empirics from southeast Asia. Agric. Ecosyst. Environ. 2004, 104, 171–184. [Google Scholar] [CrossRef]
  8. Adams, V.M.; Pressey, R.L.; Naidoo, R. Opportunity costs: Who really pays for conservation? Biol. Conserv. 2010, 143, 439–448. [Google Scholar] [CrossRef]
  9. Peng, Z.; Yin, J.; Zhang, L.; Zhao, J.; Liang, Y.; Wang, H. Assessment of the Socio-Economic Impact of a Water Diversion Project for a Water-Receiving Area. Pol. J. Environ. Stud. 2020, 29, 1771–1784. [Google Scholar] [CrossRef]
  10. Odum, H.T.; Peterson, N.C. Simulation and evaluation with energy systems blocks. Ecol. Model. 1996, 93, 155–173. [Google Scholar] [CrossRef]
  11. Cai, Z.F.; Zhang, L.X.; Zhang, B.; Chen, Z.M. Emergy-based analysis of Beijing-Tianjin-Tangshan region in China. Commun. Nonlinear Sci. Numer. Simul. 2009, 14, 4319–4331. [Google Scholar] [CrossRef]
  12. Fang, D.; Chen, S.; Chen, B. Emergy analysis for the upper Mekong river intercepted by the Manwan hydropower construction. Renew. Sust. Energ. Rev. 2015, 51, 899–909. [Google Scholar] [CrossRef]
  13. Bai, Y.; Zeng, H.; Wei, J. The Conderation on Several Defects of Ecological Footprint and Methodology. Acta Sci. Nat. Univ. Pekin. 2008, 3, 493–500. (In Chinese) [Google Scholar]
  14. Cai, H.S.; Xiao, F.M.; Zhang, X.L. Analysis of the ecological compensation based on ecological footprint change in Poyang Lake nature reserve of Jiangxi. Resour. Environ. Yangtze Basin 2010, 19, 623–627. (In Chinese) [Google Scholar]
  15. McAfee, K. The Contradictory Logic of Global Ecosystem Services Markets. Dev. Chang. 2012, 2, 105–131. [Google Scholar] [CrossRef]
  16. Liu, G.; Wen, Y.; Zhang, H. A Study on Ecological Compensation for the Guanting Reservoir Based on Ecosystem Services. Resour. Sci. 2010, 32, 70–77. (In Chinese) [Google Scholar]
  17. Kerr, J.; Milne, G.; Chhotray, V.; Baumann, P.; James, A.J. Managing watershed externalities in India: Theory and Practice. Environ. Dev. Sustain. 2007, 9, 263–281. [Google Scholar] [CrossRef]
  18. Hecken, G.V.; Bastiaensen, J.; Vásquez, W.F. The viability of local payments for watershed services-Empirical evidence from Matiguás, Nicaragua. Ecol. Econ. 2012, 74, 169–176. [Google Scholar] [CrossRef]
  19. Huang, K.; Wang, Z.; Yu, Y.; Yang, S. Assessing the environmental impact of the water footprint in Beijing, China. Water Policy 2015, 17, 777. [Google Scholar] [CrossRef]
  20. Zhai, Y.; Guo, Y.; Zhou, J.; Guo, N.; Wang, J.; Teng, Y. The spatio-temporal variability of annual precipitation and its local impact factors during 1724–2010 in Beijing, China. Hydrol. Process 2014, 28, 2192–2201. [Google Scholar] [CrossRef]
  21. Ma, Z.; Fang, Z.; Xie, X.; Chai, F.; Zhang, Q. Study on feature storage and storage capacity of underground reservoir based on GMS in MHS area of Beijing, China. Arab. J. Geosci. 2015, 8, 10359–10369. [Google Scholar] [CrossRef]
  22. Odum, H.T.; Brown, M.T.; Brandt-Williams, S. Handbook of Emergy Evaluation, Folio #1; University of Florida: Gainesville, FL, USA, 2000. [Google Scholar]
  23. Odum, H.T. Handbook of Emergy Evaluation, Folio #2; University of Florida: Gainesville, FL, USA, 2000. [Google Scholar]
  24. Jiang, M.M.; Chen, G.Q. Emergy Analysis of Chinese Society 1980–2005, Systems Ecology Reports; National Laboratory for Turbulence and Complex Systems, Peking University: Beijing, China, 2007. [Google Scholar]
  25. Li, Y. Emergy Analysis Method and Application of Water Resource Value; Hohai University: Tianjin, China, 2009. (In Chinese) [Google Scholar]
  26. Wu, B.; Liu, Q.; Lv, X. Natural Resource Economy; Tianjin People’s Press: Tianjin, China, 2002. (In Chinese) [Google Scholar]
  27. Li, D.; Chen, N.; Li, Y. Research on Available Regional Water Resources Value Based on Energy Theory. China Rural Water Hydropower 2015, 3, 22–24. (In Chinese) [Google Scholar]
  28. Zhao, S.; Li, M.; Wu, C. Emergy valuation of ecosystem services in the Zhoushan marine area. Acta Ecol. Sin. 2015, 35, 678–689. (In Chinese) [Google Scholar]
  29. Odum, H.T. Environmental Accounting: Emergy and Environmental Decision Making; John Wiley&Sons: New York, NY, USA, 1996. [Google Scholar]
  30. Zhang, C.; Zhao, Y.; Xing, Y.; Guo, R.; Zhang, Q.; Feng, Y.; Fan, E. Fish species diversity and conservation in Beijing and adjacent areas. Biodiversity 2011, 19, 597–604. (In Chinese) [Google Scholar]
  31. Chen, Y. Studies on Hydrophytes Diversity of Wetland in Beijing; Beijing Forestry University: Beijing, China, 2008. (In Chinese) [Google Scholar]
  32. Li, Y. Studies on the Community Structure and Biodiversity of Plankton and Zoobenthos in Miyun Reservoir; Chinese Academy of Agricultural Sciences: Beijing, China, 2013. (In Chinese) [Google Scholar]
  33. Gao, G. Water Quality Analysis and Prediction Research of South-to-North Water Diversion Project in Beijing Section; Beijing Forestry University: Beijing, China, 2016. (In Chinese) [Google Scholar]
  34. Liu, Q. Study on the Value of Riverhead Area Ecosystem Service and Eco-compensation Mechanism—A Case Study of Dongjiang Riverhead Area; Nanchang University: Nanchang, China, 2007. (In Chinese) [Google Scholar]
  35. Peng, Z.; Zhang, L.; Yin, J.; Wang, H. Study of Impact Factors of Willingness to Pay regarding Water Reserve of South-to-North Water Diversion Project in Beijing Based on Bayesian Network Model. J. Clean. Prod. 2018, 184, 569–578. [Google Scholar] [CrossRef]
  36. Jiang, M.M.; Zhou, J.B.; Chen, B.; Yang, Z.F.; Ji, X.; Zhang, L.X.; Chen, G.Q. Ecological evaluation of Beijing economy based on emergy indices. Commun. Nonlinear Sci. Numer. Simul. 2009, 14, 2482–2494. [Google Scholar] [CrossRef]
  37. Song, Y.Q.; Cao, M.L.; Zhang, L.X. Emergy-based comparative analysis of urban ecosystem in Beijing, Tianjin and Tangshan. Acta Ecol. Sin. 2009, 5, 1101–1109. [Google Scholar]
  38. Meng, Q.; Ouyang, Z.; Ma, D. Water Ecosystem Service Assessment and Valuation in Beijing; Science Press: Beijing, China, 2012. (In Chinese) [Google Scholar]
  39. Sun, C.; Yuan, X.; Xu, M. The public perceptions and willingness to pay: From the perspective of the smog crisis in China. J. Clean. Prod. 2016, 112, 1635–1644. [Google Scholar] [CrossRef]
  40. Tan, J.; Zhao, J. The Value of Clean Air in China: Evidence from Beijing and Shanghai. Front. Econ. China 2014, 9, 109–137. [Google Scholar]
  41. Wang, X.J.; Zhang, W.; Li, Y.; Yang, K.Z.; Bai, M. Air Quality Improvement Estimation and Assessment Using Contingent Valuation Method, A Case Study in Beijing. Environ. Monit. Assess. 2006, 120, 153–168. [Google Scholar] [CrossRef]
  42. Wang, G.D.; Wang, Y.X.; Tu, J.F. Research on ecological compensation mechanism for water sources area of Middle Route Project of South to North Water Diversion. Yangtza River 2012, 21, 89–93. (In Chinese) [Google Scholar]
Figure 1. Middle Route of the south-to-north water diversion project.
Sustainability 13 05236 g001
Figure 2. System diagram of the emergy flows of water-receiving area.
Sustainability 13 05236 g002
Figure 3. Proportion of each ecological environment index value in the total eco-environmental value.
Sustainability 13 05236 g003
Table 1. Emergy synthesis table of resource and economic flows of Beijing in 2015.
TypeItemRaw DataSolar Transformity (sej/J or sej/g or sej/$)Solar Emergy (sej)
Renewable ResourcesSunlight (J)6.91 × 101916.91 × 1019
Wind (J)4.86 × 101624501.19 × 1020
Rain, geopotential (J)6.55 × 101447,0003.08 × 1019
Rain, chemical (J)2.97 × 101630,5009.06 × 1020
Earth cycle (J)3.12 × 10165.80 × 1041.81 × 1021
Water from SNWDP (m3)7.55 × 1088.50 × 10116.42 × 1020
Non-renewable ResourcesCoal (J)2.68 × 10176.69 × 1041.79 × 1022
Soil losses (g)3.19 × 10121.71 × 1095.45 × 1021
ImportsGoods ($)5.47 × 10106.92 × 10123.79 × 1023
Services ($)8.12 × 10105.85 × 10124.75 × 1023
Energy sources (J)9.00 × 10178.81 × 1047.93 × 1022
Tourism ($)4.61 × 1093.80 × 10121.75 × 1022
Summary 9.77 × 10²³
Notes: Solar transformity refers to Handbook of emergy evaluation, Folio #1 [22]; Handbook of emergy evaluation, Folio #2 [23]; Environmental accounting: emergy and environmental decision making, Emergy analysis of Chinese society 1980–2005, systems ecology reports [24]. Imported goods include food, pulp, synthetic rubber, cotton, clothing, machinery, and parts for construction and mining, motors and generators, and electrical circuits. Imported energy sources include minerals and fuel oil. Tourism primarily refers to international tourism.
Table 2. Emergy value of maintaining biodiversity.
CategorySpeciesEmergy Transformity
(sej/Species)
Emergy (sej)
Fish491.26 × 10254.95 × 1019
Aquatic plants121.26 × 10251.21 × 1019
Phytoplankton711.26 × 10257.17 × 1019
Zooplankton711.26 × 10257.17 × 1019
Benthic animals151.26 × 10251.52 × 1019
Birds911.26 × 10259.19 × 1019
Sum309 3.12 × 10²⁰
Table 3. Emergy transformity of surface water vapor at specific elevations.
Elevation (m)Emergy Transformity (sej/J)
012.2
99021.4
195025.1
301042.7
4200113.0
5570176.0
Table 4. Emergy values for water purification.
ParameterDifference (mg/L)Emergy Transformity (sej/g)Emergy Value (sej)
NH3-N0.032.80 × 1098.90 × 1016
TN0.973.80 × 1093.91 × 1018
Hardness2551.00 × 1092.70 × 1020
Sum 2.74 × 10²⁰
Table 5. Water scenic spots impacted by the SNWDP in Beijing.
Scenic SpotWater LandscapeActivityMode of Payment
Ming Tombs ReservoirMing Tombs ReservoirSightseeing, yachtTickets
Shidu Scenic SpotJuma riverSightseeing, yachtTickets
Garden Expo ParkYongding riverSightseeingTickets
Summer PalaceKunming LakeSightseeing, boatingTickets
lugou BridgeLugouxiaoyueSightseeingTickets
Yuyuantan ParkYuyuantanSightseeing, boatingTickets
Table 6. Ecosystem service emergy-currency value of SNWDP in Beijing.
ItemRaw DataEmergy TransformityEmergy (sej)USD ($)Proportion (%)
Water supply6.86 × 108 m38.50 × 1011 sej/m35.83 × 10202.15 × 10835.26
Water regulation and storage2.72 × 108 m31.64 × 1011 sej/m34.46 × 10191.65 × 1072.71
Net primary productivity2.09 × 1010 g5.78 × 107 sej/g1.21 × 10184.46 × 1050.07
Biomass4.18 × 1010 g5.11 × 106 sej/g2.14 × 10177.90 × 1040.01
Prevent land subsidence4.32 × 108 m33.38 × 1011 sej/m31.46 × 10205.39 × 1078.84
Biodiversity309 spices1.26 × 1025 sej/spices3.12 × 10201.15 × 10818.86
Ecological replenishment of river2.5 × 108 m38.50 × 1011 sej/m32.13 × 10207.86 × 10712.89
Climate regulation1.04 × 1014 KJ12.20 sej/J1.27 × 10184.69 × 1050.08
Water purificationNH3-N, TN, Hardness 2.74 × 10201.01 × 10816.57
Carbon fixation and oxygen release 2.29 × 10178.45 × 1040.01
Recreational value1.484 × 109 RMB2.71 × 1012 sej/$7.74 × 10192.86 × 1074.69
Sum 6.10 × 108100.00
Publisher’s Note: MDPI stays neutral with regard to jurisdictional claims in published maps and institutional affiliations.

