Abstract
Graphene quantum dots (GQDs) have been successfully used as a highly sensitive probe for the sensing of formaldehyde (HCHO) in an aqueous solution. Through static quenching, the probe utilizes the interaction between HCHO and GQDs to trigger the “turn off” fluorescence response, and has good selectivity. The probe can detect HCHO in a pure aqueous solution, and it also can still detect HCHO in a complex environment with a pH range from 4 to 10. The concentration of HCHO and the fluorescence intensity of GQDs show a good linear relationship within the range of HCHO of 0–1 μg/mL, which was much more sensitive than previous reports. The limit of HCHO detection by GQDs is about 0.0515 μg/mL. In addition, we successfully applied it to the actual food inspection. It is proved to be a selective, sensitive and visualized method to check whether the concentration of HCHO in the foods exceeds the regulatory limit, which presents a potential application in food safety testing.
1. Introduction
Formaldehyde, as the simplest carbonyl compound, is widely used in our daily lives. Due to its antiseptic and bactericidal properties, formaldehyde is often added to foods to keep them fresh. However, excessive intake of formaldehyde is extremely harmful to the human body. As early as 2009, formaldehyde was included in the list of carcinogens by the International Agency for Research on Cancer (IARC) due to its strong pathogenicity for nasopharyngeal carcinoma and weak pathogenicity for leukemia [1]. Therefore, it is extremely important to detect formaldehyde in food with high sensitivity. At present, the detection methods of formaldehyde mainly include spectrophotometry [2], gas chromatography [3], high-performance liquid chromatography [4], Raman spectroscopy [5], mass spectrometry [6] and fluorescence spectrophotometry [7]. In recent years, fluorescence detection technology has received more and more attention due to its simple measurement, high sensitivity, and strong specificity. Specifically, reactive fluorescent probes have been developed [7,8,9]. The detection reaction mainly includes the reaction of amino (-NH2) [10,11,12] or hydrazine (-NH-NH2) [13,14] with formaldehyde and the aza-Cope rearrangement reaction [15,16,17,18]. However, since most of the reaction molecules cannot be directly dissolved in pure water, the reactions are carried out in non-neutral aqueous solutions or organic solvents [19,20,21]. This greatly limits their practical applications. Therefore, it is necessary to develop a fluorescent probe that can detect formaldehyde in pure water solvent.
Graphene quantum dots (GQDs), a new type of 0D carbon nanomaterial, have attracted more and more attention due to their excellent optical properties, high chemical stability, low environmental hazards and excellent biocompatibility. The preparation of GQDs mainly includes “bottom-up” and “top-down” methods [22]. The “bottom-up” method mainly converts non-graphite carbon sources into GQDs through chemical reactions, such as pyrolysis [23,24,25], microwave [26,27], ultrasonic [28], hydrothermal [29], etc. The “top-down” method mainly uses physical or chemical methods to strip or decompose bulk carbon materials into nano-sized graphene, such as arc discharge [30], laser ablation [31,32], electrochemical oxidation [33,34], chemical cutting [35],, etc. The pyrolysis method mainly controls the degree of carbonization of the substance by controlling the heating time to prepare GQDs. It is widely used because of its simple operation and low preparation cost. As a new type of fluorescent probe, GQDs are widely used in fluorescence detection [36,37,38,39,40], bioimaging [41], drug delivery [42,43,44], photocatalysis [45,46,47] and other fields. In recent years, it has also attracted great attention in the development of specific and selective fluorescent sensing probes. Thus far, GQDs have been reported to detect metal ions and organic matter, such as Fe3+ [25,48,49,50], Hg2+ [50,51,52,53], Cu2+ [54], TNT [39] and benzoquinones [36,37,38,40], etc. The fluorescence of GQDs can be effectively quenched by electron acceptors or electron donors in solution, which indicates that GQDs are excellent electron donors or electron acceptors. This provides the possibility for GQDs to detect formaldehyde. The surface of GQDs contains a large number of carboxyl and hydroxyl groups, which gives it excellent water solubility, so GQDs can be well-dispersed in pure water solvents [55]. It is these excellent properties that make GQDs a competitive substitute for organic fluorescent probes and heavy metal quantum dots.
In this work, we presented a method to accurately detect formaldehyde in pure aqueous solutions using the fluorescence characteristics of GQDs. It has solved the dilemma that HCHO must be detected in organic solvents or acid-base solutions. Through static quenching, GQDs interact with formaldehyde in the ground state, meaning that formaldehyde can effectively quench the fluorescence of GQDs. The probe can selectively and sensitively detect formaldehyde in the range of 0–1.0 μg/mL. In addition, the fluorescence intensity of GQDs in this interval also showed a good linear relationship with the concentration of formaldehyde. Unmodified GQDs can effectively detect formaldehyde in pure water solvents. There is a potential application in the green detection of formaldehyde in aqueous solutions in the future.
2. Materials and Methods
2.1. Materials
All chemicals used were at least of analytical reagent grade and used without further purification. Citric acid and sodium hydroxide were obtained from Shanghai Aladdin Biotechnology Co., Ltd. (Shanghai, China). Formaldehyde solution and paraffin liquid were purchased from Rhawn of Shanghai Yi en Chemical Reagent Co., Ltd. (Shanghai, China). Ethanol, methanol, acetaldehyde, acetone and phosphoric acid were obtained from Fuchen Chemical Reagent Co., Ltd. (Tianjin, China). Benzene, Toluene, Xylene and ammonia were purchased from Tianjin Kemiou Chemical Reagent Co., Ltd. (Tianjin, China). The water used in all experiments was ultrapure water with a resistivity of 18.2 MΩ·cm.
2.2. Synthesis of GQDs
GQDs were synthesized according to the reported method [23]. In short, we added 2 g citric acid (CA) to a small sample bottle and put it in an oil bath heated to 200 °C with a magnetic stirrer. CA changed from a solid state to a colorless liquid state, and then gradually turned yellow. In about thirty minutes, the color of the liquid turned orange. We then added the orange liquid drop wise to 10 mg/mL NaOH solution under vigorous stirring. Finally, we adjusted the solution to neutral with a 10 mg/mL NaOH solution. The solution of GQDs was obtained and stored in a refrigerator at 4 °C for use. The characteristic test of GQDs was further purified. Ethanol was added to the GQDs to make the large particles settle, and then dried with a rotary evaporator. The GQDs can be easily redispersed into water.
2.3. Characterization
Fluorescence emission and excitation spectra were recorded on a Hitachi F-4600 fluorescence spectrophotometer. The slit widths of emission and excitation were both 5 nm, and the voltage of PMT was 700 V. Transmission electron microscopy (TEM) images were obtained with a FEI Talos F200S field emission high resolution transmission electron microscope. Atomic force microscope (AFM) images were taken with an Agilent 5500 Atomic force microscope. Fourier transform infrared spectroscopy (FTIR) was conducted using a Bruker Vertex 80 V Spectrometer. The fluorescence lifetime was recorded on an Edinburgh Instruments FSP920 Fluorescence Spectrometer. Zeta potential was carried out with a Malvern Zetasizer Nano ZEN3600 instrument. UV-Vis absorption spectra were measured on an Analytik Jena Specord 250 plus UV VIS Spectrophotometer.
2.4. Quantum Yields (QY) Measurements of GQDs
The fluorescence QY of GQDs were measured by a reference method [56]. Quinine sulfate and GQDs were prepared into solutions with an absorbance value of less than 0.05, and then diluted into five solutions with different concentrations. We calculated their fluorescence QY by measuring their ultraviolet absorption and fluorescence emission spectra. Calculated according to the following formula, Mx and Mst are the slope of the straight line obtained by plotting the integrated area of the fluorescence intensity of GQDs and quinine sulfate and the absorbance value, respectively. φx and φst are the QY of GQDs and quinine sulfate, and the value of φst is 0.54. ηx and ηst are the refractive indices of GQDs and quinine sulfate solutions, and both are 1.33.
2.5. Detection of HCHO
The detection of HCHO was carried out by measuring the fluorescence spectra of GQDs in the presence and absence of HCHO. Simply put, we added HCHO of different concentrations to 1 mg/mL GQDs, then diluted the solution to 0.5 mg/mL by adding ultrapure water, and allowed the solution to interact at 30 °C for 8 h. The concentration of HCHO was detected by the linear relationship between fluorescence intensity of GQDs and concentration of HCHO.
2.6. Detection of HCHO in Real Food
The detection of HCHO in food samples aims to extract HCHO from the food by steam distillation. In short, we placed 10 g of meat into a 250 mL two-necked flask, then added 20 mL of ultrapure water, 10 mL of 10% phosphoric acid, 25 mL of liquid paraffin, and then used steam distillation to extract 200 mL of distillate. An equal volume of extract was added to 1 mg/mL GQDs (contaminated sample is 4 μg/mL HCHO was added to the extract), and the fluorescence intensity of GQDs was measured at 30 °C for 8 h to determine the content of HCHO in food. Fluorescent test paper detects HCHO in real samples by placing 2 g of normal samples or contaminated samples into Petri dishes with GQDs fluorescent test paper. HCHO in contaminated food will transfer from the food to the GQDs fluorescent test paper through volatilization. GQDs fluorescent test paper was prepared by soaking non-fluorescent test paper through GQDs and then drying. Food with excessive HCHO was made by soaking the meat in 1 mg/mL HCHO for 10 min. The detection of HCHO in food extract and the GQDs fluorescent test paper to detect HCHO in real food were repeated three times or more.
3. Results and Discussion
3.1. Principle of GQDs Detecting HCHO
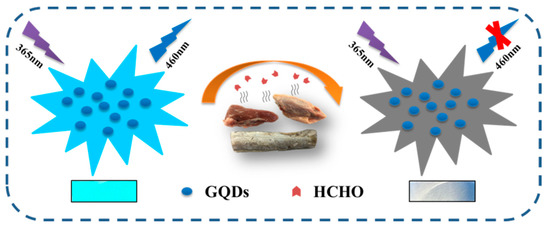
Scheme 1 shows a schematic diagram of GQDs detecting HCHO. GQDs can emit bright cyan fluorescence under the irradiation of ultraviolet light, and after interacting with HCHO, the fluorescence of GQDs is quenched. In foods with excessive HCHO content, HCHO transfers to the test paper through volatilization and quenches the fluorescence of GQDs. GQDs fluorescent test paper does not emit fluorescence, while GQDs fluorescent test paper in normal food still emits bright cyan fluorescence.
Scheme 1.
Schematic representation of GQDs fluorescence detection HCHO, and the sizes of GQDs and HCHO are not drawn to scale.
3.2. Structure and Character of GQDs
To investigate the structure of GQDs, TEM and AFM were performed. It can be observed from the TEM image that GQDs are nanoparticles distributed almost in a circular shape. The inset (left) of the TEM image shows that these GQDs are uniform in size, ranging from 12 to 18 nm in diameter. Figure S1 is the TEM image of GQDs at a scale bar of 200 nm, which also shows that GQDs are uniformly dispersed nanosheets with a size of approximately 15 nm. Additionally, the size distribution of GQDs was also measured by dynamic light scattering in aqueous solution, which proved that the size of GQDs is between 12 and 30 nm, which is consistent with the TEM data (Figure S2). The high-resolution TEM (HRTEM) observation of the GQDs. Figure 1a inset (right) reveals the crystallinity of the GQDs, the labelled interplanar distance is 0.25 nm. AFM results show that the height of GQDs (Figure 1b) is mainly distributed in the range of 2~3 nm, similar to the height observed when approximately two to three layers are formed in graphene [52]. In addition, the zeta potential of GQDs was measured to be −9.2 mV (Table S1), confirming that the surface is negatively charged, which is related to the negatively charged carboxyl groups on the surface of GQDs. Figure S3 is the UV absorption graph of GQDs. It can be seen from the figure that GQDs have a strong absorption before 320 nm, which is similar to the UV absorption of graphene. GQDs has an ultraviolet absorption peak at 355 nm, and it is caused by n-π* transition of the C=O bond [57]. This feature shows that GQDs can be excited by widely used ultraviolet lamps, which is very convenient for application.
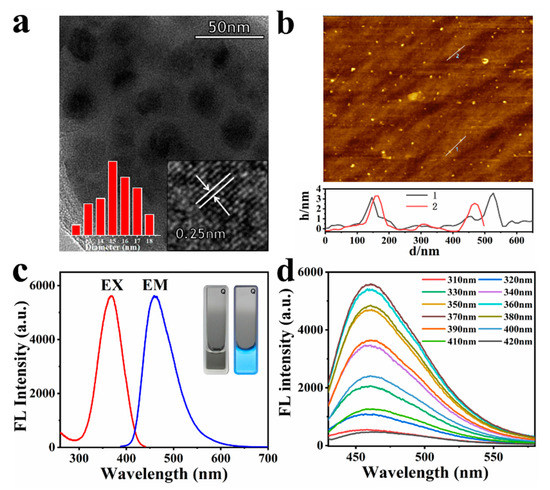
Figure 1.
(a) TEM images of GQDs. Inset: HR-TEM (right) and particle size distribution (left); (b) AFM image of the GQDs, line through some of the GQDs shows the height profile; (c) maximum excitation and emission of fluorescence spectra of the GQDs. Inset: photographs of the solution of GQDs taken under day light (left) and under UV light (right); (d) emission spectra of the GQDs with the excitation of different wavelengths.
The fluorescence emission spectra of the GQDs solution are depicted in Figure 1c. GQDs revealed fluorescence properties, as shown by the apparent absorption band at 366 nm, corresponding to the excitation spectra and displayed the fluorescence intensity (maximum emission) at 460 nm. The inset of Figure 1c is a digital photograph of the GQDs aqueous solution under day light (vis) and a 365 nm UV lamp. It is clearly observed that the GQDs sample shows a homogeneous dispersion in aqueous solution at room temperature and is highly stable. The GQDs solution at a low concentration (0.5 mg/mL) is colorless under visible light, and emits bright cyan fluorescence under ultraviolet light irradiation. Based on fluorescence spectral results, it is also inferred that CA polymerization changed the material structure to attain fluorescence characteristics. By selecting quinine sulfate as the standard, the fluorescence QY of GQDs at 366 nm were calculated to be about 8.57% (8.13~9.05%) (Tables S2 and S3, Figure S4), which is consistent with previous related literature [23]. Figure S5 is the stability of GQDs fluorescence intensity over time at 4 °C. The fluorescence intensity of GQDs gradually decreased over time, but it only dropped 15% in a week, indicating that the fluorescence of GQDs was very stable.
The fluorescence spectra of GQDs of different excitation wavelengths are shown in Figure 1d. The fluorescence of GQDs shows a slight correlation with the excitation wavelength, as with most carbon-based nanomaterials. With the increase in the excitation wavelength, the maximum value of the fluorescence emission peak of GQDs gradually shifts to the long wavelength direction. This may be caused by the surface defect state near the Fermi level of these carbon-based fluorescent nanomaterials [54,58]. However, it can be seen from Figure 1d that the maximum emission peak of GQDs is barely affected by the change in excitation wavelength. The excitation wavelength is from 320 to 410 nm, and the maximum emission wavelength of GQDs shifts from 457 to 463 nm. Additionally, this property shows that even if an ordinary UV lamp is used as the excitation light source, accurate detection data can be obtained.
The functional groups of the GQDs were confirmed by using FTIR (Figure S6). The band at 3430 cm−1 is assigned to stretching vibrations of -OH. Furthermore, the bands at 1700 cm−1 are from the stretching vibration of C=O. A peak related to C-O stretching vibration of the carboxyl group is at 1296 cm−1. The peak at 933 cm−1 is associated with the bending vibration of -OH. It indicates that there are lots of hydroxyl groups and carboxyl group on the surface of GQDs. It also explains why GQDs have good hydrophilic properties. The absorption peak at 1390 cm−1 is due to in-plane bending vibration of C-H. The bands at 2979 and 2920 cm−1 are attributed to the absorption band of -CH3 and -CH2 of antisymmetric stretching vibration. An aromatic C=C stretching vibration peak is observed at 1580 cm−1, which indicates the dehydration of CA to GQDs [23,26,52].
3.3. Ability of GQDs to Detect HCHO
GQDs have been increasingly used in the selective detection of luminescence species. The functional groups on the surface of GQDs play an important role in the fluorescence detection of organic compounds and ions. In this work, we found that HCHO has a strong quenching effect on GQDs. As shown in Figure 2a, when a certain amount of HCHO is added, the fluorescence intensity of GQDs will decrease to a certain extent. With the increase in HCHO concentration, the fluorescence quenching of GQDs becomes more obvious. Therefore, we can use GQDs as fluorescent probes to detect HCHO. In order to ensure that the detection result is not affected by the inner-filter effect of fluorescence and is more accurate, we tested the fluorescence intensity of different concentrations of GQDs in aqueous solution. From Figure S7, we can see that as the concentration of GQDs increases, the fluorescence intensity of GQDs gradually increases. Due to the influence of the inner-filter effect of fluorescence, when the concentration of GQDs is greater than 0.05 mg/mL, the rate of increase in the fluorescence intensity of GQDs decreases significantly. Finally, we decided to use 0.5 mg/mL GQDs aqueous solution to detect HCHO. In addition, in order to perform the test in a more real environment, the temperature is set at 30 °C.
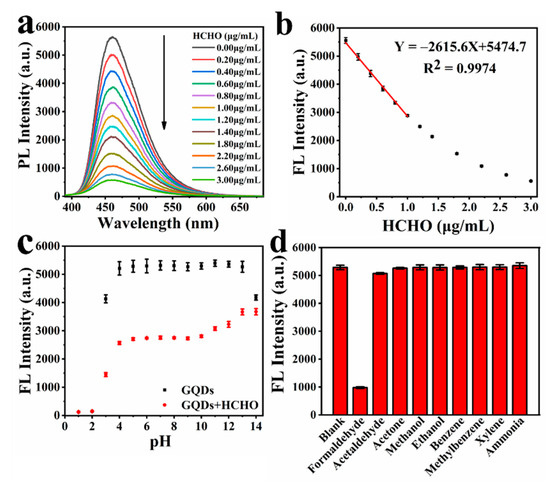
Figure 2.
(a) Fluorescence emission spectra of GQDs in the presence of different concentrations of HCHO; (b) the linear relationship between the fluorescence intensity of GQDs and concentration of HCHO; (c) fluorescence intensity of aqueous solution of GQDs and the ability detect to HCHO of GQDs in different pH; (d) the selectivity of GQDs detection of HCHO by fluorescence.
The interaction time between HCHO and GQDs is shown in Figure S8; 2 μg/mL of HCHO was added to the GQDs solution. As the interaction time increases, the fluorescence intensity of GQDs continues to decrease, and the decrease becomes slower and slower with the increase in time. The rate of change in fluorescence intensity is already very low when the interaction progresses to 8 h. Therefore, the concentration of HCHO can be determined by measuring the fluorescence intensity of GQDs at 8 h of this interaction. The effect of different concentrations of HCHO on the fluorescence intensity of GQDs is shown in Figure 2a. As the concentration of HCHO increases, the fluorescence intensity of GQDs continues to decrease. Figure 2b shows that in the range of HCHO concentration of 0–1 μg/mL, there is a good linear relationship between the fluorescence intensity of GQDs and the concentration of HCHO—the linear regression equation was Y = −2281.82 X + 5249.77, with a correlation coefficient R2 = 0.98685. Additionally, the theoretical limit of detection (LOD) of our sensor was calculated to be about 0.0515 μg/mL, according to the extensive accepted method [59]. This probe can be comparable with many reported fluorescent probes (Table S4).
where σ is the standard deviation of the corrected blank signals of the GQDs and s is the slope of the calibration curve.
In order to study the application range of fluorescence detection of HCHO, we tested the fluorescence intensity of GQDs under different pH conditions, and the fluorescence intensity of GQDs after interacting with HCHO under different pH conditions. The result is shown in Figure 2c. Under alkaline conditions, the fluorescence intensity of GQDs decreased significantly only at pH = 14, but the effect of GQDs’ detection of HCHO by fluorescence at the range of pH = 11–14 decreased significantly as the alkalinity increased. Under acidic conditions, the fluorescence intensity of GQDs and GQDs after interacting with HCHO both dropped significantly at pH = 3. Additionally, when the pH ≤ 2, the fluorescence of GQDs was completely quenched by H+, GQDs were no longer able to detect HCHO as a fluorescent probe. In general, the fluorescence intensity of GQDs is very stable in the range of pH = 4–13, and GQDs can accurately detect HCHO by means of fluorescence in the range of pH 4–10. This shows that GQDs can detect HCHO in a wide pH range.
Selectivity is a very important parameter to evaluate the performance of a new fluorescence probe. As shown in Figure 2, we measured the effects of common substances and substances similar in structure to HCHO on the fluorescence intensity of GQDs. The fluorescence of the GQDs solution was obviously quenched by HCHO. Acetaldehyde has a slight effect on the fluorescence of GQDs due to its structure being very similar to HCHO, but its fluorescence quenching effect on GQDs is less than 5%, and will not affect the detection of HCHO by GQDs. Other substances have no quenching effect on the fluorescence of GQDs. This indicates the GQD fluorescent probe has good selectivity to HCHO.
3.4. Mechanism of GQDS Detects of HCHO
In order to verify the mechanism of fluorescence quenching by HCHO, we comparing the FTIR spectra of GQDs before and after the interaction with HCHO, explain the changes in the surface functional groups of GQDs (Figure S6). We found that the stretching vibration absorption peak of C-O-C at 1130 cm−1 is significantly enhanced. Additionally, the C-O at 1000 cm−1 and the -OH stretching vibration at 933 cm−1 also increased. In addition, we also found that the C-O stretching vibration absorption peak of the carboxyl group at 1296 cm−1 slightly weakened. This suggests that HCHO has interacted with the groups on the surface of GQDs. It can be seen from Table S1 that after the interaction of GQDs with HCHO, the zeta potential of GQDs changed from −9.20 to −4.55 mV, indicating that the negatively charged groups on the surface of GQDs decreased. It also proved that the groups on the surface of GQDs changed. Additionally, the UV-Vis absorption spectra of aqueous solutions of GQDs in the presence of different concentrations of HCHO indicate that the maximum absorption peak decreases with the increase in HCHO concentration (Figure 3a). Additionally, the absorption peak has a clear blue shift. This implies that GQDs are consumed in the interaction with HCHO. The PL lifetime decay of GQDs shows a single exponential function, which is 1.51 ns. Additionally, the PL lifetime decay of GQDs after interaction with HCHO (1 μg/mL) is 1.55 ns (Figure 3b). The PL lifetime of GQDs before and after interaction with HCHO has hardly changed. This also implies that HCHO interacts with GQDs to generate non-luminescent ground state complexes, and the interaction is static quenching.
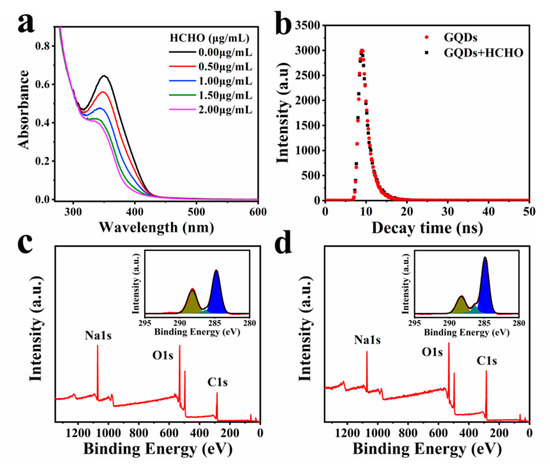
Figure 3.
(a) UV-Vis absorption spectra of GQDs interacted with different concentrations of HCHO (0–2 μg/mL); (b) PL decay of GQDs before and after interaction with HCHO; (c) XPS full scan survey of GQDs. Inset panels show the high-resolution C1s spectra; (d) XPS full scan survey of GQDs after interaction with HCHO. Inset panels show the high-resolution C1s spectra.
The surface chemical composition was explored by XPS analysis. In full scan XPS spectra of GQDs before and after the interaction with HCHO (Figure 3c,d), they show strong signals of C1s (284.13 eV), O1s (530.31 eV) and Na1s (1075.00 eV) peaks. After GQDs interacted with HCHO, the Na peak intensity became weaker. The decrease in Na indicates the decrease in carboxyl content on the surface of GQDs, which is similar to the result of FTIR spectra. The peak intensity ratios of O1s/C1s (RO/C) were calculated from full survey XPS spectra. The RO/C decreased from 0.734 to 0.497. This indicates that oxygen content in GQDs is largely reduced by HCHO. In the illustration of Figure 3c,d, the high-resolution C1s XPS spectra can be fitted into three gaussian peaks at 284.5, 286.1 and 288.6 eV, which correspond to the sp2 carbon (C-C/C=C) in graphene, the sp3 carbon (C-O), and the C=O. It can be seen from Figure 3c,d that the peaks at 288.6 eV have a significant decrease compared with before the interaction. Correspondingly, the peaks at 284.5 and 286.1 eV were enhanced. This means that the content of C=O was reduced, but the sp2 and sp3 carbon appeared to increase. It also implies that the groups on the surface of GQDs were changed. Figure S9 shows the pH of GQDs after interacting with different concentrations of HCHO (0–2.0 μg/mL). The results show that the pH of GQDs did not change with the addition of HCHO, suggesting that the carboxyl groups on the surface of GQDs did not interact with HCHO. Figure S10 shows the Raman spectra of GQDs before and after the interaction with HCHO. Since the D peak of GQDs is too weak, we roughly compared the ID/IG of GQDs before and after the interaction with HCHO. After GQDs interacted with HCHO, the ID/IG value changed from 0.295 to 1.05, indicating that sp3 carbon increased, which was consistent with the XPS data. The PL lifetime decay, UV-Vis absorption spectra, XPS and Raman spectra together intimate that the quenching mechanism of HCHO to GQDs is static quenching.
3.5. Detection of HCHO in Actual Food
To evaluate the applicability of the GQDs fluorescence probe, the performance of GQDs in three common meat samples (pork, chicken and hairtail) was investigated. HCHO in food samples is extracted by steam extraction. As can be seen from the image (Figure 4b), the extracts of the three foods basically did not quench the fluorescence of GQDs. However, the HCHO content in hairtail is slightly higher, compared with pork and chicken. We can see that the concentration of HCHO in hairtail is obviously less than 0.2 μg/mL, which means that the HCHO content in hairtail is less than 8 mg/kg, which is within the safe range. When 2 μg/mL of HCHO was added to water and three food extracts, all solutions showed an equal drop. Quite good consistency was obtained, demonstrating that the matrix effect of these water and food samples is negligible.
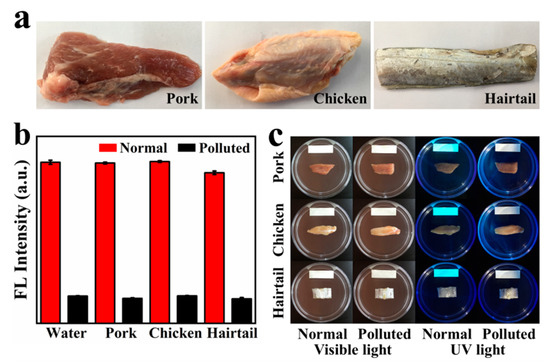
Figure 4.
(a) Photos of these real-world foods: pork, chicken and hairtail (purchased from the supermarket nearby); (b) fluorescence intensity of GQDs at 366 nm for three commercially available food extracts and water (normal and polluted); (c) detection of the content of HCHO in three foods (normal and polluted) by GQDs fluorescent test paper.
In addition, we made GQDs into test papers in order to further facilitate the application. Use test paper to quickly detect whether HCHO is added to food. Foods immersed in a HCHO solution usually have higher HCHO content than the detection range of GQDs. Therefore, at room temperature, the fluorescence of GQDs can be quenched by HCHO volatilized in the food in a short time. As shown in Figure 4c, the GQDs test paper in the normal sample emits cyan fluorescence under the irradiation of an ultraviolet lamp, and the fluorescence is not quenched. In the contaminated sample, through volatilization, HCHO is transferred from the food to the GQDs fluorescent test paper, quenching the cyan fluorescence of GQDs. Therefore, GQDs fluorescent test paper no longer emits cyan fluorescence. Preliminary experiments show that GQDs have great potential in making fluorescent test paper of HCHO. These results are quite encouraging, suggesting the potentially wide and practical application of the GQDs sensor.
4. Conclusions
In this work, we have proposed a method to detect HCHO in pure water solvent through a GQDs fluorescent probe. The detection of HCHO is based on static quenching to achieve the effect of fluorescence “turn-off”. GQDs have been proven to have high sensitivity to trace HCHO (0–3 μg/mL) in aqueous solution, and the HCHO concentration has a very good linear relationship with the fluorescence intensity of GQDs within the HCHO concentration range of 0–1 μg/mL. In particular, it can quantitatively analyze the HCHO concentration in many food and water samples in the real world. We have also prepared a GQDs fluorescent test paper to visually detect HCHO in foods, which shows that it has great potential practical application value.
Supplementary Materials
The following are available online at https://www.mdpi.com/article/10.3390/su13095273/s1, Figure S1. The TEM images of GQDs, Figure S2. The size distribution of GQDs was measured by dynamic light scattering in aqueous solution, Figure S3. UV-Vis absorption spectrum GQDs, Table S1: The zeta potential of GQDs before and after the interaction with HCHO, Table S2: UV absorption and its corresponding fluorescence spectrum integral area of quinine sulfate, Table S3: UV absorption and its corresponding fluorescence spectrum integral area of GQDs, Figure S4: (a) The relationship of fluorescence spectrum integral area of GQDs and its absorption; (b) the relationship of fluorescence spectrum integral area of quinine sulfate and its absorption, Figure S5. The stability of GQDs fluorescence intensity over time at 4 °C, Figure S6: FTIR of GQDs before and after the interaction with HCHO, Figure S7: Fluorescence intensity of different concentrations of GQDs, Figure S8: The interaction time of HCHO and GQDs, Table S4. The comparison of the detection limit and linear range of our probe and some existed ones, Figure S9. The pH of GQDs after interacted with different concentrations of HCHO, Figure S10. The Raman spectrum of GQDs before and after the interaction with HCHO.
Author Contributions
J.Q. and C.X. designed experiments and organized the manuscript; Y.Z. performed experimental part and analyzed data; M.L. performed experimental part; D.G. analyzed data. All authors have read and agreed to the published version of the manuscript.
Funding
This research was funded by the Natural Science Foundation of Hebei Province, grant number E2015202073.
Acknowledgments
The authors are grateful for the financial support of the Natural Science Foundation of Hebei Province.
Conflicts of Interest
The authors declare no conflict of interest.
References
- Baan, R.; Grosse, Y.; Straif, K.; Secretan, B.; El Ghissassi, F.; Bouvard, V.; Benbrahim-Tallaa, L.; Guha, N.; Freeman, C.; Galichet, L.; et al. Special Report: Policy A review of human carcinogens-Part F: Chemical agents and related occupations. Lancet Oncol. 2009, 10, 1143–1144. [Google Scholar] [CrossRef]
- Li, Q.; Sritharathikhun, P.; Motomizu, S. Development of novel reagent for Hantzsch reaction for the determination of formaldehyde by spectrophotometry and fluorometry. Anal. Sci. 2007, 23, 413–417. [Google Scholar] [CrossRef] [PubMed]
- Takeuchi, A.; Takigawa, T.; Abe, M.; Kawai, T.; Endo, Y.; Yasugi, T.; Endo, G.; Ogino, K. Determination of formaldehyde in urine by headspace gas chromatography. Bull. Environ. Contam. Toxicol. 2007, 79, 1–4. [Google Scholar] [CrossRef]
- Liu, J.F.; Peng, J.F.; Chi, Y.G.; Jiang, G.B. Determination of formaldehyde in shiitake mushroom by ionic liquid-based liquid-phase microextraction coupled with liquid chromatography. Talanta 2005, 65, 705–709. [Google Scholar] [CrossRef]
- Zhang, Z.M.; Zhao, C.; Ma, Y.J.; Li, G.K. Rapid analysis of trace volatile formaldehyde in aquatic products by derivatization reaction-based surface enhanced Raman spectroscopy. Analyst 2014, 139, 3614–3621. [Google Scholar] [CrossRef] [PubMed]
- Kato, S.; Burke, P.J.; Koch, T.H.; Bierbaum, V.M. Formaldehyde in human cancer cells: Detection by preconcentration-chemical ionization mass spectrometry. Anal. Chem. 2001, 73, 2992–2997. [Google Scholar] [CrossRef]
- Xu, Z.Q.; Chen, J.H.; Hu, L.L.; Tan, Y.; Liu, S.H.; Yin, J. Recent advances in formaldehyde-responsive fluorescent probes. Chin. Chem. Lett. 2017, 28, 1935–1942. [Google Scholar] [CrossRef]
- Ma, Q.; Cui, H.L.; Su, X.G. Highly sensitive gaseous formaldehyde sensor with CdTe quantum dots multilayer films. Biosens. Bioelectron. 2009, 25, 839–844. [Google Scholar] [CrossRef] [PubMed]
- Xia, H.; Hu, J.; Tang, J.; Xu, K.L.; Hou, X.D.; Wu, P. A RGB-Type Quantum Dot-based Sensor Array for Sensitive Visual Detection of Trace Formaldehyde in Air. Sci. Rep. 2016, 6, 9. [Google Scholar] [CrossRef]
- Cheng, H.R.; Zou, L.W.; Yang, L.; Wang, Z.G.; Lu, X.J. A Turn-on Fluorescence Probe for Rapid, Sensitive and Visual Detection of Formaldehyde. Chemistryselect 2019, 4, 432–436. [Google Scholar] [CrossRef]
- Dong, B.L.; Song, X.Z.; Tang, Y.H.; Lin, W.Y. A rapid and facile fluorimetric method for detecting formaldehyde. Sens. Actuators B Chem. 2016, 222, 325–330. [Google Scholar] [CrossRef]
- Song, H.; Rajendiran, S.; Kim, N.; Jeong, S.K.; Koo, E.; Park, G.; Thangadurai, T.D.; Yoon, S. A tailor designed fluorescent ‘turn-on’ sensor of formaldehyde based on the BODIPY motif. Tetrahedron Lett. 2012, 53, 4913–4916. [Google Scholar] [CrossRef]
- Tang, Y.H.; Kong, X.Q.; Xu, A.; Dong, B.L.; Lin, W.Y. Development of a Two-Photon Fluorescent Probe for Imaging of Endogenous Formaldehyde in Living Tissues. Angew. Chem. Int. Edit. 2016, 55, 3356–3359. [Google Scholar] [CrossRef] [PubMed]
- Xu, A.; Tang, Y.H.; Lin, W.Y. Development of a mitochondrial-targeted two-photon fluorescence turn-on probe for formaldehyde and its bio-imaging applications in living cells and tissues. N. J. Chem. 2018, 42, 8325–8329. [Google Scholar] [CrossRef]
- He, L.W.; Yang, X.L.; Liu, Y.; Kong, X.Q.; Lin, W.Y. A ratiometric fluorescent formaldehyde probe for bioimaging applications. Chem. Commun. 2016, 52, 4029–4032. [Google Scholar] [CrossRef] [PubMed]
- Li, J.B.; Wang, Q.Q.; Yuan, L.; Wu, Y.X.; Hu, X.X.; Zhang, X.B.; Tan, W.H. A two-photon fluorescent probe for bio-imaging of formaldehyde in living cells and tissues. Analyst 2016, 141, 3395–3402. [Google Scholar] [CrossRef] [PubMed]
- Li, Z.; Xu, Y.Q.; Zhu, H.L.; Qian, Y. Imaging of formaldehyde in plants with a ratiometric fluorescent probe. Chem. Sci. 2017, 8, 5616–5621. [Google Scholar] [CrossRef]
- Xu, J.C.; Zhang, Y.; Zeng, L.T.; Liu, J.B.; Kinsella, J.M.; Sheng, R.L. A simple naphthalene-based fluorescent probe for high selective detection of formaldehyde in toffees and HeLa cells via aza-Cope reaction. Talanta 2016, 160, 645–652. [Google Scholar] [CrossRef]
- Ding, H.Y.; Yuan, G.Q.; Peng, L.P.; Zhou, L.Y.; Lin, Q.L. TP-FRET-Based Fluorescent Sensor for Ratiometric Detection of Formaldehyde in Real Food Samples, Living Cells, Tissues, and Zebrafish. J. Agric. Food Chem. 2020, 68, 3670–3677. [Google Scholar] [CrossRef]
- Li, P.; Zhang, D.; Zhang, Y.C.; Lu, W.; Wang, W.Q.; Chen, T. Ultrafast and Efficient Detection of Formaldehyde in Aqueous Solutions Using Chitosan-based Fluorescent Polymers. ACS Sens 2018, 3, 2394–2401. [Google Scholar] [CrossRef]
- Zhou, W.; Dong, H.; Yan, H.; Shi, C.X.; Yu, M.M.; Wei, L.H.; Li, Z.X. HCHO-reactive molecule with dual-emission-enhancement property for quantitatively detecting HCHO in near 100% water solution. Sens. Actuators B Chem. 2015, 209, 664–669. [Google Scholar] [CrossRef]
- Shen, J.H.; Zhu, Y.H.; Yang, X.L.; Li, C.Z. Graphene quantum dots: Emergent nanolights for bioimaging, sensors, catalysis and photovoltaic devices. Chem. Commun. 2012, 48, 3686–3699. [Google Scholar] [CrossRef]
- Dong, Y.Q.; Shao, J.W.; Chen, C.Q.; Li, H.; Wang, R.X.; Chi, Y.W.; Lin, X.M.; Chen, G.N. Blue luminescent graphene quantum dots and graphene oxide prepared by tuning the carbonization degree of citric acid. Carbon 2012, 50, 4738–4743. [Google Scholar] [CrossRef]
- Chen, Q.L.; Wang, C.F.; Chen, S. One-step synthesis of yellow-emitting carbogenic dots toward white light-emitting diodes. J. Mater. Sci. 2013, 48, 2352–2357. [Google Scholar] [CrossRef]
- Zhang, Y.P.; Ma, J.M.; Yang, Y.S.; Ru, J.X.; Liu, X.Y.; Ma, Y.; Guo, H.C. Synthesis of nitrogen-doped graphene quantum dots (N-GQDs) from marigold for detection of Fe(3+) ion and bioimaging. Spectrochim. Acta A Mol. Biomol. Spectrosc. 2019, 217, 60–67. [Google Scholar] [CrossRef] [PubMed]
- Zhu, H.; Wang, X.L.; Li, Y.L.; Wang, Z.J.; Yang, F.; Yang, X.R. Microwave synthesis of fluorescent carbon nanoparticles with electrochemiluminescence properties. Chem. Commun. 2009, 5118–5120. [Google Scholar] [CrossRef]
- Puvvada, N.; Kumar, B.N.P.; Konar, S.; Kalita, H.; Mandal, M.; Pathak, A. Synthesis of biocompatible multicolor luminescent carbon dots for bioimaging applications. Sci. Technol. Ad. Mater. 2012, 13. [Google Scholar] [CrossRef] [PubMed]
- Tang, L.B.; Ji, R.B.; Cao, X.K.; Lin, J.Y.; Jiang, H.X.; Li, X.M.; Teng, K.S.; Luk, C.M.; Zeng, S.J.; Hao, J.H.; et al. Deep Ultraviolet Photoluminescence of Water-Soluble Self-Passivated Graphene Quantum Dots. ACS Nano 2012, 6, 5102–5110. [Google Scholar] [CrossRef] [PubMed]
- Qu, D.; Zheng, M.; Zhang, L.G.; Zhao, H.F.; Xie, Z.G.; Jing, X.B.; Haddad, R.E.; Fan, H.Y.; Sun, Z.C. Formation mechanism and optimization of highly luminescent N-doped graphene quantum dots. Sci. Rep. 2014, 4, 9. [Google Scholar] [CrossRef]
- Xu, X.Y.; Ray, R.; Gu, Y.L.; Ploehn, H.J.; Gearheart, L.; Raker, K.; Scrivens, W.A. Electrophoretic analysis and purification of fluorescent single-walled carbon nanotube fragments. J. Am. Chem. Soc. 2004, 126, 12736–12737. [Google Scholar] [CrossRef] [PubMed]
- Sun, Y.P.; Zhou, B.; Lin, Y.; Wang, W.; Fernando, K.A.S.; Pathak, P.; Meziani, M.J.; Harruff, B.A.; Wang, X.; Wang, H.F.; et al. Quantum-sized carbon dots for bright and colorful photoluminescence. J. Am. Chem. Soc. 2006, 128, 7756–7757. [Google Scholar] [CrossRef] [PubMed]
- Li, X.Y.; Wang, H.Q.; Shimizu, Y.; Pyatenko, A.; Kawaguchi, K.; Koshizaki, N. Preparation of carbon quantum dots with tunable photoluminescence by rapid laser passivation in ordinary organic solvents. Chem. Commun. 2011, 47, 932–934. [Google Scholar] [CrossRef]
- Zhou, J.G.; Booker, C.; Li, R.Y.; Zhou, X.T.; Sham, T.K.; Sun, X.L.; Ding, Z.F. An electrochemical avenue to blue luminescent nanocrystals from multiwalled carbon nanotubes (MWCNTs). J. Am. Chem. Soc. 2007, 129, 744–745. [Google Scholar] [CrossRef]
- Zhang, M.; Bai, L.L.; Shang, W.H.; Xie, W.J.; Ma, H.; Fu, Y.Y.; Fang, D.C.; Sun, H.; Fan, L.Z.; Han, M.; et al. Facile synthesis of water-soluble, highly fluorescent graphene quantum dots as a robust biological label for stem cells. J. Mater. Chem. 2012, 22, 7461–7467. [Google Scholar] [CrossRef]
- Liu, F.; Jang, M.H.; Ha, H.D.; Kim, J.H.; Cho, Y.H.; Seo, T.S. Facile Synthetic Method for Pristine Graphene Quantum Dots and Graphene Oxide Quantum Dots: Origin of Blue and Green Luminescence. Adv. Mater. 2013, 25, 3657–3662. [Google Scholar] [CrossRef]
- Li, Y.X.; Huang, H.; Ma, Y.H.; Tong, J. Highly sensitive fluorescent detection of dihydroxybenzene based on graphene quantum dots. Sens. Actuators B Chem. 2014, 205, 227–233. [Google Scholar] [CrossRef]
- Zhu, S.Y.; Yan, X.L.; Sun, J.; Zhao, X.E.; Wang, X. A novel and sensitive fluorescent assay for artemisinin with graphene quantum dots based on inner filter effect. Talanta 2019, 200, 163–168. [Google Scholar] [CrossRef] [PubMed]
- Liu, H.; Na, W.D.; Liu, Z.P.; Chen, X.Q.; Su, X.G. A novel turn-on fluorescent strategy for sensing ascorbic acid using graphene quantum dots as fluorescent probe. Biosens. Bioelectron. 2017, 92, 229–233. [Google Scholar] [CrossRef]
- Fan, L.S.; Hu, Y.W.; Wang, X.; Zhang, L.L.; Li, F.H.; Han, D.X.; Li, Z.G.; Zhang, Q.X.; Wang, Z.X.; Niu, L. Fluorescence resonance energy transfer quenching at the surface of graphene quantum dots for ultrasensitive detection of TNT. Talanta 2012, 101, 192–197. [Google Scholar] [CrossRef] [PubMed]
- Liu, X.T.; Na, W.D.; Liu, H.; Sue, X.G. Fluorescence turn-off-on probe based on polypyrrole/graphene quantum composites for selective and sensitive detection of paracetamol and ascorbic acid. Biosens. Bioelectron. 2017, 98, 222–226. [Google Scholar] [CrossRef]
- Wang, G.; He, P.; Xu, A.; Guo, Q.; Li, J.; Wang, Z.; Liu, Z.; Chen, D.; Yang, S.; Ding, G. Promising Fast Energy Transfer System Between Graphene Quantum Dots and the Application in Fluorescent Bioimaging. Langmuir 2019, 35, 760–766. [Google Scholar] [CrossRef] [PubMed]
- Flak, D.; Przysiecka, L.; Nowaczyk, G.; Scheibe, B.; Koscinski, M.; Jesionowski, T.; Jurga, S. GQDs-MSNs nanocomposite nanoparticles for simultaneous intracellular drug delivery and fluorescent imaging. J. Nanopart. Res. 2018, 20. [Google Scholar] [CrossRef] [PubMed]
- Chen, H.; Wang, Z.Y.; Zong, S.F.; Chen, P.; Zhu, D.; Wu, L.; Cui, Y.P. A graphene quantum dot-based FRET system for nuclear-targeted and real-time monitoring of drug delivery. Nanoscale 2015, 7, 15477–15486. [Google Scholar] [CrossRef]
- Vatanparast, M.; Shariatinia, Z. Revealing the role of different nitrogen functionalities in the drug delivery performance of graphene quantum dots: A combined density functional theory and molecular dynamics approach. J. Mater. Chem. B 2019, 7, 6156–6171. [Google Scholar] [CrossRef]
- Zhang, H.; Cao, Y.; Zhong, L.; Cao, X.; He, J.; Sun, J.; Lei, W. Fast photogenerated electron transfer in N-GQDs/PTI/ZnO-QDs ternary heterostructured nanosheets for photocatalytic H2 evolution under visible light. Appl. Surf. Sci. 2019, 485, 361–367. [Google Scholar] [CrossRef]
- Niazi, Z.; Goharshadi, E.K.; Mashreghi, M.; Jorabchi, M.N. Highly efficient solar photocatalytic degradation of a textile dye by TiO2/graphene quantum dots nanocomposite. Photochem. Photobiol. Sci. 2021, 20, 87–99. [Google Scholar] [CrossRef]
- Riaz, R.; Ali, M.; Sahito, I.A.; Arbab, A.A.; Maiyalagan, T.; Anjum, A.S.; Ko, M.J.; Jeong, S.H. Self-assembled nitrogen-doped graphene quantum dots (N-GQDs) over graphene sheets for superb electro-photocatalytic activity. Appl. Surf. Sci. 2019, 480, 1035–1046. [Google Scholar] [CrossRef]
- Saenwong, K.; Nuengmatcha, P.; Sricharoen, P.; Limchoowong, N.; Chanthai, S. GSH-doped GQDs using citric acid rich-lime oil extract for highly selective and sensitive determination and discrimination of Fe3+ and Fe2+ in the presence of H2O2 by a fluorescence “turn-off” sensor. RSC Adv. 2018, 8, 10148–10157. [Google Scholar] [CrossRef]
- Wang, C.X.; Sun, Y.Y.; Jin, J.L.; Xiong, Z.Y.; Li, D.; Yao, J.R.; Liu, Y.Q. Highly selective, rapid-functioning and sensitive fluorescent test paper based on graphene quantum dots for on-line detection of metal ions. Anal. Methods 2018, 10, 1163–1171. [Google Scholar] [CrossRef]
- Yang, Y.; Zou, T.; Wang, Z.; Xing, X.; Peng, S.; Zhao, R.; Zhang, X.; Wang, Y. The Fluorescent Quenching Mechanism of N and S Co-Doped Graphene Quantum Dots with Fe(3+) and Hg(2+) Ions and Their Application as a Novel Fluorescent Sensor. Nanomaterials 2019, 9, 738. [Google Scholar] [CrossRef]
- Chakraborti, H.; Sinha, S.; Ghosh, S.; Pal, S.K. Interfacing water soluble nanomaterials with fluorescence chemosensing: Graphene quantum dot to detect Hg2+ in 100% aqueous solution. Mater. Lett. 2013, 97, 78–80. [Google Scholar] [CrossRef]
- Gu, S.Y.; Hsieh, C.T.; Tsai, Y.Y.; Gandomi, Y.A.; Yeom, S.; Kihm, K.D.; Fu, C.C.; Juang, R.S. Sulfur and Nitrogen Co-Doped Graphene Quantum Dots as a Fluorescent Quenching Probe for Highly Sensitive Detection toward Mercury Ions. ACS Appl. Nano Mater. 2019, 2, 790–798. [Google Scholar] [CrossRef]
- Liu, J.J.; Zhang, X.L.; Cong, Z.X.; Chen, Z.T.; Yang, H.H.; Chen, G.N. Glutathione-functionalized graphene quantum dots as selective fluorescent probes for phosphate-containing metabolites. Nanoscale 2013, 5, 1810–1815. [Google Scholar] [CrossRef] [PubMed]
- Liu, J.J.; Chen, Z.T.; Tang, D.S.; Wang, Y.B.; Kang, L.T.; Yao, J.N. Graphene quantum dots-based fluorescent probe for turn-on sensing of ascorbic acid. Sens. Actuators B Chem. 2015, 212, 214–219. [Google Scholar] [CrossRef]
- Qiang, R.B.; Hu, L.F.; Hou, K.M.; Wang, J.Q.; Yang, S.R. Water-Soluble Graphene Quantum Dots as High-Performance Water-Based Lubricant Additive for Steel/Steel Contact. Tribol. Lett. 2019, 67. [Google Scholar] [CrossRef]
- Crosby, G.A.; Demas, J.N. Measurement of photoluminescence quantum yields. J. Phys. Chem. 1971, 75, 31. [Google Scholar] [CrossRef]
- Tang, L.B.; Ji, R.B.; Li, X.M.; Teng, K.S.; Lau, S.P. Size-Dependent Structural and Optical Characteristics of Glucose-Derived Graphene Quantum Dots. Part. Part. Syst. Charact. 2013, 30, 523–531. [Google Scholar] [CrossRef]
- Esteves da Silva, J.C.G.; Gonçalves, H.M.R. Analytical and bioanalytical applications of carbon dots. TrAC Trends Anal. Chem. 2011, 30, 1327–1336. [Google Scholar] [CrossRef]
- Zhu, B.C.; Gao, C.C.; Zhao, Y.Z.; Liu, C.Y.; Li, Y.M.; Wei, Q.; Ma, Z.M.; Du, B.; Zhang, X.L. A 4-hydroxynaphthalimide-derived ratiometric fluorescent chemodosimeter for imaging palladium in living cells. Chem. Commun. 2011, 47, 8656–8658. [Google Scholar] [CrossRef]


Publisher’s Note: MDPI stays neutral with regard to jurisdictional claims in published maps and institutional affiliations. |
© 2021 by the authors. Licensee MDPI, Basel, Switzerland. This article is an open access article distributed under the terms and conditions of the Creative Commons Attribution (CC BY) license (https://creativecommons.org/licenses/by/4.0/).