Article

The Influence of R&D in Mining on Sustainable Development in China

1
School of Management, Jiangsu University, Zhenjiang 212013, China
2
Department of Banking and Finance, University of Professional Studies, Accra 23321, Ghana
*
Author to whom correspondence should be addressed.
Sustainability 2021, 13(9), 5289; https://doi.org/10.3390/su13095289
Submission received: 27 March 2021 / Revised: 26 April 2021 / Accepted: 4 May 2021 / Published: 9 May 2021

Abstract

:
Mining and the utilization of mineral resources, especially coal for energy consumption, are considered a major contributor to China’s total index of environmental pollution, but there is less focus on its sustainable development. This study focused on the influence of research and development (R&D) on the sustainable development capabilities of 45 coal mining cities in China from 2008 to 2017. These cities were grouped into growing, maturity, declining, and regeneration categories. A DEAP model together with the Malmquist productivity index were used in calculating their sustainable development capabilities. It emerged that the R&D inclination for the coal mining cities was low at an average of 0.3406 and its influence has not pushed enough to reach the production frontier. The overall sustainable development capabilities of the four categories of coal mining cities were 0.6918 and also proved to have an unstable trend. There was evidence of inefficiencies in some categories of resource input and output. Technological changes (TECHCH) that promote the sustainable development capabilities grew at 12.2% for the period, which is moderately significant but still needs improvement. Major factors hindering the sustainable development of coal mining cities were insufficient desired input indicators including decisional capabilities, recovery in the treatment of pollution, and effective utilization of resources.

1. Introduction

Minerals are essential raw materials for production industries and their contribution to economic development is inevitable. The ongoing debate among energy economists and researchers has pointed to the relationship between mineral extraction and output growth [1] ,while little attention has been given to its sustainable development. Various scholars [2,3,4,5] argue that energy use is anticipated to be a restraining factor to economic progress and environmental degradation. The extraction of minerals is considered one of the major contributors to the ever-rising threat of global warming, which therefore calls for massive introduction of research and development (R&D) to find new technological innovations and mechanisms towards ensuring sustainability. The extraction of minerals poses serious and significant challenges to society as its negative impact on the environment is on the rise [6,7]. In China, coal extraction remains one of the principal industries and a key donor to energy consumption (refer to Table 1) and economic development.
Hou, et al. [8] categorize the major coal mining areas into resource-based cities, which account for about 53% of resource-based prefecture levels, excluding autonomous prefectures and alliance. Coal constitutes more than 90% of China’s principal energy source and its percentage of consumption is above 60% [9]. They further argued that coal endowment determines the importance of the coal industry in the social and economic development of China and its position as a primary energy will continue to be influential. The aggregate prime energy production follows a pattern (Table 1). Importantly, the cumulative energy consumption surpassed the production, and the gap between consumption and production has kept rising since 2000; a summary of evidence from 2008 to 2017 is presented in Table 1. Coal mining cities in China have unique and enforced developmental laws that regulate schemes of growth, orientation, and the industrial organogram of the cities. However, the lack of systematic development and reasonable management for urban growth have led to not-in-my-back-yard (NIMBY) conflicts among resource systems [10], socio-economic systems, and ecological and environmental systems that have become progressively bulging in recent years [9] (Hou et al., 2020).
These have sanctioned the difficulties in sustainable development in the coal mining cities. It should be emphasized that the principle of sustainability in coal mining in China gained legitimate status to reduce environmental degradation through the issued guidelines by the State Council for National Sustainable Development Plan for Resource-based Cities of China State Council [11] in December 2013. They grouped all resource-based areas into growth, maturity, recession, and regeneration based on social, economic, environmental, and natural reserve and development related settings. Figure 1 incorporates R&D into the findings of Yu, et al. [12] regarding the sustainability dimensions of environmental protection, social development, economic growth, and development. The concept of sustainable development has been widely trending in different scopes of human life, economic growth, and environmental sceneries in recent times. It tries to find a balance between needs of society, the economy, and the environment for present and future safety, as well as investing in indispensable new and improved ways of protecting nature. The sectors of R&D create technological novelty with the use of human development and the standard of existing knowledge, which generates apparatuses to achieve operational change through modernization [13,14]. R&D accumulation is considered to be essential for economic growth, economic development, and sustainability according to economic theory. Therefore, the implementation of sustainable development influenced by R&D in the mining industry would mean the integration of activities in Figure 1 as partially suggested by Fernández, López and Blanco [13] based on their three key factors supported by economic theories. They held that sustainable development is enhanced by economic growth and development, social responsibility, and environmental protection and preservation. Previous literature has revealed the influencing role of R&D in those three key factors, hence sustainable development elements would entail R&D as a new dimension.
Research in these areas focuses on the nexus of mining and development and the transformation of coal mining cities [9,15,16] and the development of the country as a whole. Few studies have considered the measurement of sustainable development and even fewer have examined the influence of R&D on the sustainability agenda of national growth and development stemming from coal mining cities. Figure 1 could be a roadmap towards attaining sustainable development since there are different problems in different places and there is development across board, be it in mining cities or not. This study therefore explores the influence of R&D in mining towards the sustainable development of China. The key objectives for this study are (1) to empirically link and analyze the influence of R&D on environmental protection and growth towards sustainable development in coal mining cities; (2) to use data envelopment analysis and the Malmquist productivity index to analyze R&D’s role in sustainable development trends to address crucial elements affecting it; and (3) to find the relationship between input and output indicators of R&D spending and sustainability to improve the developmental efficacy of coal mining cities.

2. Theoretical Review

2.1. Sustainable Development in Mining (Coal) Sector

The concept of sustainable development is not new in its broader sense of its ethical stance since its inception in 1987 through the World Commission on Environment and Development (WCED). However, the accord required for its application to diverse human relations and conceptual cogency is relatively recent and has elicited many societal and academic debates. The concept is open to interpretation in different contexts and disciplinary backgrounds of professionals such as the coal mining sector due to its normative nature [7,17,18]. Most studies in sustainable development and coal mining cities [19,20,21,22,23] revolve around the traditional development model and management approach to mediating the primary processing enterprises of development and path transformation to resolve the rising concern in harmonizing the needs of the ecosystem, the economy, and society. This mode is characterized by a path-dependency effect that discourages the investment of funds and manpower into developing new technologies and consequentially lacking consciousness of innovation.
The shortfalls of the management and traditional approach for development to address the menace of sustainable development are being noticed by authorities in coal mining cities. Coal cities are said to be paying less attention to investment in other key elements, such as education, that accumulate to human capital but rather focusing more on assets. This has resulted in an inverse correlation between accrued human capital and resource bequest [24], in solving the problem of environmental degradation and economic growth for sustainability. Hou, Long, Zhang and Wu [9] argue that the fall of coal cites into an irregular path of development and systematic influences in China is due to direct allocation under a planned economy and a price imbalance during the transition, which further exacerbated this situation. Coal cities are encouraged to promote massive innovation for transformation and upgrade the industrial structure in tackling sustainable development in coal mining cities. Foreign studies of the sustainability of coal mining cities focused on the issues related to industries and corporate governance, while local interests (Chinese) fall in the transformation and continuous development of industries [25]. The multitudinous nature of sustainable development interpretation requires the development of an integrated and holistic model for implementation rather than engaging in silo-thinking and one-dimensional approaches, which lack societal validity, instead of more broadly negotiated and accepted initiative.

2.2. Coal Mining Sector Challenges and Innovation in R&D

Challenges in coal mining cities cover a wide range and are related to all sectors of the biosphere which include air, water, and land pollution [6,26], not excluding inefficiency and sustainability. Practically, all mining activities distort the natural condition of the environment in one way or the other, with such limiting factors including ground surface deformation, seismicity, soil impoverishment, water quality, and dust and gas emission. There are two approaches to the role of R&D in resolving these problems: inside-out and outside-in methods. The former approach deals with geology and the economic capability of the ore body as vital and focuses on regulation, protection, and the biosphere as limitations that need to be mitigated [27,28]. In order to lead to innovation, the attention of R&D is focused on technology with increased profitability as their main drivers. However, other scholars [29,30,31] maintain that the latter looks at mining (including coal) from a sustainability-driven perspective, which focuses on posed challenges resulting from mining. These challenges include supply security, input to global climate change, and high inhabitant and customer demand for accountability. The various challenges of the coal mining industries for now and the future are strongly linked to better approaches towards sustainability and transformation with the proposed way forward being all-round change caused by innovation through R&D and an industrial structure upgrade. R&D is a major source of novelty and technological advancement, while enhancement in technological capabilities positively affect production [32], and efficiency, creating a link between R&D and output. Cameron, et al. [33] found a direct influence of R&D on total factor productivity (TFP) and this builds the nexus between R&D and TFP. About 93% of TFP growth is as a result of the international transmission of R&D [34].

3. Methodology and Data

3.1. The DEA-Based Malmquist Productivity Index

In measuring the relative efficiency with multiple inputs and outputs of set decision making units (DMU), the data envelopment analysis (DEA) approach (initiated by Romer [14]) and modified to dynamic DEA by several scholars) is used since it has proven to be a vital instrument for measuring productivity changes and in environmental efficiency evaluations of DMU in the past decades. The efficiency value of each unit is clarified to enable ranking of the DMUs for effectiveness, as the modification helps adjust the input and output variables.
A four-dimensional methodology that includes biosphere, social, economic, and governance domain was proposed by the report of the International Institute for Environment and Development, 2002, concerning mining, minerals, and sustainable development (MMSD). Azapagic [35] carried out similar studies on sustainability measurement based on the Global Reporting Initiative (GRI) and used overall indicators consisting of economic, environmental, social, and integrated elements. It should be noted that the integrated indicators focus on relationships among two dimensions and do not deal with interconnection and collaboration of all magnitudes. Using sustainable development and a system science approach, we improved the existing literature of indicators and factored in technological innovation, standard evaluation, and industrial structure in weighing the efficiency and degree of sustainable development due to the central objective of these studies.
Resultant indicators were used in assessing the sustainable development rather than the elementary indicators (refer to Table 2). This is because in using DEA, the number of indicators must be relatively equal to the DMUs in order to avoid error. Therefore, using the elementary indicators will give large numbers of units to promote that error in measurement. To avoid this, identical dimensions of the elementary indicators were evaluated and merged with equal lag to form the resultant indicators as exhibited in Table 2 to measure the sustainable development of the 45 coal cities grouped into four by the China State Council.
Production efficiency was assumed to have n DMUs to be evaluated against required input m, output s, and unfavorable output q, such as SO2 and CO2 emissions. DMUj (DMUj: j = 1,2,3, …, n) input and outputs for the three major elements were suggested to be Wj, Xj, Yj and their respective vector was denoted as Wj = (W1j,W2j,W3j, …, Wmj)t, Xj = (X1j,X2j,X3j, …, Xsj)t, and Yj = (Y1j,Y2j,Y3j, …, Yqj)t. The efficiency of production possibility spanned by all DMUs is defined in Equation (1) below.
P = { W 1 W m , X 1 X s , Y 1 Y q W i j = 1 n λ j W i j ,   i = 1 . . m ,   X r j = 1 n λ j X r j ,   r = 1 s , Y f j = 1 n λ j Y f j ,     f = 1 q , λ j 0   }
M i n = P * = V 1 m i = 1 m Z i W i k
s . t : 1 = V + 1 s + q [ r = 1 s ( Z r + X r k ) + f = 1 q ( Z f Y f k ) ]
V W i k = j = 1 , j k n λ j W i j + Z i
V X r k = j = 1 , j k n λ j X r k + Z r +
V Y f k = j = 1 , j k n λ j Y f k + Z f  
λ j 0 , Z i 0 , Z r + 0 , Z f 0 , V 0
P * in Equation (2) represents production efficiency and V is a constant variable. Elements Z i ,   Z r + , and Z f denote the slack variables for required input, required output, and unfavorable output, respectively, while m, s, and q are different types of inputs for elements Z i ,   Z r + , and Z f , respectively. Again, Wij denotes ith DMU of unfavorable output. λ defines planning coefficients, while λj represents the integer of the jth coefficient of planning at the point of evaluating jk. In this study, we used the DEAP-SBM method to measure values representing the capabilities of sustainable development of China’s coal cities.
After studying the efficiency production change of the input and output of the DMUs using the DEA approval, we used the Malmquist productivity index (MPI) to measure the volume output change and the input variable productivity change. This echoed the total growth idea of the DMUs’ productivity in time period t and t + 1. All inputs and outputs are represented (Xj Yj) with the optimistic efficiencies expressed as D 0 t ( X 0 t Y 0 t )   a n d   D t + 1   ( X 0 t + 1 , Y 0 t + 1 ) [36] being time periods t and t + 1, respectively. D t   ( X 0 t + 1 Y 0 t + 1 ) measures the optimistic efficiency of the DMU in the period t using the production technology of the time period t + 1. The latter definition corresponds with this study, hence its adoption.
M P I = [ D r z ( X t , Y t ) D r z ( X z , Y z ) ] × [ D r t ( X t , Y t ) D r t ( X z , Y z ) ] 1 / 2 = D i t ( X t , Y t ) D r z ( X z , Y z ) × [ D r z ( X t , Y t ) D r t ( X z , Y z ) ] × [ D r z ( X t , Y t ) D r t ( X z , Y z ) ] 1 / 2
In Equation (3) above, [ D r t ( X t , Y t ) D r z ( X z , Y z ) ] is the technical efficiency productivity variation index from time z to t which can be represented by TEPCH, while [ D r z ( X t , Y t ) D r t ( X t , Y t ) ] × [ D i s ( X t , Y t ) D i t ( X z , Y z ) ] 1 / 2 denotes the technological progress index, also from time z to time t, and can be represented by TPI. The TEPCH will assess the DMU to determine total output and efficiency of production in relation to equity investment in a given period. The influence of R&D through innovation will be assessed by TPI. A value of both TEPCH and TPI < 1 means that technical efficiency change and technological progress do not impact production efficiency, therefore signifying a decline in productivity. TEPCH and TPI > 1 means they facilitated the improvement of production efficiency. Previous literature revealed that the fundamental indicators could be grouped into three to efficiently calculate sustainable development, and this study grouped them as required input, required output, and unfavorable output, represented by m, s, and q, respectively. Technically, both s and q are all output, but for simplicity’s sake, we grouped them differently. Therefore, the expression for the efficiency of sustainable development (ESD) is defined as
ESD = f(m,s,q)
where m, s, and q are defined by f(ma,mb, mc,md), f(sa,sb), and f(q), respectively, as shown in Table 2. The indicator system of ESD for assessing the sustainability for the coal mining cities is formulated based on the practices of China’s mining cities (see Table 3). It consists of 7 resultant indicators (ma, mb, mc, md, sa, sb, and q) with 25 elementary indicators (measuring indicators) from 2008 to 2017. Our data were obtained from the Urban Statistical Yearbook of China from 2008 to 2017, the Yearbook of Chinese Mining Industry (2008 to 2017), and the Chinese Strategy Report for Sustainable Development from 2008 to 2017.

3.2. Sample Parameters

The sustainable development index involves the path dependency of coal mining cities and can be measured by four major indicators [37]. A comprehensive evaluation of the inner-city capabilities of sustainable development is also distributed into four main criteria, namely, the technology, the urban function, the system, and the industrial structure [9] of coal mining cities. Yu, et al. [38] identified 78 mining cities in the Chinese prefecture levels for sustainability purposes. According to Hou, Long, Chen and Zhang [8], the National Sustainable Development Plan for Resource grouped coal cities into growing, maturity, declining, and regeneration prefecture levels, as shown in Table 3. We evaluated the coal regions and used 45 coal cities based on their social development, economic contributions, and their characteristics of spatial distribution. Further in-depth evaluation of their developmental status was analyzed and their capabilities of effectively improving sustainable development was ascertained.

3.3. Indicator Selection

Most authors of current studies [8,25,38,39] on sustainability used indicators such as economic advancement, green development, resource state, society, and innovation capacity, which can be in the form of R&D to rank coal mining cities, and list their average environmental index and assess their sustainable capabilities. This study used similar indicators and modified them to suit the objectives, as outlined in Table 2, to assess the influence of R&D in mining in the sustainable development of China. Data on all the elementary indicators were collected from the Yearbook of China and the Chinese Strategy Report for Sustainable Development from 2008 to 2017. We measured the resultant indicators in Table 2 to minimize the number of variables of the DMU to avoid error. We evaluated the comparative efficiency since the elementary indicators have different units and scales, making their weights complicated to be created. It must be emphasized that the final figure calculated is not affected by the absolute size of the indicators. The sustainable development capabilities of the coal mining cities and the efficiency of the influence of R&D were calculated using the DEAP model to ascertain the total factor productivity, change in efficiency, and the technical changes of the resultant indicators of Table 2 from the output and input indicators. This study standardized the elementary indicators to arrive at the resultant indicators according to the geometric average weight of each indicator from the table, then used the DEAP model to calculate the capabilities and R&D influence on the sustainability of coal mining cities.

4. Results and Discussion

4.1. Inclination of R&D and Capabilities of Sustainable Development of Coal Mining Cities

Focusing on the R&D inclination towards sustainable development and capabilities, the coal mining cities were categorized into four. We evaluated the R&D trends and the capabilities of sustainable development by first collecting data from the 45 coal mining cities in Table 3 according to the resultant indicators. Secondly, the data were standardized and weighted. The third step involved analyzing the inclination of R&D and the sustainable development capabilities of all 45 coal mining cities using the DEAP model.
The final stage was the computing of the average values of the R&D inclination and the sustainable development capabilities for each of the four categories in Table 3 of the coal mining cities. Table 4 and Table 5 show the average results of the R&D inclination and capabilities of sustainable development under the four categories of the coal mining cities, respectively.
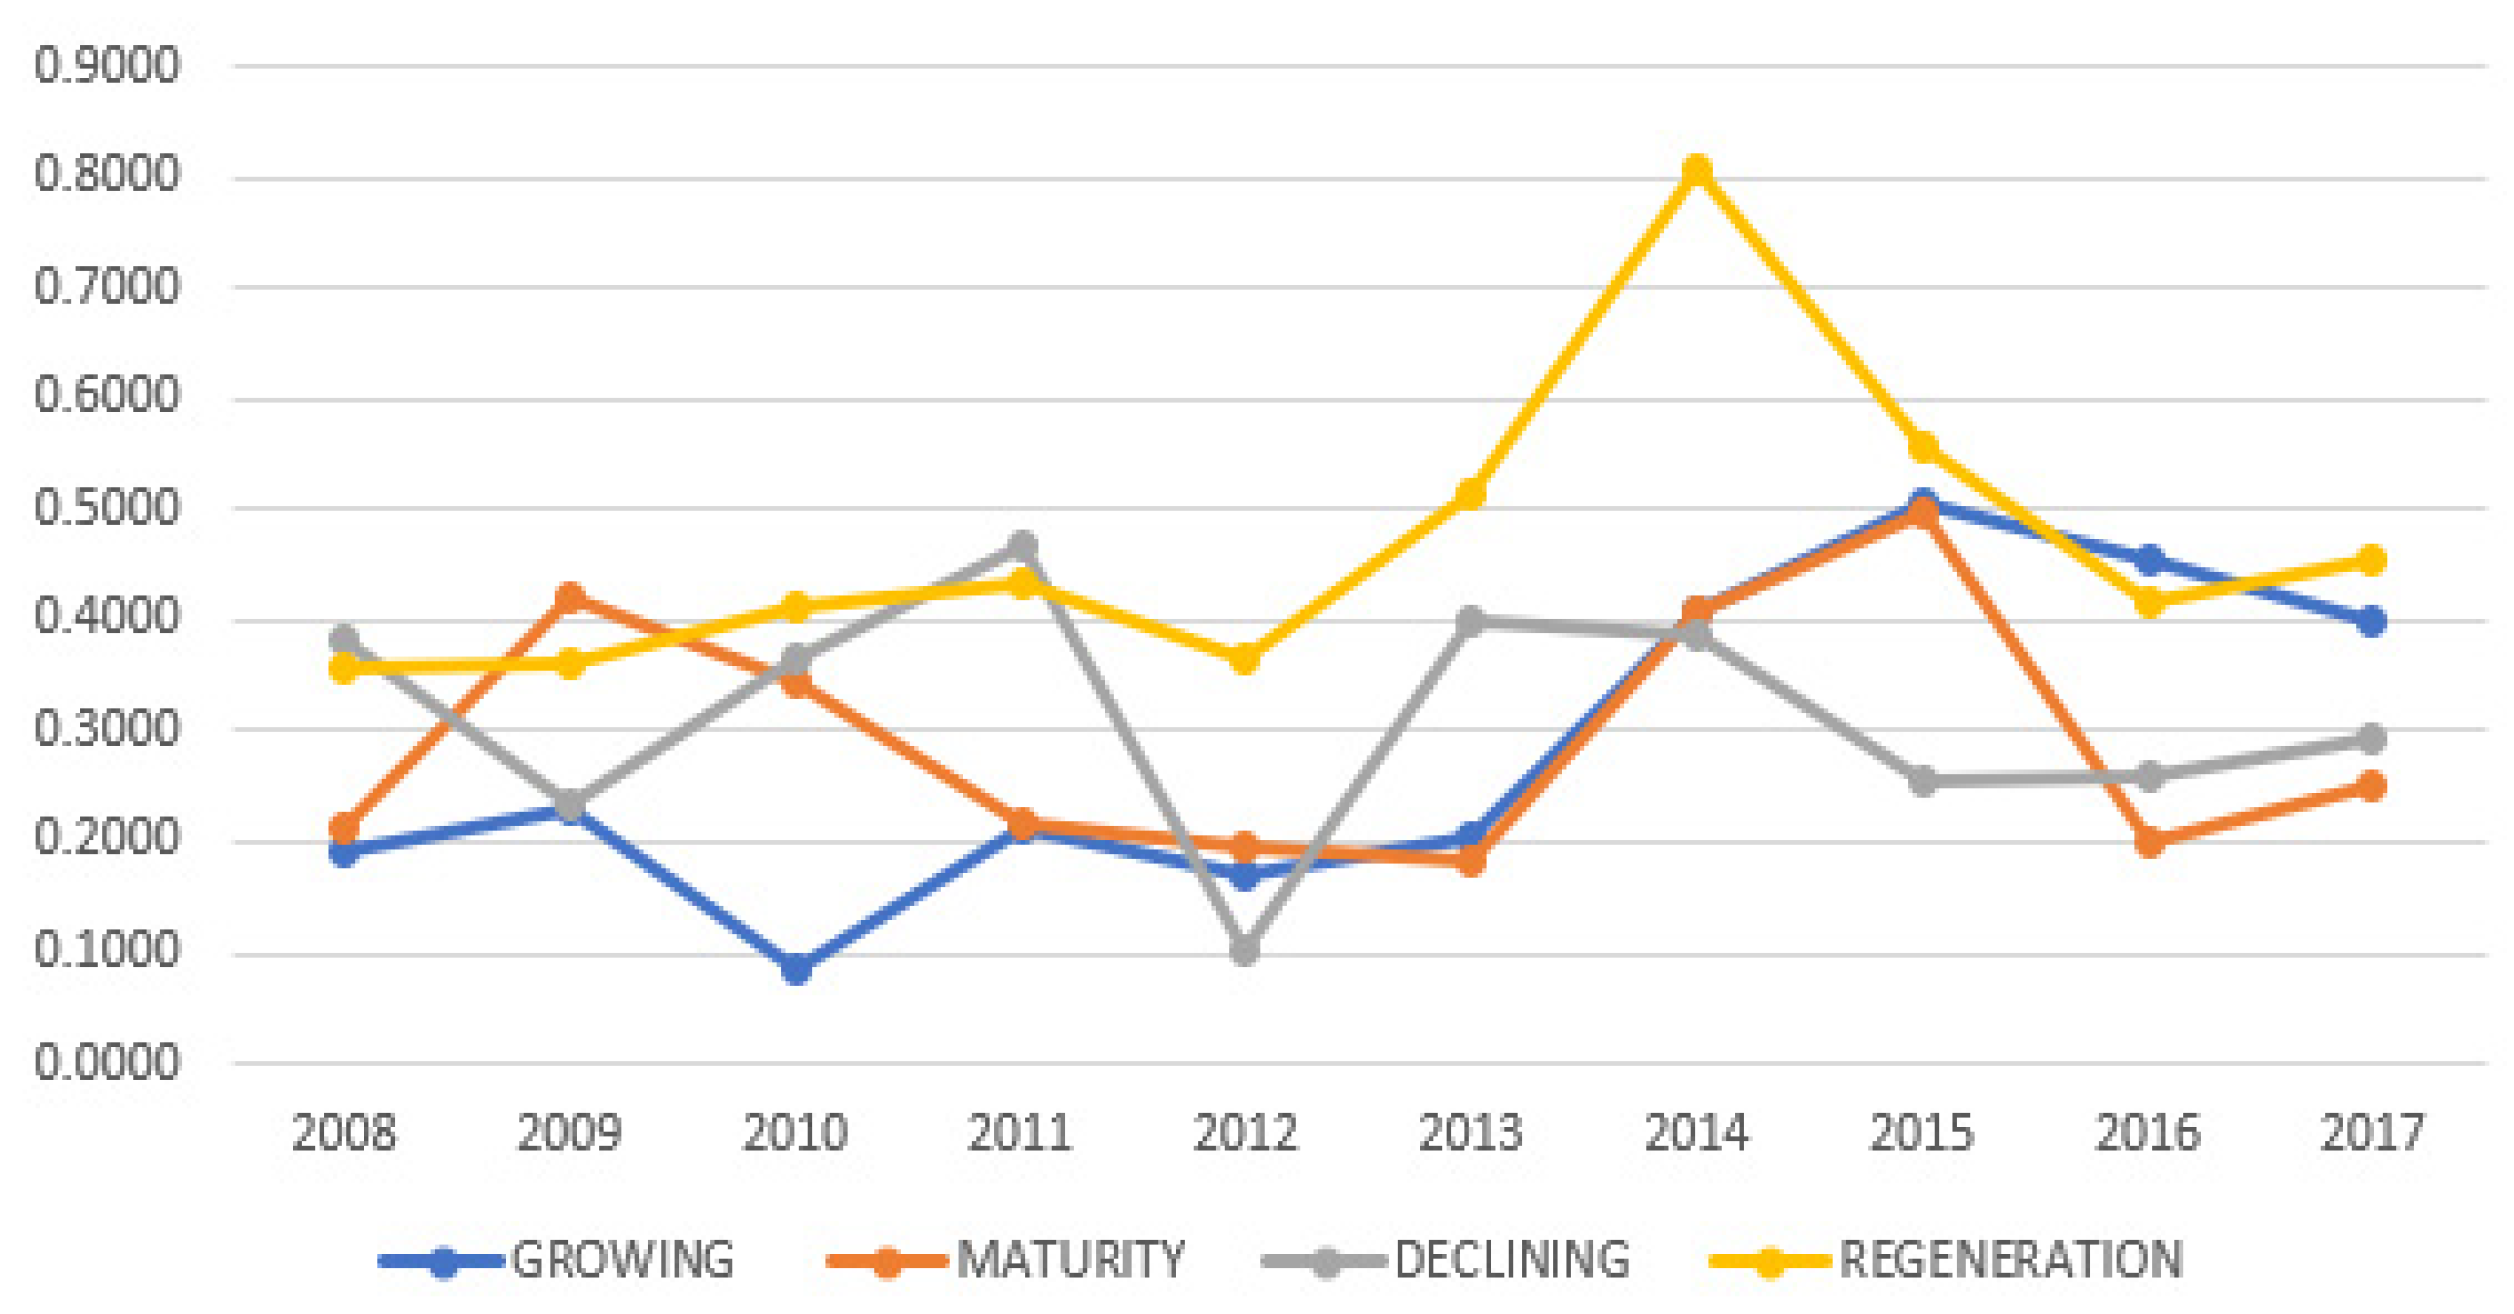
Evidently, the R&D inclination for growing cities category in Table 4 was 0.1933 in 2008; fluctuated in 2009, 2010, 2011, and 2012, with average values of 0.2314, 0.0872, 0.2140, and 0.1705, respectively; and started to increase significantly thereafter. To draw a general conclusion on the overall inclination of R&D, we used the averages of each of the four groups. From 2008 to 2017, the R&D inclination for all the coal mining cities was as low as 0.3406, and it needs improvement even though the trends of other single years and groups were significant. For instance, the trend in 2014 for the regeneration category was very significant at 0.8088, which shows that there was much input of R&D on mined coal to sustainable development.
Looking closely at the diverse categories of coal mining cities, it was found that coal mining cities under the category of regeneration recorded the highest average, followed by declining, maturity, and growing at values of 0.4675, 0.3147, 0.2927, and 0.2874, respectively. These values signify that R&D’s influence, as an input resource, has not reached the production frontier, despite being significant in some specific years. It needs an upward review to be more effective. Figure 2 reflects changes in the R&D inclination of diverse coal mining cities from 2008 to 2017.
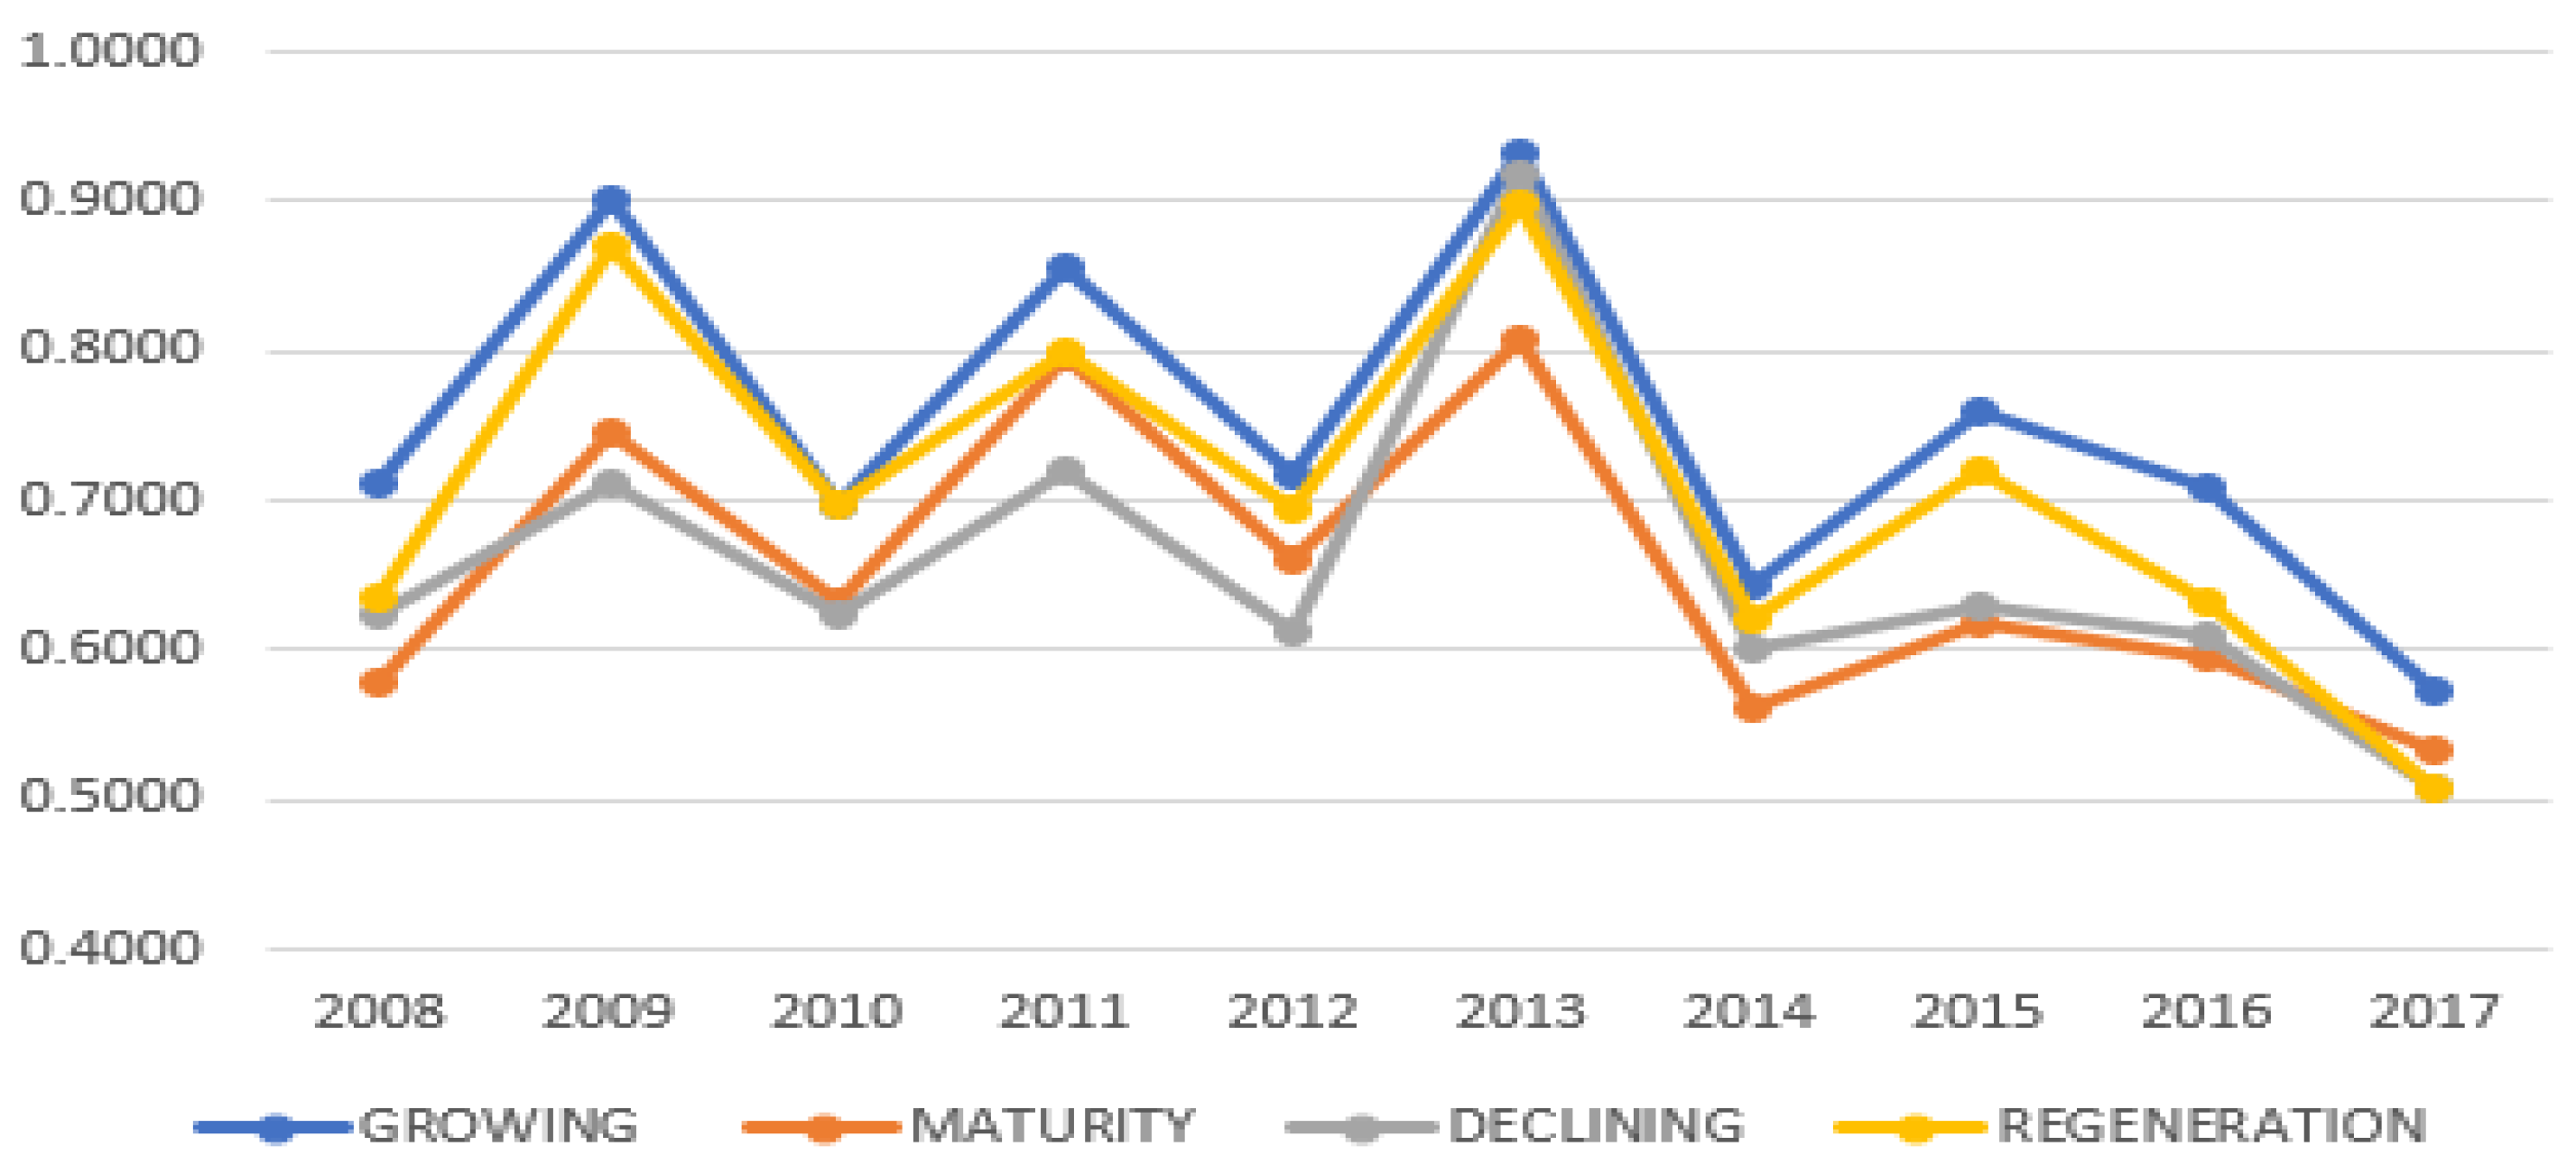
It is apparent that the inclination for regeneration in later years was very high and relatively stable compared to the remaining three types of coal mining cities. Growing, maturity, and declining cities could use regeneration cities as a benchmark for improvement to ensure sustainability, since the trends of these cities were low to a point of 0.0872 and 0.1008 for growing and declining cities in 2010 and 2012, respectively. Similarly, Table 5 depicts the capabilities of sustainable development of coal mining cities in China from 2008 to 2017. It was realized that growing cities had very high and stable sustainable capabilities, even though their R&D input showed otherwise. Their capabilities had a fluctuating movement. For instance, in 2008, average capabilities were about 0.7114, which shifted to about 0.9021 in 2009. A combined average sustainable development capability of 0.6918 was achieved for all four groups of coal mining cities, which is slightly improved as compared to the level attained in the study by Hou, Long, Zhang and Wu [9] This improvement could be attributed to the introduction of R&D.
General resource allocation and utilization towards efficiency was higher in 2013 and recorded an average sustainable development capability of 0.9338, 0.8090, 0.9172, and 0.8991 for growing, maturity, declining, and regeneration, respectively. It was also noted with keen interest that the overall performance in 2013 for all the four categories recorded the strongest sustainable development capabilities due to the R&D input and utilization of resources in 2012. This influence of R&D caused a rise in all inputs, and especially in R&D inclination, in 2014 for the four categories.
With the direct attribution to the various categories, growing coal mining cities had the maximum average of 0.7503 sustainable development capability (Figure 3). Next to growing were regeneration coal mining cities, which recorded 0.7079 average capabilities, followed by 0.6557 and 0.6532 for declining and maturity, respectively. Taking into account the sustainable development capabilities of declining and maturity cities, their input resources were progressively more effective pushing them close to the production frontier but growing and regeneration coal mining cities were more effective. A gap of 0.0971 in sustainable development capabilities exists between the highest performing and the least performing cities, which requires steady efforts to be made towards ensuring sustainable development in these coal mining cities. The trend of sustainable development capabilities of diverse coal mining cities in China from 2008 to 2017 saw a comparatively more stable trend in growing cities than the other group of cities.
It is also clear from Figure 3 that the overall sustainable capabilities were relatively stable until 2015, when they all started declining in equal reaction from Figure 3 for R&D inclination in the same period. It can be held and inferred in this study that stability and improvement in R&D in coal mining cities influenced and enhanced sustainable development capabilities.

4.2. Conversional Decomposition of Sustainable Development Capabilities of Coal Mining Cities

This sub-section discusses the productivity changes, measured by MPI, of coal mining cities in China. The analysis from Table 6 shows an efficiency of resources in the year 2008 to 2009 and a significant inefficiency thereafter until 2012. There was a magnificent growth from 2012 to 2017, even though it was fluctuating. The total factor productivity change (TFPCH) of the coal mining cities would help the course of sustainable development. Changes in efficiency are attributed to pure technical efficiency change (PEFFCH) and/or scale efficiency (SECH) [40]. The overall level of total factor productivity change from 2008 to 2017 was 1.044, which represents a moderate growth of coal mining cities towards sustainability in China. The efficiency of resources utilization progressed from 0.866 to 1.414 in 2012 and 2013, respectively, which was the highest for the period. The change in efficiency for the period 2008 to 2017 was 0.970, which is a decline and had a downward and upward year by year fluctuation.
The technical changes of the sustainable development of coal mining cities performed efficiently throughout the period with their values greater than one (techch > 1) except in 2010, which recorded 0.954. This significant progress is attributed to pure technical efficiency change. This stability suggests that technical efficiency has made a significant contribution towards the capabilities of sustainable development of coal mining cities, which could be the hallmark for other mining cities to adopt, with respect to resource allocation and utilization. In line with endogenous growth theories, R&D is a source of (TFPCH) TFP growth [32]. The decomposition effect gives an indication of the role of technological efficiency as R&D influences EFFECH, which leads to a robust upward movement of the technological frontier (TECHCH) with a growth of about 43.7%. The total factor productivity change of the capabilities of sustainable development of coal mining cities changed robustly with a stable trend. The only period of regress in total factor productivity of coal mining cities in 2010, 2011, and 2012 was mainly due to TECHCH and PECH rather than SECH and EFFCH. Generally, there is the need to improve resource allocation and utilization efficiency as well as maintaining stability in scale efficiency to ensure the sustainable development of coal mining cities in China.

4.3. Comparative Analysis of R&D Influence and Effectiveness Appraisal

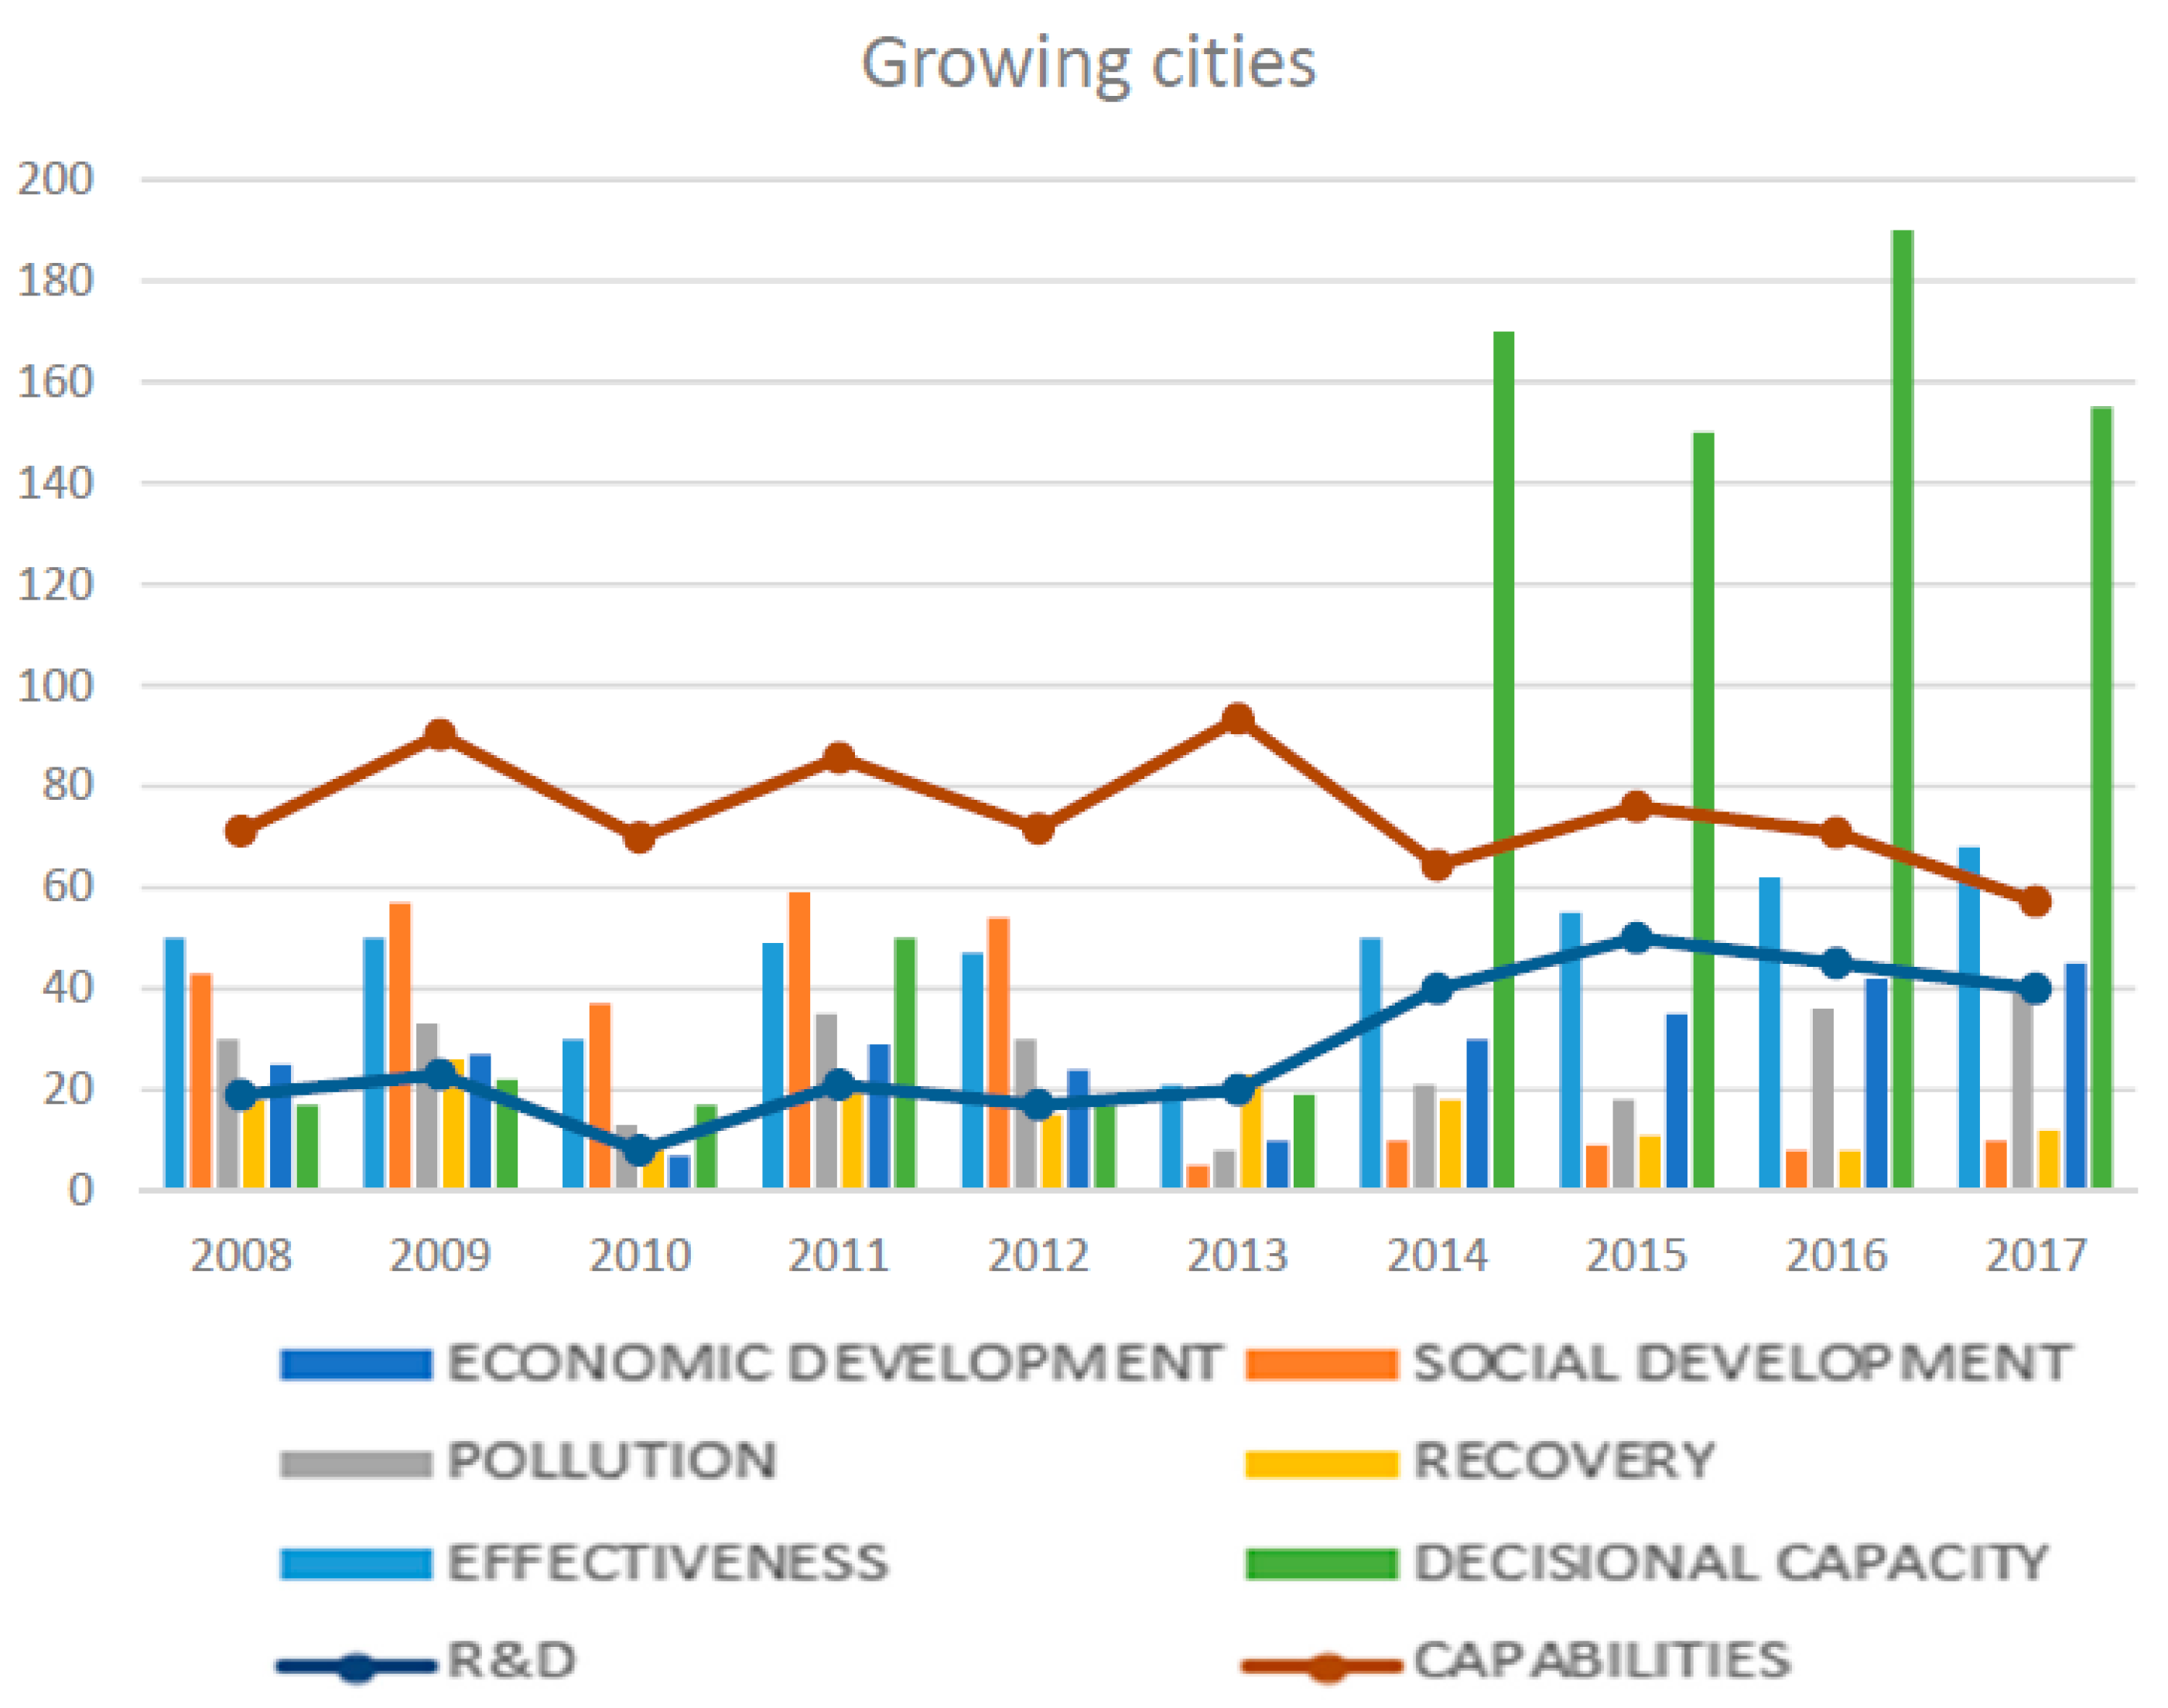
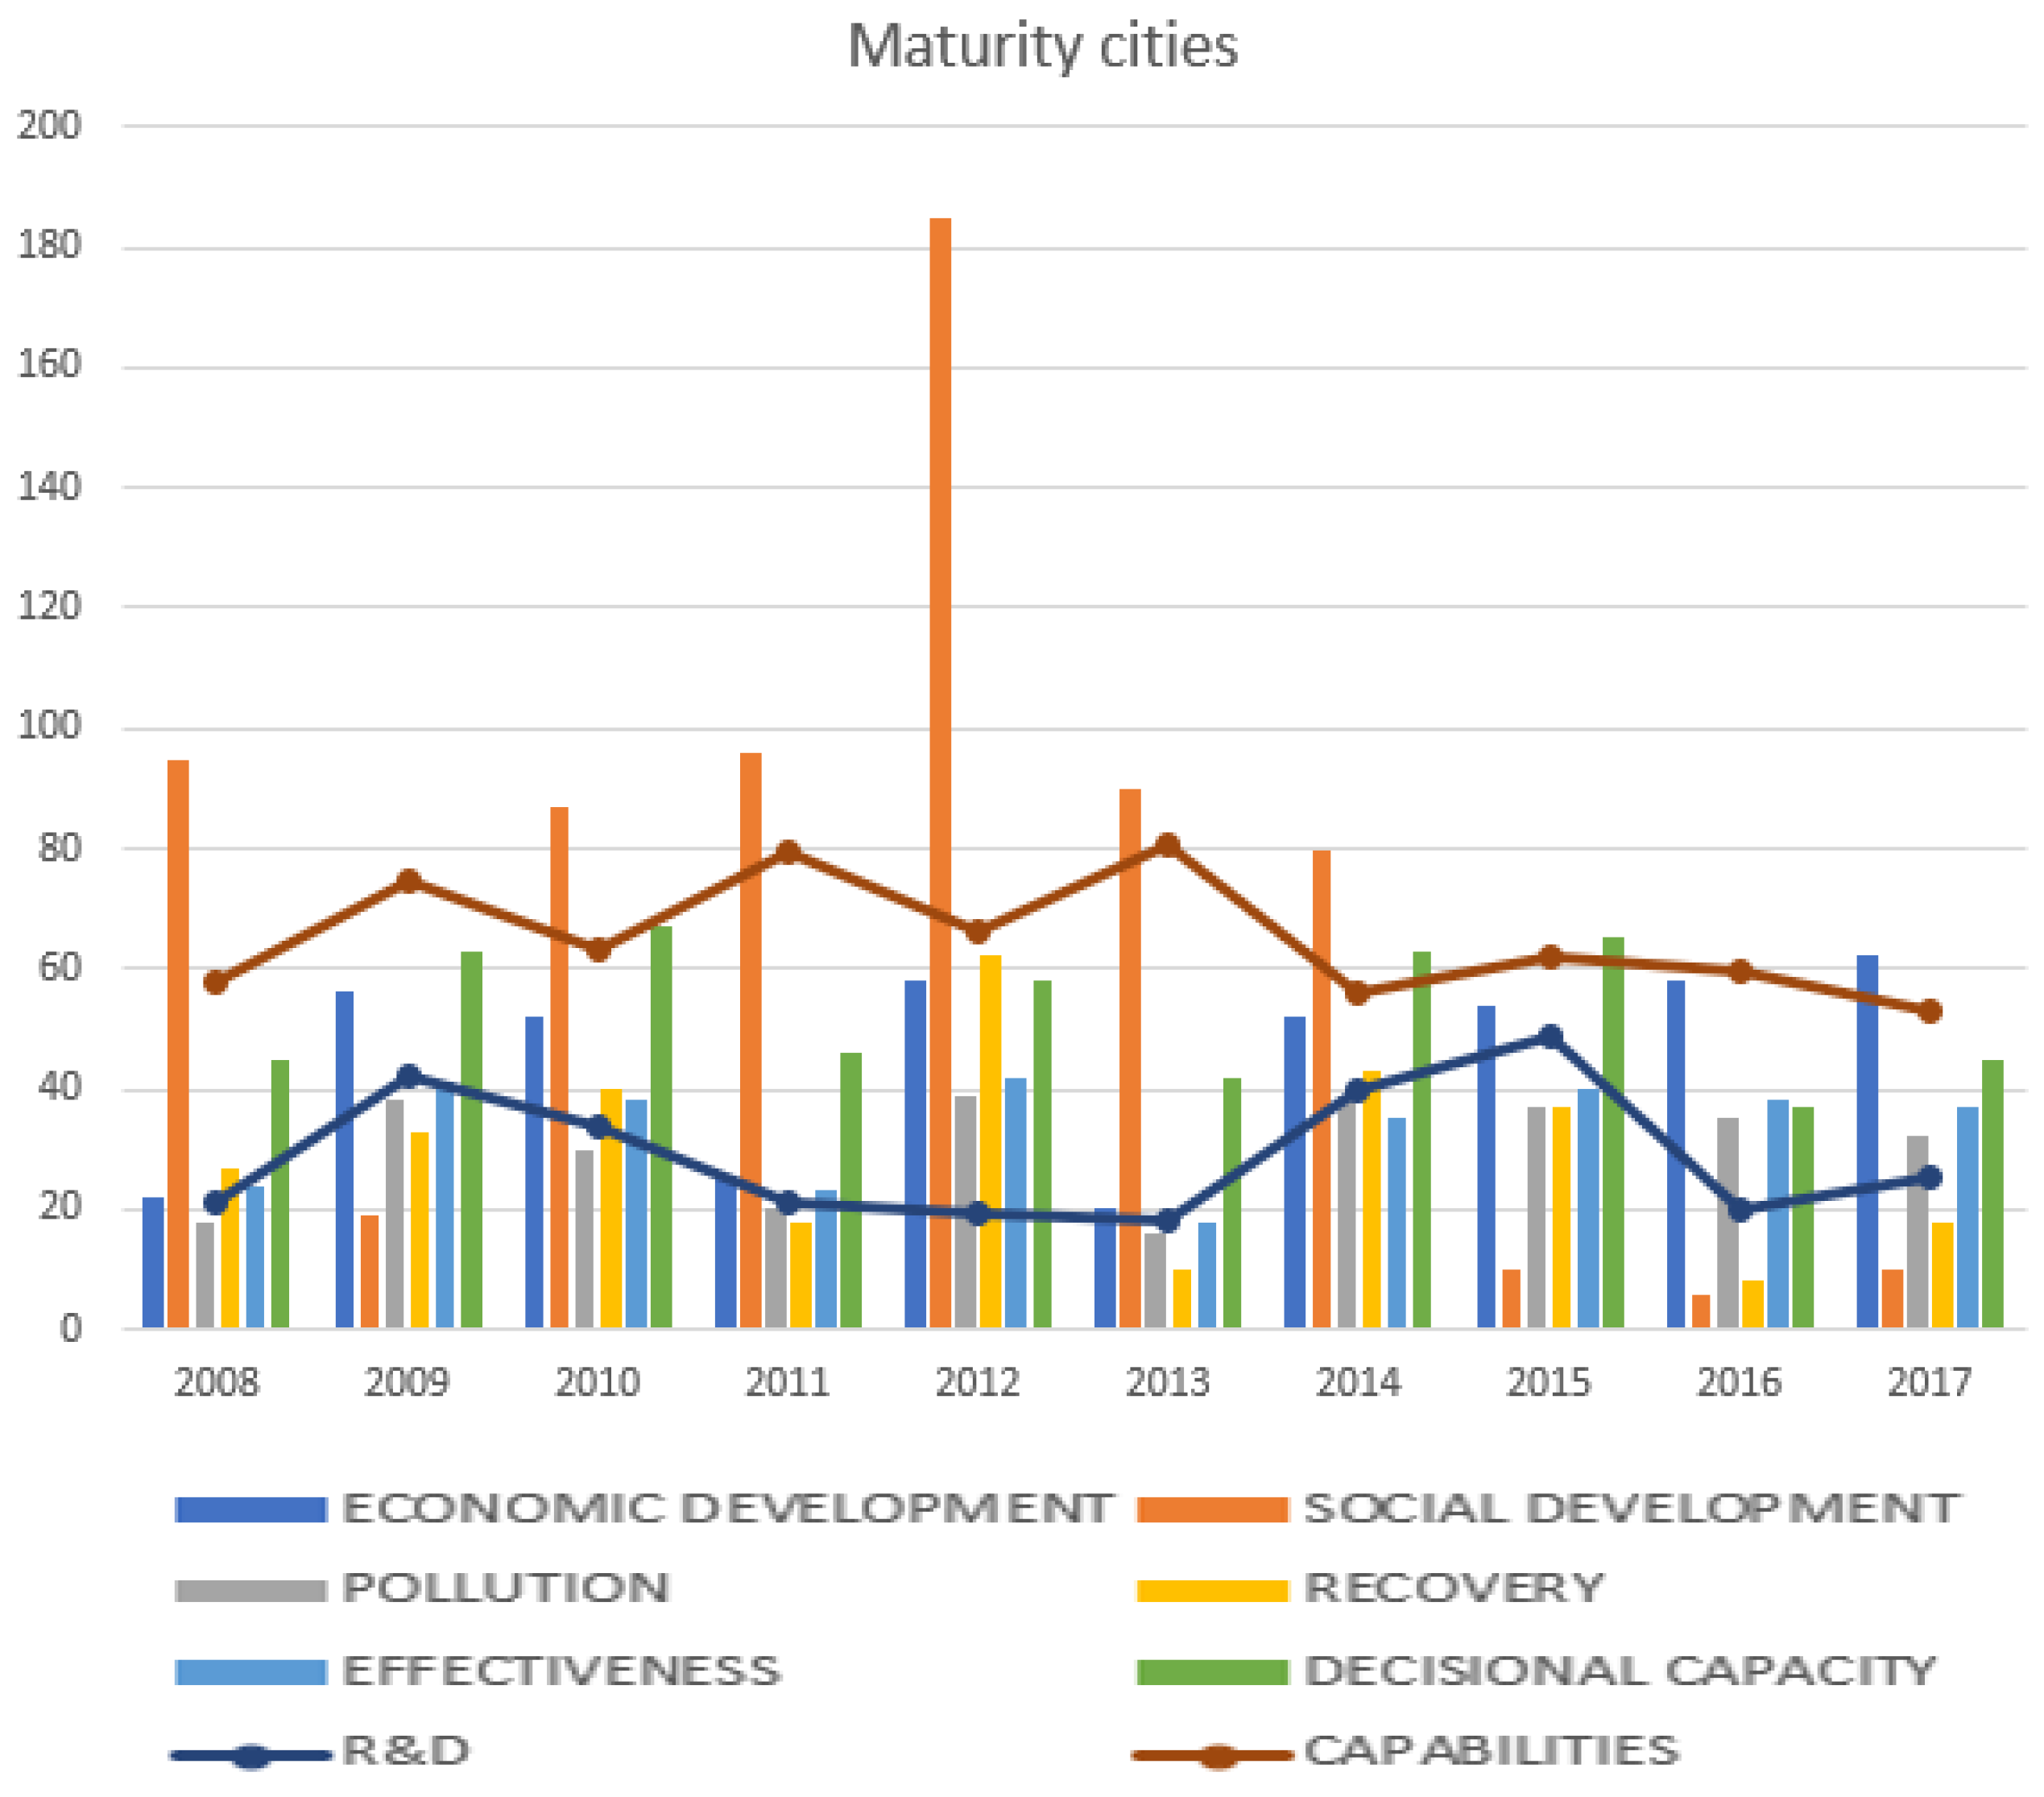
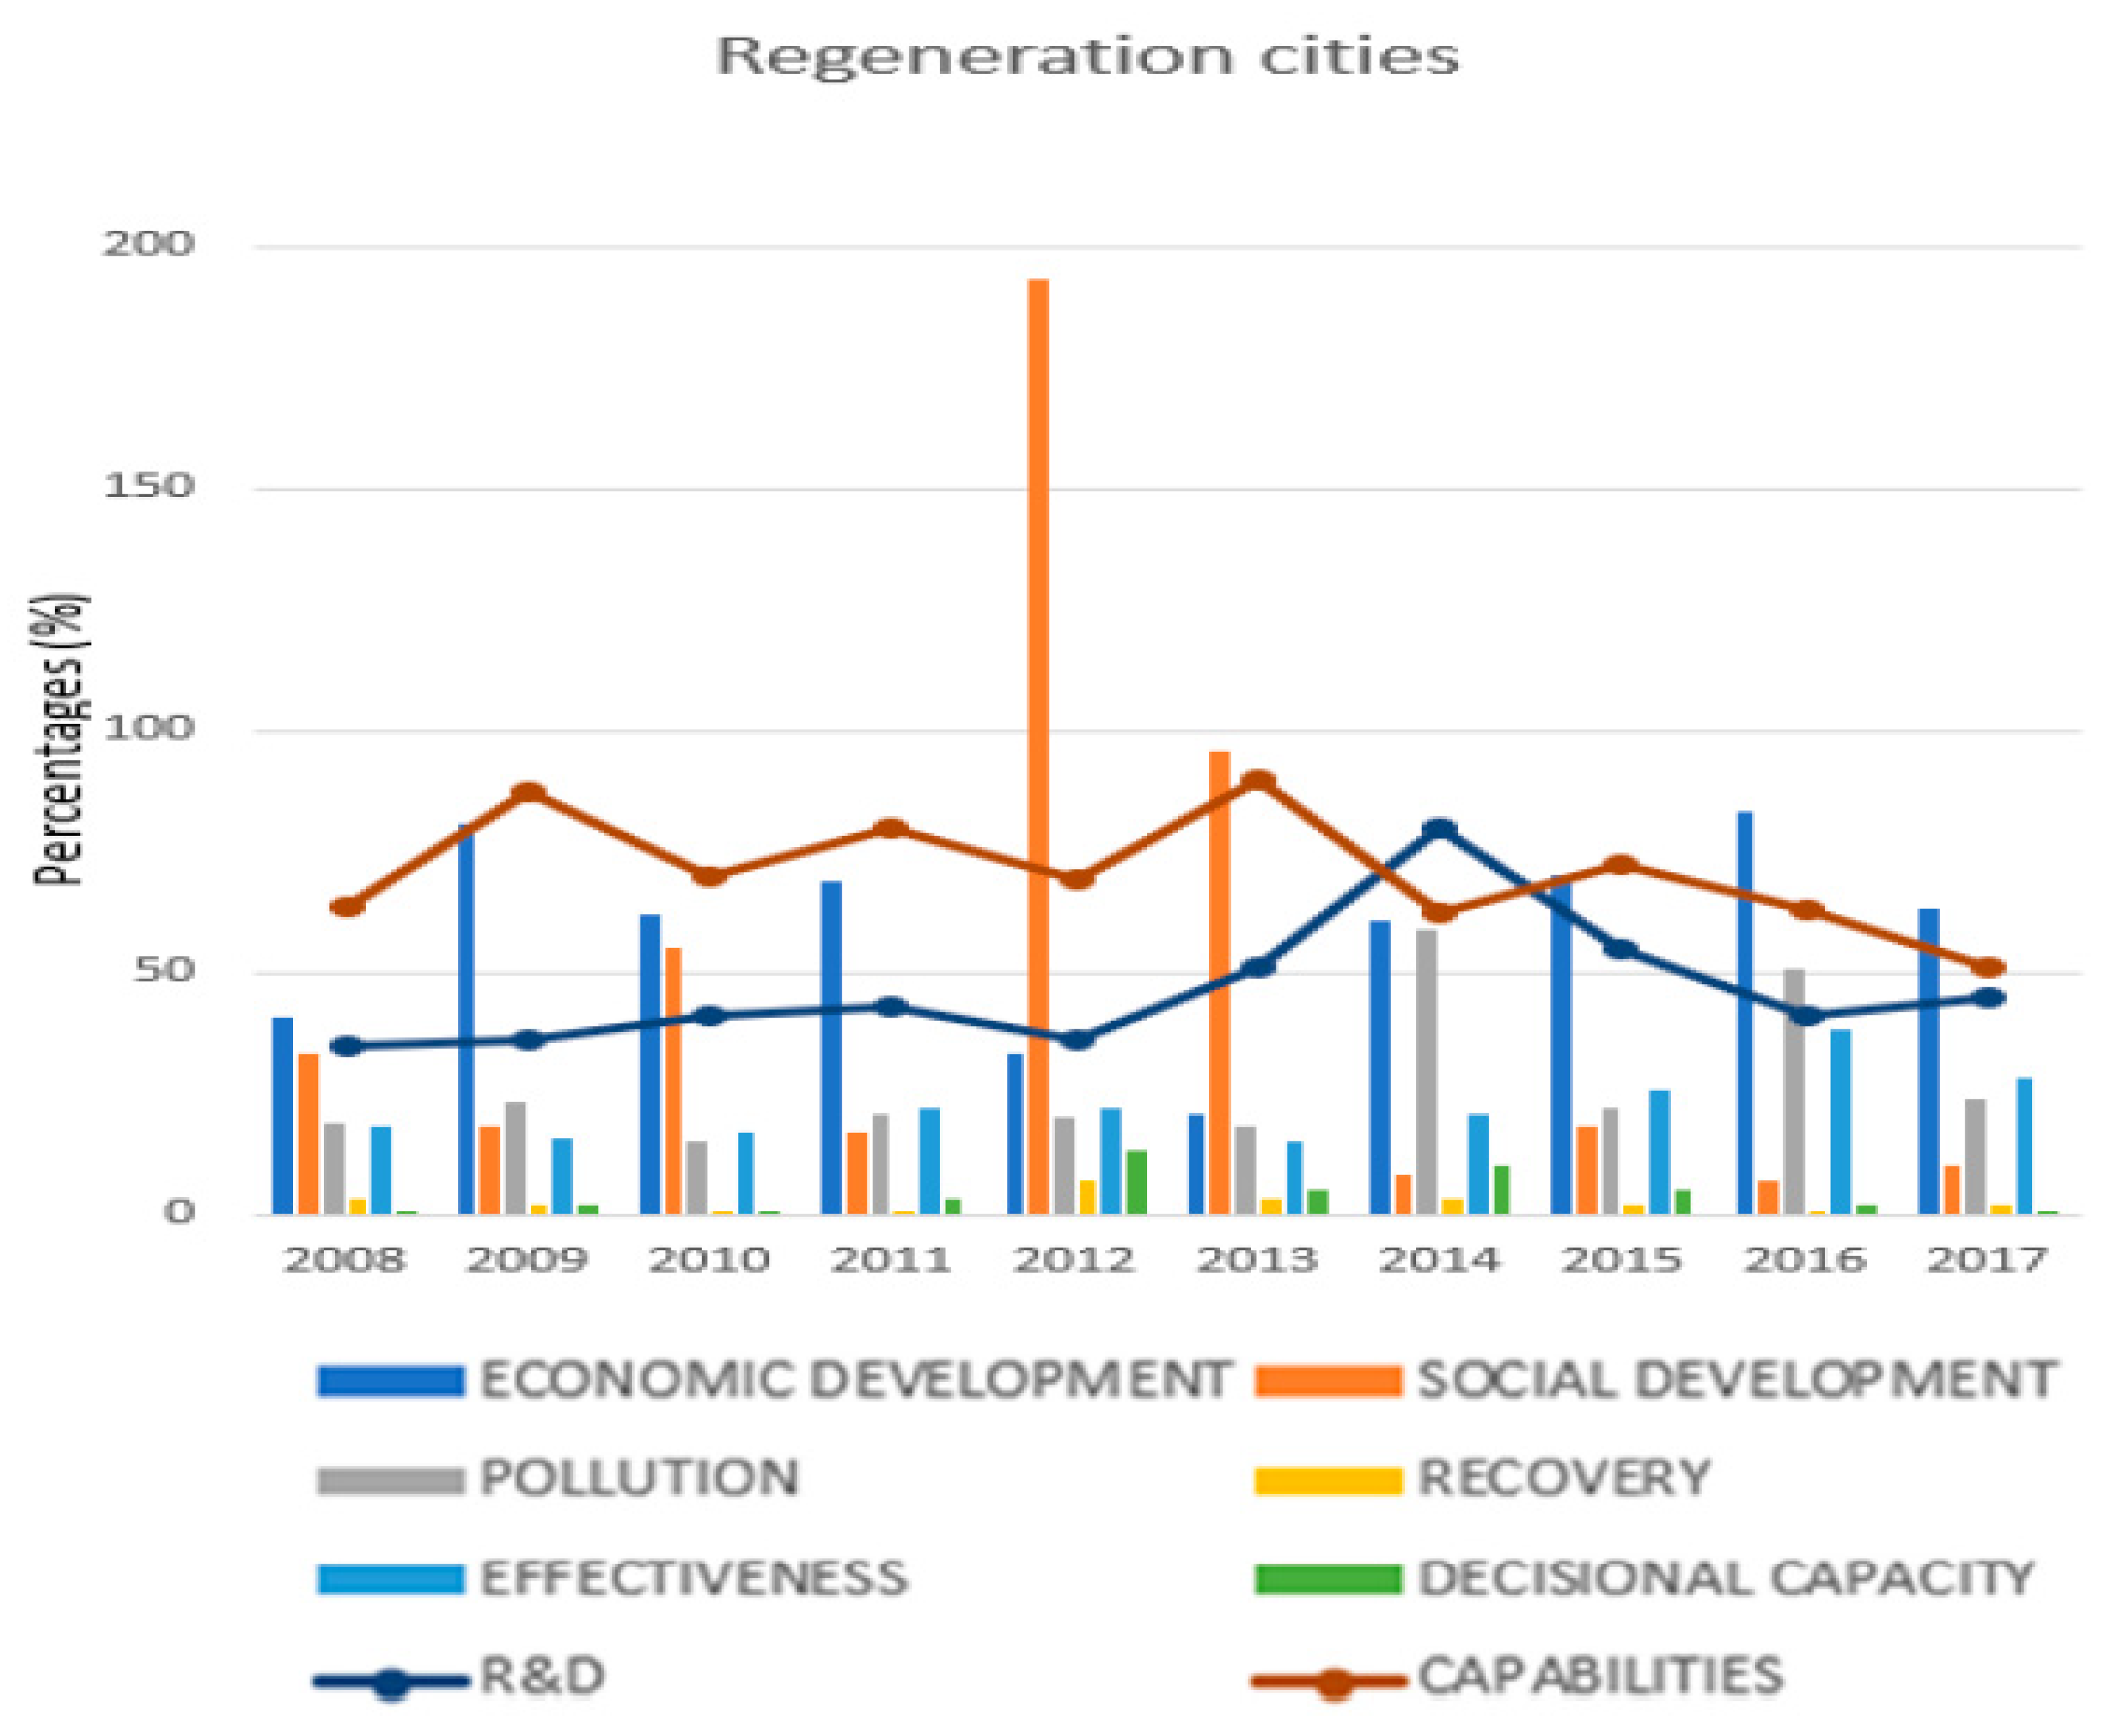
There has been much attention paid to environmental protection and sustainability by China, with the state’s interest in minimizing pollution, ensuring economic growth, and maintaining sustainable development. Various agencies and policy makers in China, and most especially coal mining cities, incorporate into their plans the focus of central government for transformation and development. The government support and sponsorship in R&D for technological innovations over the period has increased significantly. The efficiency in resource utilization and management for enhancing the sustainable development capabilities for all the various groups of coal mining cities, shown from Figure 4, Figure 5, Figure 6 and Figure 7, have been somewhat stable with growing and regeneration cities almost reaching the production frontier from the analysis of this study. Not all inefficiencies have been eradicated, even for the cities at the frontier of this analysis; there is still the need to boost efficiency to enable all the coal mining cities to reach the production frontier to maintain sustainability.
This study was motivated by and derived by input-oriented constant return to scale to optimize the four categories of coal mining cities in analyzing the driving factors accounting for sustainable development capabilities of China and provide recommendations for enhancement. Comparison was made using actual input and output values as against the input and output indicators’ optimal values for each assessment unit as ( y x x ) , where y is the optimal value and x is the actual value. The final values attained were therefore multiplied by 100 to arrive at the percentage and we proceeded to analyze the supporting reasons suggested in other studies [9,32,41] for high inefficiencies which push the sustainable development capabilities of the various cities down. The most prominent observations from Figure 4, Figure 5, Figure 6 and Figure 7 are that first, stability and constant improvement in R&D over the period and especially in the regeneration group of coal mining cities was observed as high as above the constant 40% growth to about 80% growth in 2014; second, there was parallel movement of both R&D and capabilities, which generally reveals an increase in R&D influences capabilities in almost equal measure; third, there were large differences in efficiency towards achieving sustainable development capabilities at some point over the period especially in the growing, maturity, and declining cities, which have no observable catch-up.
Undesired output for growing cities has been drastically low and relatively efficient, while economic development increased slightly at an increasing rate from 2008 to 2017. In the same period, social development increased until 2012 and then turned to regress thereafter. This reduced the sustainable development capabilities for both economic development and social development to an overall rate of 50% and 20%, respectively. The reasons for this low level in efficiency were due to the significant disparities in the economic and social structures over the period opposing the optimal economic and social structures of coal mining cities from Figure 4, Figure 5, Figure 6 and Figure 7. The influence of R&D in the course of catching up to sustainable development capabilities was confined to efficiency changes (EFFCH). Generally, a unit is more efficient when it is closer to zero and, evidently from Figure 4, Figure 5, Figure 6 and Figure 7, regeneration cities significantly improved with specific indicators such as recovery and decisional capacity almost to an effective and efficient state. Nevertheless, inefficiency was high for economic development in 2009 and 2016 and social development in 2012 and 2013. China’s coal mining cities have made significant improvements over the period due to the consequential benefits of R&D input in rehabilitating and neutralizing pollution to some extent. There is still more capacity for these coal mining cities to progress in their sustainable development capabilities for outright transformation for economic development and also to minimize negative environmental effects.

5. Conclusions and Direction for Future Study

5.1. Conclusion Remarks

This study analyzed the influence of R&D in mining on sustainable development in China from 2008 to 2017. Estimates were made using the Malmquist DEA-based productivity index of actual and optimal values for their average means with supporting indicators from referenced literature. Reasons for fluctuations in the sustainable development capability of coal cities were dynamically decomposed and the influence of technological efficiency and technological progress on it was discussed. Lastly, the inefficiency distribution of input–output indicators in the development of different types of coal cities was analyzed, and suggestions for optimization were projected as:
(1)
The R&D inclination for all the coal mining cities was stable but low at 0.3406 average level and needs improvement even though the trends of other single years and groups were more significant. Stability in both optimal and actual values influenced sustainable development capabilities of all the coal mining cities in 2013. R&D as an input resources influence has not reached the production frontier despite being significant in some specific periods; it needs an upward review to be more effective.
(2)
A combined average of sustainable development capability as low as 0.6918 was achieved for all four groups of coal mining cities from 2008 to 2017, with a gap of 0.0971 in sustainable development capabilities existing between the highest performing and the lowest performing cities. This creates the need for steady efforts to be made towards ensuring the enhancement and stability of sustainable development capabilities in coal mining cities. From the trend analysis, the main obstacle that significantly hindered the sustainable development of most mining cities was insufficient desired inputs indicators, especially from inefficiencies of decisional capacity, recovery, and effectiveness. Generally, the best performing category in sustainable development capabilities was the growing cities, followed by regeneration cities, then declining and maturity. Despite this performance, there is no benchmark city for other coal cities to learn from in these four types of coal cities.
(3)
The total factor efficiency of the various coal mining cities from 2008 to 2017 was 1.044, which signifies a marginal change in the overall efficiency and resource management and utilization of the coal mining cities of China over the study period. Technical changes, which were the most influencing factor on sustainable development capabilities, recorded a significant average of 1.122. This implies that the influencing force of technological changes needed to promote sustainable development capabilities of coal mining cities grew by 12.2%, which is moderately significant but still needs improvement.
The input resources of regeneration coal mining cities and their R&D inclination were progressively effective, pushing them close to the production frontier. China’s coal mining cities have made significant improvement from 2008 to 2017 due to the consequential benefits of R&D input in rehabilitating and neutralizing pollution to some extent for recovery. Declining and maturity coal mining cities have to strengthen efficiency and venture in R&D initiatives to improve effectiveness. They could promote tertiary industry development and find a new social and economic growth dimension scheme so as to minimize over-reliance on coal.

5.2. Policy Inferences

The policy inferences arrived at from the analysis of this study include the following:
In promoting the sustainable development of China and enhancing efficiency in resource utilization, coal cities need to restructure the overall activity flow to exploit the value of the raw materials of coal resources. In addition, increased investment in R&D, attaching importance to the adjustment of the industrial structure, and venturing in new industries, especially technologically inclined and tertiary industries should be pursued. In mitigating the disaster caused by coal mining, recovery initiatives should be stimulated and other cities should emulate regeneration cities with great capabilities in rehabilitation, which seems to offset damages caused by mining, therefore promoting sustainable development capabilities.
Policy makers and industries could act as agents for environmental protection when especially industries shift focus more to R&D and efficiency to break the bottleneck of key decisional capacity in growing cities. There should be intense monitoring on industrial waste discharge using big data technologies and intensified penalties for industries violating environmental rehabilitation initiatives to create an upsurge in the development of the different groups of coal mining cities and maintain energy conservation and low emissions.
A comparative overview of the analysis showed that the growing cities had the highest sustainable development capabilities and it also had the lowest R&D inclination over the period. It is evident that they had less resource development. Therefore, coal cities need to focus on R&D to increase their efficiency in resource utilization and minimize pollutant discharge.

5.3. Direction for Future Study

Given the cross-sectional nature of resource-based cities, the generalization of the outcomes of this study to specific coal mining cities should be done with caution. This is because the methodology of DEA does not support the modality of hypothesis testing. There is also the possibility of omitted variables that could have led to more robust predictions and a broader conclusion on the influence of R&D towards achieving the sustainable development of coal mining in China. Future studies in the R&D influence on sustainable development capabilities could consider studying production functions along with intermediation functions to capture more variables for analysis or investigate efficiency changes over time using the DEA method.

Author Contributions

Conceptualization, F.T.D.; Data curation, B.M.; Formal analysis, F.T.D.; Funding acquisition, J.D.; Methodology, J.D. and K.B.B.; Software, B.M.; Supervision, J.D.; Visualization, K.B.B.; Writing—original draft, F.T.D.; Writing—review & editing, B.M. and K.B.B. All authors have read and agreed to the published version of the manuscript.

Funding

This work was supported by Special Funds of the National Social Science Fund of China [18VSJ038] and partly by the National Science Foundation of China under grants 71974081, 71704066 and 71971100.

Institutional Review Board Statement

Not applicable.

Informed Consent Statement

Not applicable.

Conflicts of Interest

The authors declare there is no conflict of interest, competing financial interests or personal relationships with regards to this paper.

References

  1. Sahoo, A.K.; Sahoo, D.; Sahu, N.C. Mining export, industrial production and economic growth: A cointegration and causality analysis for India. Resour. Policy 2014, 42, 27–34. [Google Scholar] [CrossRef]
  2. Belke, A.; Dobnik, F.; Dreger, C. Energy consumption and economic growth: New insights into the cointegration relationship. Energy Econ. 2011, 33, 782–789. [Google Scholar] [CrossRef] [Green Version]
  3. Bento, J.P.C.; Moutinho, V. CO2 emissions, non-renewable and renewable electricity production, economic growth, and international trade in Italy. Renew. Sustain. Energy Rev. 2016, 55, 142–155. [Google Scholar] [CrossRef]
  4. Boamah, K.B.; Du, J.; Bediako, I.A.; Boamah, A.J.; Abdul-Rasheed, A.A.; Owusu, S.M. Carbon dioxide emission and economic growth of China—the role of international trade. Environ. Sci. Pollut. Res. 2017, 24, 13049–13067. [Google Scholar] [CrossRef] [PubMed] [Green Version]
  5. Vance, L.; Eason, T.; Cabezas, H. Energy sustainability: Consumption, efficiency, and environmental impact. Clean Technol. Environ. Policy 2015, 17, 1781–1792. [Google Scholar] [CrossRef]
  6. Dubiński, J. Sustainable development of mining mineral resources. J. Sustain. Min. 2013, 12, 1–6. [Google Scholar] [CrossRef] [Green Version]
  7. Endl, A.; Tost, M.; Hitch, M.; Moser, P.; Feiel, S. Europe’s mining innovation trends and their contribution to the sustainable development goals: Blind spots and strong points. Resour. Policy 2019, 101440. [Google Scholar] [CrossRef]
  8. Hou, Y.; Long, R.; Chen, H.; Zhang, L. Research on the sustainable development of China’s coal cities based on lock-in effec.t. Resour. Policy 2018, 59, 479–486. [Google Scholar] [CrossRef]
  9. Hou, Y.; Long, R.; Zhang, L.; Wu, M. Dynamic analysis of the sustainable development capability of coal cities. Resour. Policy 2020, 66, 101607. [Google Scholar] [CrossRef]
  10. Tang, D.F.; Jianguo, D.; Caesar, A.E.; Osei, A.A. Impact of Not in My Back Yard Conflict Management on Stakeholders: A Case of Bui Dam Project in Ghana. Arch. Bus. Res 2018, 6, 315–332. [Google Scholar]
  11. State Council. National Sustain. Development Plan for Resource-Based Cities [EB/OL]. (2013-12-03); General Office of the State Council: Beijing, China, 2013.
  12. Yu, J.; Li, J.; Zhang, W. Identification and classification of resource-based cities in China. J. Geogr. Sci. 2019, 29, 1300–1314. [Google Scholar] [CrossRef] [Green Version]
  13. Fernández, Y.F.; López, M.F.; Blanco, B.O. Innovation for sustainability: The impact of R&D spending on CO2 emissions. J. Clean. Prod. 2018, 172, 3459–3467. [Google Scholar]
  14. Romer, P.M. Increasing returns and long-run growth. J. Political Econ. 1986, 94, 1002–1037. [Google Scholar] [CrossRef] [Green Version]
  15. Li, L.; Lei, Y.; Pan, D.; Si, C. Research on sustainable development of resource-based cities based on the DEA approach: A case study of Jiaozuo, China. Math. Probl. Eng. 2016, 2016. [Google Scholar] [CrossRef] [Green Version]
  16. Wan, L.; Ye, X.; Lee, J.; Lu, X.; Zheng, L.; Wu, K. Effects of urbanization on ecosystem service values in a mineral resource-based city. Habitat Int. 2015, 46, 54–63. [Google Scholar] [CrossRef]
  17. Hopwood, B.; Mellor, M.; O’Brien, G. Sustainable development: Mapping different approaches. Sustain. Dev. 2005, 13, 38–52. [Google Scholar] [CrossRef] [Green Version]
  18. Waas, T.; Hugé, J.; Verbruggen, A.; Wright, T. Sustainable development: A bird’s eye view. Sustainability 2011, 3, 1637–1661. [Google Scholar] [CrossRef] [Green Version]
  19. Ali, S.H.; Giurco, D.; Arndt, N.; Nickless, E.; Brown, G.; Demetriades, A.; Durrheim, R.; Enriquez, M.A.; Kinnaird, J.; Littleboy, A. Mineral supply for sustainable development requires resource governance. Nature 2017, 543, 367. [Google Scholar] [CrossRef]
  20. Calas, G. Mineral resources and sustainable development. Elem.: Int. Mag. Mineral. Geochem. Petrol. 2017, 13, 301–306. [Google Scholar] [CrossRef]
  21. Cao, Y.; Bai, Z.; Zhou, W.; Zhang, X. Analyses of traits and driving forces on urban land expansion in a typical coal-resource-based city in a loess area. Environ. Earth Sci. 2016, 75, 1191. [Google Scholar] [CrossRef]
  22. Tilton, J.E. Exhaustible resources and sustainable development: Two different paradigms. Resour. Policy 1996, 22, 91–97. [Google Scholar] [CrossRef]
  23. Uhlenbruck, K.; Meyer, K.E.; Hitt, M.A. Organizational transformation in transition economies: Resource-based and organizational learning perspectives. J. Manag. Stud. 2003, 40, 257–282. [Google Scholar] [CrossRef]
  24. Chen, Y.-S.; Hsu, C.-J.; Hsiau, S.-S.; Ma, S.-M. Clean coal technology for removal dust using moving granular bed filter. Energy 2017, 120, 441–449. [Google Scholar] [CrossRef]
  25. Zhang, Y.; Sun, Y.; Qin, J. Sustainable development of coal cities in Heilongjiang province based on AHP method. Int. J. Min. Sci. Technol. 2012, 22, 133–137. [Google Scholar] [CrossRef]
  26. Drebenstedt, C. Responsible mining–approaches and realization. In Proceedings of the Proc. 22nd World Mining Congress–Innovations and Challenges in Mining, Poland, 2006; pp. 135–147. [Google Scholar]
  27. Batterham, R. The mine of the future–even more sustainable. Miner. Eng. 2017, 107, 2–7. [Google Scholar] [CrossRef]
  28. Mudd, G.M. The environmental sustainability of mining in Australia: Key mega-trends and looming constraints. Resour. Policy 2010, 35, 98–115. [Google Scholar] [CrossRef]
  29. Buxton, A. MMSD+ 10: Reflecting on a Decade; International Institute for Environment and Development: London, UK; U.S. Department of Energy, Office of Scientific and Technical Information: Washington, DC, USA, 2012.
  30. Franks, D.M.; Cohen, T. Social Licence in Design: Constructive technology assessment within a mineral research and development institution. Technol. Forecast. Soc. Chang. 2012, 79, 1229–1240. [Google Scholar] [CrossRef]
  31. Hilson, G.; Murck, B. Sustainable development in the mining industry: Clarifying the corporate perspective. Resour. Policy 2000, 26, 227–238. [Google Scholar] [CrossRef]
  32. Haider, F.; Kunst, R.; Wirl, F. Total factor productivity, its components and drivers. Empirica 2020, 1–45. [Google Scholar] [CrossRef] [Green Version]
  33. Cameron, G.; Proudman, J.; Redding, S. Technological convergence, R&D, trade and productivity growth. Eur. Econ. Rev. 2005, 49. [Google Scholar] [CrossRef]
  34. Madsen, J.B. Technology spillover through trade and TFP convergence: 135 years of evidence for the OECD countries. J. Int. Econ. 2007, 72, 464–480. [Google Scholar] [CrossRef] [Green Version]
  35. Azapagic, A. Developing a framework for sustainable development indicators for the mining and minerals industry. J Clean. Prod. 2004, 12, 639–662. [Google Scholar] [CrossRef]
  36. Malmquist, S. Index numbers and indifference surfaces. Trabajos Estadística 1953, 4, 209–242. [Google Scholar] [CrossRef]
  37. Daly, H.E.; Cobb, J.B., Jr.; Cobb, J.B. For the Common Good: Redirecting the Economy toward Community, the Environment, and a Sustainable Future; Beacon Press: Boston, MA, USA, 1994. [Google Scholar]
  38. Yu, J.; Zhang, Z.; Zhou, Y. The sustainability of China’s major mining cities. Resour. Policy 2008, 33, 12–22. [Google Scholar] [CrossRef]
  39. Wang, R.; Cheng, J.; Zhu, Y.; Xiong, W. Research on diversity of mineral resources carrying capacity in Chinese mining cities. Resour. Policy 2016, 47, 108–114. [Google Scholar] [CrossRef]
  40. Sufian, F. Banks total factor productivity change in a developing economy: Does ownership and origins matter? J. Asian Econ. 2011, 22, 84–98. [Google Scholar] [CrossRef]
  41. Battista, G.; Evangelisti, L.; Guattari, C.; Basilicata, C.; de Lieto Vollaro, R. Buildings energy efficiency: Interventions analysis under a smart cities approach. Sustainability 2014, 6, 4694–4705. [Google Scholar] [CrossRef] [Green Version]
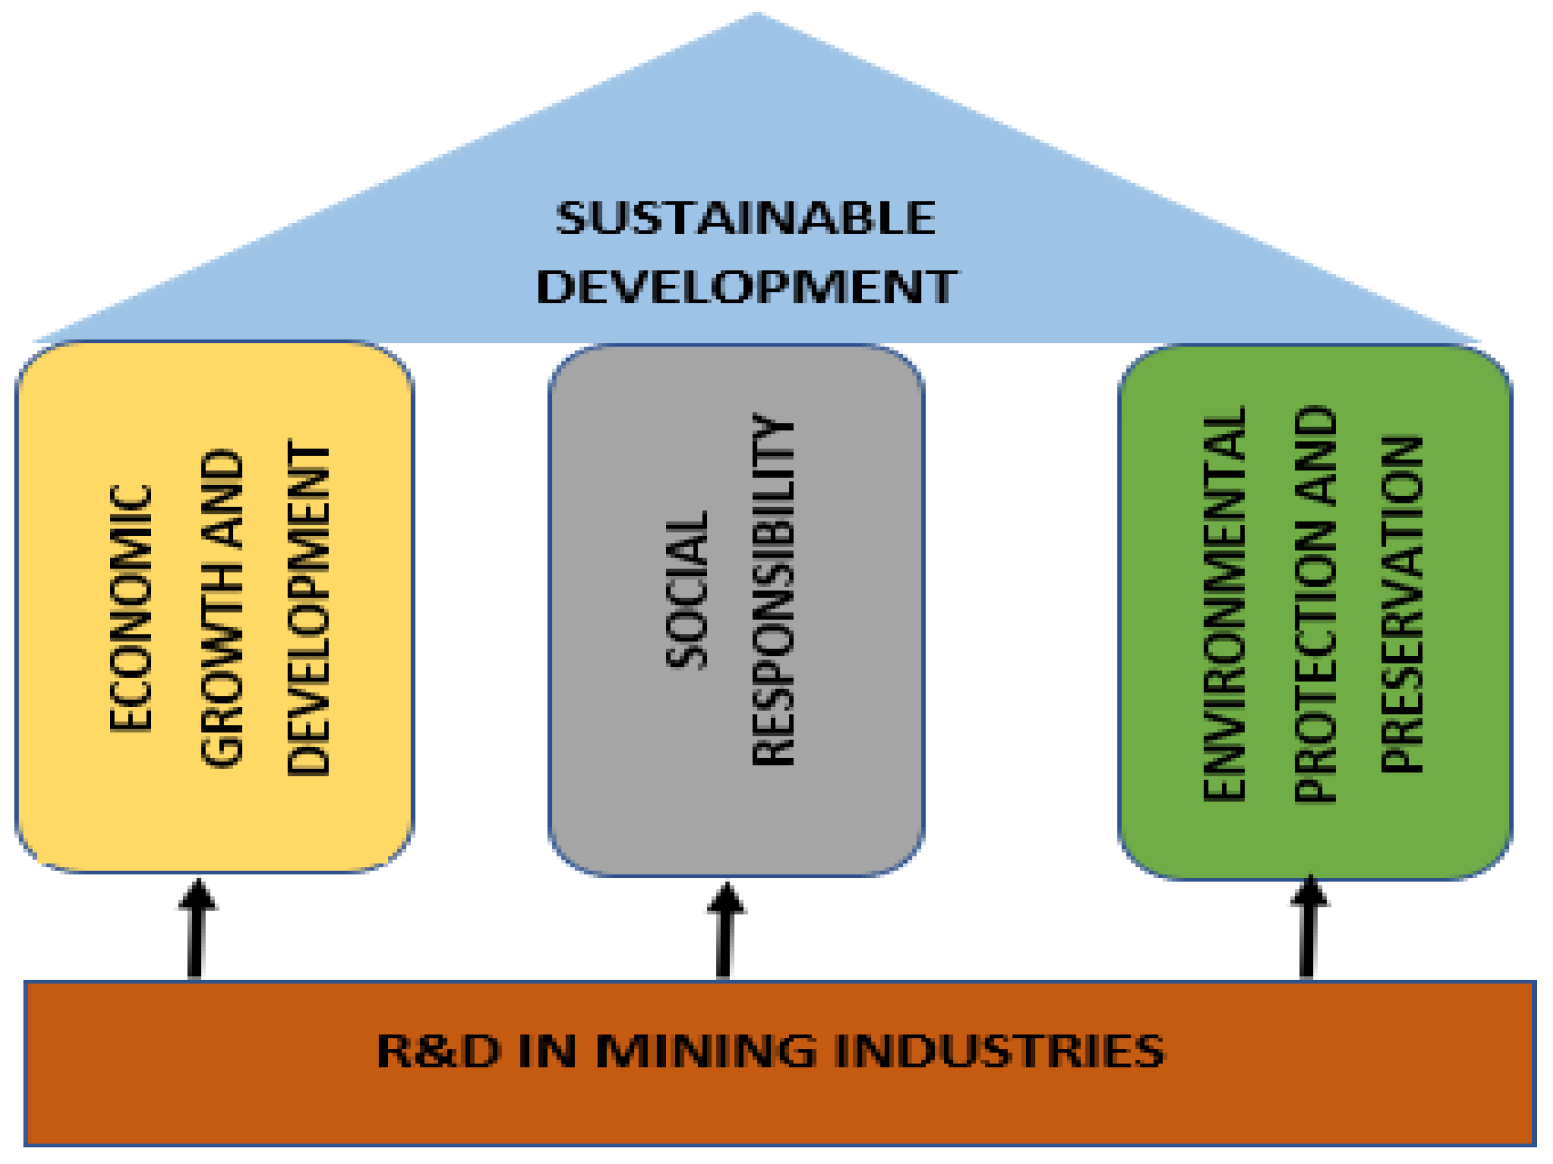
Figure 1. Sustainability development elements for the mining sector.
Sustainability 13 05289 g001
Figure 2. Changes in the R&D inclination of diverse coal mining cities of China from 2008 to 2017.
Sustainability 13 05289 g002
Figure 3. The trend of sustainable development capabilities of diverse coal mining cities of China from 2008 to 2017.
Sustainability 13 05289 g003
Figure 4. Distribution of input–output indicators for the ineffectiveness of growing coal mining cities.
Sustainability 13 05289 g004
Figure 5. Distribution of input–output indicators for the ineffectiveness of maturity coal mining cities.
Sustainability 13 05289 g005
Figure 6. Distribution of input–output indicators for the ineffectiveness of declining coal mining cities.
Sustainability 13 05289 g006
Figure 7. Distribution of input–output indicators for regeneration coal mining cities.
Sustainability 13 05289 g007
Table 1. Total energy production and consumption (10,000 tons of SCE).
YearTotal ProductionAs Percentage of Total Energy Production
CoalCrude OilNatural GasPrimary Electricity and Other Energy
2008277,41976.89.83.99.5
2009286,09276.89.44.09.8
2010312,12576.29.34.110.4
2011340,17877.88.54.19.6
2012351,04176.28.54.111.2
2013358,78475.48.44.411.8
2014361,86673.68.44.713.3
2015361,47672.28.54.814.5
2016346,03769.88.25.216.8
2017358,50069.67.65.417.4
YearConsumptionAs Percentage of Total Energy Consumption
CoalCrude OilNatural GasPrimary Electricity and Other Energy
2008320,61171.516.73.48.4
2009336,12671.616.43.58.5
2010360,64869.217.44.09.4
2011387,04370.216.84.68.4
2012402,13868.517.04.89.7
2013416,91367.417.15.310.2
2014425,80665.617.45.711.3
2015429,90563.718.35.912.1
2016435,81962.018.56.213.3
2017448,52960.418.87.013.8
Source: China statistical yearbook 2019.
Table 2. Fundamental indicators for the efficiency of sustainability development measurement of coal mining cities.
Fundamental LayersResultant Indicators Elementary Indicators
Required input: (m)R&D: (ma)Average spending rate on R&D: ma1
Average input of technological innovation: ma2
Recovery: (mb)Sewage treatment rate: mb1
Unharmful domestic waste treatment rate: mb2
Industrial solid waste treatment rate: mb3
Effectiveness: (mc)Per capita potential value of main retained coal reserve: mc1
Per capita land area: mc2
Per capita energy consumption: mc3
Per capita used water resource: mc4
Decisional capacity: (md)Level of decision-making capability: md1
Environmental sustainability consciousness: md2
Development and planning of coal rationality: md3
Required output: (s)Economic impact: (sa)Per capita gross domestic product: sa1
GDP growth rate: sa2
Profit and tax contributed from per hundred yuan of primary value of fixed asset in coal mining industries: sa3
Rate of employment: sa4
Social impact: (sb)Gross population growth rate: sb1
Fraction of non-mining population to total population: sb2
Per capita retail sales of consumer goods: sb3
Number of college graduates per 10,000: sb4
Per capita green space area: sb5
Unfavorable output: (q)Industrial pollution: (q)Per capita industrial waste water discharged: q1
Per capita SO2 emission: q2
Per capita CO2 emission: q3
Table 3. Categories of 45 coal mining cities of China.
Number of CitiesList of Coal Mining CitiesCategory
7Ordos, Luipanshui, Shuozhou, HulumBuir, Xianyang, Yanan, and YulinGrowing
21Luliang, Zhangjiakou, Xinzhou, Datong, Luliang, Yangquan, Changzhi, Xingtai, Jincheng, Linfen, Chifeng, Jixi, Pingdingshan, Hebi, Huainan, Handan, Jinzhong, Jining, Guangyuan, Dazhou, Anshun, and QujingMaturity
13Wuhai, Hegang, Shuangyashan, Jiaozuo, Huaibei, Fushun, Fuxin, Shizuishan, Liaoyuan, Qitaihe, Pingxiang, and ZaozhuangDeclining
4Tongchuan, Tangshan, Xuzhou, Linyi, and TaiyuanRegeneration
Table 4. R&D inclination of coal mining cities of China from 2008 to 2017.
YearGrowing MaturityDecliningRegenerationMean
20080.19330.21120.38110.35680.2856
20090.23140.42110.23450.36110.3120
20100.08720.34440.36610.41090.3022
20110.21400.21900.46720.43220.3331
20120.17050.19360.10080.36610.2078
20130.20450.18180.40100.51350.3252
20140.40900.40610.38800.80880.5030
20150.50770.49800.25510.55540.4541
20160.45620.20080.26120.41660.3337
20170.40010.25110.29210.45330.3492
Mean0.28740.29270.31470.46750.3406
Table 5. Capabilities of sustainable development of coal mining cities of China from 2008 to 2017.
YearGrowing MaturityDecliningRegenerationMean
20080.71140.57990.62320.63510.6374
20090.90210.74440.71200.87080.8073
20100.69860.63220.62410.69860.6634
20110.85660.79650.72110.79910.7933
20120.71640.66120.61190.69410.6709
20130.93380.80900.91720.89910.8898
20140.64440.56110.60060.62110.6068
20150.76000.61940.62970.72130.6826
20160.70790.59590.60930.63140.6361
20170.57210.53210.50810.50810.5301
Mean0.75030.65320.65570.70790.6918
Table 6. Decomposition of TFP for sustainable development capabilities of coal mining cities.
Year EffchTechchPechSechTfpch
2008–20090.9911.0330.9990.9891.021
2009–20100.7080.9540.8940.8660.775
2010–20110.8391.1181.1010.7070.791
2011–20120.7501.1450.8060.9300.866
2012–20131.4011.1111.2120.9431.414
2013–20141.0611.1551.1061.4141.265
2014–20151.0511.4371.1250.8611.054
2015–20160.9491.0481.2010.9491.095
2016–20170.9781.0971.0121.0611.118
Mean0.9701.1221.0510.9691.044
Publisher’s Note: MDPI stays neutral with regard to jurisdictional claims in published maps and institutional affiliations.