Article

Utility of Human Footprint Pressure Mapping for Large Carnivore Conservation: The Kafue-Zambezi Interface

by
Robin Lines
1,
Dimitrios Bormpoudakis
1,
Panteleimon Xofis
2,*,
Douglas C. MacMillan
1,
Lucy Pieterse
3 and
Joseph Tzanopoulos
1,4
1
Durrell Institute of Conservation and Ecology, School of Anthropology and Conservation, University of Kent, Canterbury CT2 7NZ, UK
2
Department of Forestry and Natural Environment, International Hellenic University, 66100 Drama, Greece
3
BioCarbon Partners (BCP), Unit 3 Leopards Hill Business Park, Leopards Hill Road, Lusaka 50830, Zambia
4
Kent Interdisciplinary Centre for Spatial Studies, School of Anthropology and Conservation, University of Kent, Canterbury CT2 7NZ, UK
*
Author to whom correspondence should be addressed.
Sustainability 2022, 14(1), 116; https://doi.org/10.3390/su14010116
Submission received: 22 October 2021 / Revised: 19 December 2021 / Accepted: 22 December 2021 / Published: 23 December 2021
(This article belongs to the Special Issue Wildlife Conservation: Managing Resources for a Sustainable World)

Abstract

:
Proxies and indicators to monitor cumulative human pressures provide useful tools to model change and understanding threshold pressures at which species can persist, are extirpated, or might recolonize human-impacted landscapes. We integrated modelling and field observations of human pressure variables to generate a site-specific, fine scale Human Footprint Pressure map for 39,000 km2 of rangelands at the Kafue–Zambezi interface—a key linkage in the Kavango-Zambezi Transfrontier Conservation Area. We then modelled Human Footprint Pressure against empirically derived occurrence data for lion (Panthera leo), leopard (Panthera pardus), and spotted hyena (Crocuta crocuta) to generate Human Footprint Pressure threshold ranges at which each species were persisting or extirpated within ten wildlife managed areas linking Kafue National Park to the Zambezi River. Results overcame many limitations inherent in existing large-scale Human Footprint Pressure models, providing encouraging direction for this approach. Human Footprint Pressure thresholds were broadly similar to existing studies, indicating this approach is valid for site- and species-specific modelling. Model performance would improve as additional datasets become available and with improved understanding of how asymmetrical and nonlinear threshold responses to footprint pressure change across spatial-temporal scales. However, our approach has broader utility for local and region-wide conservation planning where mapping and managing human disturbance will help in managing carnivore species within and without protected area networks.

1. Introduction

Humanity’s impact on the planet stretches from the deep ocean to mountaintops, manifesting through direct demands on natural resources and indirect effects of these demands on wider global systems [1,2]. The wide-ranging implications of increasing spatio-temporal resource demands lead to loss and fragmentation of key wildlife habitats [3,4], constraining species movement [5] and resulting to the reduction and extinction of wildlife populations at multiple scales [6,7,8]. While the decline in human pressures on natural system is presenting new opportunities for rewilding and carnivore conservation throughout much of continental Europe [9], many of the world’s developing regions supporting large tracts of existing wildlife habitat and high levels of biodiversity [10] are experiencing intensifying spatio-temporal human pressures in and around protected areas [11,12]. Increased human resource demands in these areas are also impacting conservation efforts and political support for the maintenance and expansion of wildlife-based land uses and wildlife economies at regional, national, and transboundary scales [13,14].
Attempts to capture these anthropogenic pressures include the Human Footprint Pressure which takes into account inter alia population growth, the expansion of built areas and settlement, transport infrastructure and linkages, agropastoralism, and extractive industries [15]. Significant Human Footprint Pressure often results in profound and complex effects impacting the structure and function of ecosystems, including changes to key resources driving socioecological system productivity and resilience [16] and livelihood opportunities for communities residing within them [17]. Furthermore, elevated Human Footprint Pressure decreases structural and functional connectivity between wildlife managed areas for many species of conservation concern [18].
Existing Human Footprint Pressure analyses have traditionally been generated at relatively low resolution to provide overviews and indicators of Human Footprint Pressure at global scales [17,19,20]. Increasingly, the focus of Human Footprint Pressure is shifting to consider its utility as a proxy or predictive indicator for measuring and understanding finer scale impacts on species and processes, including studies on species movement [5], behaviour [21], extinction risk [22], range use [23], and more broadly as a conservation planning tool [24]. These approaches seek to overcome many of the questions and limitations surrounding data availability, accuracy, and resolution posed by conventional coarser scale multivariate models.
Generating site- and species-specific Human Footprint Pressure models that can be used as a proxy or indicator of species-level habitat suitability and sensitivity to human pressure can aid our understanding of thresholds at which species persist, are extirpated, or are likely to recolonize both protected and non-protected areas, leading to improved application of conservation science in management [25]. However, beyond large scale assessments [22], these tools are poorly understood and developed owing chiefly to an absence of integrated fine-scale remote sensing and in situ data, precluding appropriate accuracy and resolution [26].
The Kavango-Zambezi Transfrontier Conservation Area (KAZA TFCA, hereafter KAZA) in central Southern Africa seeks to promote connectivity between clusters of wildlife managed areas at the interface of five neighboring countries. Connectivity at the species and scale of interest are poorly studied within and between many of the proposed landscape-scale linkages in KAZA [27], but with human pressure increasing throughout the region [11,28], there is a need to understand how Human Footprint Pressures are impacting connectivity for key species of interest throughout core linkages. The large carnivores exert significant top-down influence on ecosystems, imparting strong regulatory pressures driving ecosystem structure and function [29,30]. They are highly susceptible to direct and indirect human activities including (legal and illegal) hunting, reduction of wild prey, and habitat fragmentation and loss [6,31]. Large carnivores are also a key asset for the development of wildlife economies [32], and have been identified by the KAZA programme as target species for conservation action, including the stabilization and growth of populations in key habitats, and maintenance of secure and active connectivity pathways between core wildlife managed areas [33]. In concert, these factors highlight large carnivores as appropriate target species against which to model Human Footprint Pressure.
The current study examines the effect of Human Footprint Pressures on the distribution of three emblematic carnivores, namely: lion (Panthera leo), leopard (Panthera pardus), and spotted hyena (Crocuta crocuta). It aims to generate site-specific, fine scale maps of Human Footprint Pressure to (1) test the validity of this approach for predicting species occurrence and (2) explore if this approach can determine discernible Human Footprint Pressure thresholds at which target species persist or are extirpated at the wildlife managed area scale.

2. Materials and Methods

The study area, which is the Kafue–Zambezi interface, covers central part of KAZA. The KAZA extends over c. 520,000 km2 of central Southern Africa, spanning the borders of Angola, Botswana, Namibia, Zambia, and Zimbabwe, centered around the Kavango and Zambezi River basins (Figure 1) [34]. The KAZA landscape incorporates a network of ~70 protected areas in accordance to the International Union for Conservation of Nature (IUCN) in the categories I–VI and Not Reported categories [35]. These protected areas are characterized by a wide spectrum of investment and management effectiveness [36]. Spatial, connectivity between these protected areas has been identified as one of KAZA’s central objectives [34].
Kafue National Park and surrounding protected areas, collectively known as the Greater Kafue System, represents KAZA’s major northern cluster (Figure 1) and Zambia’s majority contribution to the KAZA Programme [34]. Connectivity between Kafue National Park and adjacent protected areas, centered on Chobe National Park and East Zambezi Region in Namibia, is contingent on movement across eight partially and nominally protected areas plus an adjacent open Communal Areas identified by Lines et al. [37], as potentially important for corridor planning. In concert, these areas span ~13,000 km2, extending 140–170 km from the Kafue National Park border south-southwest towards the Zambezi River at the confluence of Zambia, Namibia, and Botswana [38].
The landscape is historically, and still remains, characterized by dynamic spatiotemporal human pressures, though few data on the areas’ wildlife and human population are available prior to the 1960s [38,40]. Much of the study area was sparsely settled until the development of a railway from Livingstone to Mulobezi from 1923 to 1924 to exploit the region extensive tracts of Zambezi teak forest (Baikiaea plurijuga). Access to formerly remote areas had profound impacts on its people and wildlife [41]. Southern areas around Simalaha, bordering the Zambezi River, were heavily depopulated during the 1966–1990 Angolan War, and thereafter increasing numbers of agro-pastoralists have settled this landscape (Yeta, pers comms), significantly increasing human pressures [38]. Systematic censuses from 2000 onward indicate Districts with boundaries intersecting the study area have experienced annualized population growth of ~2.8%, with an average population density of ~4.5 people/km2 [40]. However, these larger scale surveys hide significant finer scale variation.

2.1. Generating Human Footprint Pressure Maps

Early Geographical Information System-based versions of the Human Footprint Pressure sought to build on the concept of Ecological Footprint mapping [42], utilizing availability of new Earth observation data sets and advances in satellite imagery capabilities covering human activities and the physical world, including land use and cover, transport linkages and human population density. This increase in resolution facilitated the development of geographical proxies for inferring variation in global human influences believed to have the most important direct pressure on wildlife [15]. Based on previous efforts, Venter et al. [17] extended the methodology of aggregating pressure scores at a global 1 km2 resolution, based on long-term datasets, to generate updated Human Footprint Pressures and trends over time. Sanderson et al. [15] and Venter et al. [17] assign pressure scores to anthropogenic land-uses or activities. They integrate individual human pressure layers into a GIS for a composite human footprint pressure layer. While the Kafue–Zambezi landscape lacks long term datasets from which to derive trend data, our reworking of the Sanderson et al. [15] and Venter et al. [17] methodology sought to integrate the highest resolution data sets currently available for the landscape to generate outputs at two orders of magnitude finer scale. Details on the layers employed, spatial resolution and pressure scores adopted in the current study are shown in Table 1 and in the paragraphs below. Due to lack of pastureland data availability, this particular human pressure was omitted from this study.
Scoring of individual human pressure variables follows the same approach of Sanderson et al. [15]. Since more than one pressure variable may be present in a particular location, the maximum score, when all variables are present to their maximum scores, results in a pressure score of 43.8.
  • Settlement data was derived from Bonafilia et. al. [43] at 30 m resolution. All pixels overlapping settlement areas were given a pressure score of 10 representing the highest level of direct pressure (implying settled area were unsuitable for wildlife), with all other pixels given a score of 0.
  • Human Population Density data was unavailable at sufficiently fine scale for the landscape to include as a stand-alone data layer. Given the largely homogenous nature of settlement throughout the area (an absence of large multi-story buildings and dense conurbations versus ubiquitous single-story concrete block and tin buildings with scattered adobe and grass huts throughout rural area (Lines, pers obs)), we calculated average population density for the study area from the district scale data using 2019 population projected data [40]. Assuming that the total population of a district exists within the area of settlements, the total population was divided with the total area occupied by settlements, to provide their average population density. We then applied the log formula employed by Venter et al. [17] for scarcely populated areas (Table 1). The calculated score was applied to all pixels that constitute part of a settlement.
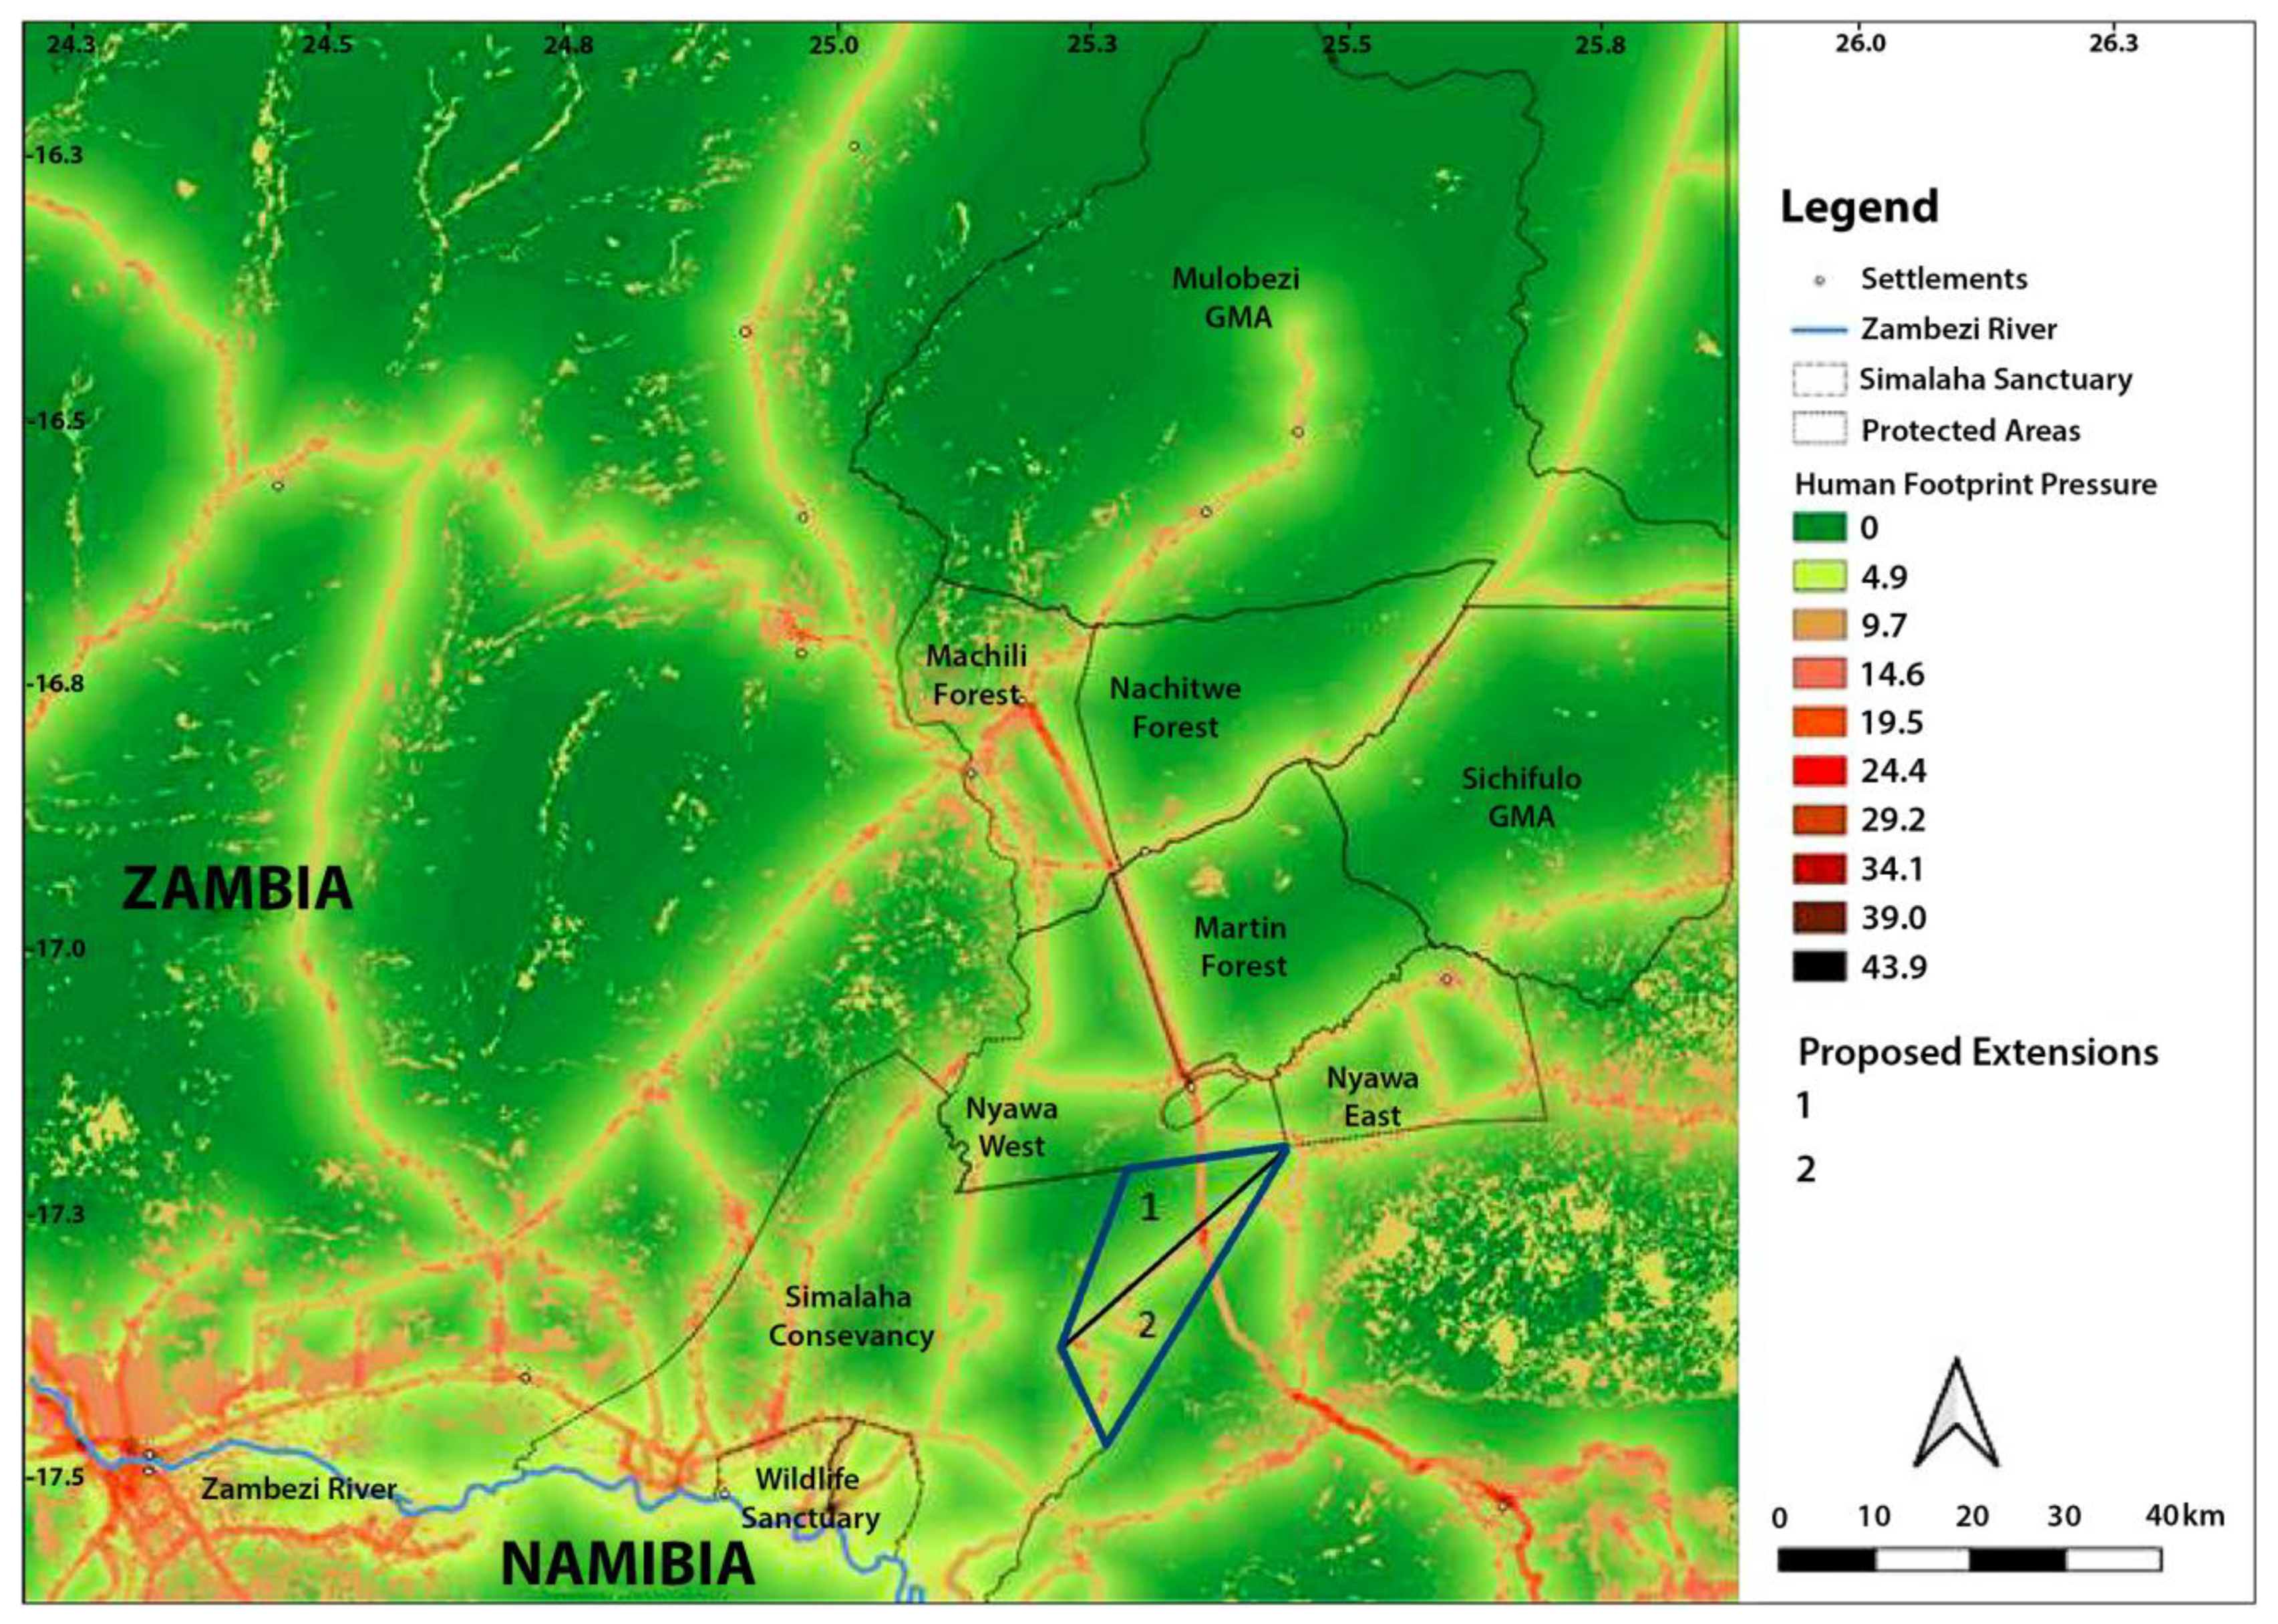
  • Roads, acquired by the Peace Parks Foundation (PPF), constitute both a direct and an indirect human pressure. They reduce the extent of suitable habitats and the degree of habitat fragmentation while at the same time they are associated with increased traffic-induced mortality [45]. The indirect impacts are associated with the increased accessibility to wild areas ensured by a dense road network.
  • The same approach adopted by Venter et al. [17] for scoring the human pressure associated with roads was adopted in the current study. A pressure score of 8 was assigned to all pixels in a distance of 0.5 km either side of roads, indicating high direct human pressure. A pressure score of 4, exponentially decaying out to 15 km, was assigned to pixels in a distance longer from 0.5 km either side of the roads up to 15 km away, indicating lower indirect pressures as distance from the roads increases. The threshold of 15 km was set as it represents the approximate distance a person might reasonably access on foot within a day. A vector roads layer, provided by Peace Parks Foundation (unpublished data), including major tar and secondary dirt roads linking settlements, formed the baseline for the generation of the roads raster layer at a spatial resolution of 10 m. Tertiary dirt tracks were omitted from the analysis due to their dynamic nature and inconsistent mapping. The range of pressure scores varied between 0.25 at a distance of 15 km from roads to 8 for pixels next to roads.
  • Railways, acquired by the PPF, represent direct drivers of habitat conversion and conduits of human access into wildlife areas similar to roads. Since passengers cannot commonly disembark at will, indirect effects away from the railway line are considered minimal. Following Venter et al. [17], we gave railways a direct pressure score of 8 for a distance of 0.5 km either side of the railway using the same method as for roads.
  • Navigable Waterways, acquired by the PPF, like roads, provide direct access to wildlife habitats along the waterway, and indirect access in periphery areas. The Zambezi River is the only permanent navigable waterway in our study area, and following Venter et al. [17], we assigned a pressure score of 4 to pixels adjacent to the river, exponentially decaying out to 15 km.
  • Arable land throughout the Kafue–Zambezi interface is characterized by majority maize and pulses cultivated using the traditional Chitemene low input, rain fed, slash and burn farming method [46]. Arable land cover classifications are considered by Venter et al. [17] to provide intermediate disturbance to wildlife though direct reduction of wildlife habitat.
  • The arable land was extracted by a land cover map produced by Lines et al. [37] using a mosaic of 24, geometrically and atmospherically corrected, Sentinel 2 images in an Object Oriented Image Analysis environment. The land cover map had a spatial resolution of 10 m and an overall classification accuracy of 91.6% [37]. A pressure score of 7 was assigned to all pixels covered by arable land and 0 to all other pixels [17].
  • Night-time light infrastructure, while sparse and of low intensity throughout much of our study area, is considered a direct human pressure limiting wildlife through a range of negative impacts [47].
  • The “vcm-orm-ntl” (VIIRS Cloud Mask—Outlier Removed—Night-time Lights) annual average layer was used [44], for generating the respective pressure layer. Pixels with a value of 0 (no light) were assigned the value of 0 in the generated layer. For all other pixels, following Venter et al. [17], we applied the same log formula used for pop density (Table 1) resulting in pixels with scores ranging from 0 to 8.971.
  • Aggregating the layers: All generated layers were added to generate an aggregate layer indicating for each pixel the total Human Footprint Pressure. Before aggregation all layers generated at a spatial resolution coarser than 10 m were resampled to a spatial resolution of 10 m. The resolution of 10 m was adopted for this analysis, because it corresponds to the resolution of the land cover data and it is the finest among all data. While the resampling to a finer resolution does not affect the quality of data provided at coarser resolutions, a resampling of fine resolution data to a coarser resolution would probably result to information loss. The aggregated Human Footprint Pressure layer was used as the single explanatory variable in a habitat suitability modelling analysis.

2.2. MaxEnt Habitat Suitability Modelling

Following the methods described in Lines et al. [37], habitat suitability maps for lion, leopard, and spotted hyaena were generated using MaxEnt [48] which performs well compared to other modelling techniques using presence only data [49], and has been repeatedly used to model large carnivores distribution [50,51,52,53]. We present the modelling briefly below, and refer to Lines et al. [37] for more details.
We incorporated empirically generated occurrence data from Lines et al. [38]. In total, 102 × 4 km transects, optimized for site conditions, were surveyed on foot three times by the author and two experienced local trackers from the safari hunting industry, amounting to 1224 km of spoor transects during the dry season of May–October 2015, based on a pilot study to determine optimal sampling effort to detect target species and cover the landscape in a single field season. To account for sampling bias, we spatially rarefied occurrence records for all species by thinning (using a 500 × 500 m pixel-size grid of the area). In total, 43 occurrence records were used for lions, 84 for leopards, and 78 for spotted hyenas. Data we split into two sets, a training (70%) and a testing (30%) set for all species, 10,000 thousands background points were randomly selected as pseudoabsence data, and 50 iterations were run for all species. We used receiver operating characteristic area under the curve for evaluating the models’ efficiency (ROC AUC). While we sought to incorporate occurrence data for the entire extant large carnivore guild known from the Greater Kafue System, sample sizes were too small for cheetah (Acinonyx jubatus) and African wild dog (Lycaon pictus) to include in final analyses. The predictor variable modelled against single occurrence was the aggregated human footprint.
An additional analysis was undertaken to investigate Species Sensitivity to Human Footprint Pressure. The relationship of large carnivores to changing Human Footprint Pressure is well established at the global scale [23,54]. However, application of this relationship towards an understanding of thresholds at which species occur, locally extirpate, or might recolonize is poorly developed, irrespective of its clear utility as a conservation tool [24]. In order to identify the thresholds of Human Footprint Pressure, at the wildlife management area scale, above which the species do not occur we calculated the mean Human Footprint Pressure for each protected area. The resulted scores were examined against the derived occurrence data for lion, leopard, and spotted hyena, then compared outputs against species-scale relative sensitivities to extinction from Di Marco et al. [22], and the ranking of sensitivities to localized extirpation following Riggio et al. [31].

3. Results

Figure 2 indicates areas of high to low human pressure, with notable areas of highest pressure around Sesheke/Katima Mulilo in the southwest, along the Zambia/Namibia border following the east-west tar road, along much of the Zambezi River and in the central/eastern areas dominated by access roads, settlements, and agricultural development. Broadly, settlement and agricultural development is widespread throughout the landscape, concurrent with the formal and informal road network. Areas of low apparent human pressure include Kafue National Park (where settlement and agriculture are illegal and non-existent), and adjacent areas of northern Mulobezi, Sichifulo Game Management Areas, Nachitwe and Martin Forests (Figure 2).

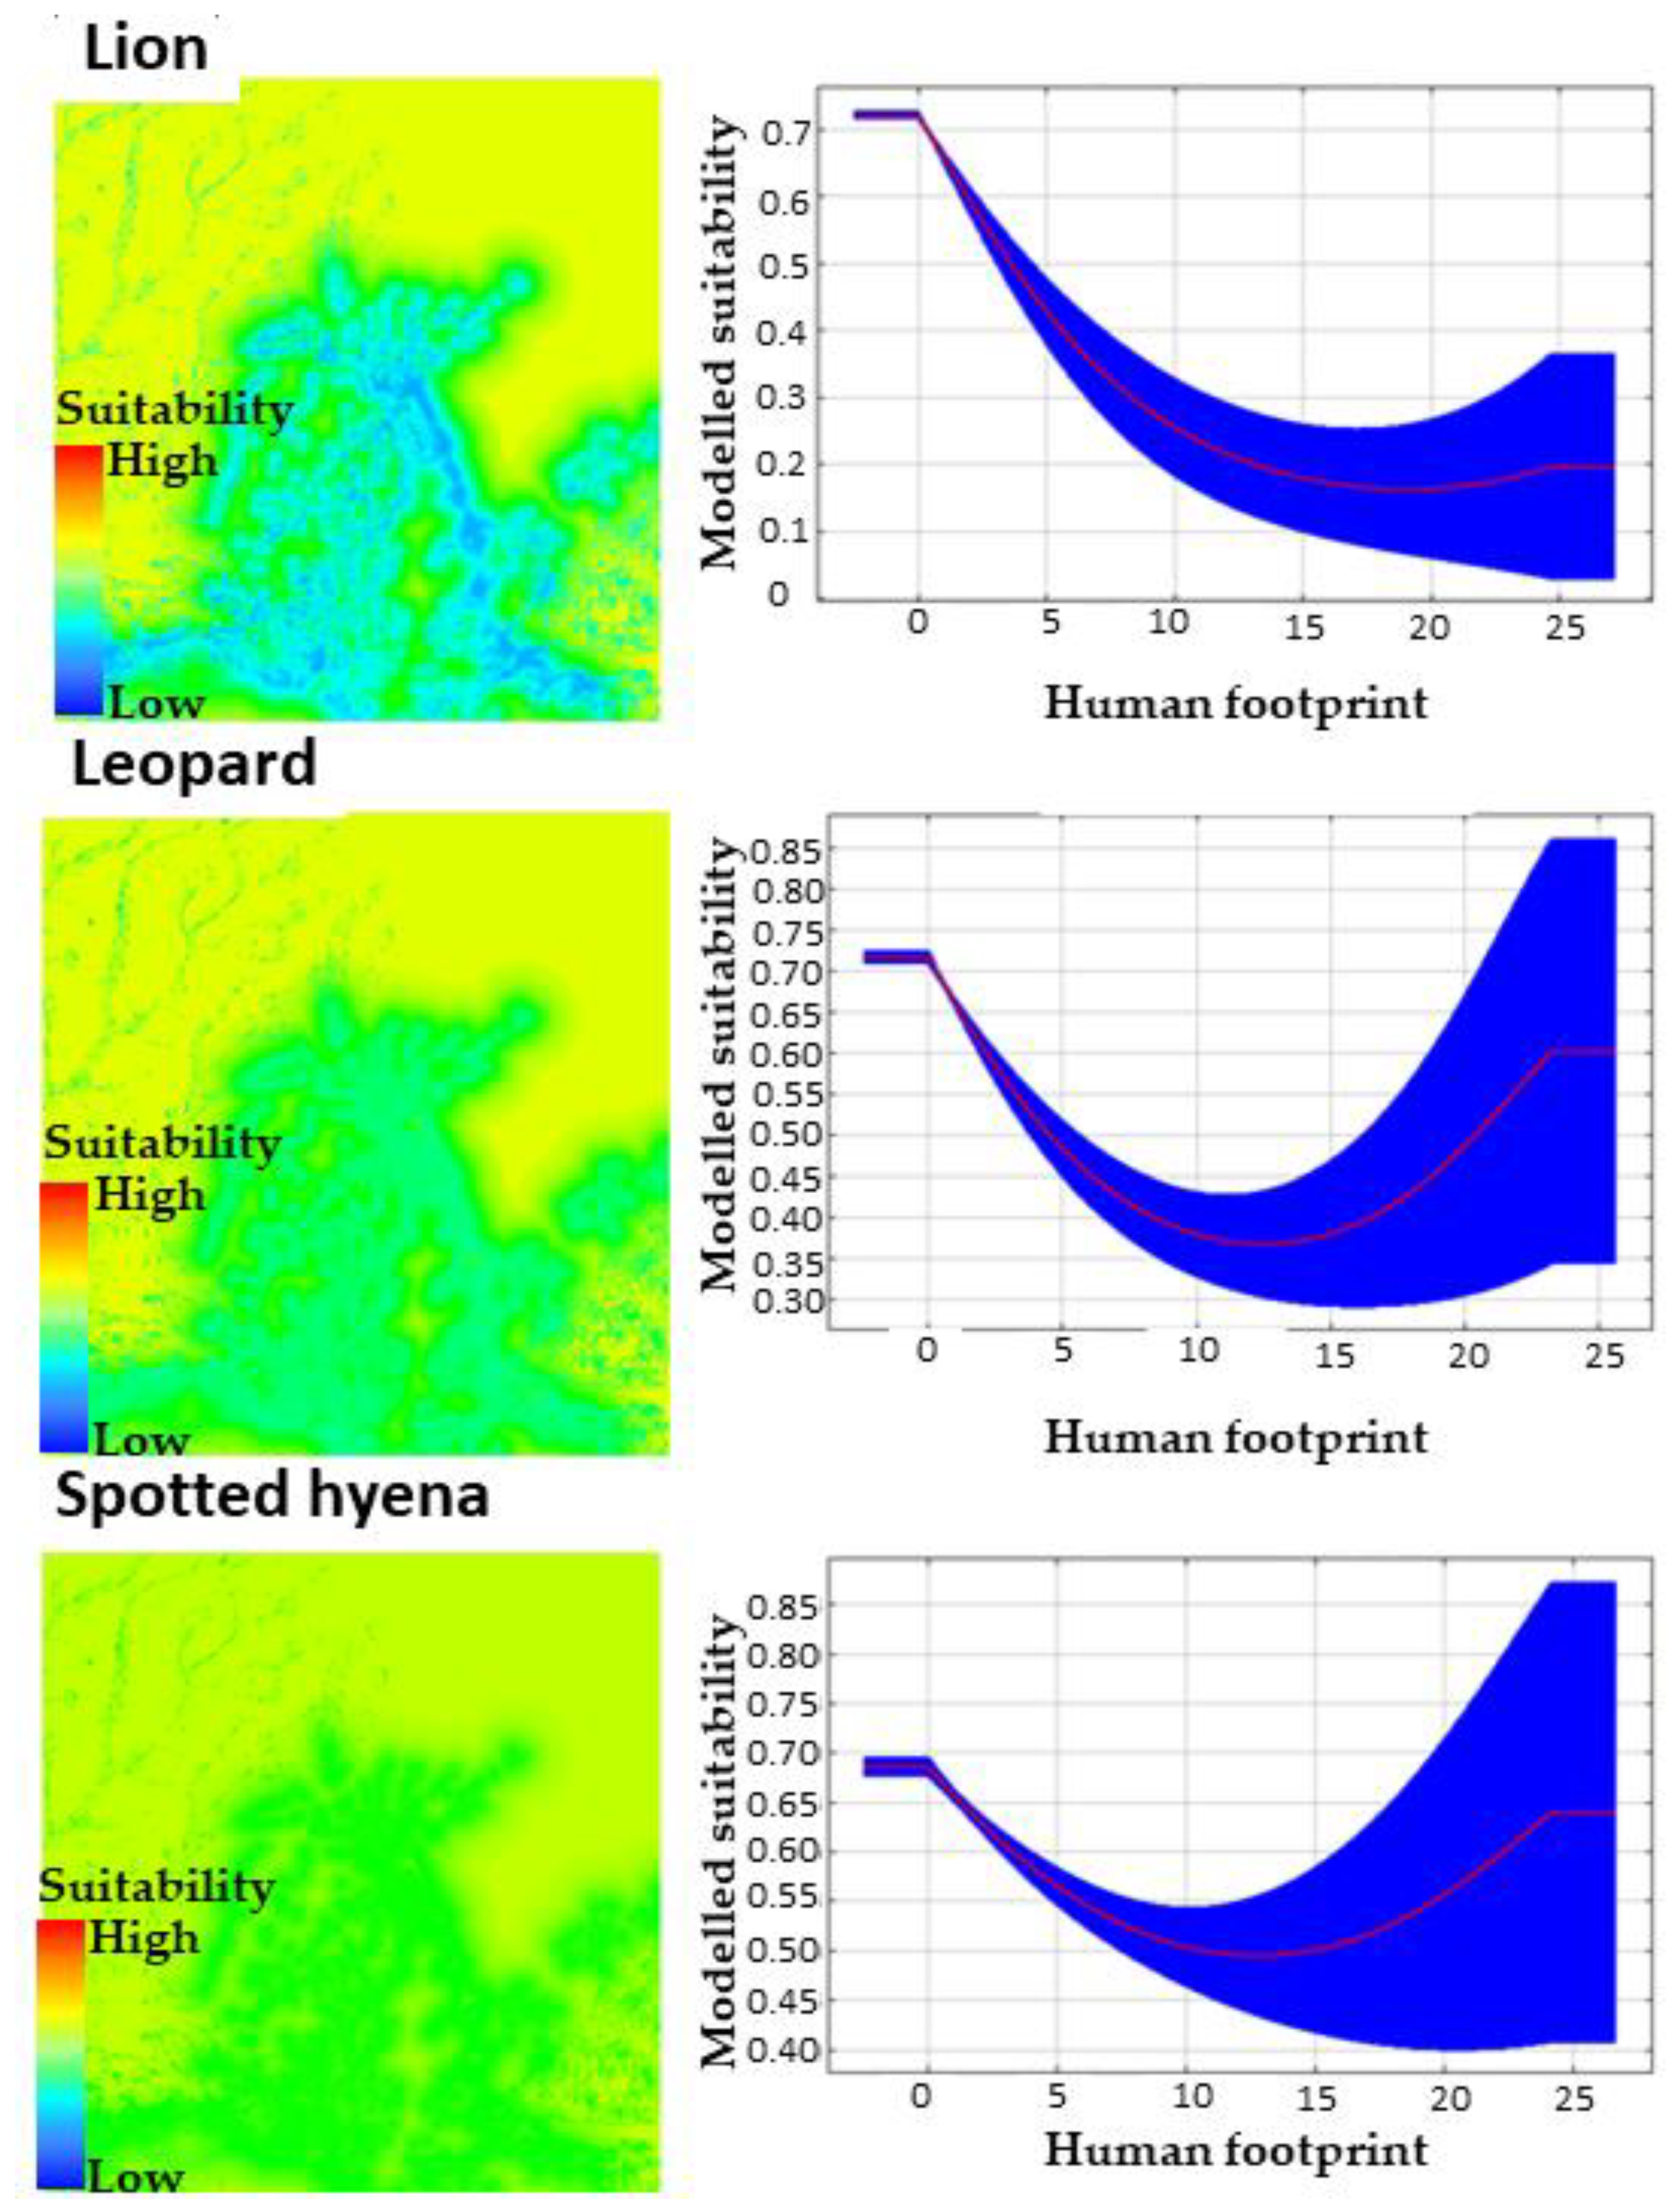
3.1. MaxEnt Habitat Suitability Modelling Outputs

The best performing model was for lion (ROC AUC = 0.72), then leopard (ROC AUC = 0.65), and finally spotted hyena (ROC AUC = 0.61), indicating strong to moderate model performance, considering these are single-variable MaxEnt models. As expected, we found a negative correlation between aggregated human pressure and species occurrence (Figure 3). Human pressure had the clearer impact on lion, then leopard then hyena, as shown by the sharper drop of suitability as the Human Footprint Pressure increases as well as by the thresholds presented in Table 2. Significant unsuitable areas for all species in central-southern areas, and especially along the Zambezi river parallel to the main tar road where settlements and agriculture mainly occur, were identified by the analysis. Another significant linear feature of human pressure affecting all species but predominantly lions followed the railway line and parallel roads, interspersed with settlements and arable land, demonstrating the strong relationship between access infrastructure, settlement and agricultural development driving the human footprint throughout this landscape.
We should note that single-variable models with a limited number of presences are likely to result in models with high uncertainty, especially for species like hyenas or leopards that exhibit behavioral plasticity vis-à-vis the presence of humans. In Figure 3 below, we can see that for the response curves of leopards and hyenas as Human Footprint increases, so does model uncertainty as evidenced by the large difference in habitat suitability for each run. Therefore, the accuracy and predictive ability of the models for levels of human footprint exceeding the point where the response curve minimizes, is very low and does not merit any ecological or behavioral interpretation.
At the wildlife management area scale, Human Footprint Pressure was lowest in Kafue National Park, Mulobezi and western parts of Sichifulo Game Management Areas. Nachitwe and Martin Forest Reserves appear relatively intact with significant pressure on their western boundaries. Machili Forest Reserve is heavily impacted throughout by human pressure. There are still areas within Nyawa communal lands with relatively low human pressure and again to the northeast and eastern sections of Simalaha Conservancy, extending into the adjacent unprotected areas. Extensive pressure exists around the settlement of Bombwe, formerly a registered Forest Reserve. Simalaha Wildlife Recovery Sanctuary, sandwiched between the Zambezi River and main Tar road, is subject to significant human pressure, including settlement and agriculture both within the Sanctuary and on its borders.

3.2. Human Footprint Pressure Thresholds and Species Persistence

The means Human Footprint Pressure at the wildlife managed area scale varied from 1.1 in Kafue National Park to 6.8 in the western section of the Simalaha Sanctuary, with IUCN categorized protected areas experiencing lowest mean Human Footprint Pressure (Table 2). With the exception of Machili Forest (Human Footprint Pressure 5.6) there was a steady increase in Human Footprint Pressure moving south away from Kafue National Park towards the Zambezi River.
The Human Footprint Pressure threshold (Table 2) at which each species occurs in each wildlife management area revealed broadly similar high sensitivities. Lion exhibited highest sensitivity to Human Footprint Pressure with an occurrence threshold between 2.4–3.7, followed by hyena and leopard, with threshold values between 3.7–4.6, mirroring species sensitivity presented by Riggio et al. [31]. An apparent anomaly is Machili Forest Reserve, with extensive settlement, agriculture, and transport infrastructure, having a mean Human Footprint Pressure score of 5.6, and with both leopard and spotted hyena occurring. The proposed supplemental addition to the protected area network identified in Lines et al. [37], Open Area extension 1 (and 2), has a mean Human Footprint Pressure of 3.9, within threshold limits presented here, which indicates that both leopard and spotted hyena could inhabit these protected areas.

4. Discussion

Human Footprint Pressure modelling has traditionally been undertaken at global scales, and typically at low spatial resolution, mainly due to lack of availability of high resolution global datasets [15,55]. There is a constant attempt to overcome resolution constraints which could facilitate improved accuracy and applications for conservation planning [26], including deriving impacts of human pressure at more appropriate site- and species-specific scales where the utility of proxies such as Human Footprint maps might be most valuable as conservation tools [24]. Our study successfully overcomes limitations to existing models by generating and integrating site-specific, multiple high-resolution data sets at two orders of magnitude finer scale, then applying it directly to key questions surrounding the impacts of Human Footprint Pressure on large carnivores throughout a network of wildlife managed areas under varying degrees of Human Footprint Pressure at the Kafue–Zambezi landscape, a key proposed corridor in the KAZA.
Model output performed best for lion, a species exhibiting very high sensitivity to human disturbance [31], which we would expect to capture in multi-variate model analyses. Both leopard and spotted hyena are species known for intrinsic ecological traits and behavioral plasticity. These characteristics facilitate greater coexistence with humans in landscapes with increased human pressure, and our model output for both these species captured this, presenting lower predictive power as expected by such characteristics. Therefore, species and site sensitivity to complex, interrelated human disturbance variables explains why the best performing model output is represented by the species with the highest sensitivity to human pressure, and less so for species with increased tolerance to human pressures.
While there are limits to the predictive power of single variable models, the predictive power of this model would likely benefit from supplemental data layers, when available, notably, interference and exploitative pressures of pastoralism and (legal and illegal) wildlife consumption [56], and synergistic effects between human behaviour and climate change [57]. A multi-variate exploration of the same species in the same landscape using a similar methodology wielded better predictive power, but was significantly more laborious in terms of creating the necessary data layer for analysis. There is also debate over the appropriate scale or extent at which to measure Human Footprint Pressure, whether that be at the population level, proportion of species total range, home range, or other scales [54]. Additionally, there is scope for a greater understanding of site- and species-specific pressure score calibrations, including impacts of formal and informal road linkages [26].
Model response curves and secondary explorative analyses of thresholds at which species are extirpated at the wildlife management area scale closely match global mammalian Human Footprint Pressure extinction thresholds [22], while they are also in accordance with the results presented by Riggio et al. [31] who conducted a sensitivity analysis of African large mammals with high susceptibility to human disturbance. Collectively these data provide compelling evidence that Human Footprint Pressure scores ranging between 2.4 and 4.6 represent a threshold limit for these three species of large carnivores, beyond which they are unlikely to persist in human-dominated landscapes using Venter et al.’s [17] existing pressure score methodology. The persistence of leopard and hyena in Machili Forest, with a mean Human Footprint Pressure score of 5.6, is likely explained by the proximity of this area to extensive lower Human Footprint Pressure areas closer to Kafue National Park, a carnivore guild core habitat with highest level of wildlife management support and protection in the long term. In this regard, Machili Forest could be characterized as a threshold area or an attractive sink (areas of relatively pure habitat quality where species tend to inhabit in cases of rapid environmental change), limiting the range expansion of these species to broader areas with lower Human Footprint Pressure.
The identification of potential additions to the protected area network in Open Areas east of the Simalaha, first suggested by Lines et al. [38], and further posited here, serves a two-fold purpose: (a) the possible increase in wildlife habitat for a range of species and (b) the likely increase in connectivity between Kafue National Park and the Zambezi River for both leopard and spotted hyena in areas of low human habitation and agricultural development, limiting the scope for human–wildlife conflict in the otherwise increasingly human-dominated landscapes at the central-southern extents of the Kafue–Zambezi interface.
These site-specific, high-resolution maps have broad utility as a baseline against which subsequent changes to human footprint pressure can be mapped and modelled over time as more data sets come available to refine this iterative process. Pressure score calibration merits more explicit treatment to improve model response given species and/or processes of interest. The value and applicability of generating standardized approaches to mapping Human Footprint Pressure underlines their use as a proxy or indicator of broader drivers impacting habitat degradation, ecosystem function, species loss, or potential for species recovery. Progress with Human Footprint Pressure modelling depends in part on understanding and addressing limitations and assumptions of model development [58] and recognition of the dynamic nature of human pressure in terms of asymmetrical and nonlinear threshold responses to total footprint pressure changes across spatial-temporal scales [19,59].

5. Conclusions

We have demonstrated that Human Footprint Pressure analyses can be utilized as indicators of habitat suitability for a suit of large carnivores of conservation value, including predicting species persistence, extirpation, and potential for recolonization, even at this preliminary, proof-of-concept stage of model development.
Model output broadly follows existing data in support of understanding human pressure impacts on landscape-level connectivity at the Kafue–Zambezi interface, providing a valuable additional tool in conservation planning for this landscape, the broader KAZA region, and beyond. As additional data layers become available and the pressure score calibration process evolves, site-specific human pressure maps can be expanded to the broader Zambian and KAZA landscape to model how spatiotemporal human pressure impacts species and processes of interest to key conservation and human–wildlife management objectives.

Author Contributions

Conceptualization, R.L., J.T. and D.C.M.; methodology, R.L., D.B., P.X., J.T. and D.C.M.; validation, R.L.; formal analysis, R.L., D.B., P.X. and J.T.; validation, R.L.; investigation, R.L.; data curation, R.L., D.B., P.X. and L.P.; writing—original draft preparation, R.L., D.B., P.X. and J.T.; writing—review and editing, P.X., D.B., R.L. and J.T.; visualization, R.L., D.B. and P.X.; supervision, J.T. All authors have read and agreed to the published version of the manuscript.

Funding

This research was partially funded by: (1) University of Kent 50th Anniversary Scholarship, (2) WWF Namibia, (3) Humane Society International, (4) Westwood.

Institutional Review Board Statement

The study was conducted according to the guidelines of the Declaration of Helsinki, and approved by the Ethics Committee of the School of Anthropology and Conservation, University of Kent. Permission to contact research in Zambia was provided by the Zambia Wildlife Authority.

Informed Consent Statement

Not applicable.

Data Availability Statement

Not applicable.

Acknowledgments

We thank A. Nambota for study development; P. Moss, J. Hanks, and M. Musgrave for insights into Kafue National Park and surrounding Game Management Areas; and the Chilanga, Ngoma, Mulobezi, and Mulanga offices of the Department of Parks and Wildlife Management (formerly the Zambia Wildlife Authority) for permissions and field support. We also thank HRH Chief Inyambo Yeta of the Lozi and the late HRH Chief Moomba of the Nkoya, for granting smooth passage through their Chiefdoms.

Conflicts of Interest

The authors declare no conflict of interest.

References

  1. Vitousek, P.; Mooney, H.; Lubchenco, J.; Melillo, J. Human domination of Earth’s ecosystems. Science 1997, 277, 494–499. [Google Scholar] [CrossRef] [Green Version]
  2. Wackernagel, M.; Schulz, N.B.; Deumling, D.; Linares, C.A.; Jenkins, M.; Kapos, V.; Monfreda, C.; Loh, J.; Myers, N.; Norgaard, R.; et al. Tracking the ecological overshoot of the human economy. Proc. Natl. Acad. Sci. USA 2002, 99, 9266–9271. [Google Scholar] [CrossRef] [PubMed] [Green Version]
  3. Riitters, K.; Wickham, J.; O’Neill, R.; Jones, B.; Smith, E. Global-scale patterns of forest fragmentation. Conserv. Ecol. 2000, 4, 3. Available online: http://www.consecol.org/vol4/iss2/art3/ (accessed on 20 October 2021). [CrossRef]
  4. Foley, J.A.; Defries, R.; Asner, G.P.; Barford, C.; Bonan, G.; Coe, M.T.; Daily, G.C.; Gibbs, H.K.; Carpenter, S.R.; Chapin, F.S.; et al. Global consequences of land use. Science 2005, 333, 301–306. [Google Scholar] [CrossRef] [Green Version]
  5. Tucker, M.A.; Fagan, W.F.; Fryxell, J.M.; Van Bram, M.; Susan, C.A.; Abdullahi, H.A.; Andrew, M.A.; Attias, N.; Tal, A.; Brooks, B.; et al. Moving in the Anthropocene: Global reductions in terrestrial mammalian movements. Science 2018, 359, 466–469. [Google Scholar] [CrossRef] [PubMed] [Green Version]
  6. Maxwell, S.L.; Fuller, R.A.; Brooks, T.M.; Watson, J.E. Biodiversity: The ravages of guns, nets and bulldozers. Nat. News 2016, 546, 143. [Google Scholar] [CrossRef]
  7. Ceballos, G.; Ehrlich, P.R. Mammal population losses and the extinction crisis. Science 2002, 296, 904–907. [Google Scholar] [CrossRef] [Green Version]
  8. Ceballos, G.; Ehrlich, P.R.; Barnosky, A.D.; Garcia, A.; Pringle, R.M.; Palmer, T.M. Accelerated modern human–induced species losses: Entering the sixth mass extinction. Sci. Adv. 2015, 1, e1400253. [Google Scholar] [CrossRef] [Green Version]
  9. Navarro, L.M.; Pereira, H.M. Rewilding abandoned landscapes in Europe. In Rewilding European Landscapes; Springer: Berlin/Heidelberg, Germany, 2015; pp. 3–23. [Google Scholar]
  10. Brooks, T.M.; Mittermeier, R.A.; Fonseca, G.A.; Gerlach, J.; Hoffmann, M.; Lamoreux, J.F.; Mittermeier, C.G.; Pilgrim, J.D.; Rodrigues, A.S. Global biodiversity conservation priorities. Science 2006, 313, 58–61. [Google Scholar] [CrossRef] [PubMed] [Green Version]
  11. Newmark, W.D. Isolation of African protected areas. Front. Ecol. Environ. 2008, 6, 321–328. [Google Scholar] [CrossRef]
  12. Geldmann, J.; Joppa, L.N.; Burgess, N.D. Mapping change in human pressure globally on land and within protected areas. Conserv. Biol. 2014, 28, 1604–1616. [Google Scholar] [CrossRef] [PubMed]
  13. Duffy, R. Global governance and environmental management: The politics of transfrontier conservation areas in Southern Africa. Political Geogr. 2006, 25, 89–112. [Google Scholar] [CrossRef]
  14. Gren, M.; Svensson, T.; Elofsson, K.; Engelmann, M. Economics of wildlife management—An overview. Eur. J. Wildl. Res. 2018, 64, 22. [Google Scholar] [CrossRef] [Green Version]
  15. Sanderson, E.W.; Jaiteh, M.; Levy, M.A.; Redford, K.H.; Wannebo, A.V.; Woolmer, G. The human footprint and the last of the wild: The human footprint is a global map of human influence on the land surface, which suggests that human beings are stewards of nature, whether we like it or not. Bioscience 2002, 52, 891–904. [Google Scholar] [CrossRef]
  16. Walker, B.; Salt, D. Resilience Thinking: Sustaining Ecosystems and People in a Changing World; Island Press: Washington, DC, USA, 2006; 192p, ISBN 978-1-59726-622-2. [Google Scholar]
  17. Venter, O.; Sanderson, E.W.; Magrach, A.; Allan, J.; Beher, J.; Jones, K.R.; Possingham, H.P.; Laurance, W.F.; Wood, P.; Fekete, B.M.; et al. Global terrestrial Human Footprint maps for 1993 and 2009. Sci. Data 2016, 3, 160067. [Google Scholar] [CrossRef] [Green Version]
  18. Ayram, C.A.C.; Mendoza, M.E.; Etter, A.; Salicrup, D.R.P. Anthropogenic impact on habitat connectivity: A multidimensional human footprint index evaluated in a highly biodiverse landscape of Mexico. Ecol. Indic. 2017, 895–909. [Google Scholar] [CrossRef]
  19. Watson, J.E.M.; Shanahan, D.F.; Di Marco, M.; Allan, J.; Laurance, W.F.; Sanderson, E.W.; Mackey, B.; Venter, O. Catastrophic declines in wilderness areas undermine global environment targets. Curr. Biol. 2016, 26, 2929–2934. [Google Scholar] [CrossRef] [Green Version]
  20. Jones, K.R.; Venter, O.; Fuller, R.A.; Allan, J.; Maxwell, S.L.; Negret, P.J.; Watson, J.E. One-third of global protected land is under intense human pressure. Science 2018, 360, 788–791. [Google Scholar] [CrossRef] [Green Version]
  21. Gaynor, K.M.; Hojnowski, C.E.; Brashares, J.S. The influence of human disturbance on wildlife nocturnality. Science 2018, 360, 1232–1235. [Google Scholar] [CrossRef] [PubMed] [Green Version]
  22. Di Marco, M.; Venter, O.; Possingham, H.P.; Watson, J.E. Changes in human footprint drive changes in species extinction risk. Nat. Commun. 2018, 9, 4621. [Google Scholar] [CrossRef]
  23. Di Marco, M.; Santini, L. Human pressures predict species’ geographic range size better than biological traits. Glob. Chang. Biol. 2015, 21, 2169–2178. [Google Scholar] [CrossRef]
  24. Trombulak, S.C.; Baldwin, R.F.; Woolmer, G. The Human Footprint as a Conservation Planning Tool in Landscape-Scale Conservation Planning; Trombulak, S.C., Baldwin, R.F., Eds.; Springer: Dordrecht, The Netherlands, 2010; pp. 281–302. [Google Scholar]
  25. Sutherland, W.J.; Pullin, A.S.; Dolman, P.M.; Knight, T.M. The need for evidence-based conservation. Trends Ecol. Evol. 2004, 19, 305–308. [Google Scholar] [CrossRef]
  26. Woolmer, G.; Trombulak, S.C.; Ray, J.C.; Doran, P.J.; Anderson, M.G.; Baldwin, R.F.; Morgan, A.; Sanderson, E.W. Rescaling the human footprint: A tool for conservation planning at an ecoregional scale. Landsc. Urban Plan. 2008, 87, 42–53. [Google Scholar] [CrossRef]
  27. Cumming, D.H. Constraints to conservation and development success at the wildlife-livestock-human interface in southern African transfrontier conservation areas: A preliminary review. Wildl. Conserv. Soc. 2011. Available online: https://www.povertyandconservation.info/en/biblio/B1785 (accessed on 20 October 2021).
  28. Wittemyer, G.; Elsen, P.; Bean, W.T.; Burton, A.C.; Brashares, J.S. Accelerated human population growth at protected area edges. Science 2008, 321, 123–126. [Google Scholar] [CrossRef] [Green Version]
  29. Ripple, W.J.; Estes, J.A.; Beschta, R.L.; Wilmers, C.C.; Ritchie, E.G.; Hebblewhite, M.; Berger, J.; Elmhagen, B.; Letnic, M.; Nelson, M.P. Status and ecological effects of the world’s largest carnivores. Science 2014, 343, 124–148. [Google Scholar] [CrossRef] [Green Version]
  30. Estes, J.A.; Terborgh, J.; Brashares, J.S.; Power, M.E.; Berger, J.; Bond, W.J.; Carpenter, S.R.; Essington, T.E.; Holt, R.D.; Jackson, B.C.J.; et al. Trophic downgrading of planet Earth. Science 2011, 333, 301–306. [Google Scholar] [CrossRef] [PubMed] [Green Version]
  31. Riggio, J.; Kija, H.; Masenga, E.; Mbwilo, F.; Van de Perre, F.; Caro, T. Sensitivity of Africa’s larger mammals to humans. J. Nat. Conserv. 2018, 43, 136–145. [Google Scholar] [CrossRef]
  32. Funston, P.J.; Groom, R.J.; Lindsey, P.A. Insights into the management of large carnivores for profitable wildlife-based land uses in African savannas. PLoS ONE 2013, 8, e59044. [Google Scholar] [CrossRef]
  33. KAZA. The Kavango-Zambezi Transfrontier Conservation Area Carnivore Conservation Strategy; KAZA: Lusaka, Zambia, 2018. [Google Scholar]
  34. KAZA. Master Integrated Development Plan; KAZA: Lusaka, Zambia, 2014. [Google Scholar]
  35. UNEP-WCMC. United Nations Environment Programmes World Conservation Monitoring Centre. Protected Planet Database. Available online: https://www.protectedplanet.net/ (accessed on 1 May 2015).
  36. Lindsey, P.; Nyirenda, V.; Barnes, J.; Becker, M.S.; McRoob, R. Underperformance of the Zambian protected area network: Steps needed to improve functionality and effectiveness. PLoS ONE 2014, 9, e94109. [Google Scholar]
  37. Lines, R.; Bormpoudakis, D.; Xofis, P.; Tzanopoulos, J. Modelling multi-species connectivity at the Kafue-Zambezi Interface: Implications for Transboundary Carnivore Conservation. Sustainability 2021, 13, 12886. [Google Scholar] [CrossRef]
  38. Lines, R.; Tzanopoulos, J.; MacMillan, D. Status of terrestrial mammals at the Kafue–Zambezi interface: Implications for transboundary connectivity. Oryx 2018, 53, 764–773. [Google Scholar] [CrossRef]
  39. KAZA. Treaty Between the Governments of Angola, Botswana, Namibia, Zambia and Zimbabwe on the Establishment of the Kavango-Zambezi Transfrontier Conservation Area. J. Environ. Dev. 2008, 17, 99–117. [Google Scholar]
  40. CSO. Central Statistics Office of Zambia. Available online: http://www.zamstats.gov.zm/ (accessed on 23 September 2019).
  41. Calvert, G.M. Sitimela: A History of the Zambesi Sawmills Logging Railway, 1911–1972; Barotse Development Trust: Mongu, Zambia, 2005. [Google Scholar]
  42. Rees, W.; Wackernagel, M. Our Ecological Footprint: Reducing Human Impact on the Earth; New Society Publishers: Gabriola Island, BC, Canada, 1996. [Google Scholar]
  43. Bonafilia, D.; Gill, J.; Basu, S.; Yang, D. Building High Resolution Maps for Humanitarian Aid and Development with Weakly-and Semi-Supervised Learning. In Proceedings of the IEEE Conference on Computer Vision and Pattern Recognition, CVPR Workshops 2019, Long Beach, CA, USA, 16–20 June 2019; pp. 1–9. [Google Scholar]
  44. NOAA. National Oceanic and Atmospheric Administration. National Geophysical Data Center. DMSP Data Collected by US Air Force Weather Agency; NOAA: Washington, DC, USA, 2019.
  45. Woodroffe, R.; Ginsberg, J.R. Edge Effects and the Extinction of Populations Inside Protected Areas. Science 1998, 280, 2126–2128. [Google Scholar] [CrossRef] [PubMed] [Green Version]
  46. Musgrave, M. Scale, Governance and Change in Zambezi Teak Forests: Sustainable Development for Commodity and Community; Cambridge Scholars Publishing: Newcastle upon Tyne, UK, 2016. [Google Scholar]
  47. Rich, C.; Longcore, T. Ecological Consequences of Artificial Night Lighting; Island Press: Washington, DC, USA, 2013. [Google Scholar]
  48. Phillips, S.J.; Dudík, M. Modelling of species distributions with Maxent: New extensions and a comprehensive evaluation. Ecography 2008, 31, 161–175. [Google Scholar] [CrossRef]
  49. Elith, J.; Phillips, S.J.; Hastie, T.; Dudík, M.; Chee, Y.E.; Yates, C.J. A statistical explanation of MaxEnt for ecologists. Divers. Distrib. 2011, 17, 43–57. [Google Scholar] [CrossRef]
  50. Jackson, C.R.; Marnewick, K.; Lindsey, P.; Røskaft, E.; Robertson, M.P. Evaluating habitat connectivity methodologies: A case study with endangered African wild dogs in South Africa. Landsc. Ecol. 2016, 312, 1433–1447. [Google Scholar] [CrossRef]
  51. Di Minin, E.; Macmillan, D.C.; Goodman, P.S.; Escott, B.; Slotow, R.; Moilanen, A. Conservation businesses and conservation planning in a biological diversity hotspot. Conserv. Biol. 2013, 27, 808–820. [Google Scholar] [CrossRef] [Green Version]
  52. Ahmadi, M.; Nezami Balouchi, B.; Jowkar, H.; Hemami, M.; Fadakar, D.; Malakouti-Khah, S.; Ostrowski, S. Combining landscape suitability and habitat connectivity to conserve the last surviving population of cheetah in Asia. Divers. Distrib. 2017, 23, 592–603. [Google Scholar] [CrossRef] [Green Version]
  53. Angelieri, C.C.S.; Adams-Hosking, C.; de Barros Ferraz, K.M.P.M.; de Souza, M.P.; McAlpine, C.A. Using species distribution models to predict potential landscape restoration effects on puma conservation. PLoS ONE 2016, 11, e0145232. [Google Scholar]
  54. Di Marco, M.; Rondinini, C.; Boitani, L.; Murray, K. Comparing multiple species distribution proxies and different quantifications of the human footprint map, implications for conservation. Biol. Conserv. 2013, 165, 203–211. [Google Scholar] [CrossRef]
  55. Leu, M.; Hanser, S.E.; Knick, S.T. The human footprint in the west: A large-scale analysis of anthropogenic impacts. Ecol. Appl. 2008, 18, 1119–1139. [Google Scholar] [CrossRef]
  56. Everatt, K.T.; Moore, J.; Kerley, G.I. Africa’s apex predator, the lion, is limited by interference and exploitive competition with humans. Glob. Ecol. Conserv. 2019, 20, e00758. [Google Scholar] [CrossRef]
  57. Brodie, J.F. Synergistic effects of climate change and agricultural land use on mammals. Front. Ecol. Environ. 2016, 14, 20–26. [Google Scholar] [CrossRef]
  58. Halpern, B.S.; Fujita, R. Assumptions, challenges, and future directions in cumulative impact analysis. Ecosphere 2013, 4, 1–11. [Google Scholar] [CrossRef]
  59. Toews, M. Managing Human Footprint with Respect to its Effects on Large Mammals: Implications of Spatial Scale, Divergent Responses and Ecological Thresholds; University of Victoria: Victoria, BC, Canada, 2016. [Google Scholar]
Figure 1. The Kavango-Zambezi Transfrontier Conservation Area landscape, indicating study area, clusters of wildlife managed areas (WMAs) and their degrees of protection. Protected = National Parks; IUCN II; Partially Protected = IUCN III-VI; Nominally Protected = IUCN Not Reported (adapted from [39]).
Sustainability 14 00116 g001
Figure 2. Human Footprint Pressure, Kafue–Zambezi Interface, 10 m resolution.
Sustainability 14 00116 g002
Figure 3. A visual presentation of the results of the human footprint habitat suitability model. Left: habitat suitability maps of the three species; colors on the map indicate habitat suitability, going from blue (low suitability) to green (medium suitability) to orange (high suitability). Right: the response curves between habitat suitability and human footprint scores for each species; the red line indicates the mean of the 50 runs for each model, and the blue surface the deviation from the mean.
Sustainability 14 00116 g003
Table 1. Human Pressure Variables and Scoring used in the current study.
VariablePressure ScoreSourceSpatial
Resolution
Details
Settlement0, 10[43]30 mAll settled areas mapped given score of 10
Population Density0–10 Continuous[43]30 mPressure score = 3.333 × log (population density + 1)
Roads8 Direct impacts
0–4 Indirect impacts
PPF10 mDirect pressure score of 8 for 500 m either side of road, exponentially decaying out to 4 at 15 km
Railways0–8PPF10 mDirect pressure score of 8 for 500 m either side
Navigable Water0–4PPF10 mPressure score of 4 exponentially decaying out to 15 km
Arable0, 7[37]10 mAll areas mapped as crops given score of 7
Night Lights/NTL0–9[44]100 mPressure score = 3.333 × log (NTL + 1)
Table 2. Mean Human Footprint Pressures within Wildlife Managed Areas against Species Occurrence.
AreaIUCNArea HaMean
HFP
Occurrence
LeopardLionHyena
Kafue National ParkII206,3141.1YesYesYes
Mulobezi GMAVI347,4811.2YesYesYes
Sichifulo GMAVI133,7342.2YesYesYes
Nachitwe Forest Reserveunreported71,0752.3YesYesYes
Martin Forest Reserveunreported62,9482.4YesYesYes
Nyawa Westunreported57,4393.7YesNoYes
Simalaha Conservancyunreported181,9364.6NoNoNo
Open Area extension 1 *unreported32,7123.9YesNoYes
Open Area extension 1 + 2 *unreported73,6603.9YesNoYes
Nyawa Eastunreported39,5654.6NoNoNo
Machili Forest Reserveunreported49,2695.6YesNoYes
Simalaha Sanctuary Eunreported11,0205.8NoNoNo
Simalaha Sanctuary Wunreported11,2826.8NoNoNo
* Proposed extensions to protected area network within HFP thresholds limits for selected species.
Publisher’s Note: MDPI stays neutral with regard to jurisdictional claims in published maps and institutional affiliations.

