1. Introduction
Urban expansion is a complex and dynamic process that comprises built-up land, extends to the suburbs [
1] and transforms non-urban land into urban land. It can occur through considerably distinctive forms, including the redevelopment of built-up areas with higher densities or infilling urban and suburban areas [
2,
3]. From the standpoint of sustainability, urban expansion results from unplanned changes in LULC. While it causes economic growth, agglomeration and increases property prices [
4], urban expansion brings conversions in the landscape [
5,
6,
7], shifts agricultural land and increases trips between the city and its periphery [
6]. Hence, it plays a significant role in reshaping LULC. A dynamic LULC transition explicitly highlights the mutual interaction between people and the environment [
8]. Therefore, temporal and spatial detection and precise information about LULC changes, human–environment interactions, and the factors affecting urban expansion are crucial for decision makers [
9] to manage and build cities that are sustainable over time. With the objective of sustainable urban expansion, some conceptual frameworks have been developed including policies on land conversion and establishing protected agricultural zones [
10], equitable land development [
11], compact forms, and infilling urban expansion patterns [
12], as well as mitigation resources and energy consumption by sustainable transportation solutions [
4,
13].
It is worth pointing out that suburbanization in eastern European countries after the collapse of the Soviet Union mainly decentralized people and urban functions from the center to the suburbs [
14]; therefore, urban expansion in Estonia and some neighboring countries is a quite different process from that of most cities worldwide due to its geopolitical context [
15]. Altering the urban development regulation laws [
16] and land reforms [
17] transformed Estonia’s urban expansion process, which mainly occurred after regaining independence in 1991. In this regard, Estonia experienced urbanization followed by the dialectics of macro-level socioeconomic changes, while these changes played a significant role in the self-identification of Estonia [
18]. To choose a personal style of living, many wealthy people moved to suburban land around the main cities, settling in detached houses [
6], whilst some families bought summer houses as family farms and, subsequently, scattering patterns of urban expansion around main cities such as Tallinn and Tartu started. Hence, after three decades of these changes, the large number of shifts from agricultural and forest land to urban ones in an unplanned manner have become of great concern.
As the effects of urban expansion tend to grow [
19], a better understanding of the mechanism of LULC change and the driving forces for such transformations [
20] is necessary for the protection of the landscape [
21] and sustainable urban expansion policy-making in Estonia. Many different factors govern urban expansion. Much research has focused on some causative factors of urban expansion. Physical and proximity factors [
22,
23,
24,
25] play a significant role in explaining the spatial complexity of this phenomenon. To specify the research scope, an overview of the driving factors employed in this research is necessary.
Distances from nearby cities, core or central business districts (CBDs), and existing residential areas demonstrated the likelihood of urban expansion concerning these locations and have been explored in much research [
16,
17,
18]. These drivers are also associated with accessibility and commercial uses [
26]. In this study, we observed that small settlements emerged in the satellite structures of the main cities of Tallinn and Tartu; thus, their proximity to the nearest city or town was deemed necessary to investigate.
Most research exploring urban expansion considers the distance from main roads [
6,
26,
27,
28,
29]. Roads are accessibility factors that connect urban centers to periphery areas and affect the scattering of new construction around cities [
30]. Proximity to green urban areas, agricultural and forest land within and surrounding the cities is also an essential driving factor of urban expansion to be considered. On the one hand, increasing demand for the conservation of urban green spaces, and on the other hand, the ease of encroachment for construction purposes and the modification of agricultural and forest land [
20,
31,
32,
33] both impact their sustainability. Much research has explored the distance from these areas [
29,
34,
35,
36] and investigated their shifts and conversions over time in relation to population growth and the urbanization process [
37].
Distance from industrial or commercial units also ranks among the most crucial drivers of urban expansion [
38]. Some people who seek job opportunities in the industry section migrate to the suburbs and take advantage of accessibility to roads whilst contributing to LULC changes [
26,
39].
Since LULC change is a paramount effect of urban expansion [
40] in Estonia in recent years [
6], proximity analysis was conducted to agricultural land, forest land, water areas and wetlands to investigate these effects on each class separately. Proximity to water areas has been analyzed in much research as it is a critical driver of urban expansion [
41,
42,
43,
44]. Besides their visual qualities, water areas are attractive locations for housing development [
17].
As urban expansion causes degradation of wetlands [
45,
46], the research considering the distance from wetlands investigated these relationships [
31,
47,
48]. Likewise, it is necessary to examine the effects of distance from the airport due to the negative impacts of its noise and emissions on residential areas [
49]. The accessibility to sport and leisure facilities is a residential preference for settlement selection [
50]; therefore, the distance from sport and leisure facilities was chosen as a driving force in this research.
Moreover, proximity analysis in urban expansion modeling determines the extensive influence of new expansions near the existing areas [
14]. Incorporating these factors with urban expansion modeling provides valuable insight into protection and development in spatial planning for local governments as policy-makers [
51]. To this end, this paper addresses the influences of 12 proximity factors on urban expansion using LR and MLP neural network models to investigate three decades of LULC changes and urban expansion in two Estonian counties.
Numerous models have been implemented to assess the impacts of the driving factors on urban expansion. Among others, the LR model with the capability of location prediction [
23] is one of the most popular modeling approaches and provides a valuable understanding of drivers, their weights, and effects on urban expansion [
51]. Luo et al. [
52] employed modified LR to analyze 12 drivers of urban expansion, focusing on policy-oriented factors in Wuhan City, Central China. Traore and Watanabe [
51] used two categories of drivers, including five socioeconomic proximity variables and two landscape topography variables. Their results indicated the high probability of urban expansion in high-elevation areas and near main roads. A total of 12 causative factors of urban expansion in Belgium were explored in research by Mustafa et al. [
53]. These factors consist of topographic, socioeconomic, and proximity variables. Their findings showed that the LULC policy, slope, and distance to roads are the most significant deterministic of urban expansion in this study area. In addition, Jafari et al. [
54] simulated the deterministic urban expansion in Gilan Province, Iran, by using 12 independent variables consisting of the different LULCs and proximity variables. Their findings represented new developments near existing urban infrastructures, roads, and commercial areas. Nong and Du [
55] used six variables, including slope, population density, gross-industrial/agricultural output values, proximity to the economic center, and roads, to investigate the relationship between urban growth and driving forces in Jiayu County, China. Their results indicated the tendency of new expansions near roads and high population density areas.
Further, the MLP model explores the effects of variables through a backward stepwise constant forcing equation [
56]. The crucial concept is learning and producing knowledge from the neurons [
57]. Consequently, it is a model approach applied in recent research [
56,
57,
58,
59,
60,
61,
62,
63,
64], determining the influence of variables on LULC change and urban expansion. In research by Losiri et al. [
63], the authors modeled urban expansion in the Bangkok metropolitan area for 2035 employing the MLP model and using proximity factors of LULC and socioeconomic variables. Saadani et al. [
61] applied the MLP model to simulate the spatiotemporal urban expansion in Moroccan metropolitan, exploring the influence of topography and proximity driving factors. Moreover, a comparison of spatial modeling approaches by Mondal et al. [
62] showed the good performance of the MLP model in representing the urban expansion employing five proximity and LULC likelihood factors.
Accordingly, the implementation of LR and MLP models in this study leads to better determining and investigating the causative factors of urban expansion with their weights of influence. At the same time, this research presents the prediction power of these models in urban expansion in two Estonian counties.
The CORINE (Coordination of Information on the Environment) Land Cover dataset was used in this study. The CORINE Land Cover dataset is the most essential and integrated land monitoring dataset for Europe prepared by the European Commission [
65]. It is the central database for spatial–temporal analysis of urban expansion on different territorial levels, from cities at the regional level to the European continent level. Cieślak et al. [
66] used the CORINE Land Cover database to monitor urbanization processes and urban sprawl in Polish cities. Garcia-López [
67] studied highway effects on the expansion of 579 European cities in 1990, 2000, and 2012 using CORINE Land Cover. Grigorescu et al. [
68] represented a LULC change simulation in Romania using the CORINE Land Cover database. Moreover, Mozaffaree Pour and Oja [
69] examined the urban expansion and built-up densities in Estonia using the CORINE Land Cover dataset and one other database. Using CORINE Land Cover, Cole et al. [
65] monitored the land cover transition in the United Kingdom for 2012 and depicted their changes from 2006 to 2012. Besides, Oueslati et al. [
70] adopted a heuristic approach to measuring the urban sprawl in the level of cities based on the CORINE Land Cover dataset for 1990, 2000, and 2006 for 282 European cities.
It is noticeable that crucial steps in this research include analyzing the dynamic changes in LULC and the spatial surface trends in two main counties in Estonia over 28 years, visualizing the LULC maps in five timestamps using the CORINE Land Cover dataset, exploring drivers of urban expansion employing prediction power of the LR and MLP models, and sustainable urban expansion. Consequently, this paper has two aims. One is methodological, to study the suitability of the LR and MLP models and dataset implied; the other is practical, to analyze the changes in LULC as related to urban expansion.
3. Results
3.1. LULC Dynamics Model Analysis
LULC changes in Harju and Tartu counties during the study period are presented in
Figure 6 and
Figure 7, with the statistics summarized in
Table 2. Some significant trends were evident in the transitions of LULC over the approximate 28 years. From
Table 2, it is evident that enormous shifts from 1990 to 2018 in Harju County were associated with urban land, with a 33.96% increase and an increase of 8.94% in the wetland area. The significant trends evident in Tartu County were related to the transformations in the suburban areas surrounding Tartu, which experienced moderate increases of about 19.50%. The most significant decrease was related to agricultural land, which showed a 5.95% decline in Harju County and a 2.31% decline in Tartu County.
In 1990, of 432,612 ha of Harju County land, 129,773 ha were agricultural, representing 30.00% of all LULC. There was a 1.78% loss in agricultural land by 2018. This trend was similar in Tartu County, with the decline of agricultural land from 149,645 ha in 1990 to 146,192 ha in 2018 corresponding to a 2.31% fall. Forest land of 260,771 ha covered 60.28% of Harju County. There was a decrease in forest land from 260,771 ha to 259,786 ha between 1990 and 2006, an increase to 260,478 ha in 2012, and then a fall to 259,281 ha in 2018, with a 0.57% decrease during the study period.
Forest land in Tartu County decreased from 155,319 ha to 155,140 ha between 1990 and 2006 and increased to 156,798 ha in 2018, a 0.95% increase during the whole period. Conversely, the most notable increase was urban land, which reached 30,548 ha (7.06% of Harju County land) from 22,804 ha (5.27% of all land in the county), corresponding to a 33.96% increase. Similarly, urban land in Tartu County has increased by 19.50%, rising from 2.09% in 1990 to 2.49% in 2018.
There was a low rise of 2.44% in water area from 4052 to 4151 ha in Harju County and a slight rise of 1.88% from 4303 to 4384 ha in Tartu County. There was also a slight increase in wetlands from 15,213 to 16,573 ha in Harju County (8.94% increase) during the study period, while Tartu County’s wetlands increased by 2.84%.
Table 3 shows the area of LULC in the study period in 1990 (columns) against LULC in 2018 (rows), while a map containing different combinations of “from-to” change classes is presented in
Figure 8. In Harju County, the significant transformation was related to agricultural land; out of the 129,773 ha in 1990, 6836 ha was converted to urban land, with 118,614 ha still agricultural area by 2018. In comparison, 568 ha of urban land, 2856 ha of forest, 21 ha of wetlands, and 1 ha of water were converted to agricultural land by 2018. This trend is also the most notable shift in Tartu County. From 149,645 ha of agricultural land in 1990, 4034 ha were converted to forest and 1638 ha to urban land by 2018. In contrast, 1770 ha of forest land, 440 ha urban land, and 10 ha of wetlands were converted to agriculture by 2018. In Harju County, of 22,804 ha of land that was urban in 1990, 20,930 ha remained urban in 2018.
For other conversions, it could be mentioned that 2680 ha of forest, 89 ha of water areas and 12 ha of wetlands in 1990 were under construction by 2018 in Harju County. The conversion of land to urban by 2018 in Tartu County was related to 1638 ha of agricultural land and 222 ha of forest land. While 440 ha of urban area in 1990 were converted to agricultural and 58 ha to the forest, out of 6984 ha of urban land in 1990, 6486 ha were still urban in 2018.
The decline in Harju County forest land in 2018 was related to the conversion of 2680 ha to urban land and 2856 ha to agricultural land. At the same time, 253,161 ha were still forest in 2018. Meanwhile, out of 259,281 ha of forest in 2018, 4251 ha had been agricultural land, 1178 ha urban land, 668 ha wetlands, and 24 ha water areas in 1990. In Tartu County, 1770 ha of forest land in 1990 were converted to agricultural land, 692 ha to wetlands, 222 ha to urban land, and 49 ha to water areas. By 2018, 4034 ha of agricultural land, 120 ha of wetlands, and 58 ha of urban land had been transformed into forest.
The wetlands in Harju County covered 15,213 ha in 1990, with 668 ha converted to forest, 21 ha to agricultural land, 12 ha to the urban area, and 8 ha to water, meaning 14,504 ha had remained wetlands by 2018. However, 1963 ha of the forest, 70 ha of agricultural, and 37 ha of water land had transited to wetlands by 2018. In Tartu County, most of the wetlands’ shifts were related to the forest (120 ha), 34 ha to water, and 10 ha to agricultural land. In contrast, 692 ha of forest and 2 ha of water were added to wetlands by 2018.
Less transition was related to the water class. Out of 4052 ha of water in 1990, 3900 ha was still water in 2018; 89 ha had changed to urban, 37 ha to wetlands, 24 ha to forest, and 1 ha to agricultural land in Harju County, with just 2 ha to wetlands in Tartu County.
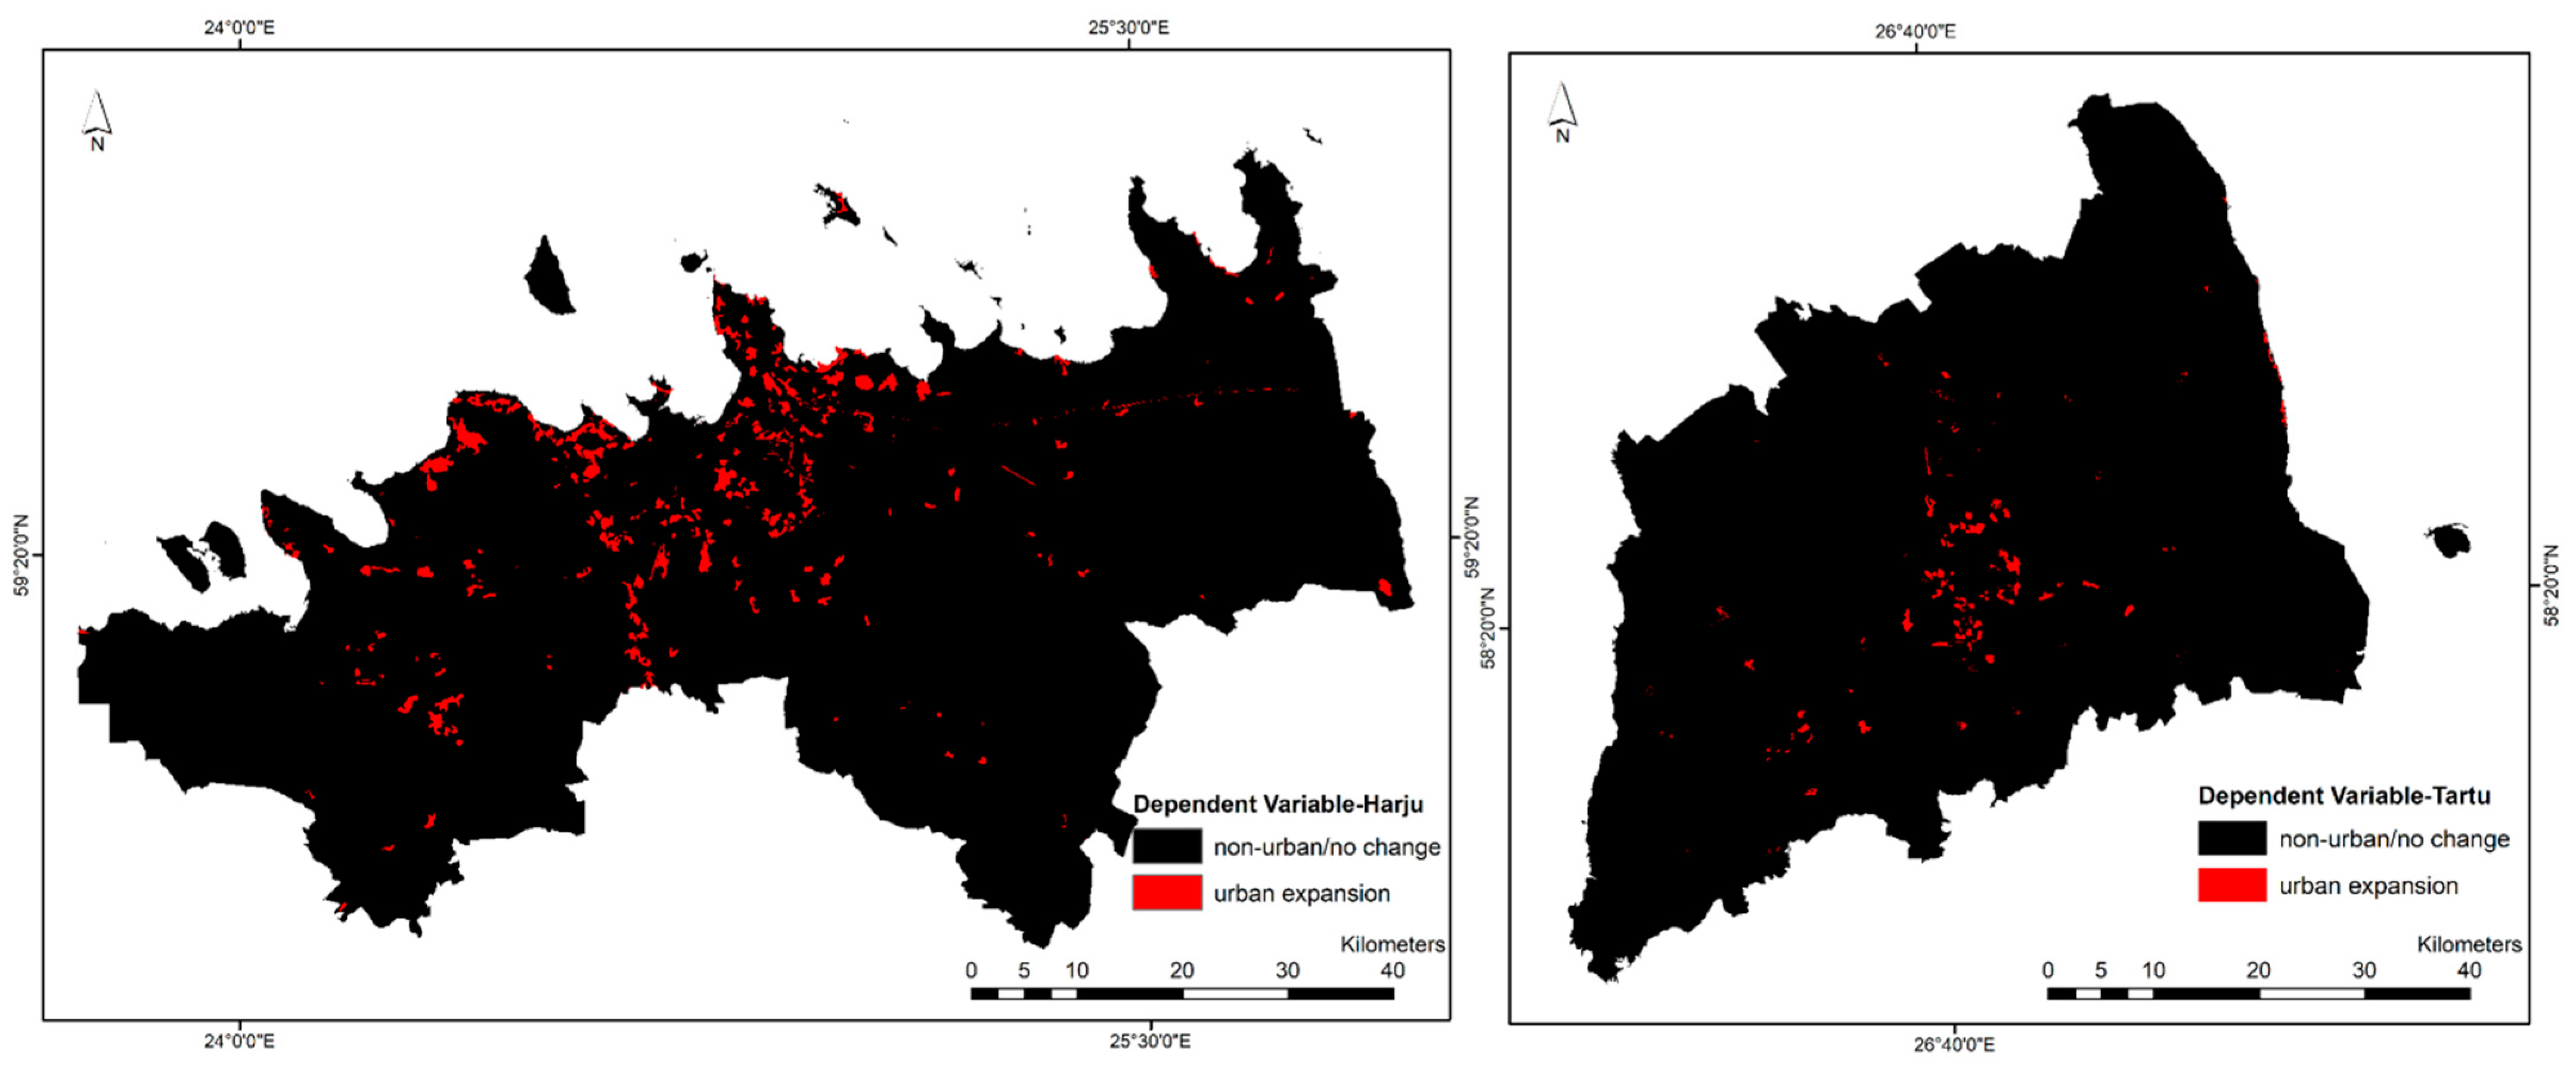
From
Figure 9, it is notable that the transition to urban land in Harju County was primarily concentrated to the west and in Tartu County to the southwest of the image. To investigate the spatial trends of the surface, urban expansion from 1990 to 2018 based on the dynamic LULC being shifted to urban areas was put into action.
3.2. LR Model Results
The LR analysis results are presented in
Table 4. The coefficient values define the importance and the degree of relationship between dependent and independent variables as drivers of urban expansion. The sign of the coefficient (±) indicates a positive or negative correlation to the response of the dependent variable [
76]. The values with positive coefficients indicate positive impacts, while negative values determine negative impacts [
81].
From the results of the LR, it can be explained that the distance factors from near cities (X1), the core of main cities of Tallinn and Tartu (X2), sport and leisure facilities (X6), main roads (X7), forest land (X9), and water land (X11) in both counties had a negative correlation with urban expansion. This means that where the distance from these variables increases, the urban expansion decreases. In other words, the greater the distance from these factors, the tendency for urban expansion decreases.
A 10% sampling rate was applied based on stratified random sampling to reduce the impact of spatial dependency between observations, namely spatial autocorrelation [
19].
Model validation was calculated with ROC (Relative Operating Characteristic Curve) values presented in
Figure 10, comparing the predicted map of urban expansion for 2018 with the actual map of 2018. Its range is between 0 and 1 [
29,
51], with a higher value indicating a better fit of the model. As observed from
Table 4, the ROC values for Harju County and Tartu County were 0.95 and 0.97, respectively, indicating that LR models were a good fit. Another indicator of fitting the model for LR results is the Pseudo R
2 parameter. While a perfect fit is 1, 0 indicates no relationship. It is assumed by Saeedi Razavi et al. [
77] that a Pseudo R
2 larger than 0.2 is a relatively good fit. This parameter was 0.36 for Harju County and 0.43 for Tartu County, indicating a good fit for the LR model. The results showed that using these variables provides prediction values of 37% in Harju County and 45% in Tartu County.
The LR prediction maps verified where urban expansion occurred in 2018 when the coefficients of proximity factors were employed in the study area. Additionally, the overlay was conducted to visualize the predicted maps with the actual urban expansion maps of 2018 in both counties.
3.3. MLP Neural Network Model Results
Running the process of MLP in IDRISI, the outputs provided a detailed statistical analysis and a predicted map based on the strength of the independent variables.
Table 5 presents the statistical information for both counties in two categories, including (1) model sensitivity when a single variable is constant. After training the whole variables to check the strength of independent variables, it holds the input values of a selected variable constant to remove its variability. (2) Except one variable, all variables are held constant. It shows complementary information about the existence of intercorrelation between independent variables. The results will prepare the most and least influential driving forces [
76].
In the case of Harju County, the most influential independent variable was “distance from existing residential areas (X10)” and the least influential was “distance from sports and leisure facilities (X6)”. The variables “distance from the core of Tallinn (X2)”, “distance from green urban areas (X3)”, and “distance from main roads (X7)” were the most influential among the other variables in Harju County.
The most influential driving force in Tartu County was “distance from the core of Tartu (X2)” and the least influential was “distance from the airport (X5)”.
The results showed that “distance from existing residential areas (X10)” in Harju County (R2 value of 0.0067) and “distance from the core of Tartu (X2)” in Tartu County (R2 value of 0.0018) had more strength than the other variables.
Another essential part of the MLP model was the “backward stepwise constant forcing” analysis results, which are shown in
Table 6. This step of the MLP process keeps every variable constant, in turn, to distinguish which other variables have a minor effect on the model. This trend will remain constant for every probable pair of variables and check the least effective ones in the process until only one variable is left. It is a practical algorithm to remove the powerless variables and reduce the likelihood of overfitting [
75].
The process of backward stepwise constant forcing also confirmed that the independent variable “distance from sport and leisure facilities (X6)” was powerless in Harju County, while the most substantial variable was “distance from existing residential areas (X10)”. In Tartu County, the least powerful variable was “distance from the airport (X5)” and the most important one was “distance from the core of Tartu (X2).”
The predicted map of the MLP model is shown in
Figure 11. It verified nearly 80% of the prediction based on the defined variables for Harju County and approximately 50% for Tartu County, where urban expansion happened in 2018. Additionally, the overlay of urban areas in 2018 was conducted to visualize the predicted urban expansion with the actual maps in both counties.
4. Discussion
4.1. LULC Changes for 28 Years in the Study Area
From the standpoint of urban expansion, LULC change has a substantial effect. A fundamental core for urban expansion research is the quantitative characterization of its dynamic LULC changes. This study provided evidence that “urban” land was the most dynamic class and “forest” was the least dynamic LULC in both counties. As the forest was the largest LULC unit, perceptual change cannot be high. In terms of change analysis, the results demonstrated two things. First, urban areas have increased by almost 33.96% in Harju County and 19.50% in Tartu County. Second, there was a significant loss of agricultural land from 2006 to 2012. About 6836 ha of agricultural land in 1990 were converted to urban by 2018 in Harju County and 1638 ha in Tartu County. It should be noted that agricultural land was an essential resource in the Soviet era and could not be used for residential development. So, from the late 1990s, these areas became especially attractive plots for housing development [
30].
The spatial surface trends showed that the change to urban land in Harju County was primarily concentrated in the west and the spatial trends of change to urban in Tartu County were to the southwest of the image.
4.2. LR Model and Impacts of Proximity Factors on Urban Expansion
Using LR to analyze the urban expansion, it was claimed that urban expansion is affected by the 12 driving forces, including “distance from near cities (X1)”, “distance from the core of main cities of Tallinn and Tartu (X2)”, “distance from the green urban areas (X3)”, “distance from industrial or commercial units (X4)”, “distance from airports (X5)”, “distance from sport and leisure facilities (X6)”, “distance from main roads (X7)”, “distance from agriculture land (X8)”, “distance from forest land (X9)”, “distance from existing residential areas (X10)”, “distance from water land (X11)”, and “distance from wetlands (X12)”.
The LR model determined that distance from main roads (X7) had a very high impact on urban expansion in Harju County with a lower coefficient in Tartu County, meaning that urban expansion is more likely to occur close to the main roads. Sarkar and Chouhan [
29] assessed the distance from roads as an influential factor of urban settlements scattering. Our finding is broadly in line with the argument made by Reimets et al. [
30], who mentioned that the distance from the main cities in Estonia appeared to be a less important factor than the distance from the main roads. Roads make it possible to commute between work and home easily.
The distance from near cities (X1) had a negative impact on urban expansion in both counties. Sarkar and Chouhan [
29] found that the negative proximity means that further away from near cities, the tendency of urban expansion declines. One possible reason for this could be the willingness of people to live in distanced areas and make even daily commutes to Tallinn in Harju County and Tartu in Tartu County. Additionally, the west direction of the trend surface in Harju County could impact these smaller towns located in the west.
Distance from water land (X11) in both counties was negatively correlated with urban expansion. This finding is in line with the experiments of Tammaru et al. [
17], which indicated urban expansion along the water bodies showed the attraction of this land for housing development.
Distance from the forest (X9) also had a negative impact on urban expansion, indicating the importance of forest land in trade-offs of urban expansion in both counties. It is also evident from the LULC analysis that in Harju County, 2680 ha of forest land were under construction from 1990 to 2018, indicating the importance of this land for urban expansion.
It is imperative to mention that the distance from the core of Tartu (X2) has the highest negative impact on urban expansion in Tartu County, while the distance from the airport (X5) has the highest positive impact on urban expansion.
Distance from agricultural land (X2) ranked amongst the most influential factors of urban expansion in Tartu County. Furthermore, based on the LULC analysis, agricultural land decreased 2.31% from 1990 to 2018, highlighting the importance of this land in people’s lives and the tendency for conversion to urban expansion.
Distance from sport and leisure facilities (X6) had a fragile relationship with the transformation from non-urban to urban land in both counties. Tammaru et al. [
17] argued environmental preferences were also more critical in the new suburban areas despite the significant distance from Tallinn, as proved truly significant in our case studies.
In addition, the LR results demonstrated that the ROC values for Harju County and Tartu County were 0.95 and 0.97, respectively, and the Pseudo R2 parameter was 0.36 for Harju County and 0.43 for Tartu County, indicating that the LR models were a good fit.
4.3. MLP Neural Network Model and Impacts of Proximity Factors on Urban Expansion
In this research, the MLP model was employed to investigate the power of each independent variable on the dependent variable. In Harju County, the most influential independent variable was “distance from existing residential areas (X10)”, which influences new construction and urban expansion in the long term. This finding supports the conclusion reached by Samarüütel et al. [
82] that suburbs of Tallinn are transforming from non-urban to urban areas mainly by people who want a cheaper settlement or better living conditions.
The most influential driving force in Tartu County was “distance from the core of Tartu (X2)”. It was also the most influential factor in the LR model, indicating the importance of proximity to the core in Tartu County. These two factors significantly showed that although transforming suburban land into urban was a prominent factor outside Tallinn and Tartu cities, people tend to settle in proximate with existing residential areas while taking advantage of environmental attractions in the suburbs.
Access to the main roads (X10) in both counties was the most influential factor using the MLP model. Reimets et al. [
30] noted that single houses, especially in rural areas, were located along Estonia’s main roads. Rungskunroch et al. [
4] determined that providing a cycle of planned destinations and transportation infrastructure, while encouraging people to travel or commute, affects the rapid development of a city.
Distance from green urban areas (X3) ranked amongst the most influential factors of urban expansion. Muhamad Nor et al. [
83] indicated the importance of urban greenery despite its reduction under the expansion of urban areas.
The MLP model revealed that distance from the airport (X5) is essential in Tallinn, while it is least influential in Tartu County. In line with the results of the LR model, it is important to point out that the Tallinn international airport (Lennart Meri) is located inside the city of Tallinn’s boundary, with many residential settlements shaped in the periphery of the airport area during recent decades. In Tartu County, the Tartu airport (Ülenurme) is situated outside Tartu’s boundaries with local services.
4.4. Towards Sustainable Urban Expansion
As illustrated in the LULC maps and the LR and MLP models, our results demonstrated that mainly scattering patterns of urban expansion in these counties occurred proximate to main cities and existing residential areas, taking advantage of main roads accessibility.
The proximity relationships are challenging because other factors, such as socioeconomic or governmental policies, influence urban expansion. These primary findings are consistent with research showing that in Estonia, it is more likely that the development of new housing areas around cities has been influenced by the lack of planning policy [
30,
82]. This is particularly important when investigating dynamic LULC changes as the physical driving forces of urban expansion in Estonia.
While the distances from near cities, core, and existing residential areas were ranked amongst the most influential factors of urban expansion around Tallinn and Tartu, enhancing public awareness and efficient regulations by the local government seems necessary to reduce the negative effects of urban expansion on the environment. Roads influenced the scattering of settlements in recent decades in Estonia. Therefore, effective land policies should be formulated.
Hence, to reach sustainability, local governments should consider policies to maintain biodiversity and reduce the continued agricultural and forest land conversion to built-up areas around Tallinn and Tartu. To this end, establishing more land regulations in master plans, protecting urban green areas surrounding Tallinn and Tartu, employing infrastructure expansion restrictions and implementing coordinated mechanisms covering the interests of natural and legal actors of urban expansion seems to be applicable.
5. Conclusions
Urban expansion is associated with dynamic LULC change. Understanding how LULC change contributes to urban expansion will provide helpful information for policymaking in LULC, help achieve better decisions for future transitions in urban expansion orientation and plan for more sustainable cities.
This research explored and analyzed the dynamic changes in LULC over 28 years in Estonia. In summary, geospatial analysis of urban expansion leads to the following conclusions: In Harju County, the most significant shifts in LULC from 1990 to 2018 were associated with urban land with a 33.96% increase and an increase of 8.94% in the wetland’s areas. The significant trends evident in Tartu County were related to the transforms in the suburban areas surrounding Tartu, which experienced a moderate increase of about 19.50%. The most significant decrease is the agricultural LULC class, with a 5.95% decline in Harju County and a 2.31% drop in Tartu County.
Applying LR and MLP neural network models, the prediction power of these models was investigated and the influential driving factors of urban expansion in two Estonian counties were found.
The LR model was an essential indicator that explained the relationships between urban expansion and potential driving forces. The dependent variable (Y) was defined as converted land from non-urban into urban LULC between 1990 and 2018, with 12 independent variables as proximity factors. The independent variables of “distance from main roads (X7)”, “distance from the core of main cities of Tallinn and Tartu land (X2)”, and “distance from water land (X11)” in both counties had a higher negative correlation with urban expansion, showing their influence on urban expansion. The ROC values for Harju County and Tartu County of 0.95 and 0.97, respectively, and the Pseudo R2 parameter of 0.36 for Harju County and 0.43 for Tartu County indicated that the LR model was a good fit.
Further, the MLP model showed that “distance from existing residential areas (X10)” in Harju County and “distance from the core of Tartu (X2)” had more power than the other variables. It indicated urban expansion extended outside Tallinn and Tartu and transformed suburban land into urban mostly along main roads. Indeed, it is crucial to investigate the long-term effects of urban expansion and roads construction balances in the way of sustainability.
The LR and MLP models assisted us in exploring the prediction power of independent variables on urban expansion. The MLP model computed the correlation between independent variables with urban expansion using hidden nodes. It was found that using these variables in the LR model provided a prediction of independent variables, with a value of 37% in Harju County and 45% in Tartu County. Using the MLP model predicted nearly 80% of variability by independent variables for Harju County and approximately 50% for Tartu County. It explained the power of using hidden nodes and experimenting with all possible interactions among variables in the MLP model.
It is also essential to notice that the socioeconomic aspects of Estonian life were driven by a fragmented urban expansion and rapid transformations of LULC during the study period. These created preconditions for the scattered spatial distribution of new existing residential areas in Estonia, providing new insight into assessing the impacts of macro-level factors on urban expansion and encouraging us to conduct further research through these factors.


