Review

Assessment of Reactive Nitrogen Flows in Bangladesh’s Agriculture Sector

1
Department of Soil Science, Bangabandhu Sheikh Mujibur Rahman Agricultural University, Gazipur 1706, Bangladesh
2
Krishi Gobeshona Foundation, Farmgate, Dhaka 1215, Bangladesh
3
UK Centre for Ecology & Hydrology, Penicuik EH26 0QB, UK
4
Kalinga Institute of Industrial Technology, Bhubaneswar 751024, Odisha, India
*
Author to whom correspondence should be addressed.
Sustainability 2022, 14(1), 272; https://doi.org/10.3390/su14010272
Submission received: 29 October 2021 / Revised: 11 December 2021 / Accepted: 21 December 2021 / Published: 28 December 2021
(This article belongs to the Section Sustainable Agriculture)

Abstract

:
To assess the status of and trends in agricultural nitrogen (N) flows and their wider consequences for Bangladesh, in this study, we analyzed data from national and international bodies. The increased rates of N fertilizer applied for increased food production leaves behind a huge amount of unutilized reactive N (Nr). N fertilizer use is the largest in the crop sector, an important sector, where current annual consumption is 1190 Gg. The present combined annual Nr production from crop, fishery, and livestock sectors is ~600 Gg, while emissions of nitrous oxide (N2O), a potent greenhouse gas, are ~200 Gg. Poor N management results in Nr leaking into the environment, which has increased approximately 16-fold since 1961. One potential consequence is the disruption of ecosystem functioning. The balanced tradeoff between food production and reducing Nr input needs to be achieved. One solution to reducing Nr may be a holistic approach that optimizes N application rates and incorporates waste of one subsector as an input to another applying the principle of the circular economy.

1. Introduction

Nitrogen (N) is an essential nutrient for all life forms and the ultimate resource for food production. Molecular nitrogen (N2) is plentiful in the atmosphere but is unreactive [1]. To make it available for plants and animals, it needs to be transformed into reactive forms such as ammonia (NH3), nitrate (NO3), nitrogen oxides (NOx), nitrous oxide (N2O), amines, and other organic forms of N [2]. During the green revolution, the dramatic advances in inorganic fertilizer production and application to crop fields have contributed to increasing agricultural productivity, ensuring food security for the ever-expanding global population [3,4]. However, the excessive use of inorganic N fertilizer in agriculture, accompanied by reactive N (Nr) production, is threatening the sustainability of both crop production and the environment [5,6,7]. Nr is produced in the environment by lightning, wildfires, biological N2 fixation (BNF), and use of applied organic and inorganic fertilizers to crop fields. It is also produced through the burning of fossil fuels, which leads to the formation of NOx in the atmosphere. UNEP and WHRC [8] reported that in the last 150 years, the contribution of Nr from the agriculture, industry, and transport sectors to the atmosphere, soils, and water bodies has increased more than 10-fold annually. N fertilizer is applied to fields to increase crop yields. However, a considerable amount of Nr is not used by the crops and is instead lost from soil through different biological and abiotic processes.
Bangladesh’s economy is largely dependent on agriculture; the share of agriculture in Bangladesh’s gross domestic product (GDP) was 12.65% in 2020 [9]. In Bangladesh, agricultural land occupies 70.6% of the total land area, with total cultivable land covering 8.5 million ha [10]. As agricultural growth is essential to feed its huge population, Bangladesh is one of the most climate-vulnerable countries in the world [11]. Hence, increasing production from different agricultural sectors under a changing climate has become a serious challenge for Bangladesh. About 82,900 ha of agricultural land is lost every year because of new settlements, industrialization, road construction, and other developmental works, exerting tremendous pressure on limited land resources to produce more food for the increasing population [12]. In 1971, the population of Bangladesh was only 75 million, which increased to 81.36 million in 1980, and the current population stands at 166.01 million [13]. In 1980–1981, the food grain production in Bangladesh was only 15 Mt; by 2016–17, it increased to 55 Mt [10], representing a 267% increase and indicating a significant positive effect of modern technologies, including high N-fertilizer use, on increasing production from 0.20 Mt in 1960–1961 to 1.12 Mt in 2018–2019.
The fisheries sector plays a vital role in Bangladesh in terms of nutritional security, supplying over 60% of animal protein contributing 3.8% to the country’s GDP [14]. The country has diverse and extensive fisheries resources, comprising capture fishery and aquaculture, both freshwater and marine. Inland aquaculture contributes 83.7% of the total fishery production in Bangladesh [15]. Bangladesh is the fifth largest aquaculture producer in the world, and the country’s farmed fish production increased 1.78 times from 0.79 Mt in 2001–2002 to 2.2 Mt in 2017–2018 [10,16]. This increased fish production is largely supported by the applications of fertilizer and supplementary feed as inputs to the pond systems in freshwater aquaculture. Reportedly, only 10–30% of the applied feed N is utilized by fish and the residual 70–90% remains in the pond systems, becoming a potential source of gaseous losses to the environment in the form of NH3 and nitrogen dioxide (NO2) [17].
Livestock is another vital sector of the rural economy in Bangladesh. It accounts for 14.1% of the agricultural GDP and 2.6% of the country’s GDP [18,19]. Chemical N fertilizer and animal manure are used for fodder production. Animal manure contains a large amount of N [20]. The annual fresh manure production in Bangladesh from ruminants and poultry is 151.3 and 4.5 Mt, respectively, which contribute a total of 0.296 Mt of N [21]. Animal manure may release substantial amounts of NH3, N2O, and NO to the environment during manure management and application to crop fields [22]. Conversely, animal manure, if applied to agricultural fields, might improve soil health and crop productivity. However, manure management in Bangladesh is traditional (mainly without manure treatment) and manure heaps might therefore act as a hotspot source of Nr in the environment.
Intensive cultivation practices with inorganic fertilizers cause environmental pollution and soil health degradation [23]. Globally, the N use efficiency, expressed as the ratio of N uptake to N applied, also called the apparent recovery efficiency, is only around ~20%, so 80% of the N in applied fertilizer is lost to the environment, equating to an annual loss of USD 200 billion [24]. In Bangladesh, traditionally, N fertilizer is broadcasted, an about 65–70% of the applied N is lost [25]. Such excess Nr reduces the quality of soil, water, and air; increases GHG emissions; degrades the ecosystems; and reduces biodiversity, significantly altering the global N budget, and ultimately affecting the global climate [1,26,27]. Among different forms of Nr, in the present study, we attempted to quantify release of NH3, N2O, and nitric oxide (NO), as well as non-CO2 GHG emissions from the agricultural sectors in Bangladesh. High-input agriculture can contribute up to 60% N2O emission globally, and N2O is the most potent GHG, with a global warming potential (GWP) of 298 times that of CO2 on a 100 year time horizon, i.e., N2O absorbs 298 times more heat compared to CO2 on a per-molecule basis [28]. NO and NO2 can have serious negative impacts on the environment and human health. These include damage to the ozone (O3) layer; reactions with volatile organic compounds (VOCs) to produce ground level O3, which in turn can damage crops and is harmful to humans; and links to fine particulate matter (PM2.5), which can cause respiratory diseases [29]. Nr can also negatively affect human health through occupational exposure to NO2, which damages lung functions, and by causing methemoglobinemia through drinking NO3-contaminated ground water and consumption of excess NO3 containing leafy vegetables [30,31]. Unionized NH3 can enter a fish’s body through breathing, ingestion, and contact. It reacts with water and produces ammonium hydroxide, which damages fish cells. In addition, atmospheric NH3 is known to damage plants, and contributes to the eutrophication and acidification of ecosystems [32].
Therefore, it is crucial to reduce Nr losses through sustainable N management that encompasses policy guidelines, social awareness, and execution in farmers’ fields. To reach this goal, information is required on how much Nr is produced in Bangladesh from field agriculture, aquaculture, and livestock sectors, which is currently not available in the scientific literature. Moreover, to develop strategies for the effective use of N fertilizers in agricultural sectors, it is crucial to quantify the extent of Nr losses. In this study, we collated Nr use patterns in the crops, fisheries, and livestock sectors and associated Nr release as a first step to providing available data in one place, which might help guide policy formulation for the better management of N fertilizer.

2. Materials and Methods

In this study, we analyzed the information collected from different published sources including peer-reviewed journals and books as well as grey literature such as websites and reports. However, some of the information on agriculture, fishery, and livestock production systems in Bangladesh needed further conversion using different accepted equations and factors, which are summarized in this section. Definitions of different activities according to the FAO are briefly described, and include manure management, inorganic fertilizers, manure applied to soils, use of crop residues, cultivation of organic soils, and burning crop residues and grasses [33]. The term manure management includes aerobic and anaerobic decomposition of manure at the farm prior to being applied to the field. In the context of pasture, it usually means manure left in the fields as directly excreted by the livestock. Inorganic fertilizers are chemical fertilizers that are industrially produced. Manure applied to soils means manure N added to agricultural soils by farmers. Crop residues are, for example, straw left on agricultural fields. Organic soils used for agriculture decompose and release plant available N (NH4+, and NO3) to the soil and ultimately release N2O to the atmosphere. Burning crop residues, grasses, and biomass is the combustion of a specific material on-site.

2.1. Data Sources and Nr Production from Agriculture

Data on inorganic N fertilizer production, import, and consumption in Bangladesh from 1960–2019 were collected from various sources [20,33,34,35].
Excess (+) or deficit (−) N fertilizer was calculated using Equation (1).
Excess   ( + )   or   deficit   ( ) =   Production   +   Import     Consumption
Data on present status and future projections of N demand by rice and rice yields (during different cropping seasons, viz. aus, aman, and boro rice) were collected from different sources [20,36,37,38]. N uptake by rice was calculated considering a grain yield of 18 kg N t−1 [10]. Apparent recovery efficiency (RE) of N was calculated using Equation (2).
RE   ( % ) = N   uptake N   applied × 0.4 × 100
N uptake data from a zero N plot (nonfertilized control plot) was not available; therefore, the contribution of applied inorganic N fertilizer was generalized and considered to be 40% of total N recovery according to available literature data [39,40,41]. Therefore, RE was multiplied by 0.4 to find an overall estimation of N recovery in rice cultivation in Bangladesh.
Emissions of different Nr from inorganic fertilizer applied to crop fields were calculated using Equation (3).
Emission   of   NH 3 ,   N 2 O ,   and   NO   ( kg   y 1 ) =   N   on   cropland   ×   Emission   factor
Emission factors for N2O and NO from inorganic N fertilizer in the South Asian region are 3.4% and 1.4%, respectively [42], and 22.4% for NH3 in Bangladesh [43]. Data on N2O emissions from manure applied to soils, use of crop residues, cultivation of organic soils, burning crop residues and grasses in Bangladesh for the period of 1961–2016 were obtained from FAOSTAT [33]. Activity data were categorized and are expressed as gigagrams of NH3, N2O, and NO. Furthermore, N2O emissions in CO2 equivalents (Mt CO2e) from agriculture comprising crop and livestock production and management for the period of 1990–2018 were obtained from the Climatewatch website [44]. Values were divided by 298 for the conversion from CO2e to N2O as the GWP of N2O is 298 times higher than that of CO2.

2.2. Data Sources and Nr Production from Aquaculture

Fish feed production and consumption data in Bangladesh during 2008 to 2017 were collated from different sources [45,46,47] that were subjected to several conversions to derive Nr production.
Total N in fish feed was calculated based on available published data; specifically, feed contains 35% protein, with 16% N content in protein [17]. Lost N from feed was calculated considering a feed use efficiency of 30% [48]. The total ammonia nitrogen (TAN) in fish ponds includes both NH4+ in solution and gaseous NH3 at equilibrium and was calculated using Equation (4) [49], where 0.092 is the model constant coefficient.
TAN   ( t ) =   Feed   ( t ) × Protein   fraction   in   feed   × 0.092
The conversion of the fraction from fish feed N to N2O emission is 0.018 [17]; the amount of cultured fish production in ponds were 1.8 and 1.9 Mt in 2016 and 2017, respectively [46]; and the average feed conversion ratio (FCR) was found to be 1.4 [50]. Therefore, the calculated amount of feed required for growing fish was found to be 2.38 and 2.66 Mt in 2016 and 2017, respectively.
Feed   requirement   ( Mt ) =   FCR   × Fresh   weight   of   fish   ( Mt )

2.3. Data Sources and Nr Production from Livestock

The carcass weight of animals (livestock and poultry) of Bangladesh for the period of 1961–2017 was extracted from FAOSTAT [33], and manure N and Nr production were calculated using different conversion values as detailed below.
NH3, N2O, and NO emission data from livestock production in Bangladesh for the period of 1961–2017 were obtained from FAOSTAT [33]. The dressing percentages of beef cattle exotic, beef cattle indigenous, buffalo, swine, goat, sheep, turkey, broiler, and duck were 62%, 51%, 45%, 70%, 45%, 50%, 79%, 71% and 89%, respectively [51]. Slaughter weights of different animals were calculated using the dressing percentage (Equations (6)–(8)).
Dressing   percentage   ( DP ) = Carcass   weight Live   weight × 100
Total   carcass   weight   or   production   ( t ) = Yield Carcass   weight ×   Head
Live   weight   or   slaughter   weight   ( ton ) =   Carcass   weight   × Dressing   percentage   ( DP )
Slaughter weights (kg) of all animal categories were multiplied by a specific emission factor (cattle 0.2, goat 0.83, sheep 0.67, poultry 0.3, and horse 0.18) in order to obtain N excretion in kilograms per animal per year as provided by Sheldrick et al. [52]. Total N (TN) was calculated using Equation (9) provided by Raza et al. [53]. N in manure was calculated by multiplying the fractions of TN excretion provided by Sheldrick et al. [52] for each type of animal (cattle 0.4586, goat 0.3145, sheep 0.995, poultry 0.6987, and horse 0.343) with the amount of manure (Equation (10)). It was then summed to obtain the total N as manure from livestock and poultry of Bangladesh. Volatilization loss of N from manure was calculated using Equation (11). Volatilization rates of N for cattle and poultry manure were 36%, and 28% for buffaloes, sheep, and goats [54]. N from manure applied to cropland was calculated using Equation (12) provided by Liu et al. [55]. Production of Nr (NH3, N2O, and NO) was calculated using Equation (13). The ammonia (NH3) emission factor from manure N was 25% [56], and 4.56% and 0.13% for N2O and NO, respectively [42]. The same factors were applied for deriving Nr from bioslurry, a semisolid byproduct from biogas plants after anaerobic digestion of manure.
TN   excretion   ( kg   y 1 ) =   Slaughter   weight   ( kg ) × Emission   factor
N   as   manure   = TN   excretion   ( kg   y 1 ) ×   Fraction   of   TN   excretion
N   loss   =   N   in   manure   ×   %   volatilization   rates   of   different   livestock   manure
N   on   cropland   =   N   as   manure     N   loss
Emission   of   Nr   ( kg   y 1 ) =   Manure   N   on   cropland   ×   Regional   emission   factor
Nitrous oxide (N2O) emission from manure management in Bangladesh for the period of 1961–2016 was obtained from FAOSTAT [33].

3. Results and Discussion

3.1. Nitrogen Fertilizer Consumption, Production, and Import in Bangladesh

Nitrogen consumption in Bangladesh was only 20,000 t in 1961, increasing to 1.27 Mt in 2008, and then decreasing to 1.19 Mt in 2019 (Figure 1). However, N fertilizer consumption in the country increased from 1961 to 2019 to increase food production (Figure 1). N production also increased over time until 1994, with a peak production of 1 Mt, and declined thereafter until 2019. To meet the N requirements, import of inorganic fertilizer (urea, DAP, etc.) started from 1991 and increased rapidly. There was an excess of urea N during 1985–2007, whereas a deficit existed before and after this period. The deficit in available fertilizer was balanced using di-ammonium phosphate (DAP) and different organic fertilizers as well. From DAP, 7512 t of N was used during 1980–1981, which increased rapidly to 109,620 t of N in 2016–2017 [20]. Consumption of N fertilizer in Bangladesh increased during the green revolution to increase food grain production, which began with the introduction of the IR-8 rice variety from IRRI, Philippines, in 1967. The spread of the green revolution and the resulting increase in food production were visible after the country’s independence in 1971; since then, N consumption has increased linearly.
The major crops of Bangladesh are rice, wheat, maize, and potato. Rice was grown on 11.05 Mha of land in 2016–1207, and the total cropped area was 15.44 Mha [10] (Figure 2). This appears to be the maximum use of the country’s agricultural land available for rice production, which ultimately contributed to a significant increase in rice production of about 34 Mt (Figure 2). This increased crop production resulted in an increase in N consumption (Figure 1). Furthermore, N fertilizer is also used in other crops, fodder production, semen preservation, and fishponds, but these data are not available. To increase food production, cropping has been intensified with high-yielding modern varieties that consume mainly large amounts of inorganic fertilizers, and, to a lesser extent, organic fertilizers. In the last decade, N constituted about 75% of the total plant nutrients applied as fertilizers in Bangladesh [57]. However, farmers’ awareness of balanced fertilization and technology dissemination have contributed to reducing the share of chemical N fertilizer to 55% of the total nutrients applied to crop fields [58].
Rice production might have to be increased further to meet the increasing food demand of the growing population by using higher rates of N, P, K, and other fertilizers, and adopting pest management practices. According to the Bangladesh Unnayan Onneshan think-tank [38], the present requirement of urea for rice is 2.45 Mt; in 2050, the projected urea fertilizer requirement is 3.92 Mt (Figure 3a). The projected N demand for rice from 2007 to 2050 follows a linear trend. Among the three types of rice, urea consumption is the lowest in aus rice (pre-monsoon summer rice) and the highest in boro (dry season irrigated rice), whereas for the transplanted aman rice (monsoon rice), the requirement is almost as high as for boro rice [20]. The global N use as a percentage of N fertilizer demand was 9.5% in 2018 [59]. The N content in most of the soils of Bangladesh is low to medium [20]. Therefore, a large amount of inorganic N fertilizer is applied to bridge the gap between existing levels and the plants’ requirements to increase crop production. The amount of ammonium N (NH4+-N) and nitrate N (NO3-N) in agricultural soils in Bangladesh varies from 5.1–21.2 and 2.6–5.6 mg kg−1, respectively, [60], necessitating replenishing these nutrients from other sources such as inorganic fertilizers and manure. However, N undergoes several transformations in the soil and crop environments that result in loss of the N that cannot be taken up by the crop via the hydrosphere, atmosphere, and soil [61]. The loss of N from agricultural land is high in tropical and subtropical countries such as Bangladesh [62]. Hence, despite intensive cropping with modern crop varieties and the use of mostly inorganic fertilizers, N use efficiency in Bangladesh is declining. The apparent recovery efficiency of N in rice in the country remains almost constant, ranging from 25–30%, with marginally higher rates in boro rice since 2007 to date and for predictions for 2050 (Figure 3b). Due to intensive cropping and the associated mining of nutrients, the contribution of the soil to the nutrients supply or crop productivity is also declining. Such plateauing of yield is of concern for future food security in Bangladesh. As a result, a higher amount of N fertilizers is being used by the farmers in order to maintain similar rice yields. Application of inorganic N fertilizer in agriculture is essential to meet global food, feed, and fiber needs [63]. At the same time, fertilizer efficiency also needs to be increased by adopting various soil and crop management activities. In various research stations in Bangladesh, the apparent recovery efficiencies of N for the major crops, viz. rice, wheat, maize, and potato, are 48%, 62%, 26%, and 58%, respectively, and agronomic efficiencies are 37, 40, 17, and 110 kg kg−1, respectively (Figure 4). However, N use efficiencies are generally much lower in the farmers’ fields because of poor N management and the imbalanced use of fertilizers (Figure 3b). Therefore, there is room to increase N use efficiency, particularly in farmers’ fields.

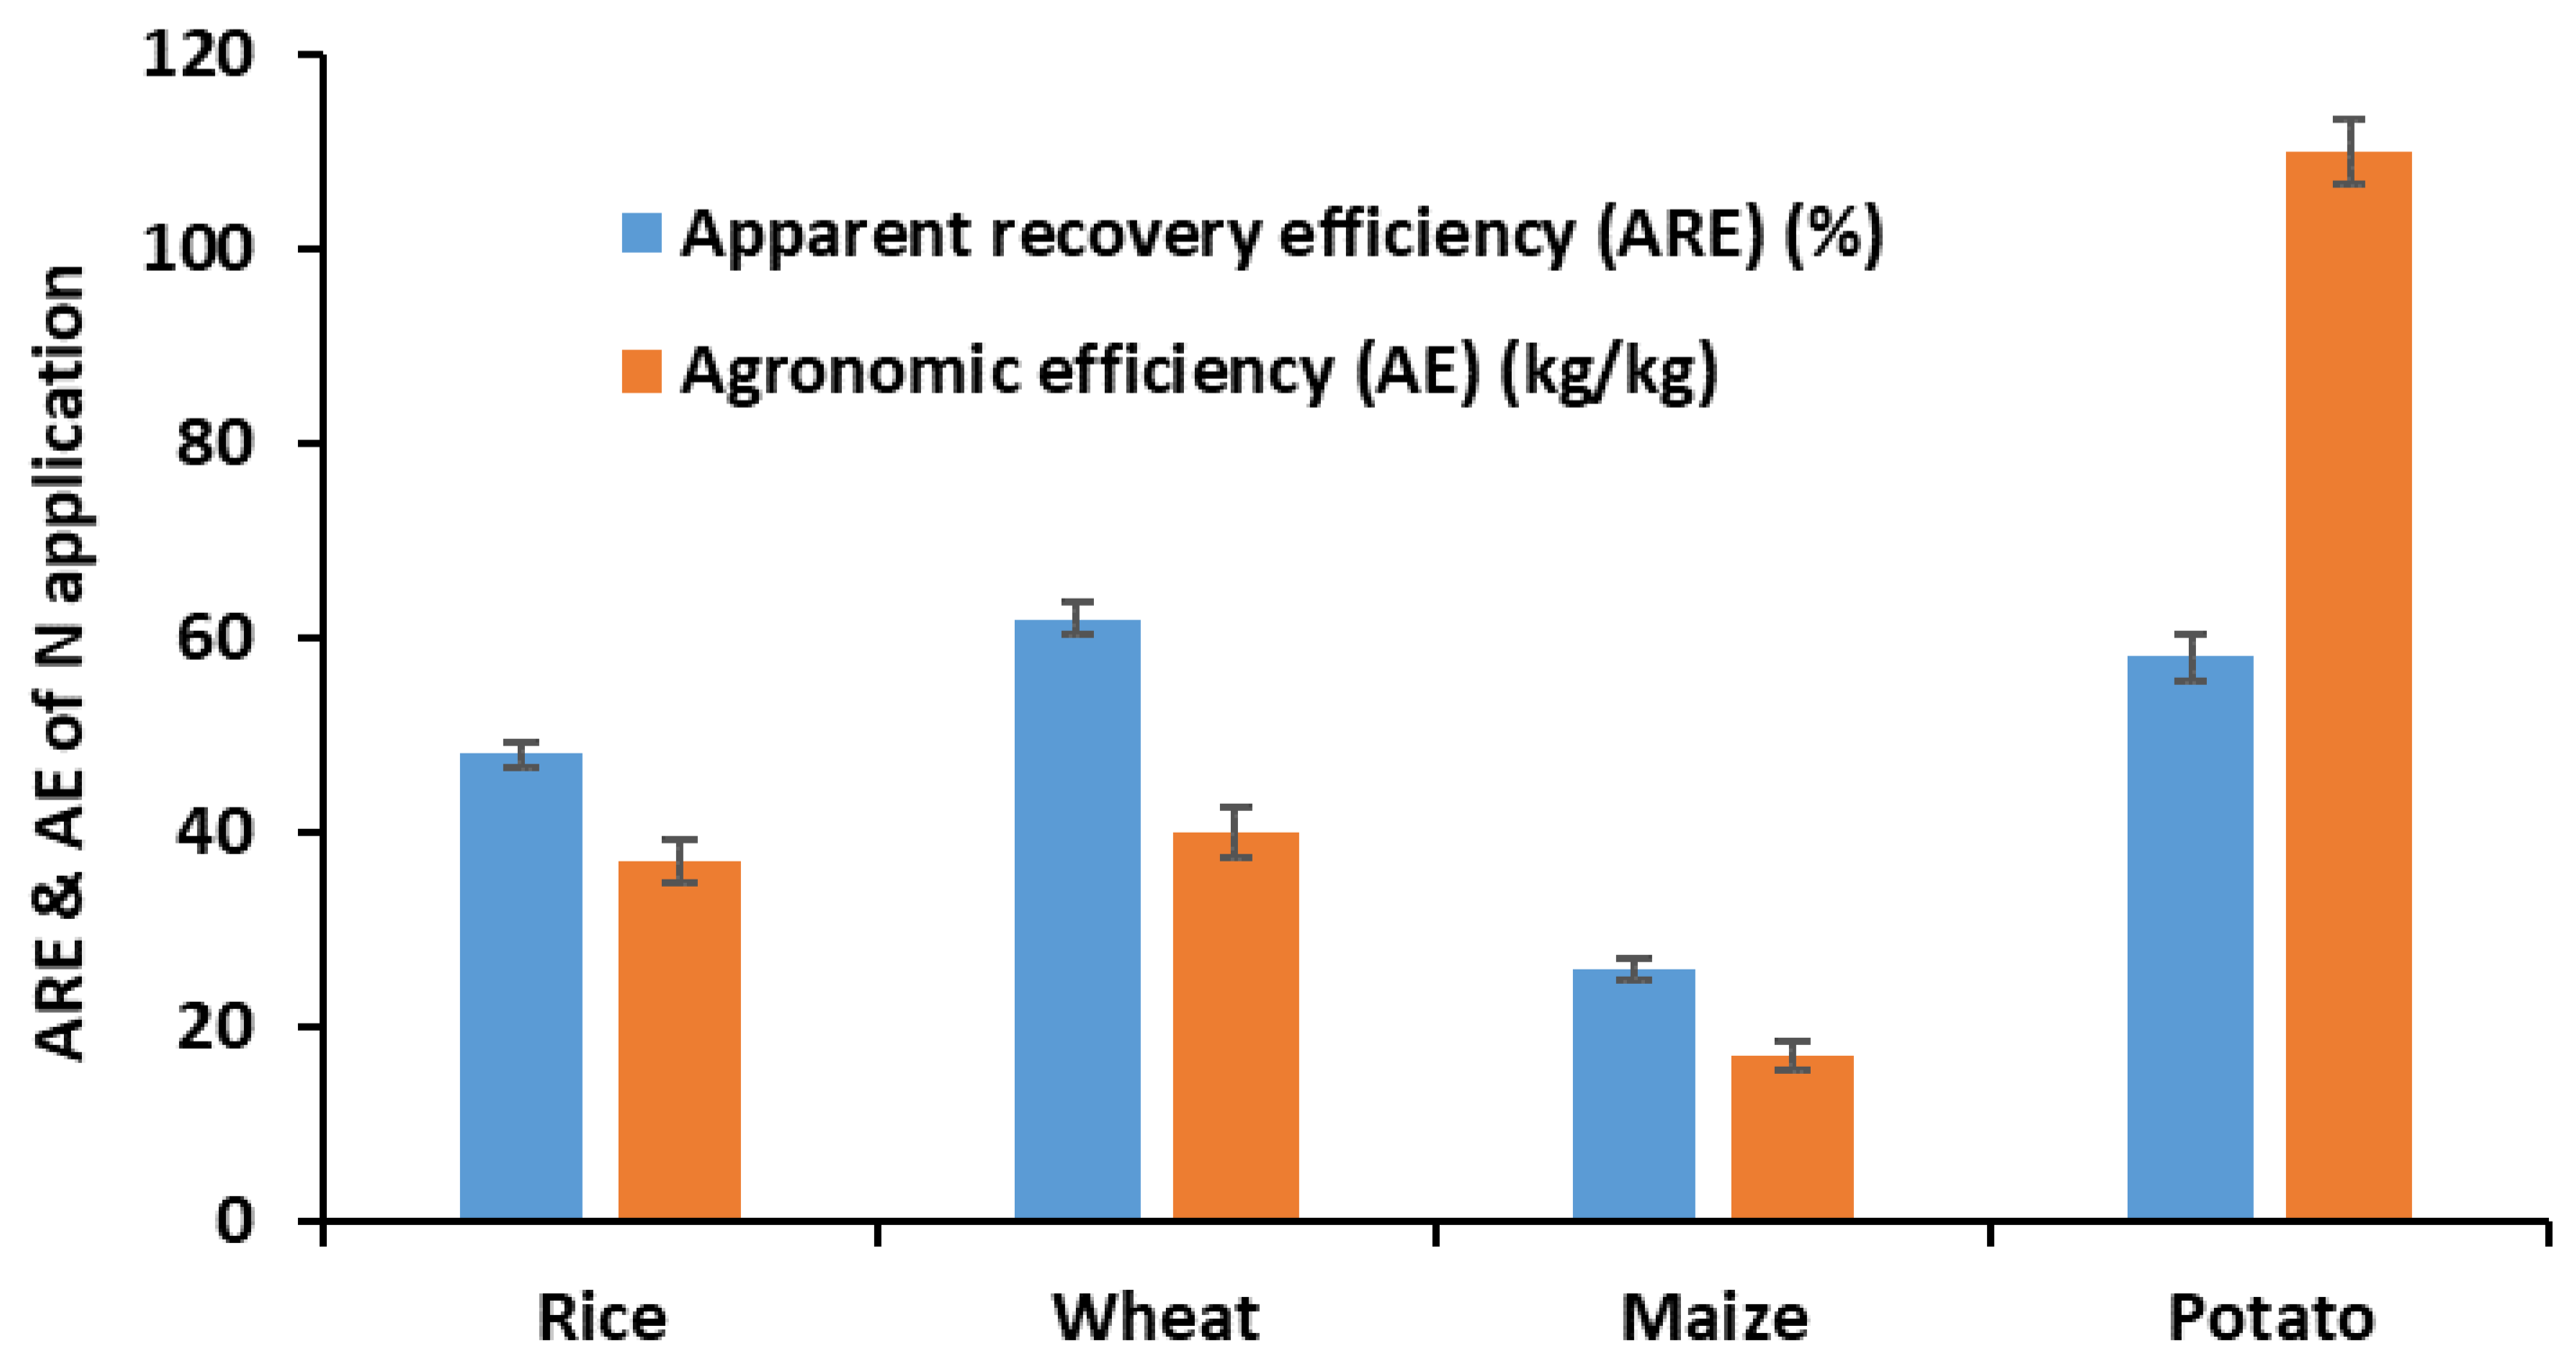
3.2. Reactive N (Nr) Production in Bangladesh’s Agriculture

Significant proportions of N fertilizer applied for crop production are subject to loss to the atmosphere. The release of Nr from N fertilizer as NH3, N2O, and NO in Bangladesh since 1961 to 2019 has increased dramatically (Figure 5a). From 1961 to 2019, emissions of NH3, N2O, and NO from N fertilizer increased from 4.72 to 263.45, 0.68 to 37.95, and from 0.28 to 15.65 Gg, respectively. This magnitude of loss of Nr from inorganic N fertilizer is of serious concern for agricultural and environmental sustainability. Production of Nr and its losses to the environment have increased in recent years mostly because of higher rates of N fertilizer application coupled with low use efficiency. Losses occur through processes such as ammonia volatilization and nitrification-denitrification [64]. Surface run-off and leaching of Nr also occur in the form of NO3 and NH4+ from rice fields. NH4+-N loss is usually higher than NO3-N loss in wetland paddy fields in Bangladesh [65].
There was a noticeable loss of N2O because of crop residue management and burning of crop residues and grasses in Bangladesh from 1961 to 2016 (Figure 5b). Residues incorporation into crop fields contributed to 5.56 and 13.70 Gg of N2O in 1961 and 2016, respectively. On-site burning of crop residues and grasses showed similar emission rates of N2O from 1961 to 1989 (0.35 to 0.44 Gg), then increased to a peak of 163.64 Gg in 2006, and decreased to 5.24 Gg in 2016 (Figure 5b). The likely reason for this is higher rates of burning during 1990 to 2006, before an awareness program was launched encouraging farmers not to burn residues. Cultivation of organic soils decreased N2O emissions in croplands from 8.88 Gg in 1990 to 8.71 Gg in 2016 (Figure 5c). Better management of organic matter, soils, and crops might be the cause of slowing rates of N2O emissions from the cultivation of organic soils. Furthermore, decomposition of organic soil might have reduced as N was taken up by microorganisms. N lost as N2O from most of the agricultural activities increased substantially from 1961 to 2016. Data obtained from Climatewatch showed that N2O emissions from crop and livestock production and management activities almost doubled from 50.97 to 90.73 Gg during the period of 1990 to 2018 (Figure 5d).
Losses of Nr as NH3, N2O, and NO from inorganic fertilizers, management of crop residues, and burning of crop residues and grasses are based on various assumptions and factors; however, the available numbers confirm a substantial release of Nr from crop agriculture. The agriculture sector of Bangladesh, comprising crop and livestock production and management, contributed 88.5 Mt CO2e of non-CO2 GHG emissions in 2018 and contributed the most (44.49%) compared to the energy, waste, and industrial process sectors (Figure 6). N fertilizers are necessary to feed the population, but excess Nr from agriculture can severely pollute the environment, as discussed above.

3.3. Nitrogen Use and Nr Production in Aquaculture

Fish provide 60% of the animal protein to the people of Bangladesh [46]. During the recent decades, aquaculture ventures have increased and intensified. The shift from low-input, extensive systems to high-input, intensive aquaculture systems has resulted in a huge demand for fish feed. Total feed production for pond aquaculture in 2008 was only 0.67 Mt, which increased 400 times to 2.66 Mt in 2017 (Figure 7a). Total feed comprises sinking, floating, and farm-made feeds, which contributed a total of 37,520 t of N in 2008, increasing to 148,960 t in 2017. Mamun-Ur-Rashid et al. [45] reported that the production and sale of fish feed in Bangladesh’s aquaculture have increased radically in the last decade, where about 1.04 Mt of feed was produced commercially and between 0.3 and 0.4 Mt was produced at th village level with additional imports needed. Actual feed requirements are higher than local production. Raw unformulated feeds such as rice bran and mustard oil cake are applied to fishponds. Farmers in Bangladesh apply 1000 t of raw and unprocessed feed in their ponds annually [66]. This is included in farm-made feed in Figure 7a. Mamun-Ur-Rashid et al. [45] also reported that, since 2008, feed production has increased by 32% annually to approximately 3.0 Mt in 2017. Other data led to a fish feed requirement estimation of 2.65 Mt in 2017 in Bangladesh [47]. Fish feed serves as an important input of Nr in the aquaculture sector of the country, and cultured fish ponds released 675 t of N2O in 2008 and 2681 tons in 2017 (Figure 7b). Total ammonia (NH4+ and NH3) production in fish ponds was 21,574 and 85,652 t in 2008 and 2017, respectively (Figure 7b). Unaccounted-for loss of N was calculated to be 4014 t in 2008 and 20,587 t in 2017.
The application of improved feeds and fertilizers and best management approaches, has contributed to higher production of major fish species in Bangladesh [46]. Inorganic N is applied to fishponds at variable rates for different fish species, which enhances the phytoplankton production in pond environments and ultimately increases fish productivity. Nitrogen loss from aquaculture ponds is very high but rarely quantified or reported. In semi-intensive tilapia ponds, the fish utilize only 9–22% of the applied N from different organic and inorganic sources, so 78–91% remains unutilized (Table 1). Research revealed that in carp polyculture systems, about 40–50 kg organic manure is needed to produce 1 kg of fresh fish [67]. The food conversion ratio (FCR) in semi-intensive and intensive tilapia production systems varies between 0.75 and 2.5. Hence, the production of 100 t of fish biomass requires 75–250 t of feed, which is equivalent to 4.2–14.0 t of N.
Culture of Pangasius and other catfish is widespread in Bangladesh and accounted for about 15% of total fish production in 2012–2013 [16]. Pangasius farming in Bangladesh is characterized by high stocking densities, where the intensive supply of pellet feed is necessary for high yields [68]. A large amount of uneaten feed accumulates in Pangasius ponds, which contain high levels of N, P, and organic carbon. Nitrogen loss from commercial pellet feed under Pangasius pond culture systems was estimated/calculated to be 30% [69]. Researchers have reported that in Pangasius and other fish farming, only 10–30% of the applied nutrients supplied through organic and inorganic fertilizers and pellet feeds are used by fish, and the remaining 70–90% is dispersed in the environment, acting as a potential source of pollution [70,71]. Intensive aquaculture solely depends on feed supply, whreas semi-intensive types of fish culture require the combined application of feed, N fertilizer, and manure in ponds. Unutilized N in fishponds produces a large amount of NH3, N2O, and other Nr species such as NO3 and NO2. According to Yuan et al. [72], the top 21 fish-producing countries in the world released 36.7 Gg of N2O from freshwater aquaculture systems in 2014. It was reported that aquaculture can be a potential source of atmospheric N2O formed during nitrification [17]. High levels of NH3 production are toxic to aquatic animals, especially fish. It is obvious that the resultant negative effect of Nr produced from the aquaculture sector on the environment is a matter of serious concern.

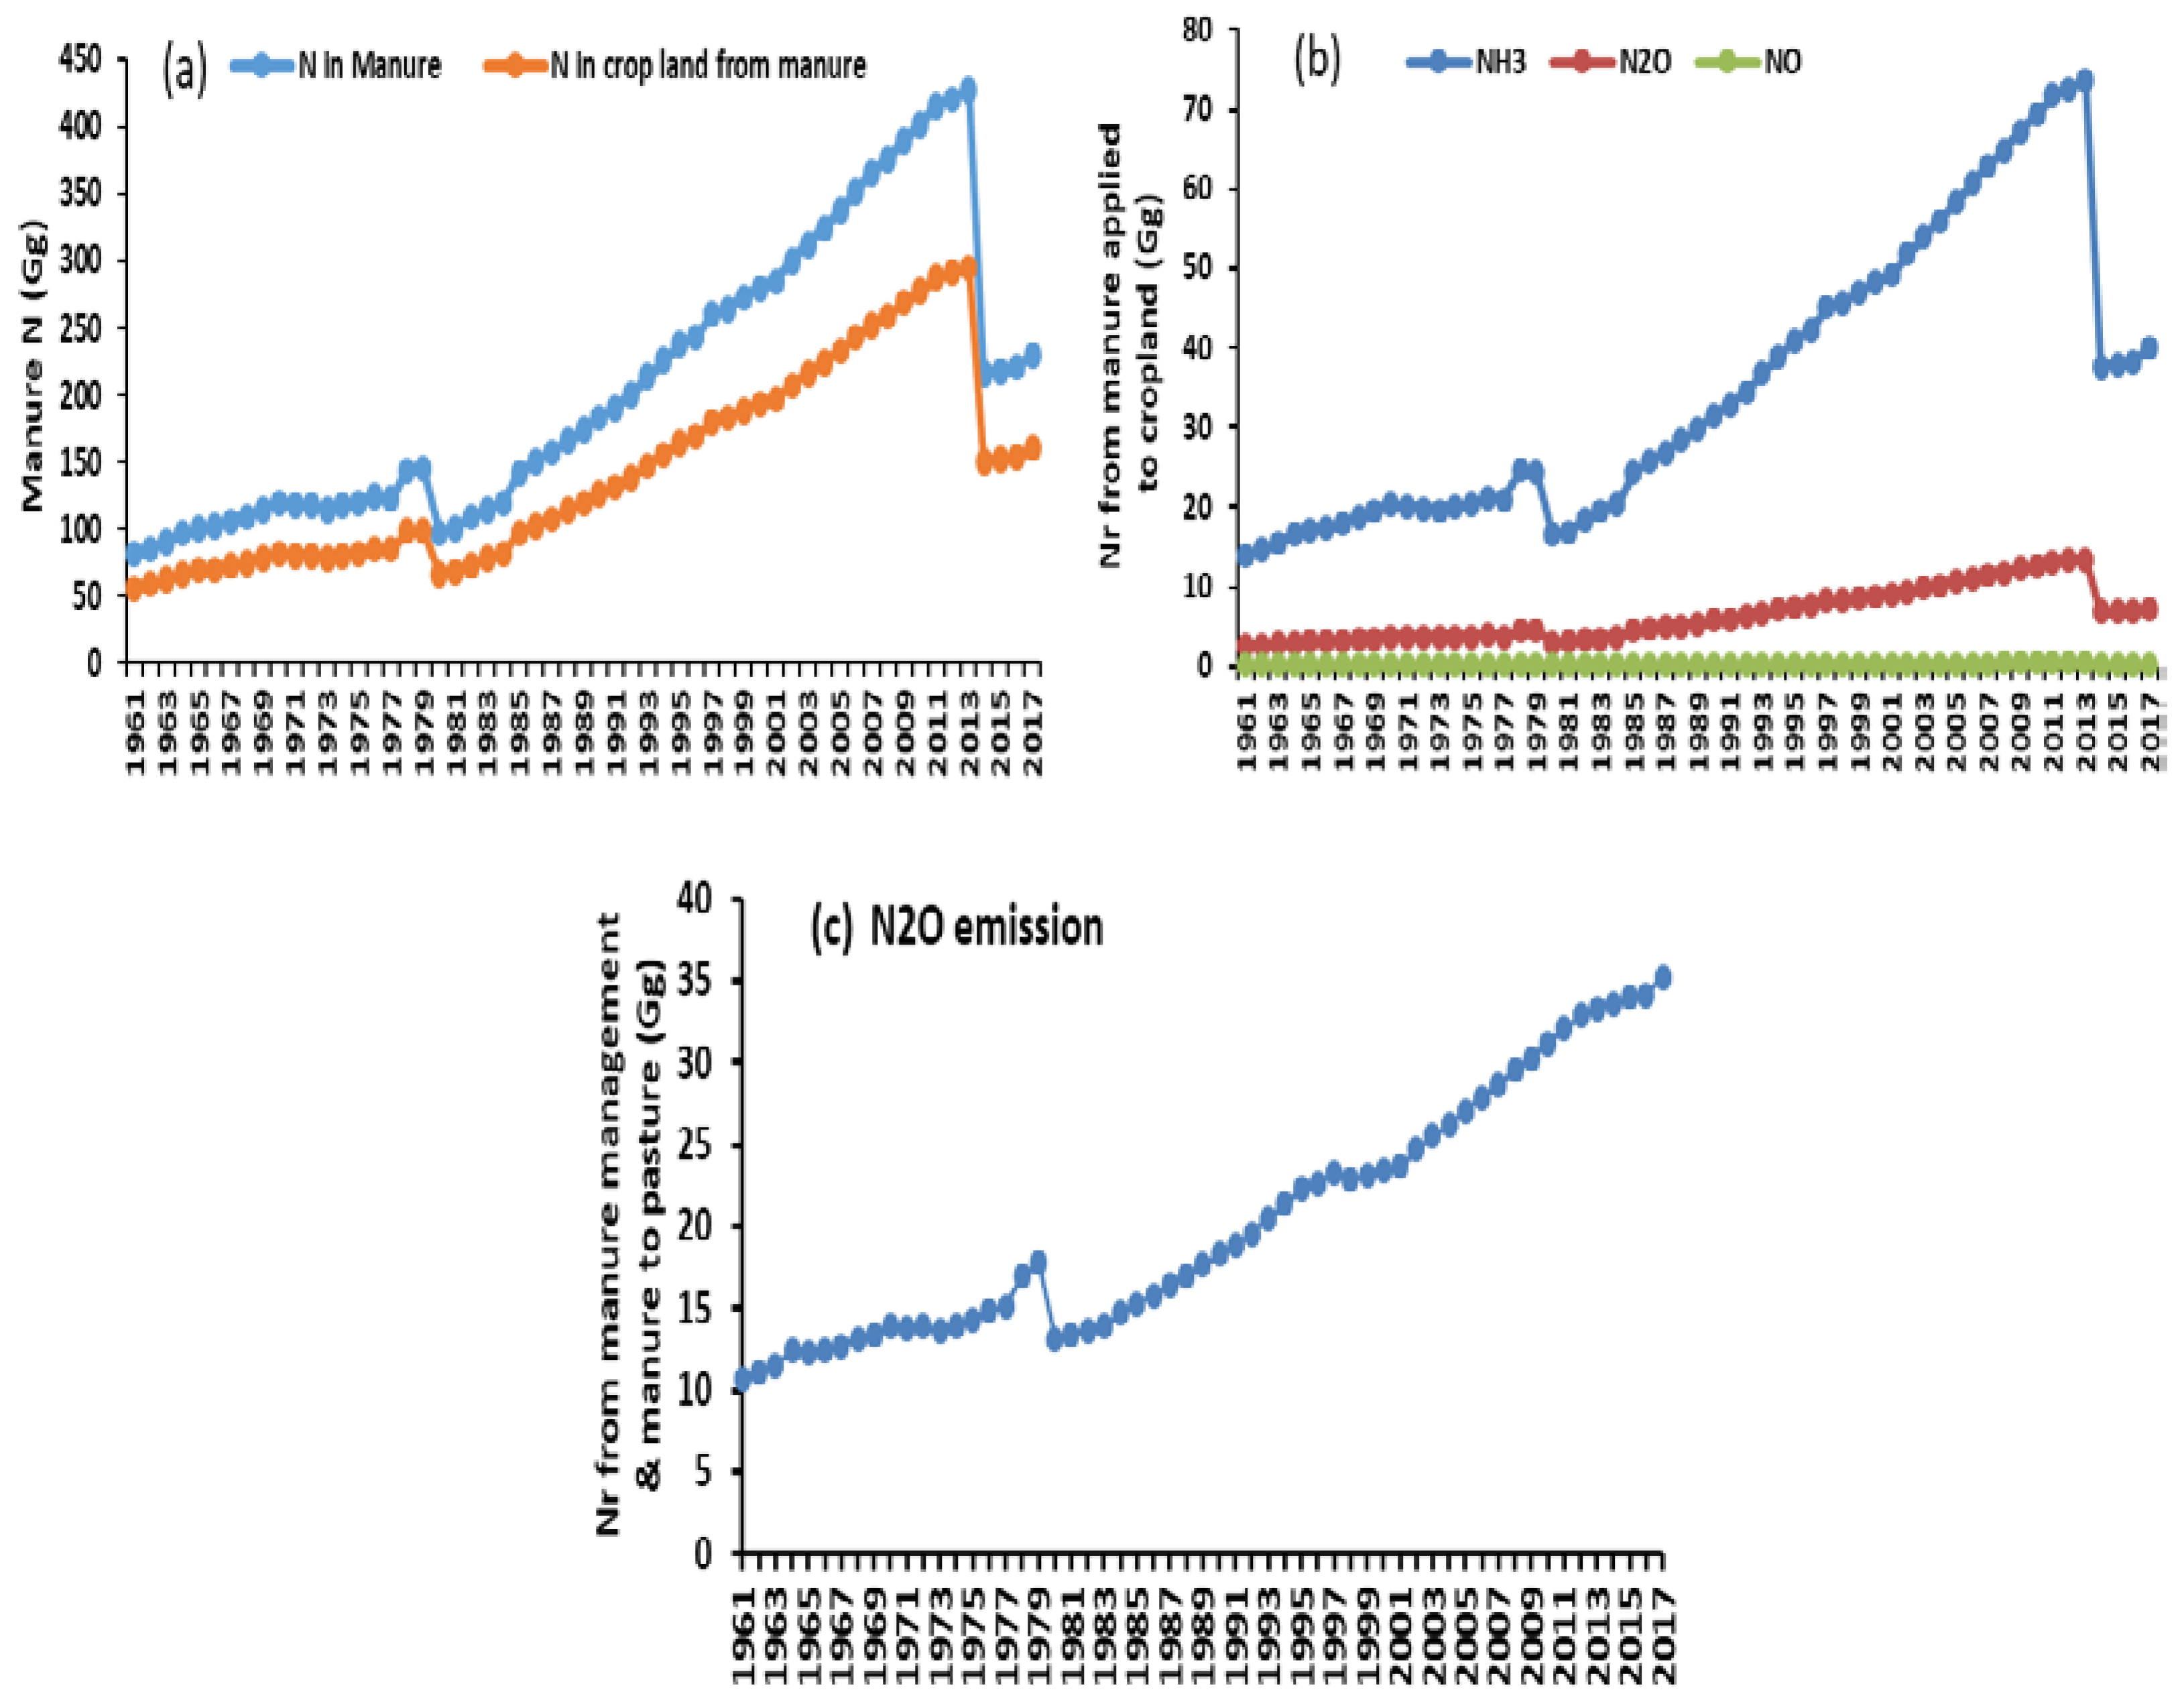
3.4. Manure N and Nr Production from Livestock and Poultry

The number of livestock of different categories in Bangladesh increased at high rates from 1949 to 2017 (Table 2). The number of bovine animals plateaued from 2008 onward. This lower growth rate of 0.53% is likely because of the replacement of animals with machines in agriculture. However, the numbers of sheep and goats (2.31%) and poultry (2.39%) increased at higher rates. These huge numbers of livestock and poultry require a large amount of nutrients supplied through fodder and feed. For the quality production of milk and meat, quality fodder and nutrient supply is a necessity. Huque and Sarker [73] reported a large deficit in the quality of animal feed in Bangladesh.
Better management options, i.e., application of all required fertilizer elements including N, are required to overcome the shortfall in fodder production. Urea is used in cultivation of fodder crops, e.g., napier, maize, alfalfa, and Moringa oliefera, and other feed production. Even though recommended rates of fertilizer for fodder crops exist, they are basically ignored by most farmers. Animals are fed not only these fodder crops, but also about 27.32 Mt of fibrous biomass and 14,530 t of oilcakes as animal feed [74]. From all these activities, it is likely that a significant amount of reactive N leaks to the environment; however, data on the magnitudes of these losses are missing, which is a concern.
Livestock manure annually contributed 295,913 t of N, where the shares of ruminants and poultry were 234,515 and 61,398 t, respectively (ILMM, 2015). According to FAOSTAT [33], manure N was 80.66 Gg in 1961, which increased to 229.62 Gg in 2017 (Figure 8a). FAOSTAT also reported that of the manure N, about 70% was applied to cropland as organic fertilizer. Because of chemical and microbial transformation of manure N, it substantially contributes to Nr formation, especially in the form of NH3 [75]. Manure N enters the hydrological system through leaching and runoff, and is partly released to the atmosphere through volatilization and denitrification [76]. Data derived from FAOSTAT [33] revealed that livestock-manure-released NH3, N2O, and NO increased significantly in 2017 compared to base year 1961 (Figure 8b). Ammonia emission was 13.89 Gg year−1 in 1961, which increased to 39.92 Gg year−1 in 2017; during this period, N2O emissions increased 2.53 to 7.28 Gg year−1 and NO emissions increased 0.07 to 0.21 Gg year−1. Trends in NH3, N2O, and NO emissions followed a similar trend, as these data were derived from same carcass and slaughter weights, dressing percentage, and emission factors subjected to conversion by several steps, as mentioned in the Methods section.
From aerobic and anaerobic decomposition processes, manure before application to crop fields and manure left on pasture conjointly released N2O at about 34.18 Gg in 2016, but only 10.67 Gg in 1961 (Figure 8c). The concern is that a huge amount of N is lost from livestock production systems in Bangladesh, which needs to be addressed to reduce the overall emission budget. Livestock manure is traditionally considered as waste material in Bangladesh that can potentially pollute the environment and poses a serious threat to human health. Smallholders traditionally use a large amount of manure (37.3% of total manure) as a fuel source, while 56.2% of total manure is accumulated by medium and large farmers in open pits and is applied as fertilizer to crop fields after a few months of storage and partial composting [21]. Such unscientific manure management might create eutrophication of surface water, enhance leaching of NO3, load excess nutrients, contaminate soil and water resources, and release NH3, methane (CH4), and other gases to the atmosphere.

4. Conclusions

N use efficiency in Bangladesh is low; thus, a large amount of Nr remains superfluous in the environment. The annual Nr production from the crop sector is 435 Gg, while the contribution of inorganic N fertilizer alone is 317 Gg. Aquaculture contributes approximately 88 Gg, while livestock sector adds about 83 Gg Nr to the environment. This excess Nr is posing challenges for human health, and agricultural and environmental sustainability not only in Bangladesh but also around the globe as a component of the N cycle. From our analysis on the use and management of N fertilizer, manure, and crop residues in crop, fishery, and livestock sectors of Bangladesh, we concluded that unused Nr will likely pollute the soil, water, and atmosphere. The collated information can help policy makers to better understand N management scenarios and their possible impacts on the environment. This might ensure the adoption of technologies for a viable, productive agroecosystem and a sustainable environment.

Author Contributions

M.M.R. prepared the first draft of the manuscript (MS) and addressed all the comments and prepared the MS to be suitable for submission; J.C.B. helped M.M.R., providing some data to write the MS, and initially edited the draft; T.K.A. edited the draft providing comments for further improvement; M.A.S. conceptualized the study, provided comments for improvement, and corrected the Abstract and Acknowledgements; J.D. thoroughly improved the language and overall quality of the MS, and provided comments for further improvement. All authors have read and agreed to the published version of the manuscript.

Funding

This study was conducted with the support of the Global Environment Facility (GEF)/United Nations Environment Program (UNEP) project “Towards the International Nitrogen Management Systems (Towards INMS)”; and the GCRF South Asian Nitrogen Hub (SANH), funded through the Global Challenge Research Fund (grant number NE/S009019/1) of UKRI.

Institutional Review Board Statement

Not applicable.

Informed Consent Statement

Not applicable.

Acknowledgments

We gratefully acknowledge the scholastic contributions of national and international organizations to produce the data and other information that is assembled here, according to the cited literature and internet sources. This study was conducted with the support of the Global Environment Facility (GEF)/United Nations Environment Program (UNEP) project “Towards the International Nitrogen Management Systems (Towards INMS)”; and the GCRF South Asian Nitrogen Hub (SANH), funded through the Global Challenge Research Fund (grant number NE/S009019/1) of UKRI, as coordinated by the U.K. Centre for Ecology and Hydrology (UKCEH). The article represents a contribution to the work of the International Nitrogen Initiative (INI).

Conflicts of Interest

The authors declare no conflict of interests.

References

  1. Sutton, M.A.; Howard, C.M.; Erisman, J.W.; Billen, G.; Bleeker, A. The European Nitrogen Assessment: Sources, Effects and Policy Perspectives; Cambridge University Press: Cambridge, UK, 2011. [Google Scholar]
  2. Erisman, J.W.; Galloway, J.N.; Seitzinger, S.; Bleeker, A.; Butterbach-Bahl, K. Reactive nitrogen in the environment and its effect on climate change. Curr. Opin. Environ. Sustain. 2011, 3, 281–290. [Google Scholar] [CrossRef] [Green Version]
  3. Erisman, J.W.; Sutton, M.A. Reduced nitrogen in ecology and the environment: Special issue of the ESF-FWF Conference in partnership with LFUI, October 2006. Environ. Pollut. 2008, 154, 357–507. [Google Scholar] [CrossRef] [PubMed] [Green Version]
  4. UNEP. Frontiers 2018/19 Emerging Issues of Environmental Concern; United Nations Environment Programme: Nairobi, Kenya, 2019. [Google Scholar]
  5. Ju, X.T.; Xing, G.X.; Chen, X.P.; Zhang, S.L.; Zhang, L.J.; Liu, X.J.; Cui, Z.L.; Yin, B.; Christie, P.; Zhu, Z.L.; et al. Reducing environmental risk by improving N management in intensive Chinese agricultural systems. Proc. Natl. Acad. Sci. USA 2009, 106, 3041–3046. [Google Scholar] [CrossRef] [PubMed] [Green Version]
  6. Sutton, M.A.; Oenema, O.; Erisman, J.W.; Leip, A.; van Grinsven, H.; Winiwarter, W. Too much of a good thing. Nature 2011, 472, 159–161. [Google Scholar] [CrossRef] [PubMed] [Green Version]
  7. Lu, C.; Tian, H. Net greenhouse gas balance in response to nitrogen enrichment: Perspectives from a coupled biogeochemical model. Glob. Chang. Biol. 2013, 19, 571–588. [Google Scholar] [CrossRef]
  8. UNEP; WHRC. Reactive Nitrogen in the Environment: Too Much or too Little of a Good Thing; United Nations Environment Programme: Paris, France, 2007. [Google Scholar]
  9. O’Neill, A. Share of Economic Sectors in the GDP in Bangladesh 2020. Available online: https://www.statista.com/statistics/438359/share-of-economic-sectors-in-the-gdp-in-bangladesh/ (accessed on 27 July 2021).
  10. AIS. Agriculture Information Services; Krishi Diary 2018; Department of Agriculture Extension, Ministry of Agriculture, Government of Bangladesh: Dhaka, Bangladesh, 2018.
  11. Sikder, R.; Xiaoying, J. Climate change impact and agriculture of Bangladesh. J. Environ. Earth Sci. 2014, 4, 35–40. [Google Scholar]
  12. Islam, M.R.; Hasan, M.Z. Losses of agricultural land due to its infrastructural development: A study on Rajshahi district. Int. J. Sci. Eng. Res. 2013, 4, 391–397. [Google Scholar]
  13. World Population Review. 2008. Available online: http://worldpopulationreview.com/countries/bangladesh-population/ (accessed on 16 April 2018).
  14. FAO. Fishery and Aquaculture Country Profiles, The People’s Republic of Bangladesh; FAO Fishery and Aquaculture Department, Food and Agriculture Organization of the United Nations: Rome, Italy, 2014; Available online: http://www.fao.org/fishery/facp/BGD/en (accessed on 27 July 2021).
  15. FRSS. Yearbook of Fisheries Statistics of Bangladesh; Fisheries Resources Survey System (FRSS), Department of Fisheries, Bangladesh: Dhaka, Bangladesh, 2016; Volume 32, pp. 1–57.
  16. DoF. Fisheries Statistical Yearbook of Bangladesh 2012–2013; Fisheries Resource Survey System (FRSS), Department of Fisheries: Dhaka, Bangladesh, 2014; p. 52.
  17. Hu, Z.; Lee, J.W.; Chandran, K.; Kim, S.; Khanal, S.K. Nitrous oxide (N2O) emission from aquaculture: A review. Environ. Sci. Technol. 2012, 46, 6470–6480. [Google Scholar] [CrossRef]
  18. BES. Bangladesh Economic Survey; Department of Finance, Ministry of Finance and Planning, Government of the People’s Republic of Bangladesh: Dhaka, Bangladesh, 2009; p. 71.
  19. DLS. Annual Report on Livestock; Division of Livestock Statistics, Ministry of Fisheries and Livestock: Dhaka, Bangladesh, 2013.
  20. FRG. Fertilizer Recommendation Guide (FRG); Bangladesh Agricultural Research Council (BARC): Dhaka, Bangladesh, 2018; p. 223.
  21. ILMM. Draft National Integrated Livestock Manure Management (ILMM) Policy; Government of the People’s Republic of Bangladesh Ministry of Fisheries and Livestock, Bangladesh Secretariat: Dhaka, Bangladesh, 2015.
  22. Zhang, X.; Fang, Q.; Zhang, T.; Ma, W.; Velthof, G.L.; Hou, Y.; Oenema, O.; Zhang, F. Benefits and trade-offs of replacing synthetic fertilizers by animal manures in crop production in China: A meta-analysis. Glob. Chang. Biol. 2020, 26, 888–900. [Google Scholar] [CrossRef]
  23. Singh, B.; Ryan, J. Managing Fertilizers to Enhance Soil Health; International Fertilizer Industry Association: Paris, France, 2015. [Google Scholar]
  24. Sutton, M.A.; Howard, C.M.; Adhya, T.K.; Baker, E.; Baron, J.; Basir, A.; Brownlie, W.; de Vries, W.; Eory, V.; Hicks, K.W.; et al. Nitrogen—Grasping the Challenge. A Manifesto for Science-in-Action through the International Nitrogen Management System; Centre for Ecology & Hydrology: Edinburgh, UK, 2019. [Google Scholar]
  25. Islam, S.M.; Yam, K.G.; Shah, A.L.; Singh, U.; Sarkar, M.I.U.; Satter, M.A.; Sanabria, J.; Biswas, J.C. Rice yields and nitrogen use efficiency with different fertilizers and water management under intensive lowland rice cropping systems in Bangladesh. Nutr. Cycl. Agroecosyst. 2016, 106, 143–156. [Google Scholar] [CrossRef]
  26. Bodisrsky, B.L.; Popp, A.; Lotze-Campen, H.; Dietrich, J.P.; Rolinski, S.; Weindl, I.; Schmitz, C.; Muller, C.; Bonsch, M.; Humpenöder, F.; et al. Reactive nitrogen requirements to feed the world in 2050 and potential to mitigate nitrogen pollution. Nat. Commun. 2014, 5, 3858. [Google Scholar] [CrossRef] [PubMed] [Green Version]
  27. Lu, C.; Tian, H. Global nitrogen and phosphorus fertilizer use for agriculture production in the past half century: Shifted hot spots and nutrient imbalance. Earth Syst. Sci. Data 2017, 9, 181–192. [Google Scholar] [CrossRef] [Green Version]
  28. Myhre, G.; Shindell, D.; Bréon, F.M.; Collins, W.; Fuglestvedt, J.; Huang, J.; Koch, D.; Lamarque, J.F.; Lee, D.; Mendoza, B.; et al. Anthropogenic and natural radiative forcing, In Climate Change 2013: The Physical Science Basis, Contribution of Working Group to the Fifth Assessment Report of the Intergovernmental Panel on Climate Change; Stocker, T.F., Qin, D., Plattner, G.K., Tignor, M., Allen, S.K., Boschung, J., Nauels, A., Xia, Y., Bex, V., Midgley, P.M., Eds.; Cambridge University Press: Cambridge, UK; New York, NY, USA, 2013. [Google Scholar]
  29. Manisalidis, I.; Stavropoulou, E.; Stavropoulos, A.; Bezirtzoglou, E. Environmental and health impacts of air pollution: A review. Front. Public Health 2020, 8, 14. [Google Scholar] [CrossRef] [PubMed] [Green Version]
  30. Wolfe, A.H.; Patz, J.A. Reactive nitrogen and human health: Acute and long-term implications. AMBIO J. Hum. Environ. 2002, 31, 120–125. [Google Scholar] [CrossRef]
  31. Gheorghe, I.F.; Ion, B. The effects of air pollutants on vegetation and the role of vegetation in reducing atmospheric pollution. In The Impact of Air Pollution on Health, Economy, Environment and Agricultural Sources; Khallaf, M.K., Ed.; InTech: Rijeka, Croatia, 2011; pp. 241–280. [Google Scholar]
  32. Fangmeier, A.; Hadwiger-Fangmeier, A.; Van der Eerden, L.; Jager, H.J. Effects of atmospheric ammonia on vegetation—A review. Environ. Pollut. 1994, 86, 43–82. [Google Scholar] [CrossRef]
  33. FAOSTAT. Agriculture Statistics from 1961–2017 FAODATA Statistics. 2019. Available online: http://www.fao.org/faostat/en/#data (accessed on 15 March 2019).
  34. BBS. Statistical Year Book of Bangladesh; Statistics Division, Bangladesh Bureau of Statistics, Ministry of Planning, The Government of Peoples Republic of Bangladesh: Dhaka, Bangladesh, 2018.
  35. IFASTAT. International Fertilizer Association. 2019. Available online: https://www.ifastat.org/databases/plant-nutrition (accessed on 12 February 2019).
  36. AIS. Agriculture Information Services; Department of Agriculture Extension, Ministry of Agriculture, Government of Bangladesh: Dhaka, Bangladesh, 2016.
  37. BBS. Statistical Year Book of Bangladesh; Statistics Division, Bangladesh Bureau of Statistics, Ministry of Planning, The Government of Peoples Republic of Bangladesh: Dhaka, Bangladesh, 2016.
  38. Bangladesh Unnayan Onneshan. Future Fertilizer Demand for Sustaining Rice Production in Bangladesh: A Quantitative Analysis. Unnayan Onneshan-The Innovators 16/2, Indira Road, Farmgate, Dhaka-1215, Bangladesh. 2018. Available online: http://www.unnayan.org/reports/Livelihood/future_fertilizer_demand.pdf (accessed on 15 April 2018).
  39. Shah, A.L.; Rahman, M.S.; Aziz, M.A. Outlook for fertilizer consumption and food production in Bangladesh. Bangladesh J. Agric. Environ. 2008, 4, 9–26. [Google Scholar]
  40. Raun, W.R.; Johnson, G.V. Improving nitrogen use efficiency for cereal production. Agron. J. 1999, 91, 357–363. [Google Scholar] [CrossRef] [Green Version]
  41. Husan, M.R.; Islam, M.R.; Faried, K.; Mian, M.H. Nitrogen use efficiency and rice yield as influenced by the application of prilled urea and urea super granule with or without organic manure. J. Bangladesh Agric. Univ. 2014, 12, 37–43. [Google Scholar] [CrossRef] [Green Version]
  42. FAO. Global Estimates of Gaseous Emissions of NH3, NO and N2O from Agricultural Land, 1st ed.; FAO and IFA: Rome, Italy, 2001; p. 105. [Google Scholar]
  43. Xu, R.T.; Pan, S.F.; Chen, J.; Chen, G.S.; Yang, J.; Dangal, S.R.S.; Shepard, J.P.; Tian, H.Q. Half-century ammonia emissions from agricultural systems in Southern Asia: Magnitude, spatiotemporal patterns, and implications for human health. GeoHealth 2018, 2, 40–53. [Google Scholar] [CrossRef]
  44. Climatewatch. Historical GHG Emission. Available online: https://www.climatewatchdata.org/ghg-emissions?end_year=2018&start_year=1990 (accessed on 12 May 2021).
  45. Mamun-Ur-Rashid, M.; Belton, B.; Phillips, M.; Rosentrater, K.A. Improving Aquaculture Feed in Bangladesh: From Feed Ingredients to Farmer Profit to Safe Consumption; World Fish: Penang, Malaysia, 2013; pp. 2013–2034. [Google Scholar]
  46. DoF. Fisheries Statistical Yearbook of Bangladesh, 2017–2018; Fisheries Resources Survey System (FRSS), Department of Fisheries, Ministry of Fisheries: Dhaka, Bangladesh, 2018; Volume 35, p. 129.
  47. Hossain, T. Grain and Feed Annual: Bangladesh; Gain Report, BG 1803; Global Agricultural Information Network, USDA Foreign Agricultural Services: Washington, DC, USA, 2018.
  48. Roy, K.; Vrba, J.; Kaushik, S.J.; Mraz, J. Nutrient footprint and ecosystem services of carp production in European fishponds in contrast to EU crop and livestock sectors. J. Clean. Prod. 2020, 270, 122268. [Google Scholar] [CrossRef]
  49. Timmons, M.B.; Ebeling, J.M.; Wheaton, F.W.; Summerfelt, S.T.; Vinci, B.J. Recirculating Aquaculture Systems, 2nd ed.; Cayuga Aqua Ventures LLC: New York, NY, USA, 2002.
  50. Williams, J.; Crutzen, P.J. Nitrous oxide from aquaculture. Nat. Geosci. 2010, 3, 143. [Google Scholar] [CrossRef]
  51. Hedrick, H.B.; Judge, M.D.; Merkel, R.A.; Aberle, E.D.; Forrest, J.C.; Gerrard, D.E.; Mills, E.W. Principles of Meat Science, 4th ed.; Kendall/Hunt Pub. Co.: Dubuque, IA, USA, 2001; Available online: https://www.textbooks.com/Principles-of-Meat-Science-4th-Edition/9780787247201/Hedrick-Judge-Merkel-Aberle-Forrest-Gerrard-and-Mills.php (accessed on 17 August 2020).
  52. Sheldrick, W.; Syers, J.K.; Lingard, J. Contribution of livestock excreta to nutrient balances. Nutr. Cycl. Agroecosyst. 2003, 66, 119–131. [Google Scholar] [CrossRef]
  53. Raza, S.; Zhou, J.; Aziz, T.; Afzal, M.R.; Ahmed, M.; Javaid, S.; Chen, Z. Piling up reactive nitrogen and declining nitrogen use efficiency in Pakistan: A challenge not challenged (1961–2013). Environ. Res. Lett. 2018, 13, 034012. [Google Scholar] [CrossRef]
  54. Bouwman, A.F.; Lee, D.S.; Asman, W.A.H.; Dentener, F.J.; van Der Hoek, K.W.; Oliver, J.G.J. A global high-resolution emission inventory for ammonia. Glob. Biogeochem. Cycles 1997, 11, 561–587. [Google Scholar] [CrossRef]
  55. Liu, J.G.; You, L.Z.; Amini, M.; Obersteiner, M.; Herrero, M.; Zehnder, A.J.B.; Yang, H. A high-resolution assessment on global nitrogen flows in cropland. Proc. Natl. Acad. Sci. USA 2010, 107, 8035–8040. [Google Scholar] [CrossRef] [PubMed] [Green Version]
  56. Bouwman, A.; Boumans, L.; Batjes, N. Estimation of global NH3 volatilization loss from inorganic fertilizers and mineral manure applied to arable lands and grasslands. Glob. Biogeochem. Cycles 2002, 16, 8.1–8.15. [Google Scholar] [CrossRef]
  57. FRG. Fertilizer Recommendation Guide (FRG); Bangladesh Agricultural Research Council (BARC): Dhaka, Bangladesh, 2012; p. 274.
  58. BFA. Bangladesh Fertilizer Association. Al-Razi Complex (5th Floor), 166–167, Shaheed Syed Nazrul Islam Sarani, Purna Paltan, Dhaka 1000, Bangladesh. 2019. Available online: https://www.bfa-fertilizer.org/ (accessed on 21 December 2021).
  59. FAO. World Fertilizer Trends and Outlook to 2018; Food and Agriculture Organization of the United Nations: Rome, Italy, 2015. [Google Scholar]
  60. Alam, M.A.; Rahman, M.M.; Biswas, J.C.; Akhter, S.; Maniruzzaman, M.; Choudhury, A.K.; Jahan, A.B.M.S.; Miah, M.M.U.; Sen, R.; Kamal, M.Z.U.; et al. Nitrogen transformation and carbon sequestration in wetland paddy field of Bangladesh. Paddy Water Environ. 2019, 17, 677–688. [Google Scholar] [CrossRef]
  61. Weil, R.R.; Brady, N.C. The Natures and Properties of Soils, 15th ed.; Pearson: New York, NY, USA, 2016; p. 1104. [Google Scholar]
  62. Islam, M.S. Soil Management in Agricultural Research in Bangladesh; Bangladesh Agricultural Research Council: Dhaka, Bangladesh, 1983; pp. 105–109.
  63. Wortmann, C.S.; Tarkalson, D.D.; Shapiro, C.A.; Dobermann, A.R.; Ferguson, R.B.; Hergert, G.W.; Walters, D. Nitrogen use efficiency of irrigated corn for three cropping systems in Nebraska. Agron. J. 2011, 103, 76–84. [Google Scholar] [CrossRef] [Green Version]
  64. Li, J.; Shi, Y.; Luo, J.; Zaman, M.; Houlbrooke, D.; Ding, W.; Ledgard, S.; Ghani, A. Use of nitrogen process inhibitors for reducing gaseous nitrogen losses from land-applied farm effluents. Biol. Fertil. Soils 2014, 50, 133–145. [Google Scholar] [CrossRef]
  65. Islam, M.S.; Uddin, M.K.; Tareq, S.M.; Shammi, M.; Kamal, A.K.I.; Sugano, T.; Kurasaki, M.; Saito, T.; Tanaka, S.; Kuramitz, H. Alteration of water pollution level with the seasonal changes in mean daily discharge in three main rivers around Dhaka city, Bangladesh. Environments 2015, 2, 280–294. [Google Scholar] [CrossRef] [Green Version]
  66. Barman, B.K.; Karim, M. Analysis of feeds and fertilizers for sustainable aquaculture development in Bangladesh. In Study and Analysis of Feeds and Fertilizers for Sustainable Aquaculture Development; Hasan, M.R., Hecht, T., de Silva, S.S., Tacon, A.G.J., Eds.; FAO Fisheries Technical Paper. No. 497; FAO: Rome, Italy, 2007; pp. 113–140. [Google Scholar]
  67. NACA. Integrated Fish Farming in China; NACA Technical Manual 7; A World Food Day Publication of the Network of Aquaculture Centres in Asia and the Pacific: Bangkok, Thailand, 1989; p. 278. [Google Scholar]
  68. Ali, H.; Haque, M.M.; Belton, B. Striped catfish (Pangasianodon hypophthalmus, Sauvage, 1878) aquaculture in Bangladesh: An overview. Aquac. Res. 2013, 44, 950–965. [Google Scholar] [CrossRef]
  69. Rahman, M.M. Evaluation of Mixed Feeding Schedule with Varying Dietary Protein Content on the Growth Performance and Reduction of Cost of Production for Pangas with Silver Carp. Master’s Thesis, Department of Aquaculture, Bangladesh Agricultural University, Mymensingh, Bangladesh, 2004. [Google Scholar]
  70. Rahman, M.M.; Yakupitiyage, A.; Ranamukhaarchchi, S.L. Agricultural use of fish pond sediment for environmental amelioration. Thammassat Int. J. Sci. Technol. 2004, 9, 1–10. [Google Scholar]
  71. Anh, P.T.; Kroeze, C.; Bush, S.R.; Mol, A.P.J. Water pollution by Pangasius production in the Mekong Delta, Vietnam: Causes and options for control. Aquac. Res. 2010, 42, 108–128. [Google Scholar] [CrossRef]
  72. Yuan, J.; Xiang, J.; Liu, D.; Kang, H.; He, T.; Kim, S.; Lin, Y.; Freeman, C.; Ding, W. Rapid growth in greenhouse gas emissions from the adoption of industrial-scale aquaculture. Nat. Clim. Chang. 2019, 9, 318–322. [Google Scholar] [CrossRef]
  73. Huque, K.S.; Sarker, N.R. Feeds and feeding of livestock in Bangladesh: Performance, constraints and options forward. Bangladesh J. Anim. Sci. 2014, 43, 1–10. [Google Scholar] [CrossRef] [Green Version]
  74. BBS. Statistical Year Book of Bangladesh; Statistics Division, Bangladesh Bureau of Statistics, Ministry of Planning, The Government of Peoples Republic of Bangladesh: Dhaka, Bangladesh, 2012.
  75. Galloway, J.N.; Cowling, E.B. Reactive nitrogen and the world: 200 years of change. AMBIO J. Hum. Environ. 2002, 31, 64–71. [Google Scholar] [CrossRef]
  76. Erisman, J.W.; Galloway, J.N.; Dies NBSutton, M.A.; Bleeker, A.; Grizzetti, B.; Leach, A.M.; de Vries, W. Nitrogen: Too Much of a Vital Resource; Science Brief; WWF: Zeist, The Netherlands, 2015. [Google Scholar]
Figure 1. Trends in N production, consumption, import, and excess or deficit in Bangladesh since 1960–1965 to 2015–2019. Data compiled from different sources [20,33,34,35].
Sustainability 14 00272 g001
Figure 2. Major crops, area, production, and their yields in 2016–2017 in Bangladesh [10].
Sustainability 14 00272 g002
Figure 3. Present and future N demand (a), and its apparent recovery efficiency (b) in rice production in Bangladesh. Produced using data from different sources [20,36,37,38].
Sustainability 14 00272 g003
Figure 4. Apparent recovery and agronomic efficiency of N fertilizer of major crops in Bangladesh.
Sustainability 14 00272 g004
Figure 5. Reactive N (Nr) production in Bangladesh: (a) N fertilizer application, (b) crop residues, burning crop residues and grasses, (c) cultivation of organic soils, and (d) crop and livestock production and management. Raw data for (ac) were taken from FAOSTAT [33] and IFASTAT [35], and for (d) from Climatewatch [44].
Sustainability 14 00272 g005
Figure 6. Non-CO2 GHG emission from crop and livestock production and management in Bangladesh in 2018. Raw data were obtained from Climatewatch [44].
Sustainability 14 00272 g006
Figure 7. Fish feed and nitrogen in pond aquaculture: (a) Production of total feed, and (b) Nr production upon application to ponds in Bangladesh during 2008 to 2017 (modified from Mamun-Ur-Rashid et al. [45] and DoF [46]).
Sustainability 14 00272 g007
Figure 8. Nitrogen and Nr production from manure in Bangladesh from 1961 to 2017: (a) N in manure, and N in crop land from manure, (b) Nr from manure, and (c) N2O from manure management and manure to pasture (raw data from FAOSTAT [33]).
Sustainability 14 00272 g008
Table 1. Nitrogen budget in tilapia ponds under different inputs in Bangladesh.
ParameterN Input/Output in Tilapia Ponds (kg)
UreaUrea + Poultry ManureFeed
Inputs:
Fertilizers10.0010.0010.00
Feed--3.53
Manure-3.22-
Outputs:
Fish0.891.452.95
Recovery (%)8.9010.9721.80
Table 2. Livestock resources (million) in Bangladesh (1949–2017).
Livestock ResourcesYearGrowth Rate (%)
19491960197719841996200820112017
Bovine (cattle, buffaloes, horses)16.3721.10520.5822.0622.2926.2225.8025.400.53
Sheep, goats4.276.149.15514.2214.6117.6217.3229.332.31
Poultry (fowls and ducks)25.2220.1047.5273.71126.67137.24135.10329.202.39
Source: AIS [10], Rahman et al. [70], and BBS [74].
Publisher’s Note: MDPI stays neutral with regard to jurisdictional claims in published maps and institutional affiliations.

