3.2. Wetland Change Detection
The accurate change detection of land cover’s features is critical for understanding the differences over time and to know the relationships between human activities and natural phenomena. To distinguish the long-term and spatiotemporal dynamics of wetlands, change detection is required [
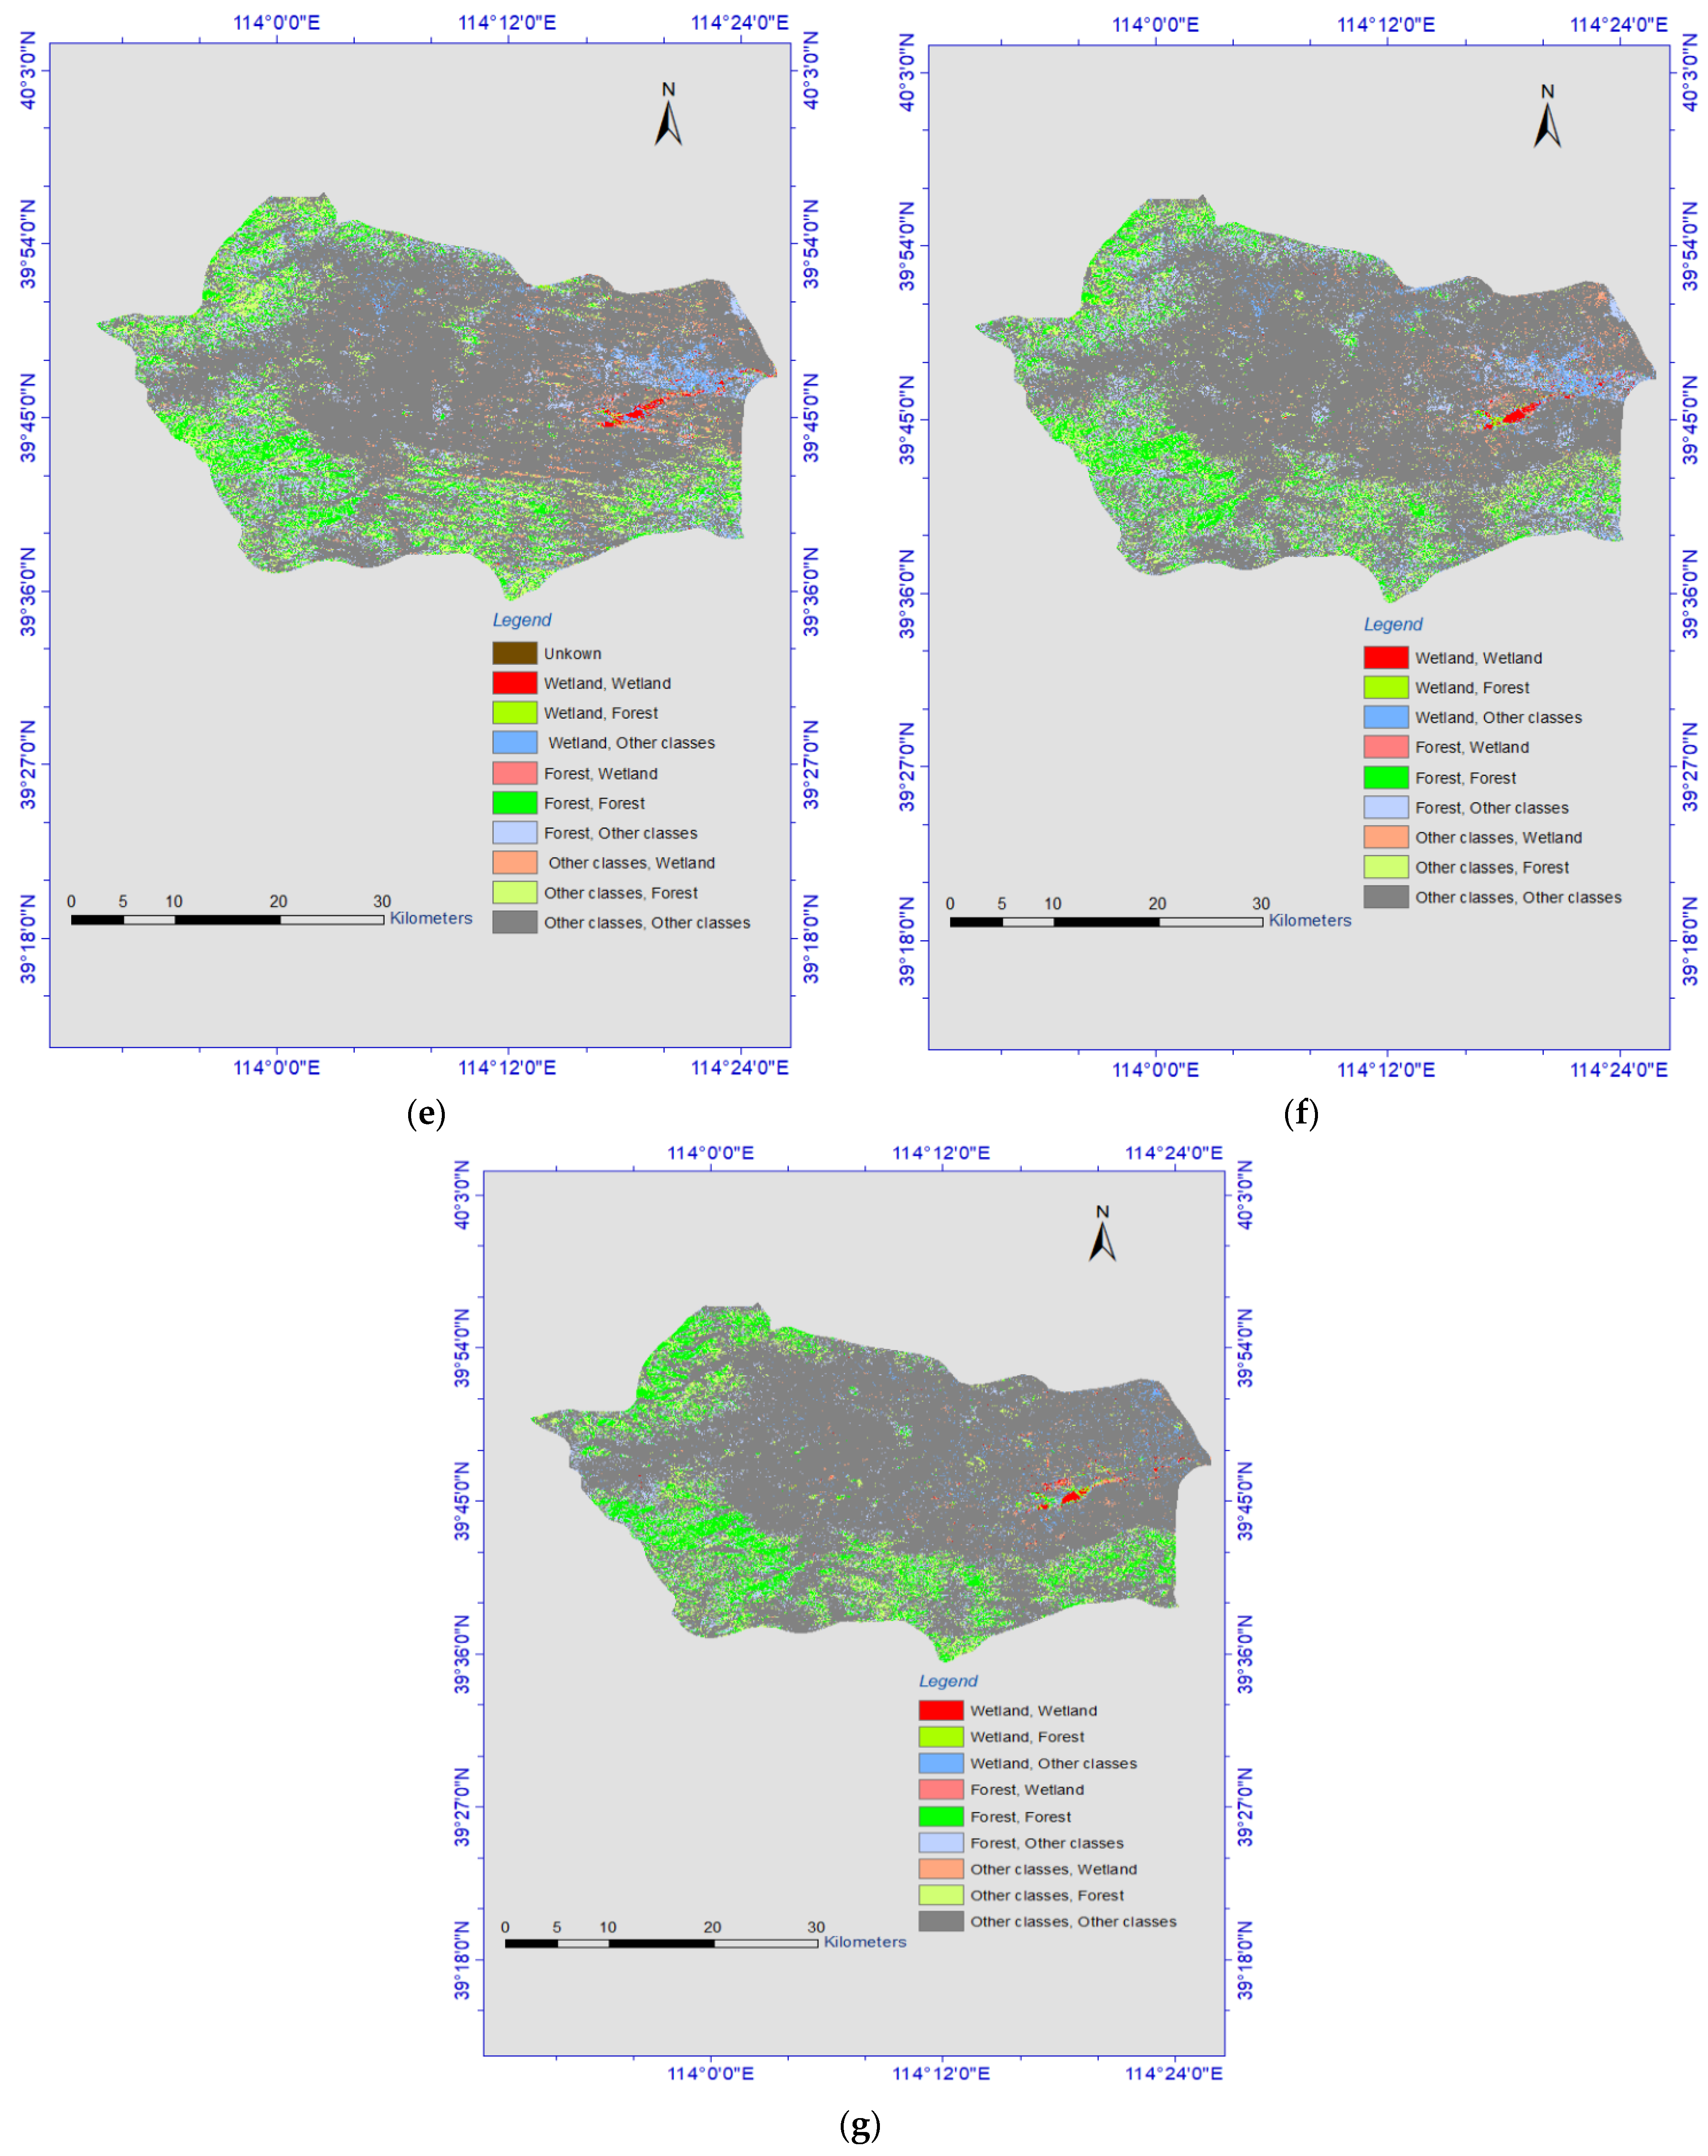
48]. Post classification process, change detection was implemented in GEE based on the land cover classification results of time series data. Because knowing how many pixels are converted to other classes can decide the spatial distribution of wetland resources and their changes over long adjacent periods, GEE can be used for simple tasks, such as creating composites of satellite imagery, but can also handle more complex tasks, such as detecting long-term dynamics of things. Based on performance evaluations of the five algorithms implemented on GEE, we chose SVM to detect changes in classes for each year, because it offered better classification accuracy than the other classifiers. Change detection was performed from 1984 to 2020 at 5-year intervals.
Figure 3 and
Figure 4 show the eight land cover change maps generated, (1984–1990, 1990–1995, 1995–2000, 2000–2005, 2005–2010, 2010–2015, and 2015–2020).
Land cover change trends were obtained from the SVM-RBF model (
Figure 4 and
Figure 5). As presented in
Table 7, the change trends shown in
Figure 4 are defined and calculated in terms of pixels change of each class.
Of all land classes change over the past 3.7 decades,
Figure 5 and
Table 8 reveal the critical land features change was observed from 1984 to 2020. Wetland conversion to other classes has undergone the greatest change and the maximum wetland loss recorded. As shown in
Figure 6, the wetland change trends over the past 3.7 decades were identified in this study in terms of square kilometers.
3.3. Climate Variation and Wetland Change
The most common characteristics of weather or climatic variables include temperature, precipitation or rainfall, sunshine, wind, atmospheric pressure, and humidity. The values and fluctuations of these climatic variables can easily affect the spatial extent and distribution of wetlands. Precipitation, temperature, and humidity are the most common factors. We investigated the linkages between precipitations, temperature, and relative humidity with wetland change. The climatic time-series data correlated with the corresponding wetland changes of the area using a linear relationship.
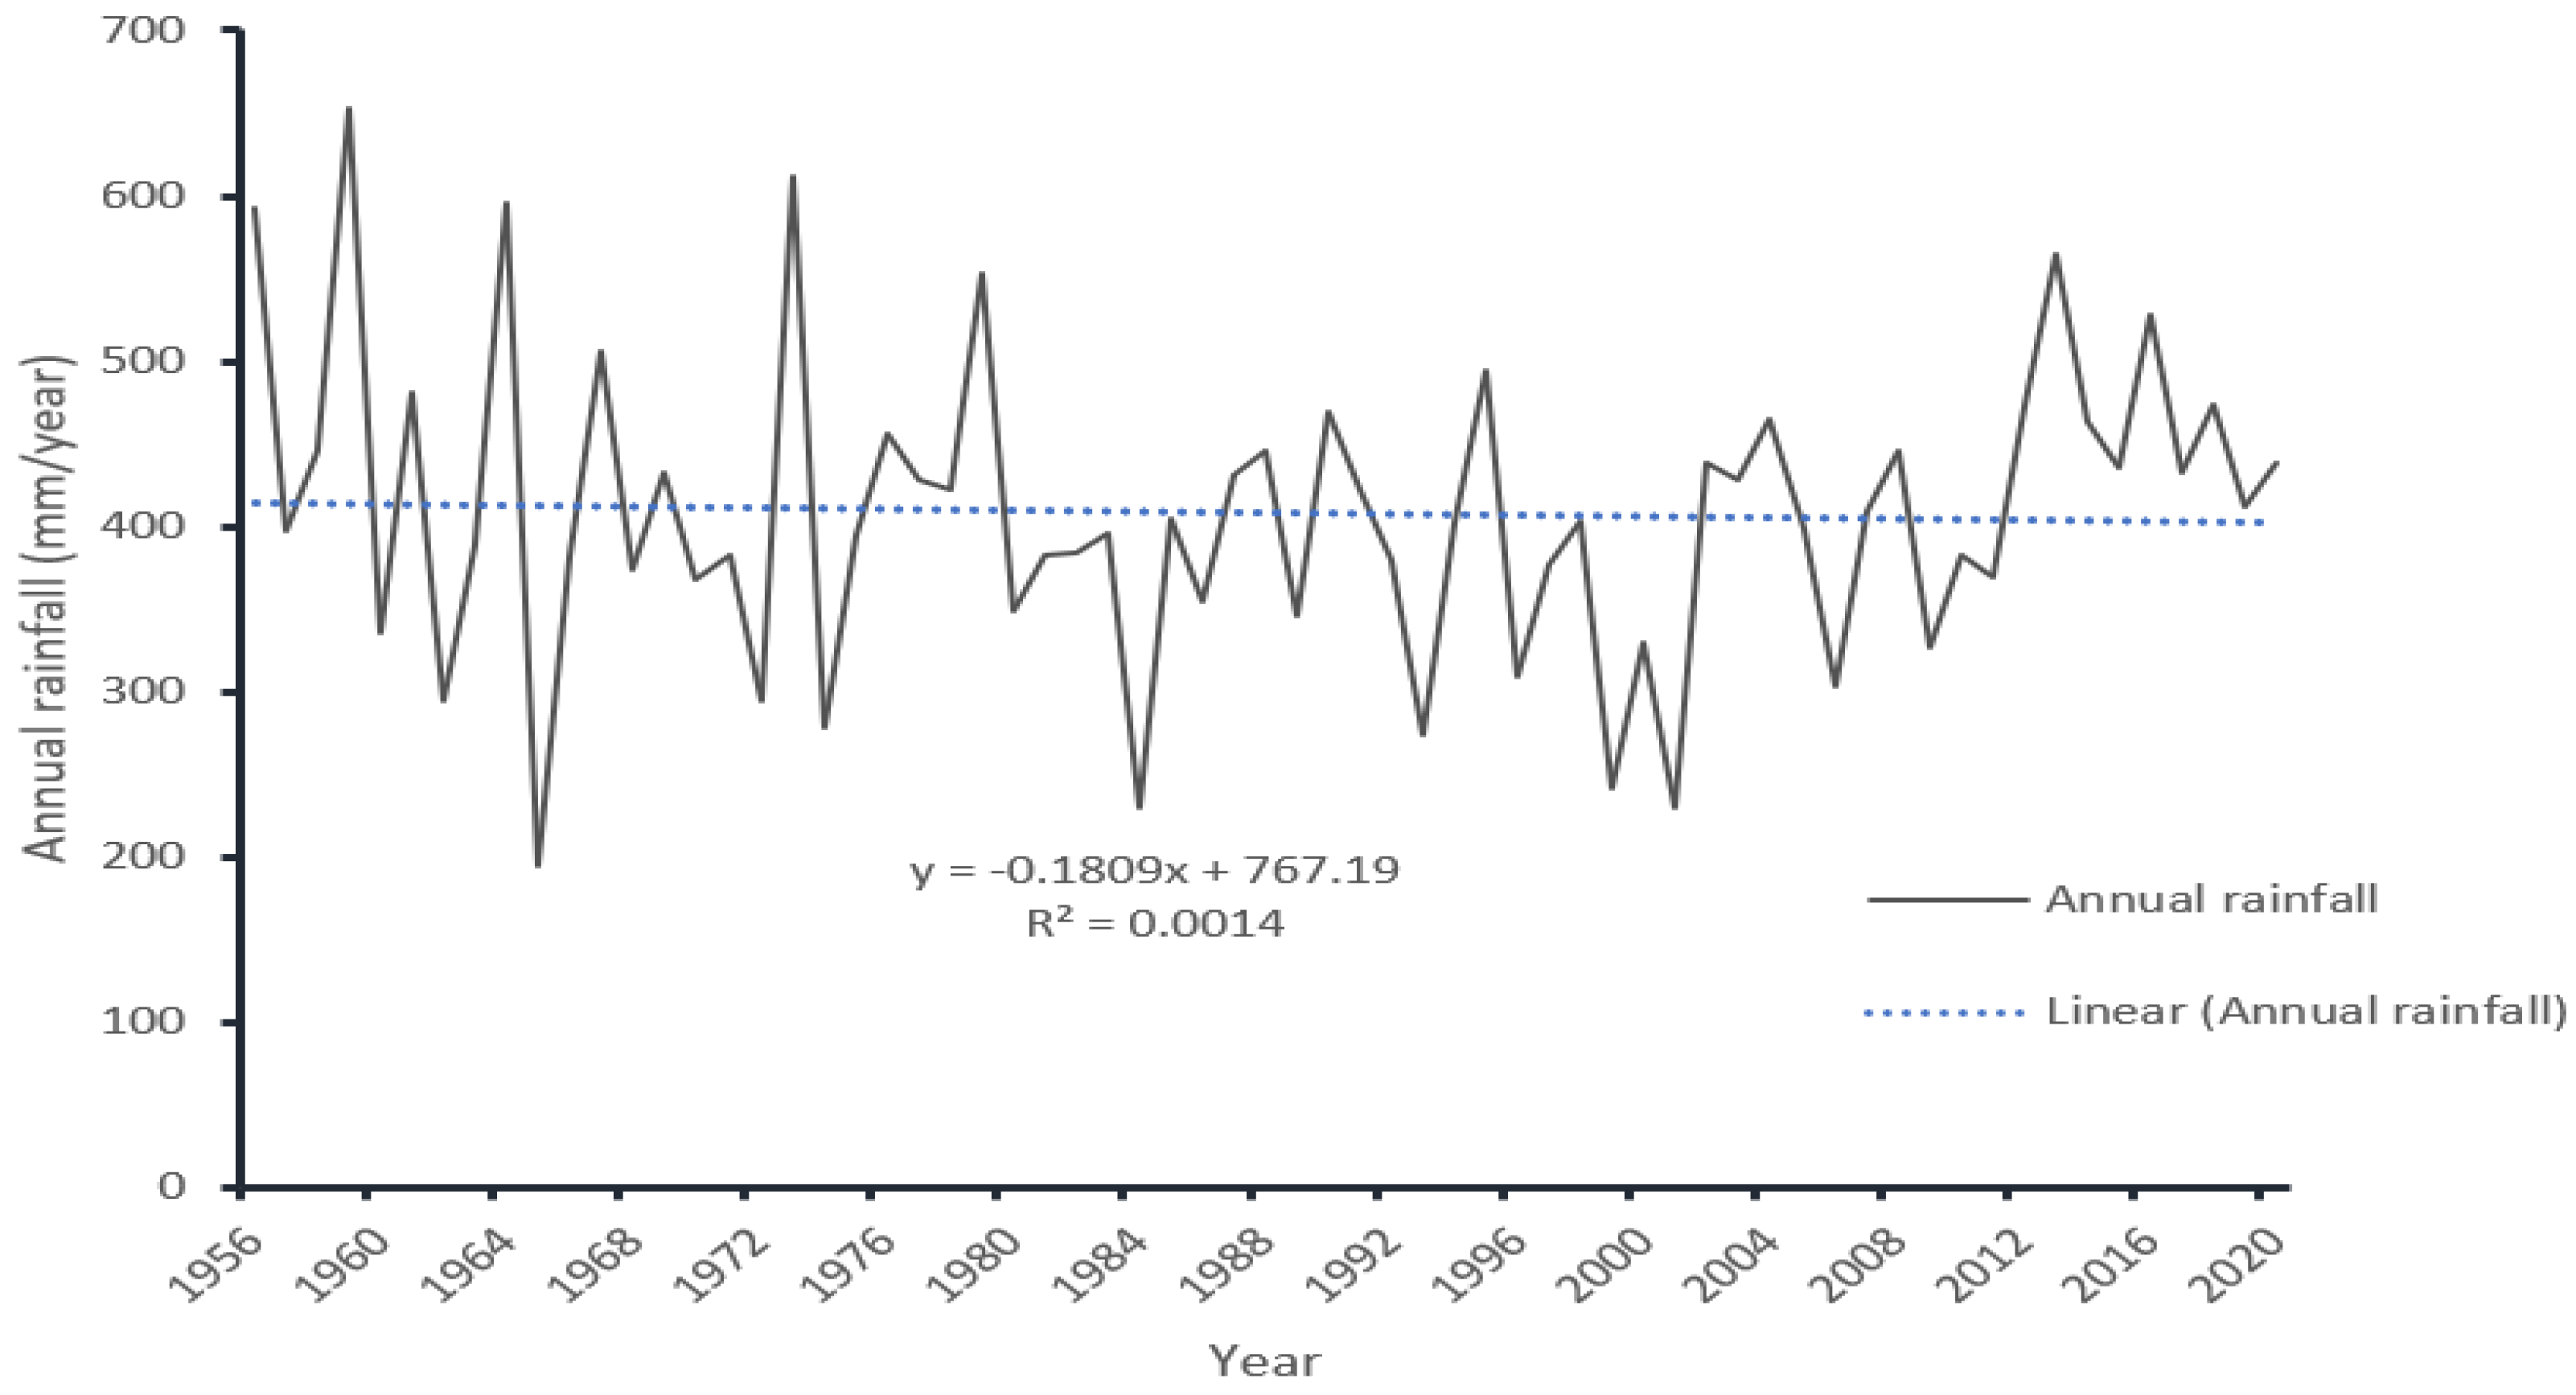
Precipitation time-series data (
Figure 7) for Guangling County were taken from meteorological data (1956–2020), and compared with time-series data calculated from freely available quasi global rainfall datasets; Climate Hazards Group InfraRed Precipitation with Station data (CHIRPS) was used in this study. The CHIRPS dataset builds on previous approaches by using “smart” interpolation techniques and high-resolution, long-term precipitation estimates based on infrared cold cloud duration (CCD) observations [
49].
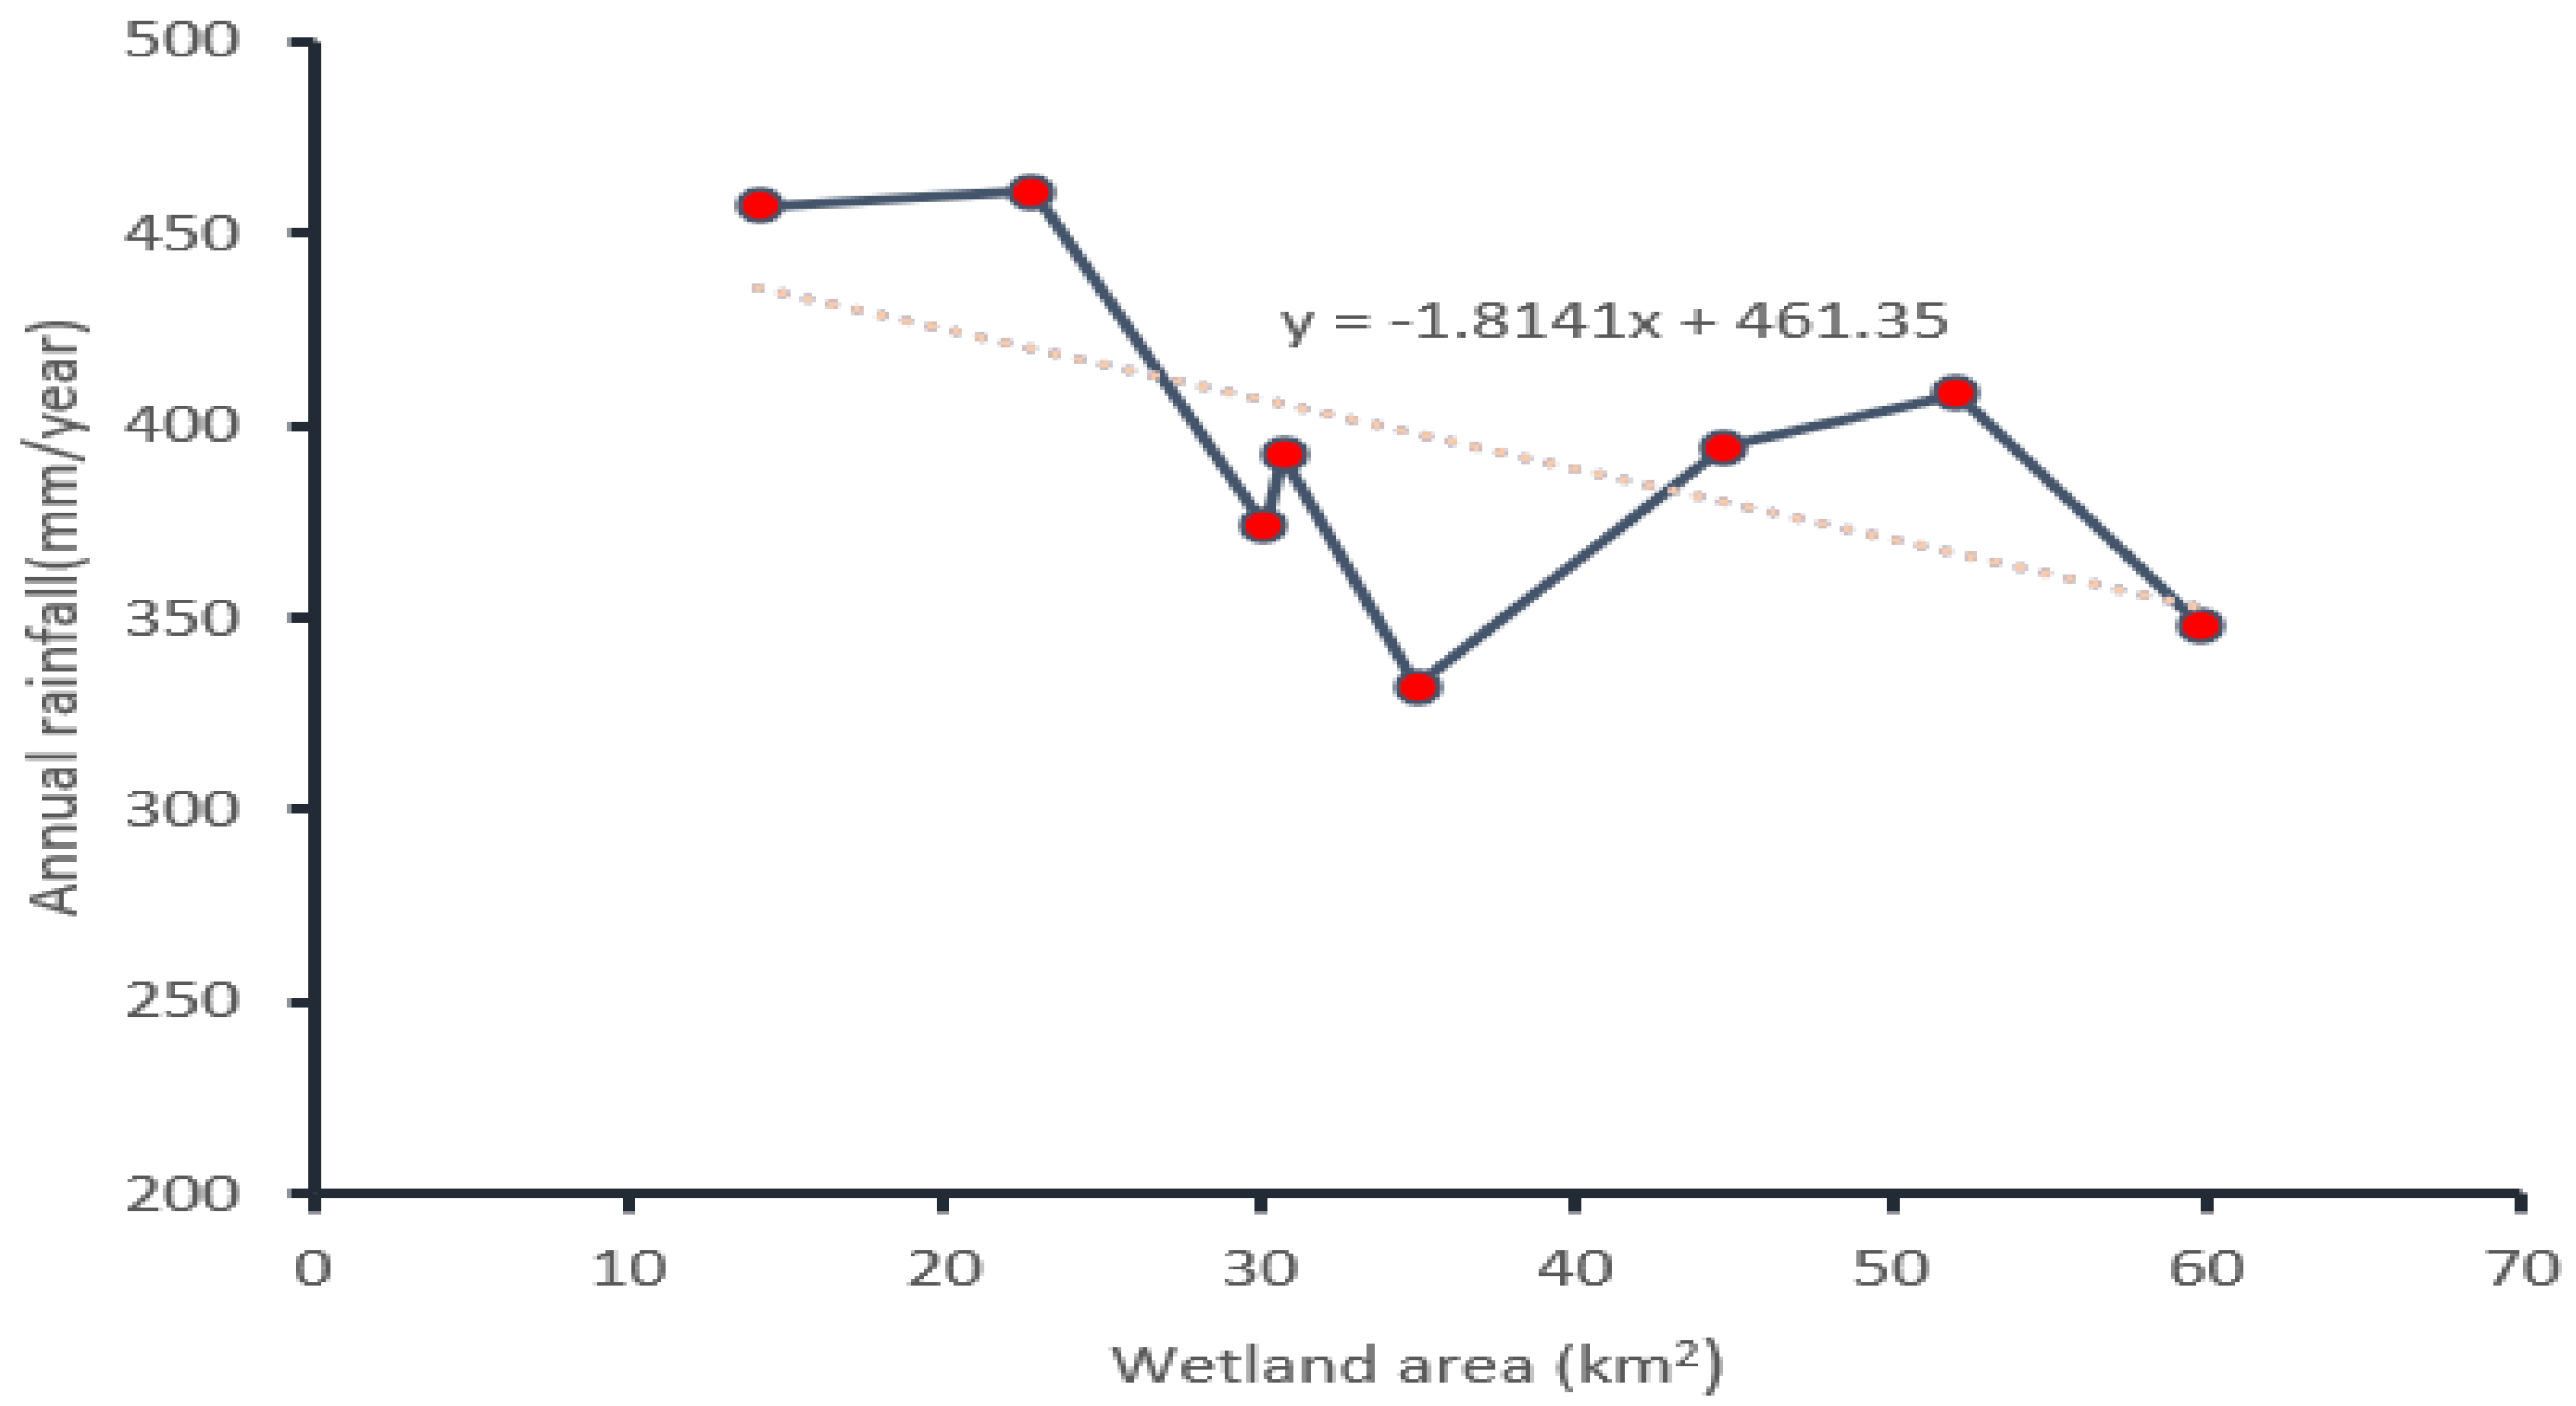
Figure 8 is showing the linear relation between inter-annual rainfall and the wetland area of Guangling County formulated from preceding year blocks of annual rainfall data corresponding to wetland distribution change in each of eight different years (1984, 1990, 1995, 2000, 2005, 2010, 2015, and 2020).
Temperature is the most influential variable, being strongly connected to the treatment of sustainable natural environments, particularly wetlands. As the current meteorological studies show climate variables are becoming one of the global problems, among them temperature is the most significant factor showing increments.
The highest increment of annual average temperature was approximately 2.4 °C (1995–2020), which had the greatest negative impact on wetland loss.
Figure 9 shows the continuous variation trend of the annual average temperature of the study area, 1981–2020. The trendline reveals that the annual average temperature rises in Guangling County. In the past 3.7 decades, on average it was risen by 0.75 °C with the value of R
2 14.24%.
A linear relationship with wetland area shown in the figure below (
Figure 10), which was calculated from the preceding year blocks of annual average temperature data corresponding to wetland distribution change in each of eight different years (1984, 1990, 1995, 2000, 2005, 2010, 2015, and 2020).
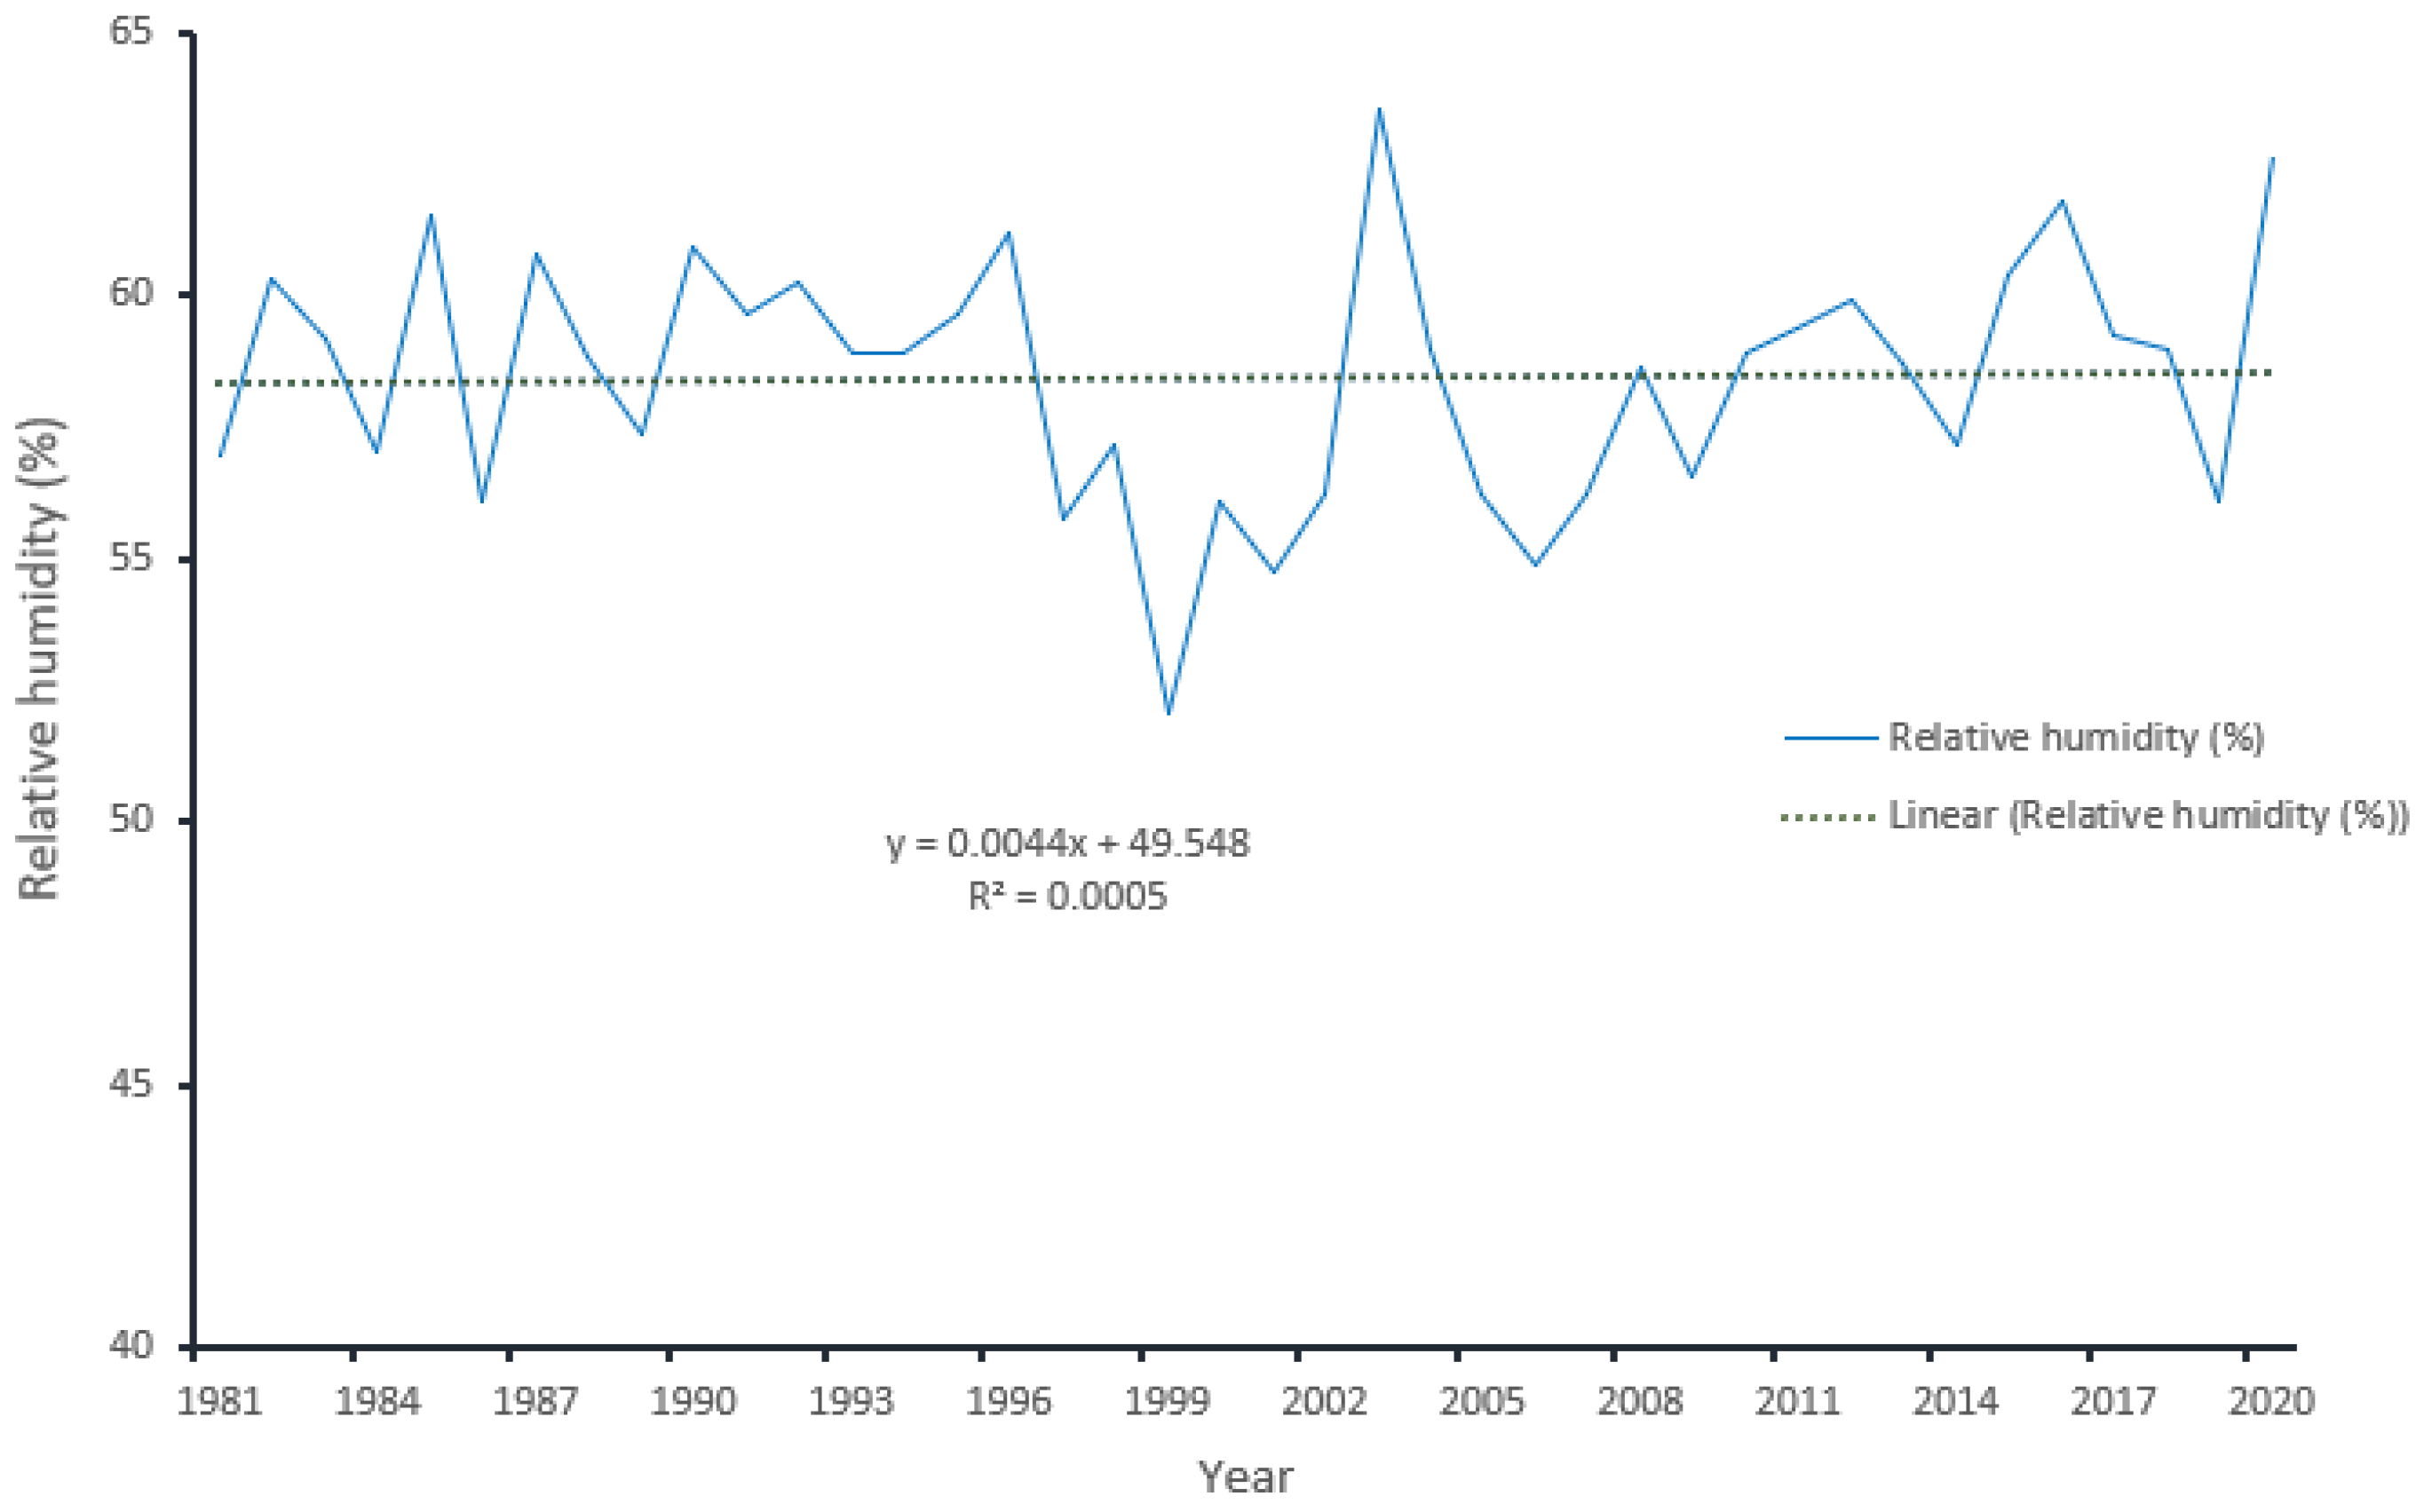
The relative humidity of Guangling County shows yearly fluctuations (
Figure 11). Humidity is the most significant climatic factor, closely tied to wetland changes [
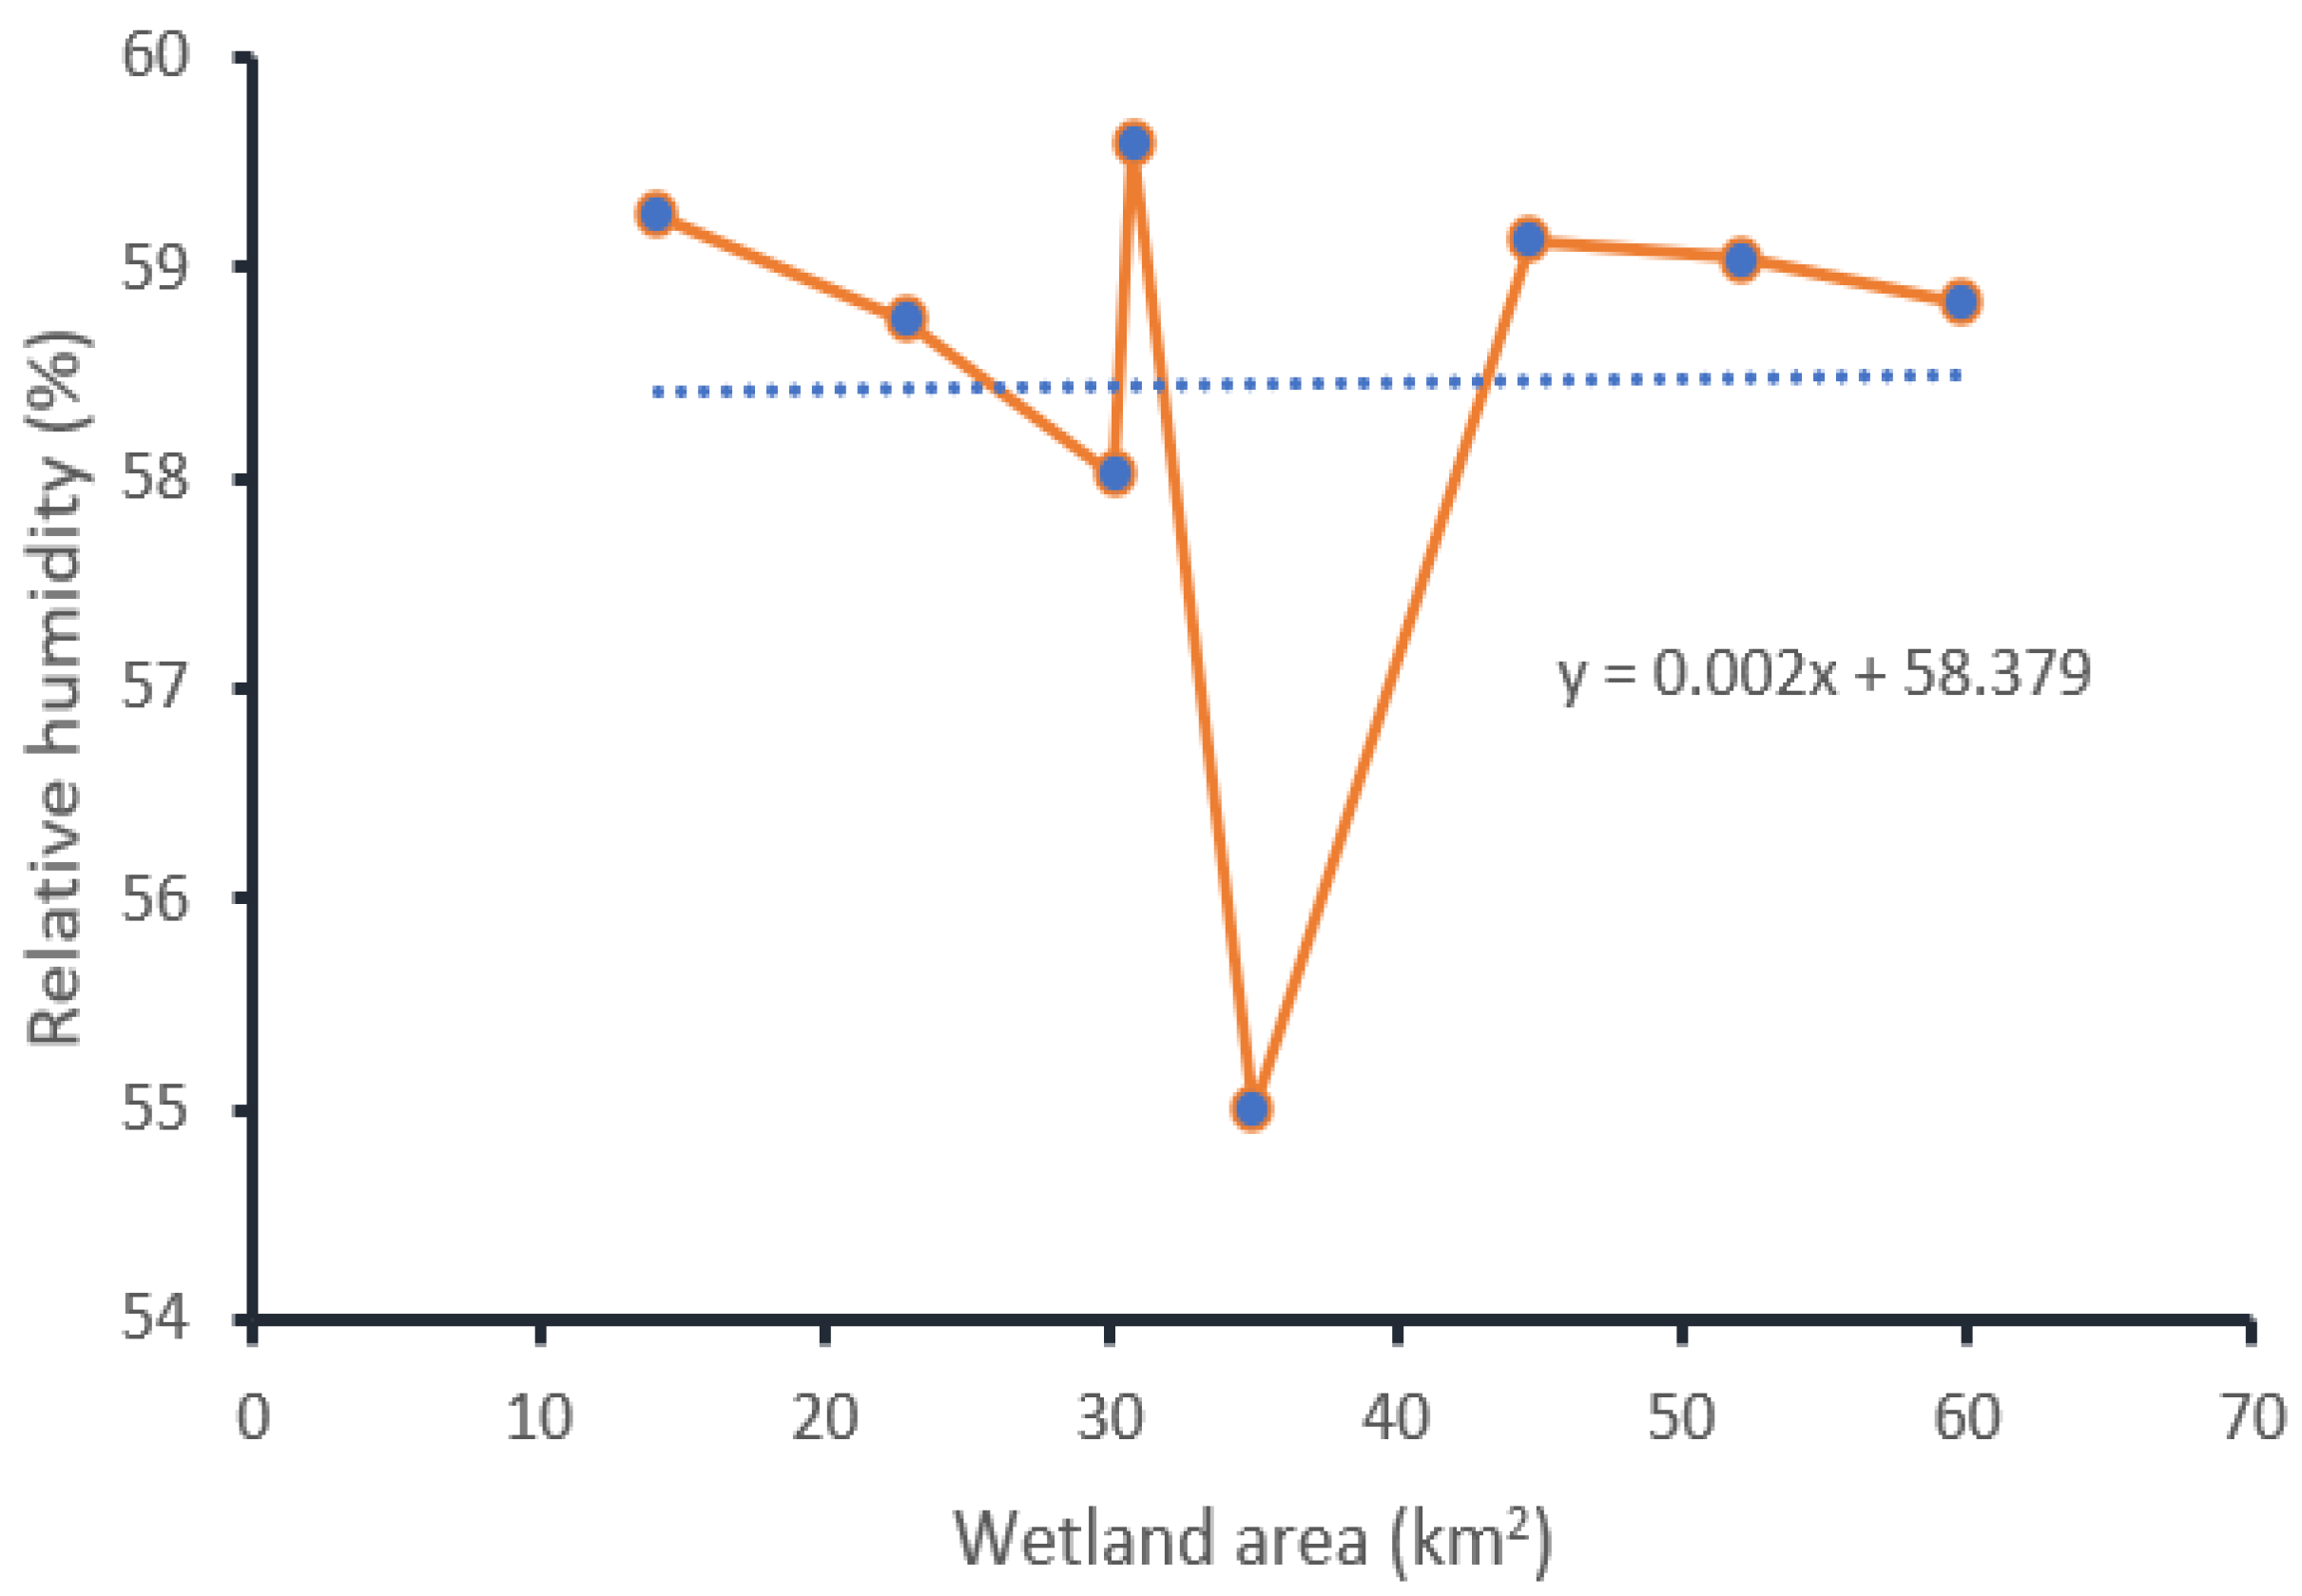
46]. The average humidity of the area decreased from the fitting trendline by 4.1% in which a significant amount of wetland resources was lost. To find the linear equation between relative humidity and change of wetland area, using a linear regression method we took the preceding year blocks of relative humidity data corresponding to wetland distribution change in each of eight different years (1984, 1990, 1995, 2000, 2005, 2010, 2015, and 2020) as shown in
Figure 12.
3.5. Grey Correlation Analysis
To calculate the Grey correlation of wetland area in Guangling County and corresponding climatic factors, meteorological data from various sources were used. We selected 4-year blocks of meteorological data—1981, 1982, 1983, and 1984 meteorological data sequence corresponding to wetland distribution data in 1984; 1987, 1988, 1989, and 1990 meteorological data sequence corresponding to wetland distribution data in 1990; 1992, 1993, 1994, and 1995 meteorological data sequence corresponding to wetland distribution data in 1995; 1997, 1998, 1999, and 2000 meteorological sequence data corresponding to wetland distribution data in 2000; 2002, 2003, 2004, and 2005 meteorological data sequence corresponding to wetland distribution data in 2005; 2007, 2008, 2009, and 2010 meteorological data corresponding to wetland distribution data in 2010; 2012, 2013, 2014, and 2015 meteorological data sequence corresponding to wetland data in 2015; and 2017, 2018, 2019, and 2020 meteorological data sequence corresponding to wetland distribution data in 2020 were used in Grey correlation analysis to calculate the correlation degree of climatic factors and wetland area after normalization and calculation of the mean value, along with relevant meteorological data sequence for the corresponding years of wetland distribution.
The values of grey correlation degree within each of 5-year intervals between climatic variables and wetland area are shown in
Table 9. The first line with the values of 0.667, 0.826, and 0.674 reports the degree of grey correlation between annual average temperature (1981–1984) and wetland area (1984), relative humidity (1981–1984) and wetland area (1984), annual rainfall (1981–1984) and wetland area (1984), respectively. The next line with the values of 0.546, 0.874, and 0.647 reports the degree of grey correlation between annual average temperature (1987–1990) and wetland area (1990), relative humidity (1987–1990) and wetland area (1990), annual rainfall (1987–1990) and wetland area (1990), respectively. Similarly, the third line with the values of 0.472, 0.783, and 0.516 reports the degree of grey correlation between annual average temperature (1992–1995) and wetland area (1995), relative humidity (1992–1995), and wetland area (1995), annual rainfall (1992–1995) and wetland area (1995), respectively. The fourth line with the values of 0.740, 0.406, and 0.406 reports the degree of grey correlation between annual average temperature (1997–2000) and wetland area (2000), relative humidity (1997–2000) and wetland area (2000), annual rainfall (1997–2000) and wetland area (2000), respectively. The fifth line with the values of 0.414, 0.590, and 0.515 reports the degree of grey correlation between annual average temperature (2002–2005) and wetland area (2005), relative humidity (2002–2005) and wetland area (2005), annual rainfall (2002–2005) and wetland area (2005), respectively. The sixth line with the values of 0.420, 0.480, and 0.438 reports the degree of grey correlation between annual average temperature (2007–2010) and wetland area (2010), relative humidity (2007–2010) and wetland area (2010), annual rainfall (2007–2010) and wetland area (2010), respectively. The seventh line with the values of 0.420, 0.603, and 0.691 reports the degree of grey correlation between annual average temperature (2012–2015) and wetland area (2015), relative humidity (2012–2015) and wetland area (2015), annual rainfall (2012–2015) and wetland area (2015), respectively. The last line with the values of 0.520, 0.617, and 0.478 reports the degree of grey correlation between annual average temperature (2017–2020) and wetland area (2020), relative humidity (2017–2020) and wetland area (2020), annual rainfall (2017–2020) and wetland area (2020), respectively.
Table 10 shows the Grey correlation degree between wetland area and climatic factors calculated using Equation (13).
Based on analysis of the grey correlation between wetland area and climatic variables, relative humidity, and wetland area has the highest degree of grey correlation than seen with annual rainfall and annual average temperature, whereas the correlation of annual average temperature has the smallest, indicating that wetland change was positively correlated to relative humidity and negatively correlated to annual average temperature (
Table 10). This means that the annual average temperature had a greater negative impact on wetlands resources of the area.
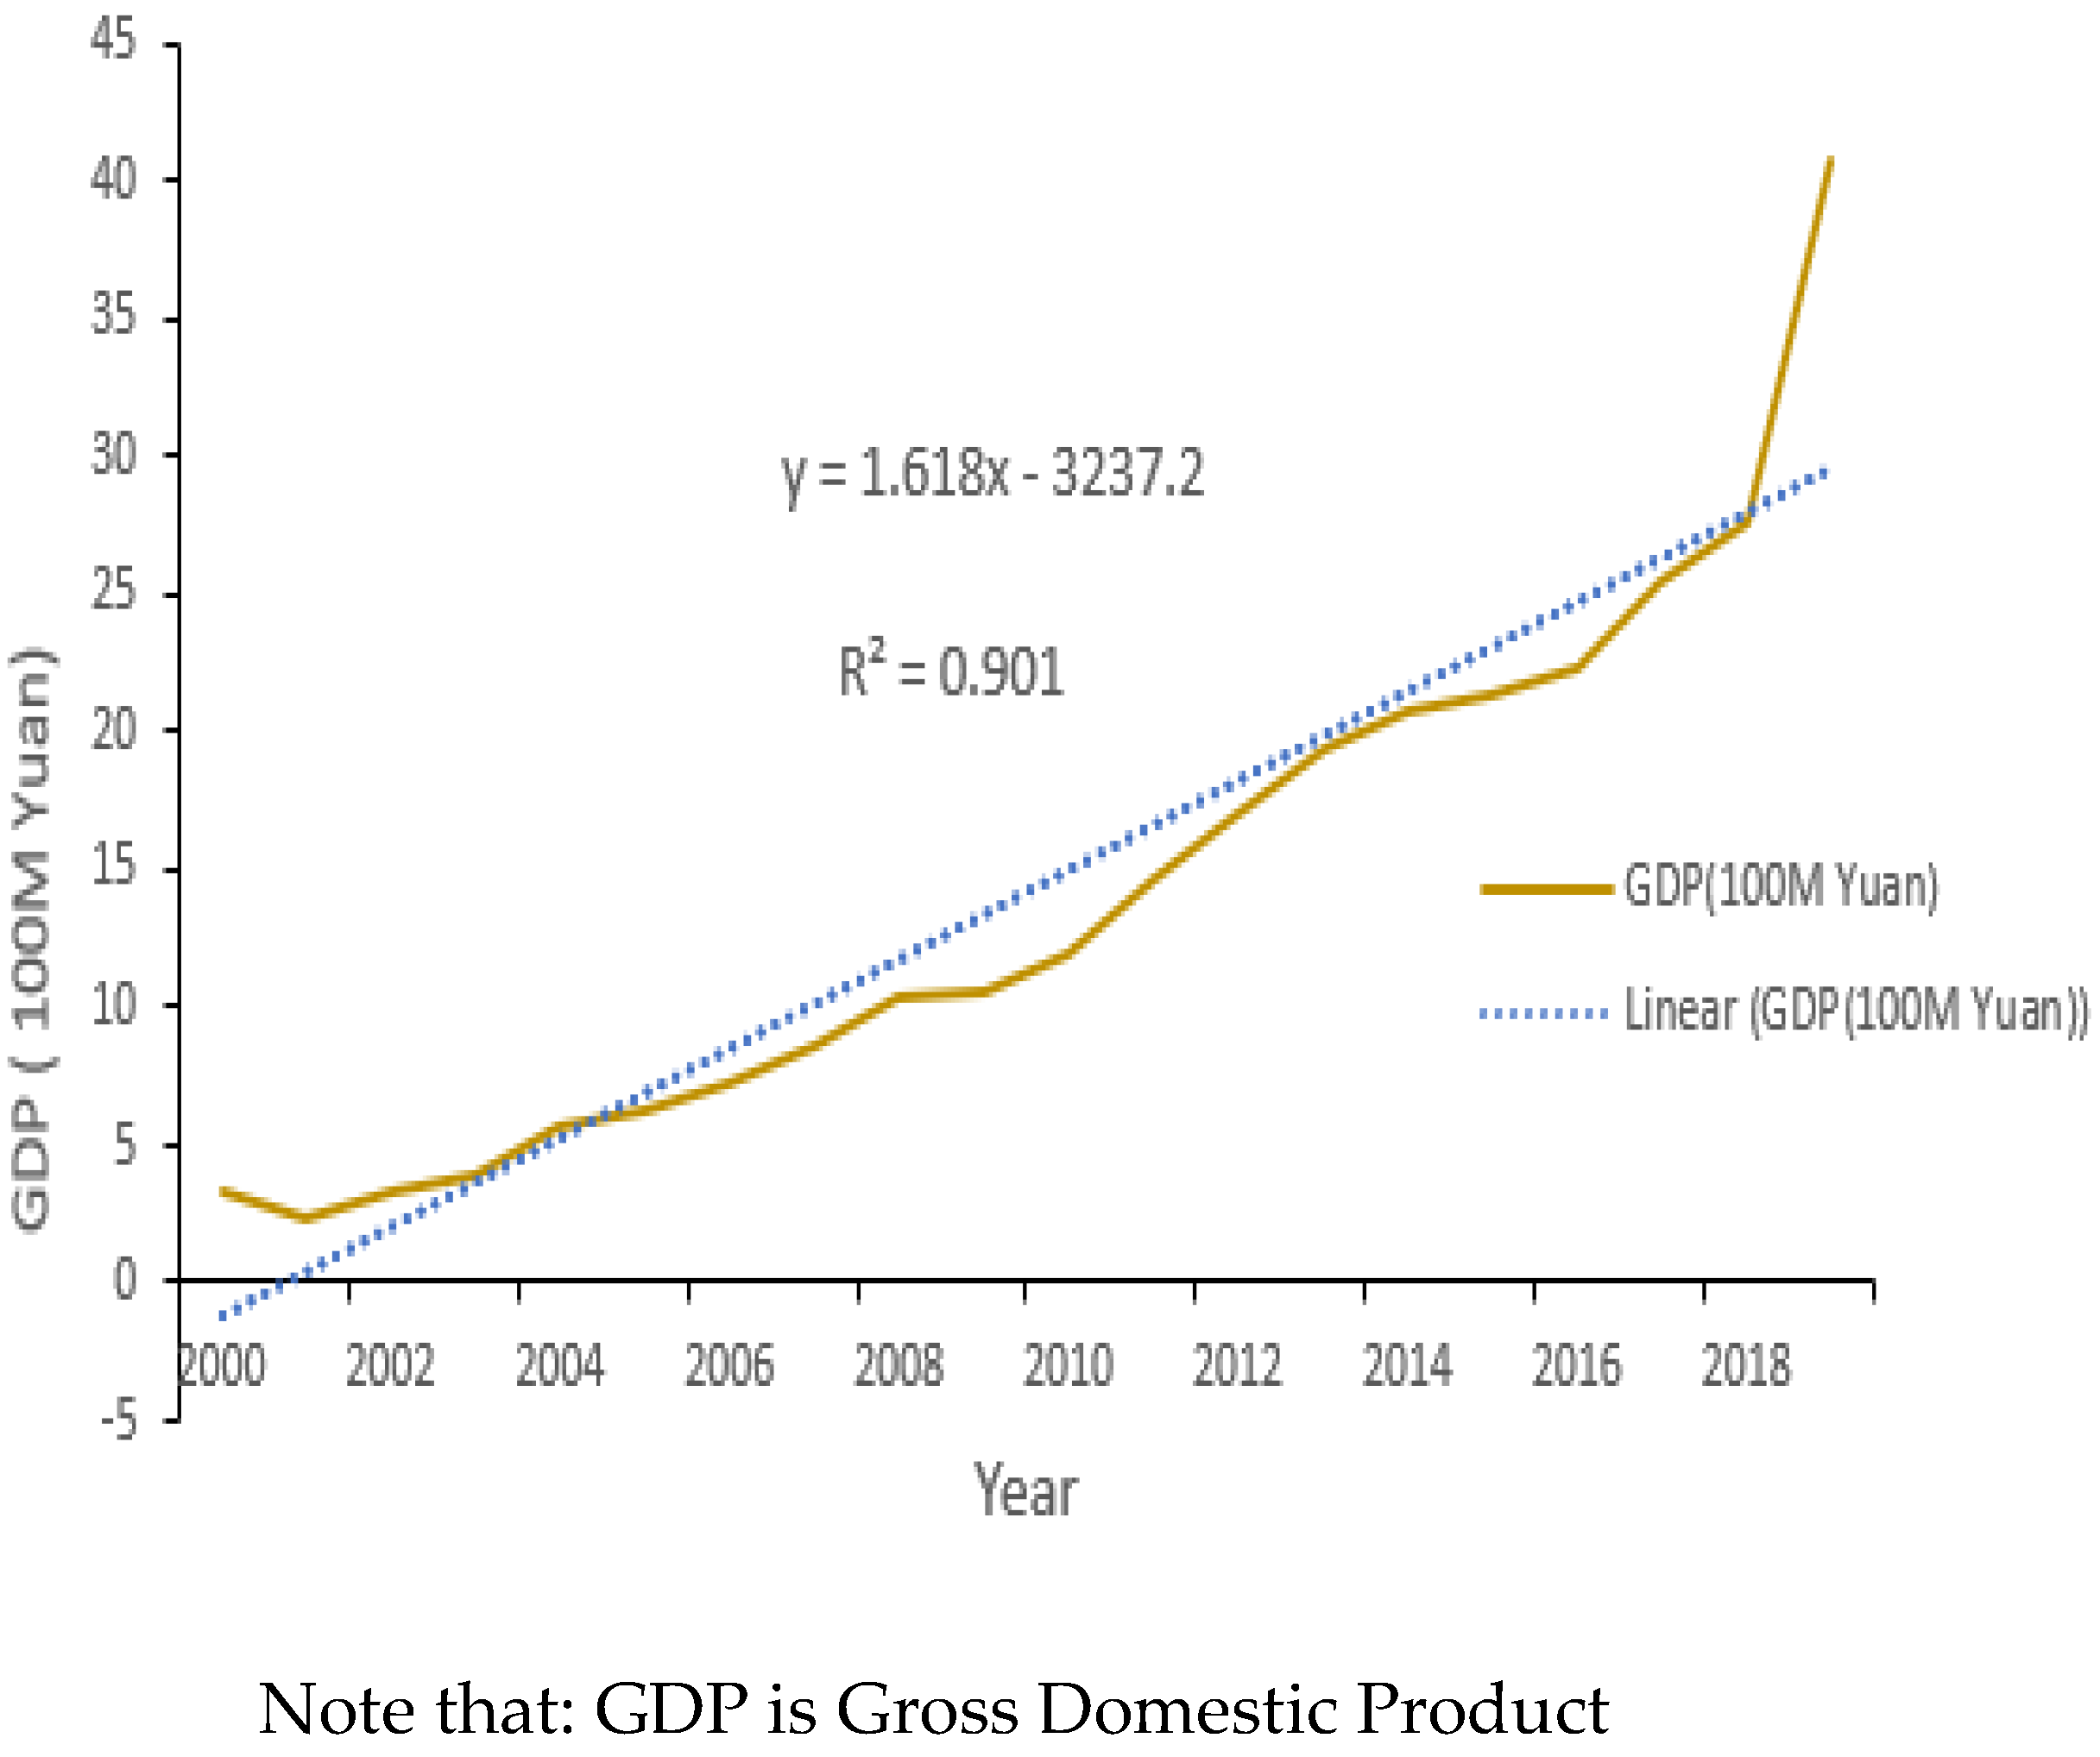
The linkage of a wetland area with humidity, rainfall, temperature, and economic data (GDP) variations can be examined based on their linear relationship. From the linear equations of climatic factors, economic data with wetland area (
Figure 8,
Figure 10,
Figure 12, and
Figure 14), we obtain the following equations:
where
,
,
, and
represent humidity, rainfall, temperature, and GDP, respectively.
x represents wetland area. Suppose, wetland area (
) =
x, the preceding equations become:
and can be rearranged as:
Which shows the linkage of wetland change with economic growth , temperature , humidity , and rainfall .


