1. Introduction
About 30% of the Italian population lives along the coast, which has an extension of about 7500 km [
1]. The strong anthropogenic pressure favors the highly vulnerable conditions of the coastal marine environment, which is characterized by multiple physical and ecological conditions that can support multiple natural resources uses. In this context, conflicts between various interests that affect both human uses and natural resources arise [
2]. To address this issue, and minimize the mutual impact of coastal uses, management plans must include the conservation of ecological structures and processes involved in these uses, in addition to evaluating their usefulness in human activities [
2].
The conservation status of a given ecosystem affects both the quality and quantity of its ecosystem services (ESs), which are defined as “
The benefits people obtain from ecosystems. These include provisioning services such as food, water, timber, and fibre; regulating services that affect climate, floods, disease, wastes, and water quality; cultural services that provide recreational, aesthetic, and spiritual benefits; and supporting services such as soil formation, photosynthesis, and nutrient cycling” [
3]. Originally, this concept considered only the services provided by nature, but over time it has also come to include socio-economic concepts and conservation objectives [
4]. The assignment of economic value to ESs allows access to a broader information framework, which allows better management choices of resource allocation.
Italy is a hot spot of marine biodiversity at the habitat level. Understanding the habitat and population distributions along the Italian coasts, despite having increased considerably in recent years because of large-scale surveys, literature reviews, and expert consultations, is still inadequate for natural capital assessment and environmental accounting [
5].
Among the Italian marine and coastal ecosystems, and in general, in the Mediterranean Sea basin,
P. oceanica meadows are key coastal habitats, hosting about 25% of all species present in the Mediterranean Sea [
6]. Nevertheless, extensive regression of
P. oceanica meadows has been recorded across the Mediterranean Sea due to climate change and human activities. In Italy, a total regressed area of 34,472 ha has been documented along the continental coasts of Liguria, Tuscany, Latium, and Apulia regions over the last 20–30 years. In Sardinia, large areas of dead matte, amounting to 23,215 ha, were reported in the Gulfs of Cagliari, Olbia, and Asinara [
7]. The assessment of the distribution and density of
P. oceanica meadows can therefore be used as a tool both for coastal planning programs, and conservation and monitoring programs. ESs estimates of
P. oceanica meadows provides fundamental information for sustainable management of the related resources.
Several examples of the application of the concept of natural capital and the estimation of ESs for the
P. oceanica meadows are available. A recent and accurate compendium is the technical report of the European Union prepared by the United Nations Environment Program World Conservation Monitoring Centre (UNEP-WCMC) in collaboration with the Institute for European Environmental Policy (IEEP) and the Centre for Social and Economic Research on the Global Environment (CSERGE) at the University of East Anglia [
8]. Furthermore, the works of Campagne et al. [
9] and Vassallo et al. [
10], together with those of Costanza and Marcelli [
2,
11], which are used as a starting point for the evaluation of
P. oceanica ESs in this work, describe different methodological approaches, and are particularly useful for the comparative analysis in terms of the economic estimate of the services considered. Campagne et al. [
9] provided an extensive review of the existing economic assessments on the benefits considered for
P. oceanica on the French national territory, using the “transfer of value” method and, in some cases, with site-specific economic assessments. Vassallo et al. [
10] proposed an approach called “Emergy to Money Ratio” in which the flow of matter and energy from various inputs into the ecosystem (in this specific case,
P. oceanica) is estimated and regulated by the necessary solar energy required to maintain this process.
Hence, this work aimed to analyze and quantify the ESs economic value of the Italian P. oceanica meadows, using synoptic representations through an open-source geographic information system (QGIS) to evaluate the intervention and alternatives of investment more effectively in cases of environmental impact assessment, and facilitate the process of defining and choosing action priorities.
2. Materials and Methods
2.1. Study Area and Data Organization
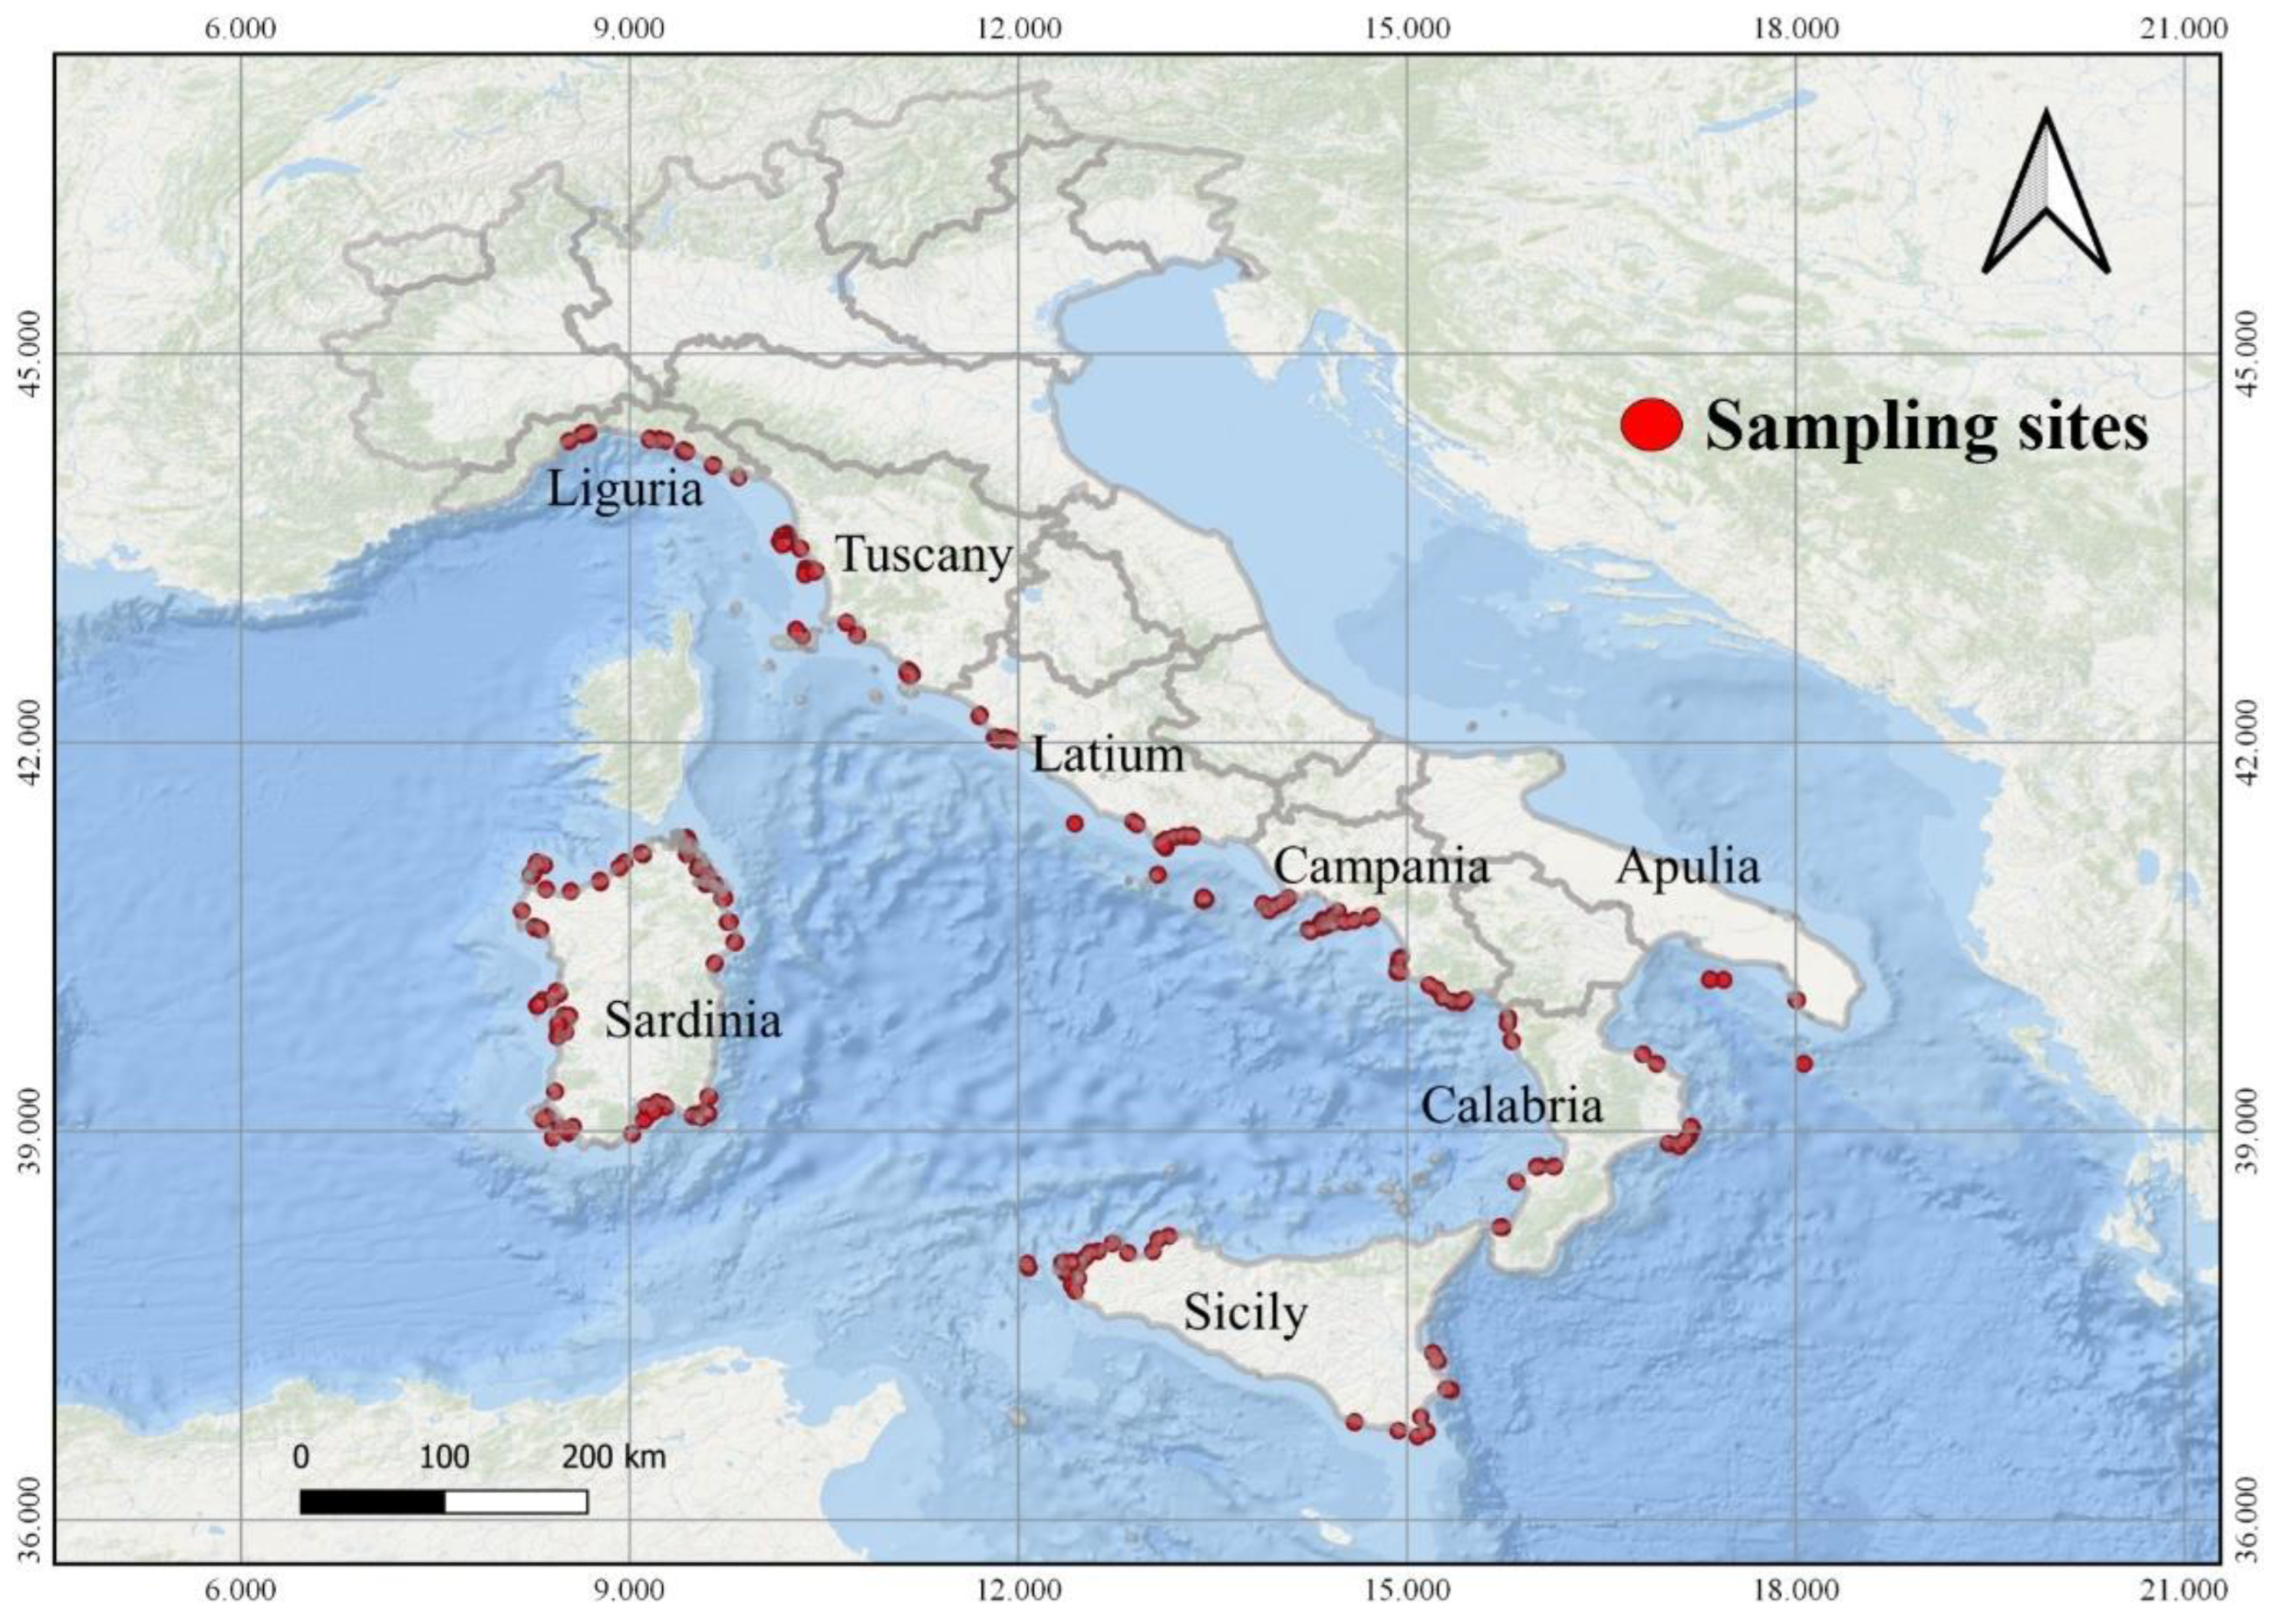
The study area included the Italian coastal zones on which P. oceanica forms large and extensive meadows. For this reason, the small patches located in the Friuli region (northeast of Italy) are not considered in this work. The regions under study included Liguria, Tuscany, Latium, Campania, Calabria, Apulia, Sardinia, and Sicily. For each region, both the distribution of P. oceanica meadows present inside the sites of community importance and marine special protection areas (SCIs and SPAs, respectively), and the distributions of P. oceanica meadows outside the limits of the SCIs and marine SPAs were considered.
To evaluate the ecosystem services of
P. oceanica meadows along the Italian coasts, a dataset that included 356 measurement sites was used (
Figure 1). Each measurement site reported several parameters: (1) point ID; (2) site code; (3) geographical location of the sampling point; (4) region; (5) geographical coordinates; (6) absolute density of the meadow in m
2; (7) standard deviation of the absolute density; (8) relative density (m
2); (9) standard deviation of relative density; (10) meadows coverage (%); (11) depth (m); (12) description of the lower limit; (13) the average number of shoots per m
−2; (14) average leaf area; (15) leaf area index (LAI); (16) average number of leaves; (17) average length of the rhizome; (18) foliar production (gDW yr
−1); (19) average rhizome production (gDW yr
−1); (20) sampling year; and (21) data source. These data were collected by the Italian Institute for Environmental Protection and Research (ISPRA) [
1], as it is necessary for the European (EU) reports relating to the initial assessment and definition of the Good Environmental Status (GES), and identification of the Environmental Targets (articles 8–10 of the Marine Strategy Framework Directive [MSFD] 2008/56/EC;
http://www.db-strategiamarina.isprambiente.it/app/#/, accessed on 28 December 2021) [
12].
The
P. oceanica meadows taken into consideration had a total extension of 358,896.5 ha. In detail, among the eight regions considered, the largest regional extension was reached in Sardinia (174,489.7 ha), whereas the smallest was in Liguria (5050.1 ha), as shown in
Table 1. The extension of
Posidonia oceanica meadows (ha) in the Italian regions under consideration reported in
Table 1 was obtained by QGIS elaboration of the data collected by ISPRA.
To calculate the P. oceanica ESs on the Italian territory, the dataset was preliminarily analyzed to derive the distribution of the P. oceanica meadows for each Italian region, the spatial distribution of the different types of substrates on which the meadows insist, and the extent of the SCIs.
The regional context coincides with the administrative subdivision of the maritime districts, and is the most suitable for analyzing the distributions of marine SCIs and SPAs, as these are of regional competence.
The data from the 356 measuring sites located in the Italian regions were organized using an open-source geographic information system (QGIS), which was previously prepared considering the shapefiles of the SCI areas.
2.2. Estimation of P. oceanica Meadows ESs
The method applied for the evaluation of
P. oceanica ESs was obtained from a report by [
11] in which a site-specific approach for the definition of the benefits and services was applied [
2]. This approach was used both to identify the
P. oceanica meadows ESs, for the definition of the methods, and for the estimation of each single service. Five benefits were considered in this work for
P. oceanica meadows: (1) carbon sequestration; (2) oxygen production; (3) bioremediation; (4) protection from erosion; (5) food production [
2]. In detail, carbon sequestration was computed considering mean regional (Maritime Districts) values of biomass and relative density data; oxygen production was calculated considering the regional mean values of biomass and the number of shoots per m
2; bioremediation was computed considering the mean regional values of the number of shoots per m
2; protection from erosion was computed considering wave height, period, and direction on different points at regional level; and food production was computed considering the annual revenues of professional fishing for each Maritime district. The transfer of value was performed for each ES after considering what reported by Marcelli et al. [
2], except for bioremediation, for which the operating cost of a wastewater plant was used. The methods for the economic evaluation of benefits are summarized in
Table 2. The results of the estimate of the economic value of
P. oceanica benefits are expressed in € ha
−1 yr
−1.
For the calculation of the values of some benefits, such as carbon sequestration, erosion protection, and food production, the spatial distribution of the different types of substrates on which the meadow stands were considered. Regarding the substrates, dead matte, degraded P. oceanica, P. oceanica on matte, P. oceanica on rock, P. oceanica on sand, and unspecified substrates were considered.
2.2.1. Carbon Sequestration
With respect to the method proposed by Marcelli et al. [
2], litter and soil compartments of the
P. oceanica meadows were also considered in the estimation of carbon sequestration value following the approach reported in the InVEST Coastal Blue Carbon model (Natural Capital Project, Stanford University;
https://naturalcapitalproject.stanford.edu/, accessed on 9 November 2021) [
13].
The soil includes rhizomes/dead roots and organic sediment (matte), and represents the main pool of organic carbon stocked by
P. oceanica meadows. The carbon sequestered in this compartment (
CS) depends on the matte thickness, as its distribution decreases exponentially with the depth [
14]. Taking into account a reference value of about 79 kg Corg m
−2 in about 5 m of core [
14], and assuming a different average thickness based on the type of substrate (we have arbitrarily assigned 0.5 and 2 m thick for the matte on rock and sand, respectively), it is possible to roughly estimate a quantity of carbon equal to 39.5 and 53.44 kg Corg m
−2 for
Posidonia on rock and for the plants located on the sand, respectively.
Litter means that the leaves that detach from the plants become stranded on the coast, and form massive supra-littoral deposits called banquettes. In this case, the dry weight values (
BL) of 102.126 g m
−2 and 22.749 g m
−2 for high- and low-density meadows, respectively, were used [
15]. The shoot density limit value is 300 shoots m
−2, which corresponds to a “sparse meadow” according to the classification proposed by Giraud [
16].
The carbon stock in the above- and below-ground biomass of
P. oceanica was calculated using the foliar (
Be) and rhizomal (
Bi) biomass data, respectively [
2].
To convert the dry weight determined in the biomass and litter compartments of
P. oceanica meadow into organic carbon content, a common value (
Fc) of 0.336 [
17] was used.
The total organic carbon (
CT) value stocked in the
P. oceanica meadows is given by Equation (1) shown below:
For the transfer of value, Equation (2) was then used:
in which
C is the value of the carbon sequestration benefit for
P. oceanica meadows (€ ha
−1 yr
−1), 0.01 is the conversion factor from gm
−2 to tonne ha
−1, and 24.7 is the average annual exchange value of 1 tonne of CO
2 based on the Emission Trading Scheme, updated to 2019 [
18].
2.2.2. O2 Production
For the calculation of the O
2 supply by
P. oceanica, we referred to what was reported by Marcelli et al. [
2]. The net oxygen production is estimated using literature data attesting the quantity of 5 mmol of O
2 per gram of dry weight of the biomass produced daily during the metabolic cycles of
P. oceanica [
19]. Here, O
2 supply estimation is further refined considering the relative rate attributable to the meadow-associated communities, which is about 0.018 mol m
−2 day
−1, given the condition of autotrophy found in the epiphytic communities during the year [
20]. The economic value of O
2 production of
P. oceanica was therefore obtained using the cost of industrial methods to produce oxygen, about 0.05 € kg
−1 [
21], and expressed as a value per annual ha.
The total O
2 supply is affected by the O
2 supply attributable to the biomass (
Ob) described by Equation (3), and by the oxygen supply attributable to the epiphytic community—
Oe; Equation (4):
in which
B is the meadow biomass (g m
−2 yr
−1),
Ma is the oxygen moles supplied in a year as obtained from the literature data of 0.03 mol m
−2 day
−1 multiplied by 365 days after considering the net primary production [
19],
Mc is the moles supplied in a year by the epiphytic communities (equal to 0.018 mol m
−2 day
−1 multiplied by 365 days) [
20], 32 is the O
2 molecular mass, 10 the conversion factor of grams into kilograms and m
2 into ha, and
C is the O
2 cost of industrial production per kg (equal to €0.05). Finally, the total O
2 supply is shown in Equation (5):
2.2.3. Bioremediation
Bioremediation refers to the capability to perform pollutant degradation and remediation through metabolic processes. Specifically, this work considers the capability of P. oceanica meadows to remove considerable quantities of nitrogen (N) and phosphorus (P) from coastal waters and sediments. P. oceanica plants and organism complexes associated with them carry out processes of excess N and P removal, thus allowing portions of each to become available again for coastal biological communities. The removal of excess loads of nutrients available for photosynthetic organisms causes limitations in the proliferation of algae and bacteria, among other factors, exercising control over the onset of eutrophication processes.
To calculate the economic value of this benefit, data extracted from recent studies relating to the costs for wastewater treatment systems from municipal plants in the United States of America were used (
https://www.epa.gov/sites/production/files/2015-04/documents/nutrient-economics-report-2015.pdf, accessed on 9 December 2021) [
22]. In regards to the estimation of the quantity of P and N used by the metabolic processes from
P. oceanica, we refer to Marcelli et al. [
2], using the available data of the number of shoots/m
2, and the literature data of N and P concentration as the minimum daily quantity required by the plant [
23]. In detail, the values selected in this situation correspond to 0.09 mg shoots day
−1 of N, and 0.01 mg shoots day
−1 for P after considering non-flowering meadows. The literature values were then compared with the values of the number of shoots per m
2 of each available measurement site, and expressed on a regional scale as the mass of P and N ha yr
−1. The relationship is described in Equation (6):
in which
B is the average annual N and P bioremediation value per ha of N expressed in €,
E is the minimum daily amount of N or P required from the meadows (respectively 0.09 mg shoots
−1 day
−1 of N and 0.01 mg shoots
−1 day
−1 of P),
n is the number of shoots per m
2,
A represents the days in one year (365),
G is 3.78 (conversion factor from gallons to L),
m is 15 for N and 1.9 for P (average milligrams contained in 1 L of water entering the urban treatment plant, obtained according to the efficiency of the treatment), and
C is the cost in euros for the operation and management of an urban wastewater treatment plant (0.018 and €0.01 for N and P, respectively, per L). It should be specified that the cost in this case is related to the operation and annual maintenance of existing plants, thus not considering the capital investment cost for the construction of new urban waste treatment plants. The lowest operating and management cost was chosen considering information from the report by the United States Environmental Protection Agency [
22] after comparison with the average operating management cost of Italian plants as reported by Sicuro [
24], in which an average cost per m
3 of sludge disposal in small- and medium-sized urban treatment plants of approximately €1 was chosen.
2.2.4. Erosion Protection
The economic value of erosion protection by
P. oceanica meadows is obtained by calculating the percentage of the wave attenuation (WAP) given by:
in which
H0 is the incident wave height in the offshore area, and
Hc is the resulting wave height after the passage on the
P. oceanica meadow.
H0 values were extracted in proximity (offshore area) of each sampling site from the Copernicus product “Mediterranean Sea Wave Reanalysis” (
https://resources.marine.copernicus.eu/product-detail/MEDSEA_MULTIYEAR_WAV_006_012, accessed on 9 December 2021) [
25], which includes the main wave parameters (significant wave height, peak period, and mean direction) as calculated by the Med-Waves modelling system [
25] in the entire Mediterranean basin, with the spatial and temporal resolutions of 0.042° (about 4.5 km) and 1 h, respectively. The data covered the period between 1993 and 2020.
For the constant depth case,
Hc could be approximated using the following formula [
26,
27]:
in which
X is the cross-shore extension of the
P. oceanica meadow, and Y is the attenuation coefficient proposed by Infantes et al. [
28]:
in which
kp is peak wave number (m
−1),
lv is the vegetation length (m),
N is the number of shoots per unit area (m
2),
a1v is the plant surface area per height unit (m),
h is the water depth in which the wave attenuation is calculated, and
CD is the drag coefficient that describes the drag associated with the individual blades. The friction due to seagrasses can be determined in terms of the Keulegan–Carpenter (
KC) number [
27,
29] as:
for
KC values between 15 and 425 [
27].
The wave attenuation percentage was considered for each sampling site, considering the characteristics of the P. oceanica meadows in terms of shoots density, blade lengths and leaf areas, and the offshore wave climate given by significant wave height and peak period as computed over the last 27 years.
To obtain an economic estimate, the cost of obtaining the same result through the construction of a submerged barrier, which is commonly used in coastal defense works, was calculated for the estimate, and installations of submerged barrier modules of the same size were evaluated in a non-continuous way to allow a constant exchange of water [
2]. The value can be estimated using the costs of module construction, and normalizing them to obtain an energy dissipation comparable to that determined by the meadow in the measurement site. The cost per m of a structure that allows an average energy dissipation of 20% is approximately €1432.08. This cost is extended to one ha, assuming a square area of 100 m
2, and the cost is spread over a period for which the structure is guaranteed (approximately 20 years). The benefit is calculated with the following relationship:
in which
E is the value of the benefit in € ha
−1 yr
−1, €1432.08 is the cost per linear m of a collapsed barrier capable of guaranteeing wave attenuation of about 20%, (
Hrms/
Hrms0) × 100 is the percentage of wave attenuation obtained from the model used from the Copernicus website (
http://marine.copernicus.eu/services-portfolio/access-to-products/, accessed on 9 December 2021) [
30], 20 is the proportion for the calculation of the value relating to the submerged barrier (modular structures in reinforced concrete, that were laid and juxtaposed on the seabed along a continuous line, parallel to the coast, and at a distance of at least one hundred m from it. This setup dissipated the energy of the wave motion, and favored the sliding of the sand towards the shore and its return to limit the erosion of the coasts). A conversion factor of 5 is given by the ratio between an area of 1 ha and the average lifetime of a submerged barrier (20 years).
2.2.5. Food Production
Regarding the calculation of the benefit connected to food production, the method presented in Marcelli et al. [
2] was extended nationwide. The historical data of
P. oceanica were supplemented with data regarding the catches of commercial fish species updated to 2012. These were found from the publications of the Economic Research Institute for Fisheries and Aquaculture (IREPA) (
www.irepa.org, accessed on 9 November 2021) [
31]. Starting in 2004, IREPA has reported the production of the 49 most commercially relevant fish species, with an indication of the monthly data relating to fishing days, catches, and revenues by regions and fishing systems. The fishing fleets considered in the IREPA data are commercial trawling, purse seine, hydraulic dredging, small-scale fishing, and passive multipurpose fishing.
The regional scale is the most suitable for the analysis of data relating to the benefit of food production, since the estimate of this parameter associated with
P. oceanica meadows refers to fishing. The benefit of food production is calculated with the following relationship:
in which
P is the value of the benefit in € ha
−1 yr
−1,
is the revenue in euros of the species identified as a resident,
is the total extension in hectares of
P. oceanica meadows,
is the extension of degraded meadows,
is the extension in ha of the dead matte substrate, and
is the revenue in euros of the visiting species. The identification of the two types of species considered in the calculation of the food production benefit was performed by extending what was described by Marcelli et al. [
2] for the eight Italian regions under study.
3. Results
The dataset was used to create distribution maps of the
P. oceanica meadows using the QGIS environment for each Italian region under study using the Maritime Districts as limits.
Figure 2 reports the
P. oceanica meadow distribution, and details of the substrates present in the Sardinia region, as an example. The creation of synoptic maps allowed us to analyze the characteristics of the
P. oceanica, and the distribution of the data available for each region in detail. Subsequently, the ESs values were calculated by applying the methods described in the previous chapter. The results of the assessment of the regional and national total masses of CO
2 and O
2, and average volumes of N and P are reported in
Table 3 and
Table 4. The economic values of
P. oceanica along the Italian territory are reported in
Table 5, and
Figure 3 and
Figure 4.
This work allowed us to calculate the masses per ha of CO
2 and O
2, and the volumes of the average N and P (
Table 3) for each Italian region under study. The maximum CO
2 value was found in the Campania region (2.5 tonne ha
−1 yr
−1), whereas the minimum value was in Latium (0.9 tonne ha
−1 yr
−1). The maximum O
2 value was found in Latium (76.2 tonne ha
−1 yr
−1), whereas the minimum value was in Apulia (21.5 tonne ha
−1 yr
−1). The maximum average value of N and P (L ha
−1 yr
−1) was found in Campania (531,590.7), whereas the minimum was in Sardinia (345,417.9). Using these calculated values, it was possible to compute the total masses for CO
2 and O
2 (tonne), and the total volumes of N and P (m
3) at national level for a total amount of 523,354.8 tonne yr
−1 of CO
2; 11,179,022 tonne yr
−1 of O
2; and 147,553,144.2 m
3 yr
−1 of N and P (
Table 4).
Regarding the carbon sequestration, a national average value of €38.9 ha
−1 yr
−1 was calculated. The maximum value was found in the Campania region (€61.1 ha
−1 yr
−1), whereas the minimum value was found in the Latium region (€22.60 ha
−1 yr
−1). In general, slight variations could be observed between the considered regions (
Table 5). The average value of O
2 production for the Italian
P. oceanica meadows was €1929.4 ha
−1 yr
−1; the maximum value of O
2 production was calculated for the Latium region (€3809.9 ha
−1 yr
−1), whereas the Apulia region showed the minimum value (€1075 ha
−1 yr
−1), as shown in
Table 5. The Italian average bioremediation value amounted to €6396.2 ha
−1 yr
−1, with the maximum value for the Campania region (€7442.3 ha
−1 yr
−1), and the minimum value calculated for Sardinia (€4835.9 ha
−1 yr
−1). Some variability between regions was found, especially between the coastal areas of the north of Campania and Sicily compared to Apulia, Calabria, and Sardinia (
Table 5). The average erosion protection value was €8964.7 ha
−1 yr
−1; the Sardinia region showed the maximum value (€15,914.92 ha
−1 yr
−1), whereas the minimum value of erosion protection was found in Liguria (€3629.61 ha
−1 yr
−1), as shown in
Table 5. In this case, a marked variability could be observed. Considering that the estimate was based on the exposure of the coast to wave directions, it was possible to identify a geographical effect attributable to both the islands (Sicily and Sardinia) and coastal development (Tuscany). As an example,
Figure 5 shows the comparison between the wave attenuation values of the Sardinia and Tuscany regions.
For P. oceanica food production, the average Italian value amounts to €4331.3 ha−1 yr−1, with the maximum value found in Tuscany (€8130.65 ha−1 yr−1), and the minimum value found in Sardinia (€338.97 ha−1 yr−1). The observed variability could be attributed to the different relationship between the total regional extensions of the P. oceanica, and the actual number of fishing fleets. In the case of Sardinia, the very low value reflected the low number of existing fleets when compared with the enormous extension of the existing meadows (174,500 ha), which alone represented 48.6% of the national P. oceanica extension considered in this study, whereas the fishing fleet was 13.6% of the total (equal to 9495 boats).
The percentage breakdown of the economic value of the benefits provided by the
P. oceanica meadows in the considered Italian regions is shown in
Table 6. In Liguria, Latium, and Apulia, the benefit that produces the greatest economic value was bioremediation (40.44%, 35.83%, and 34.18%, respectively), whereas the minimum value was related to the carbon sequestration (0.22%, 0.11%, and 0.18%, respectively). Tuscany, Campania, Calabria, Sicily, and Sardinia showed that the greatest economic value was connected to erosion protection (42.77%, 31.54%, 40.21%, 49.80%, and 70.68%, respectively), whereas the minimum value was represented by carbon sequestration (0.15%, 0.25%, 0.21%, 0.17%, and 0.15%, respectively).
4. Discussion and Conclusions
In this work, we assessed the economic value of the
P. oceanica meadows’ ESs on eight Italian regions by applying the transfer of value methodology, focusing on five essential ecosystem services (
Table 2). Compared to other marine phanerogams present in the Mediterranean Sea (e.g.,
Cymodocea nodosa,
Zostera marina, and
Zostera noltii),
P. oceanica offers the greatest contribution to the considered ESs, as has been reported for the carbon sequestration in the result of the Deliverable C1 of the LIFE BLUE NATURA (LIFE14CCM/ES/00957;
http://life-bluenatura.eu/, accessed on 6 December 2021) [
32].
Even though the values of the different
P. oceanica ESs obtained in this study (
Table 5) could vary by orders of magnitude, the Italian national average
P. oceanica ESs value obtained in this study (€21,660.5 ha
−1 yr
−1) is in line with data from other literature studies regarding the ESs of
P. oceanica [
2,
11]. The results reported by Costanza et al. [
11], Marcelli et al. [
2], and Campagne et al. [
9] are comparable in that they all considered the methodological approach (market values basic benefit transfer) and the value of the estimate (
Table 7). However, in the case of the study by Campagne et al. [
9], the value per annual ha was significantly lower. This discrepancy is due to the different economic evaluations carried out by the authors, especially during the transfer of the value of the individual benefits. The value reported by Vassallo et al. [
10] is much higher than the others (
Table 6). In this case, the reason can be traced back to the selected methodology (Emergy to Money Ratio), which is a completely different parameter from those in the other studies.
Our results highlight a different distribution of economic values of benefits at the regional level (
Table 5,
Figure 4). The different distribution of the erosion protection value of Tuscany, Sicily, and Sardinia compared to other regions is evident (examples of Sardinia and Tuscany are reported in
Figure 5). In these regions, coastal development implies a more intense wave attenuation effect by the
P. oceanica meadows than in regions with less coastal development and less exposure (as in the case of Liguria and Apulia, shown in
Table 8) [
33].
A similar consideration is possible concerning the values of food production in which the distribution of the estimates can be attributed to the relationship between the number of fishing fleets available at the regional level, and the actual extension of the
P. oceanica meadows. This consideration explains the very low value of food production in Sardinia, even though the Sardinian meadows make up almost 50% of the total area considered in this work (
Table 9).
The values of O2 production have a higher percentage weight for the regions of Liguria and Latium, whereas they constitute a lower percentage of the total value for the other regions. Bioremediation, on the other hand, appears much more constant at the regional level, with peaks in Liguria, Latium, and Campania.
Regarding carbon sequestration, the results of this study were obtained using the 2019 average annual exchange value of 1 tonne of CO
2 [
18]. Consequently, the assessment for subsequent years must consider the high fluctuation of this value.
Carbon sequestration is the benefit that has by far the least weight in the total calculation in all regions. The very low values found that agree with what is present in the literature [
2] can be, at least partially, justified by an underestimation of the Emission Trading Scheme in the sense that the trading market is probably still incapable of registering these levels.
The applied methodology demonstrates that the ESs economic evaluation can provide an essential tool for the management of the coastal marine environment after considering the modularity of the used approach. The considered benefits can be further expanded by considering, for example, the use of tourism, which is an important economic sector in Italy, representing about 15% of the national general government spending (GDP). Tourism, together with recreational activities, are very important in Italy. However, these services are very heterogeneous on the Italian national territory. Consequently, to consider the value of these services in the total economic evaluation, in-depth sector studies are required.
The total value of the benefits obtained considering the entire extension of
P. oceanica meadows in Italy is approximately eight billion euros, a significant value (about 0.44%) concerning both the national GDP (1787.7 billion euros,
http://data.istat.it/, accessed on 6 December 2021) and the individual budgets of the regions under study. This aspect underlines not only the importance in terms of the value of
P. oceanica meadows in Mediterranean Sea, but also the possibility of the use of this methodology of ESs economic estimation as a comparison tool for the management of the coastal areas, for the resolution of existing conflicts of use, and for the analysis of anthropogenic impacts in terms of natural capital loss of value.
The results obtained in this work can be a starting point for future works concerning the value of ecosystem services offered by P. oceanica meadows on a national scale in Italy, focused on the analysis of potential threats to these habitats, which could cause a loss of ecosystem value. Based on the analysis of potential threats, it will be possible to define mitigation and compensation works for lost ecosystem services.


 ,
, 


