
Significant Increase in Population Exposure to Extreme Precipitation in South China and Indochina in the Future


Abstract
:1. Introduction
2. Data and Methods
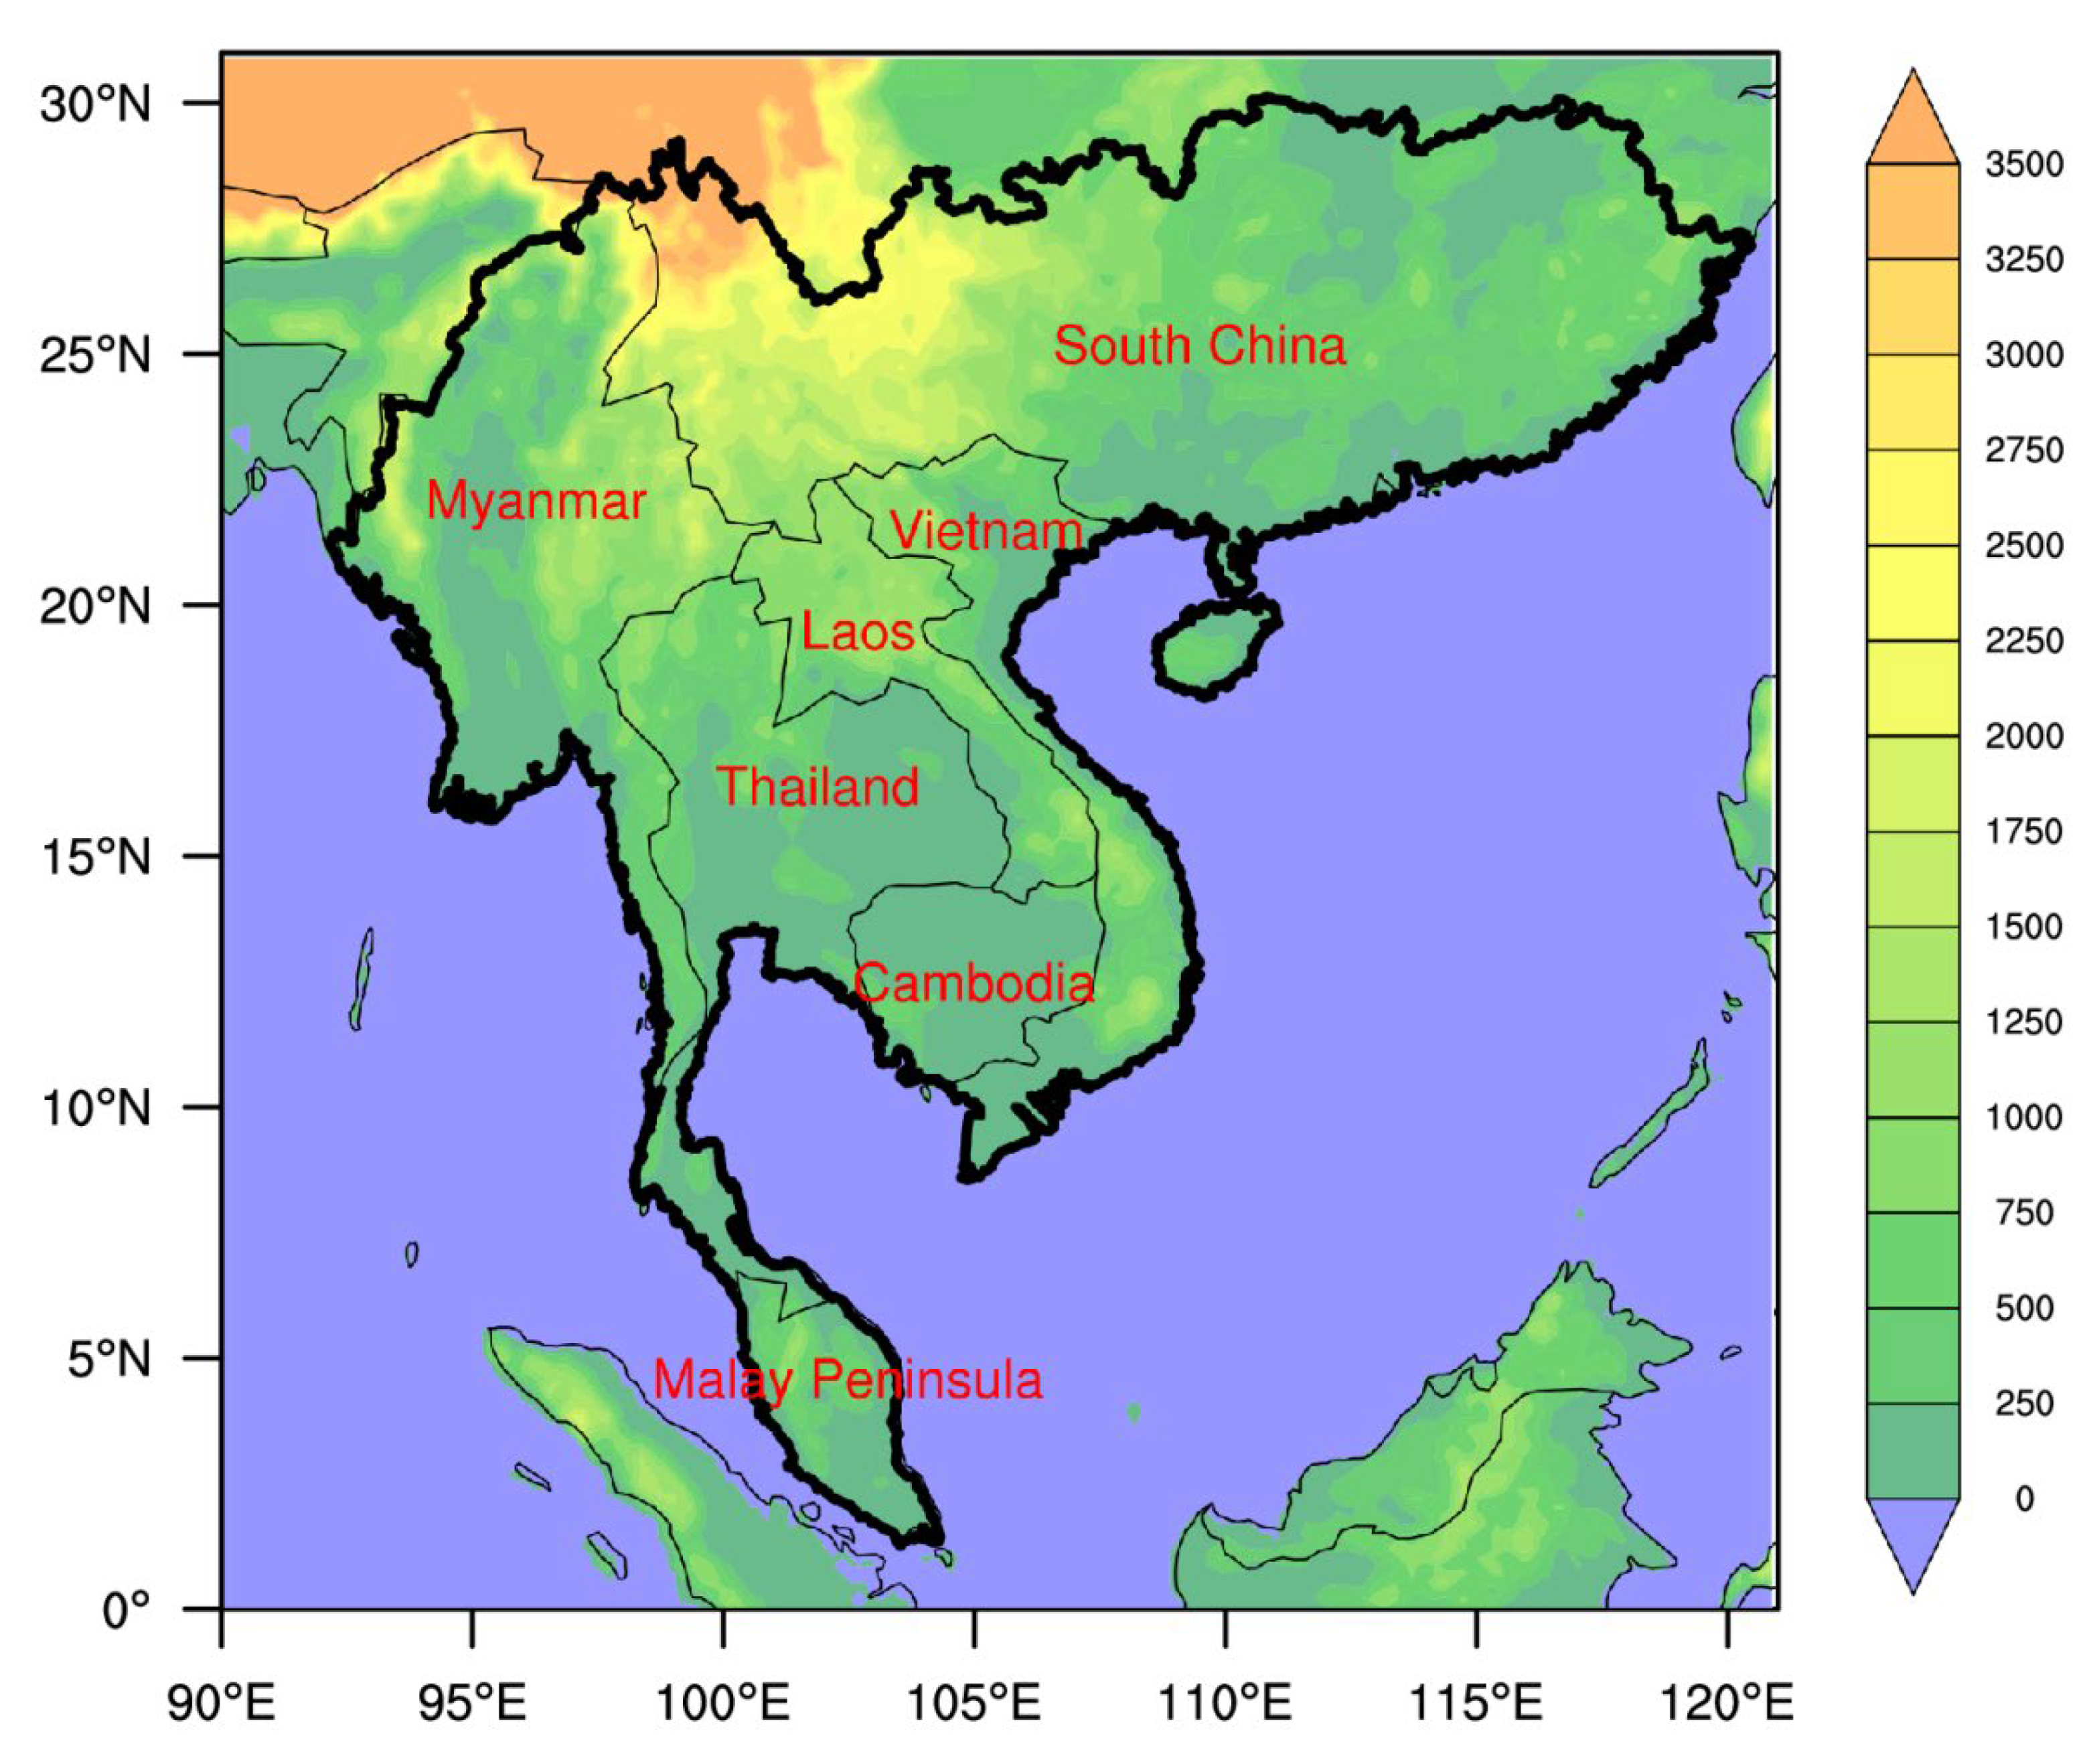
2.1. The Study Area
2.2. Data
2.2.1. CMIP6 Model Output
2.2.2. Population Data
2.3. Extreme Precipitation Indices
2.4. Methods
2.4.1. Population Exposure
2.4.2. Contributing Factors to Changes in Population Exposure
3. Results
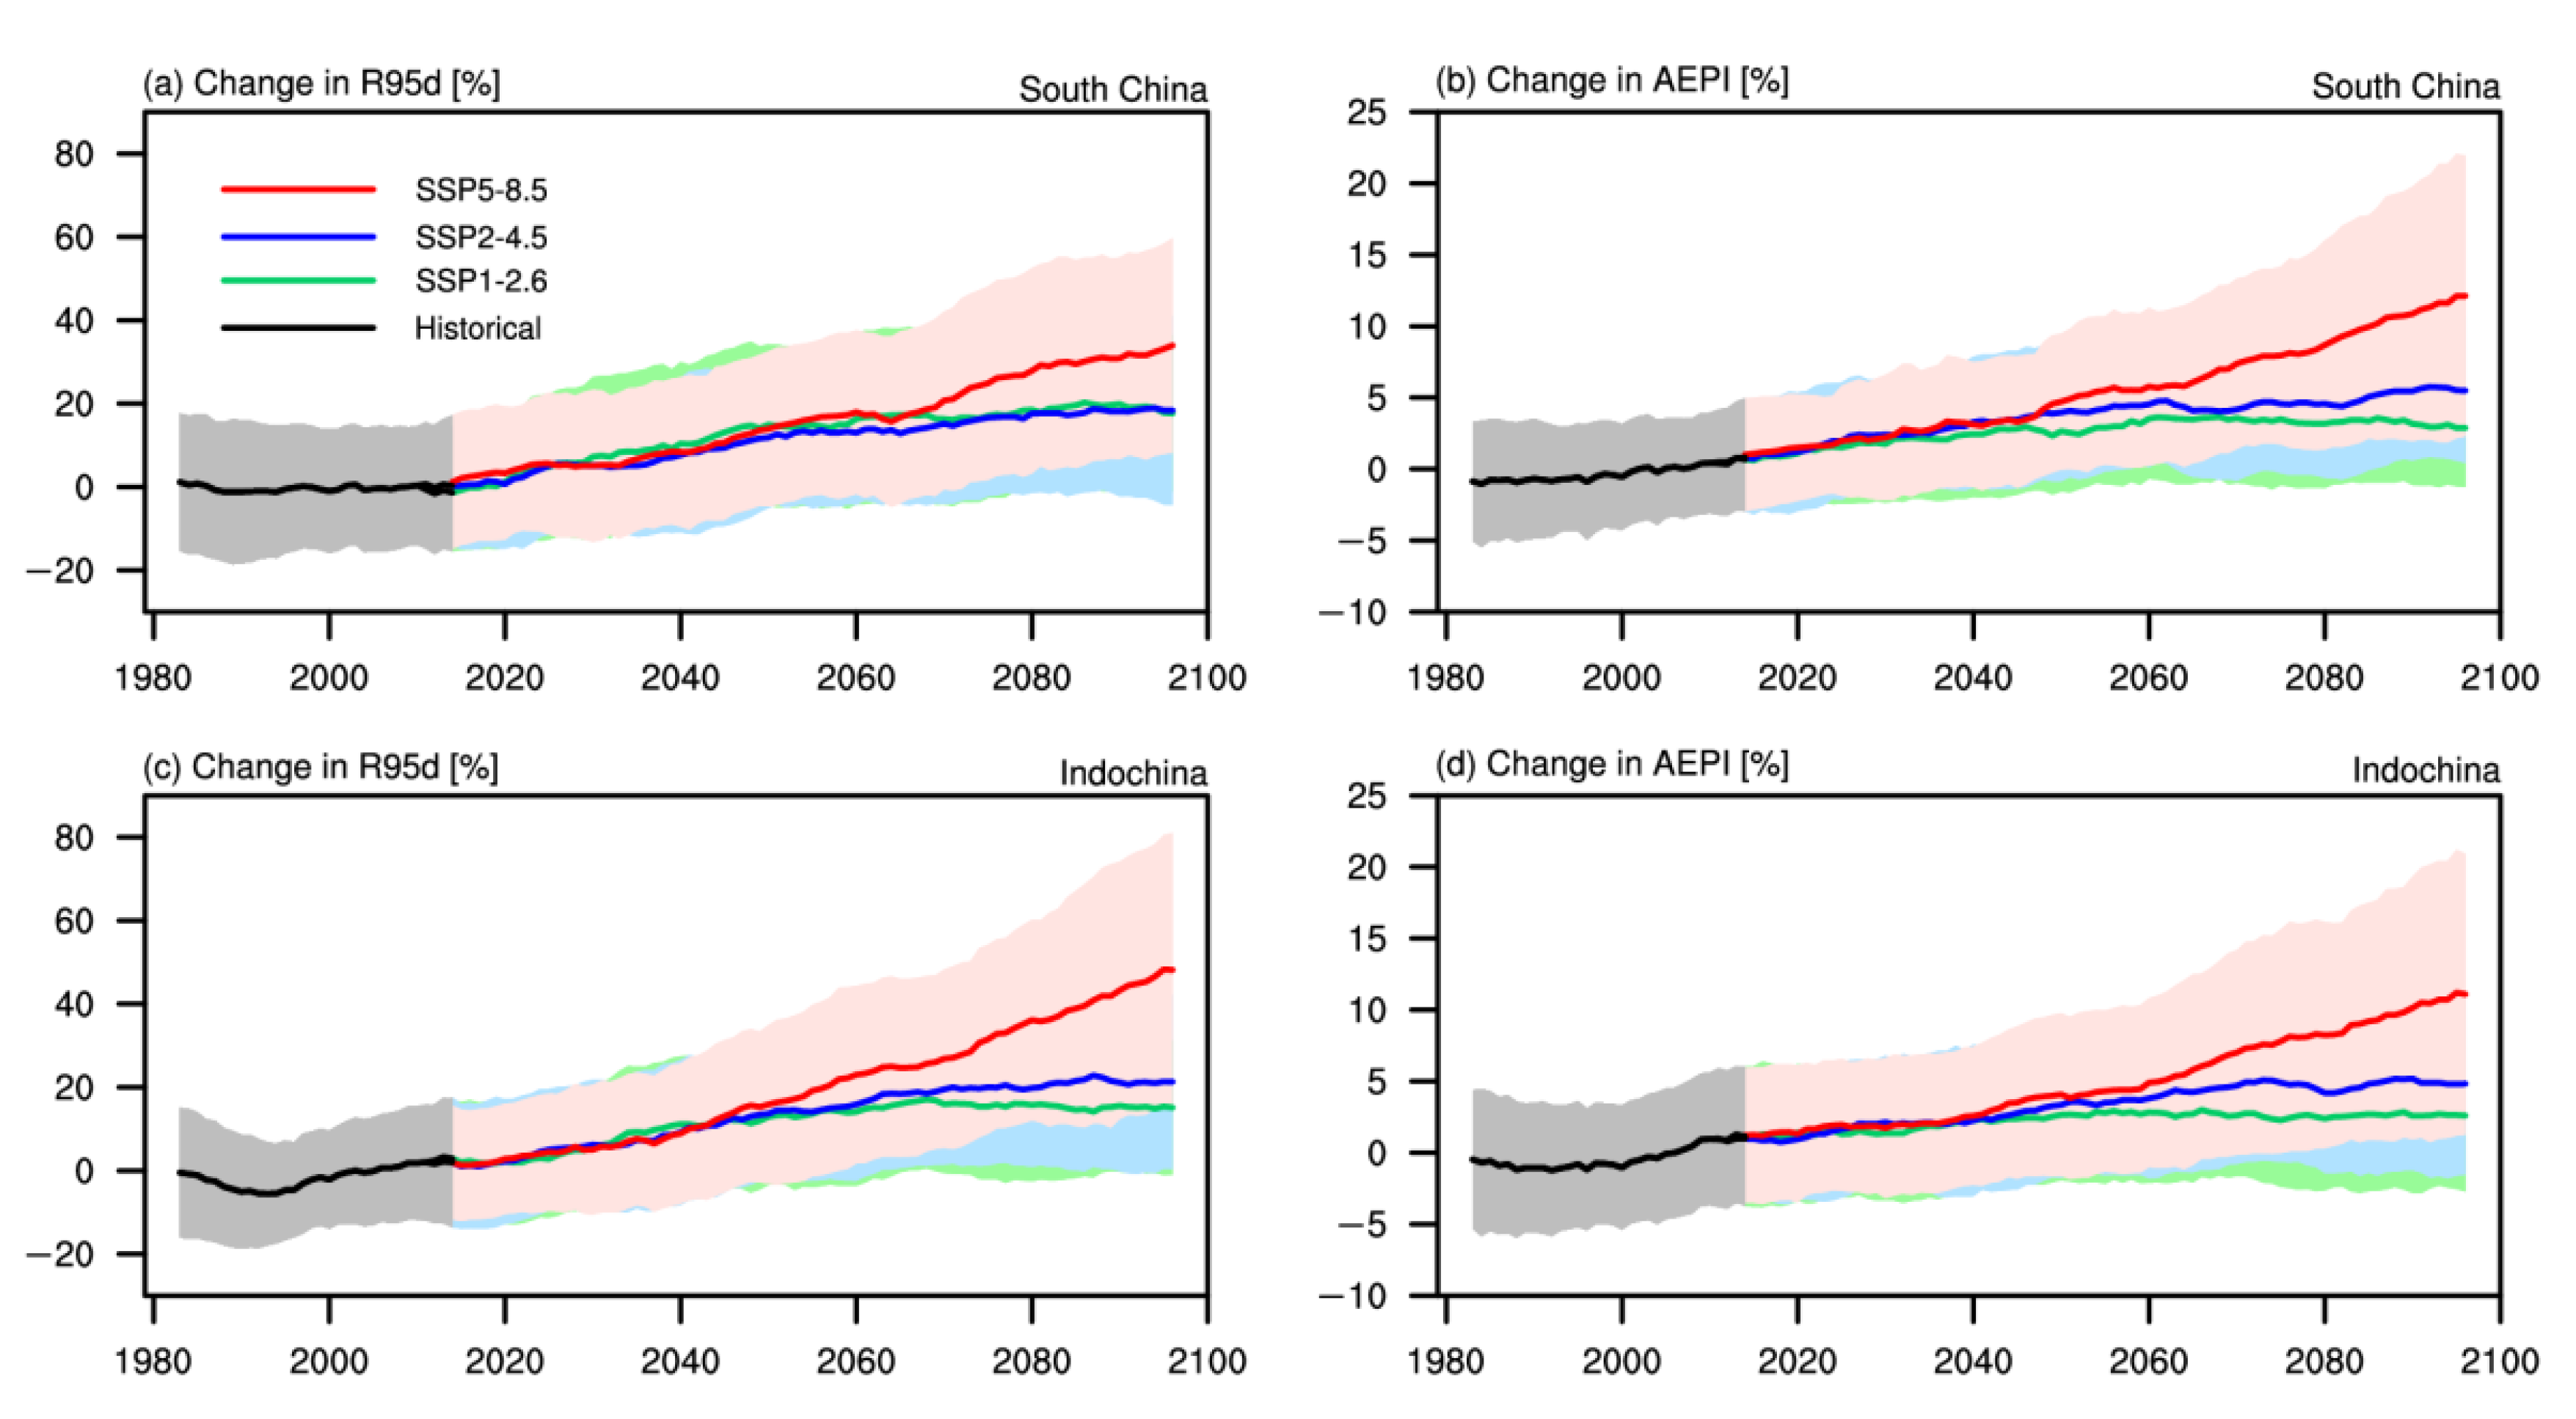
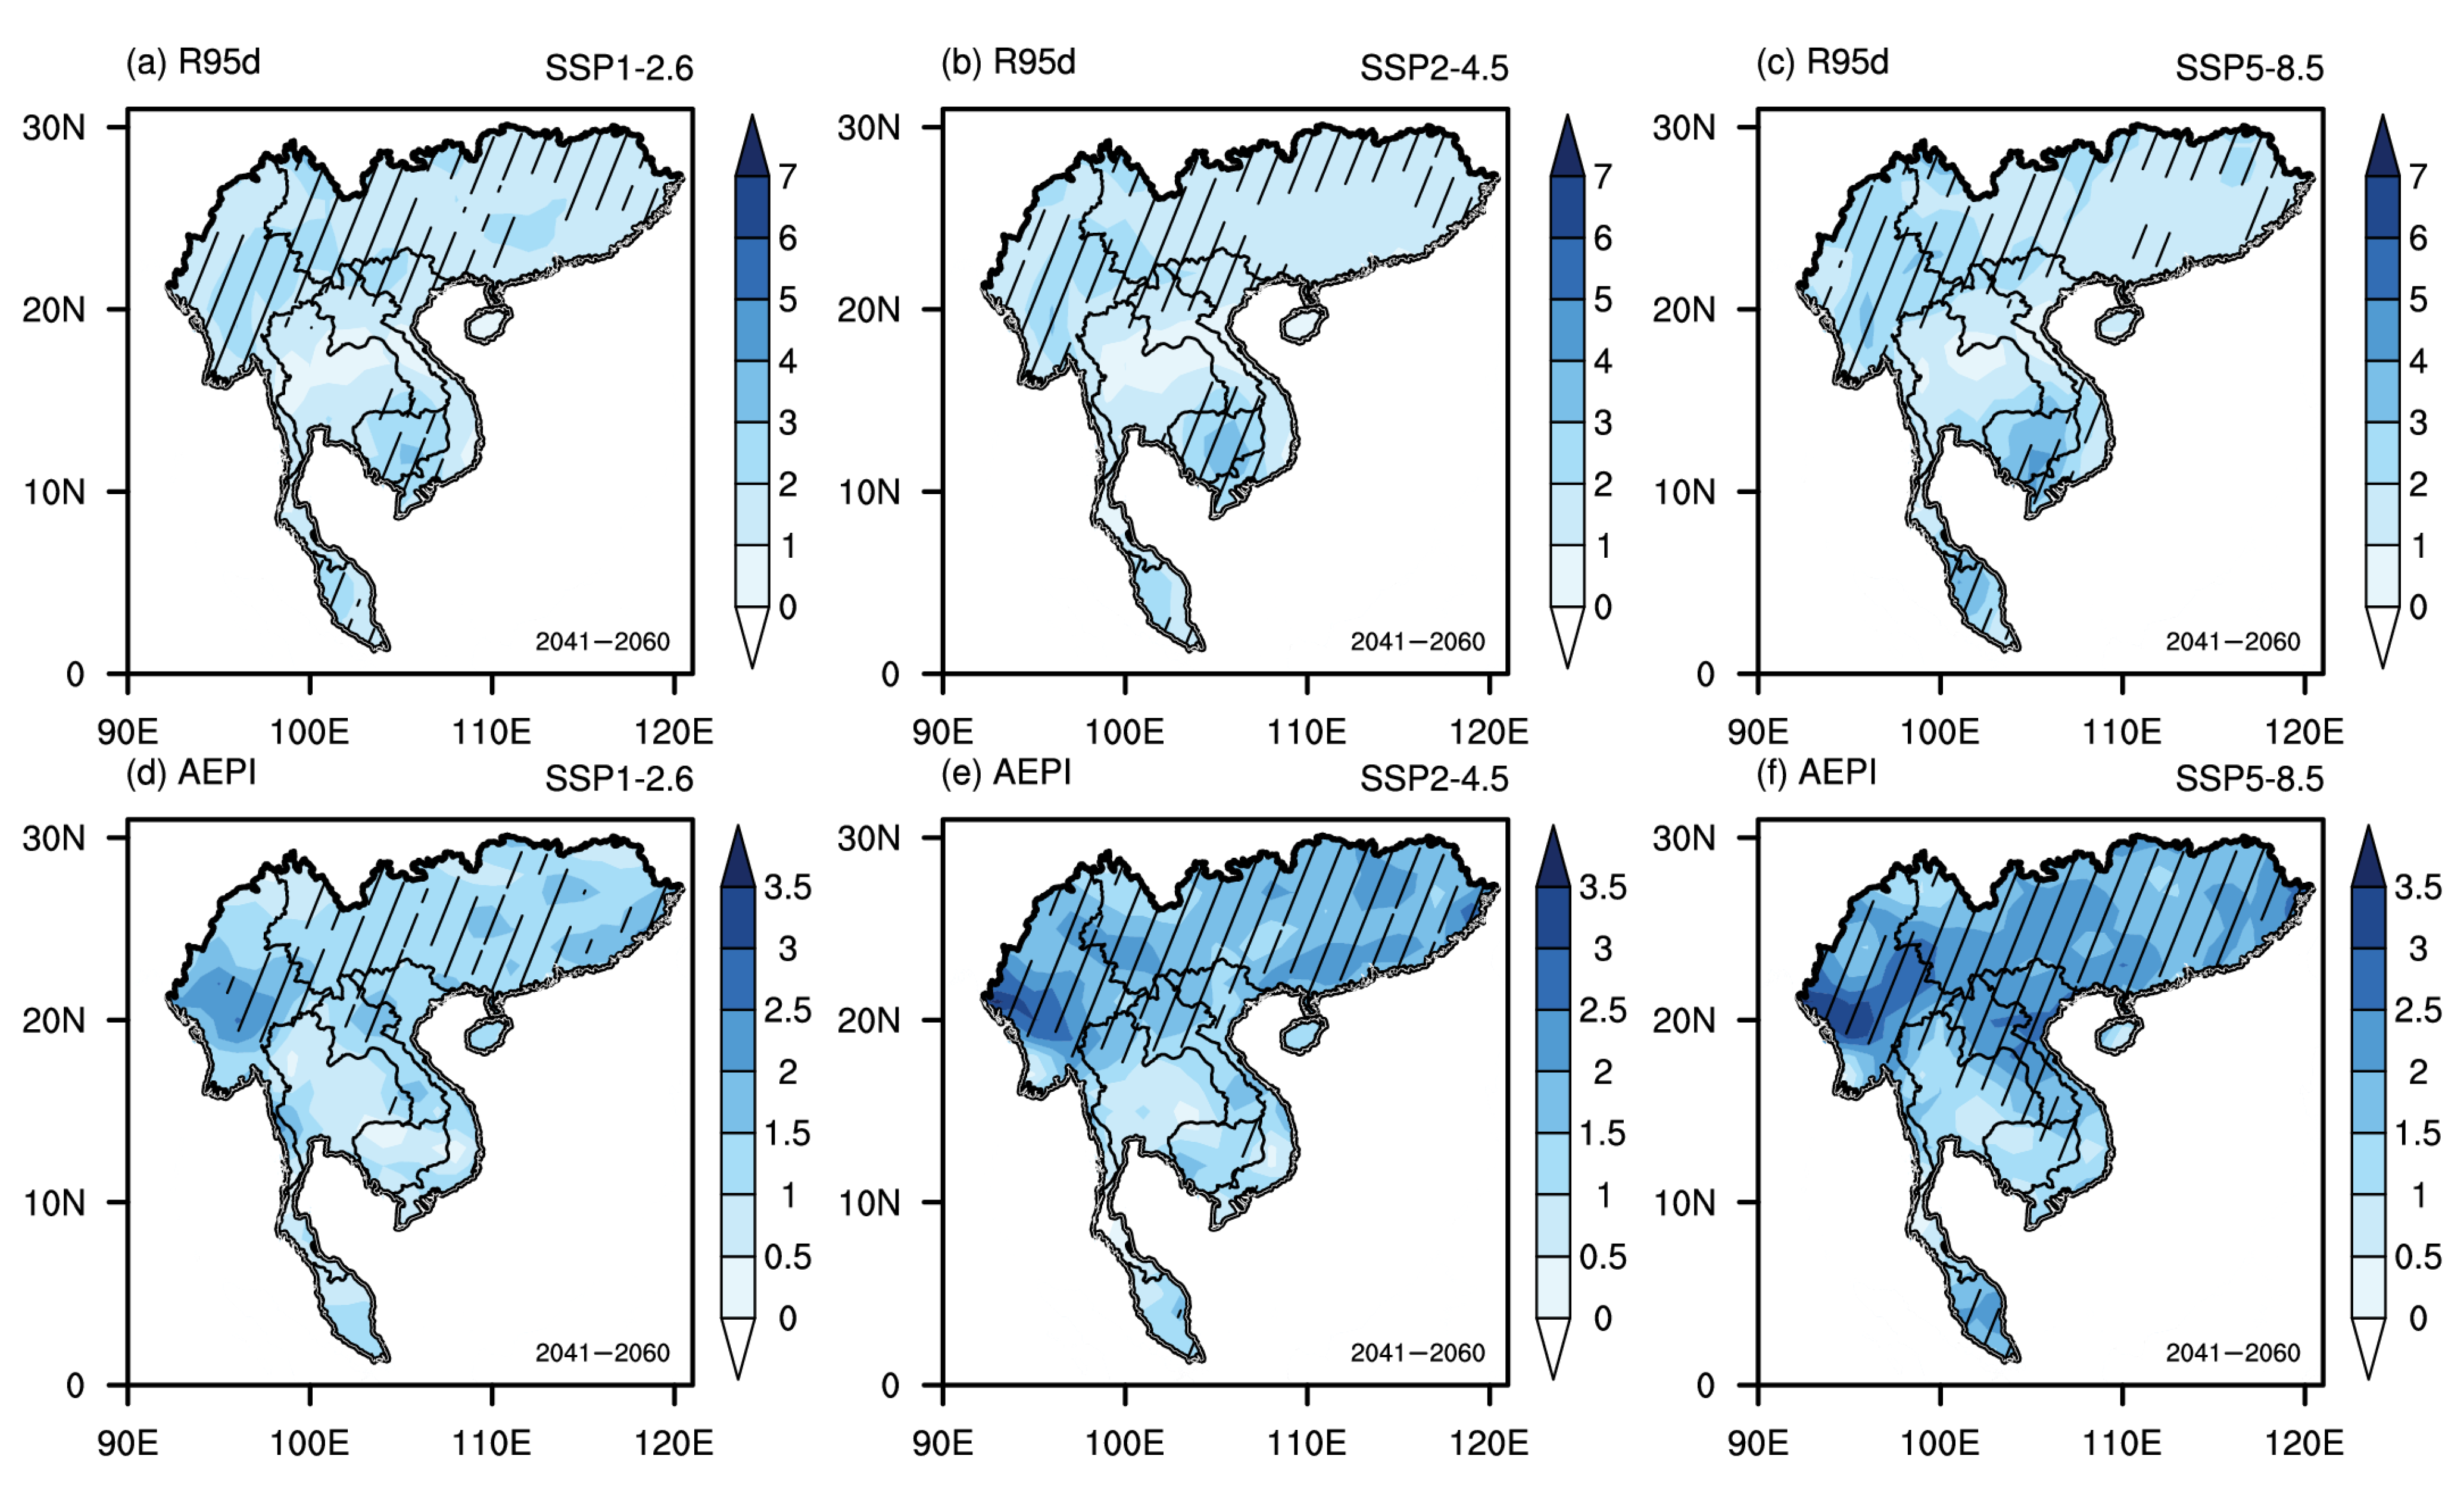
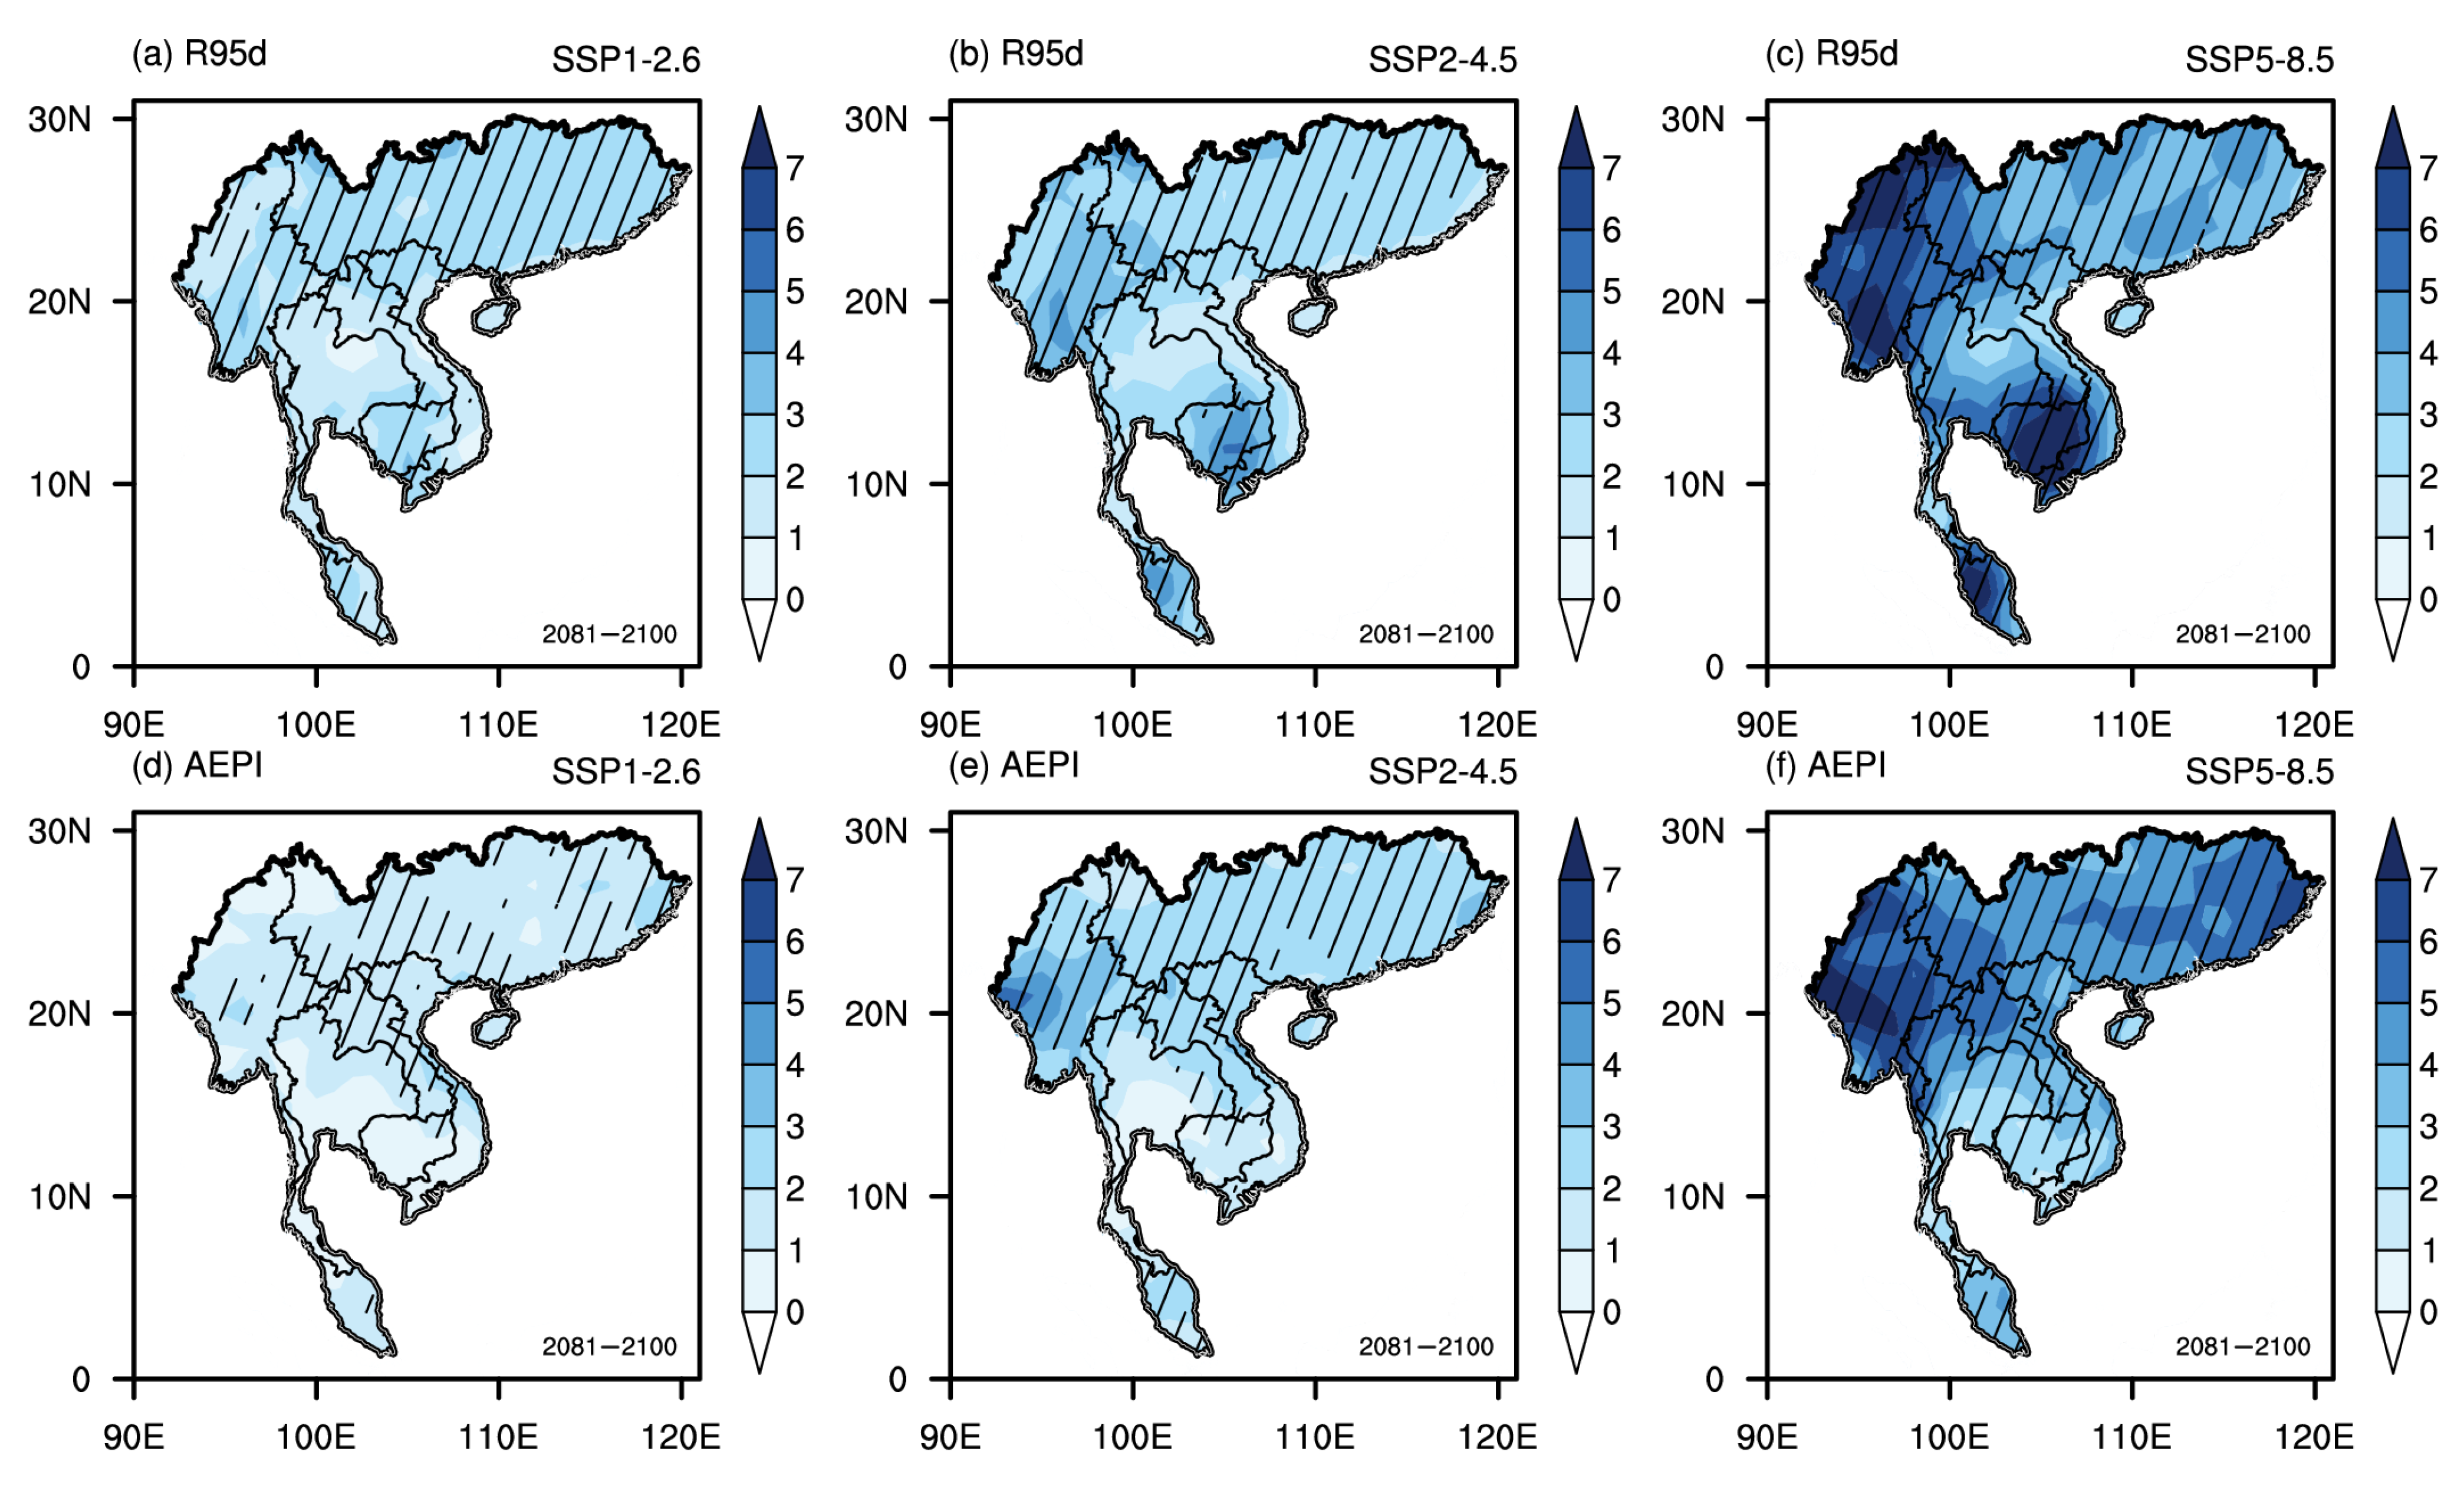
3.1. Changes in Extreme Precipitation
3.2. Changes in Population Exposure
3.3. Contribution of Different Factors to Population Exposure
4. Discussion
5. Conclusions
- (1)
- Extreme precipitation events in the INCSC region will be more intense and frequent under the 3 SSPs, especially under the business-as-usual scenario of SSP5-8.5. Early adoption of mitigation policies could probably slow the increase in extreme precipitation intensity in the INCSC region by the mid-21st century, as well as reduce the probability of both increased intensity and frequency of extreme precipitation by the end of the 21st century.
- (2)
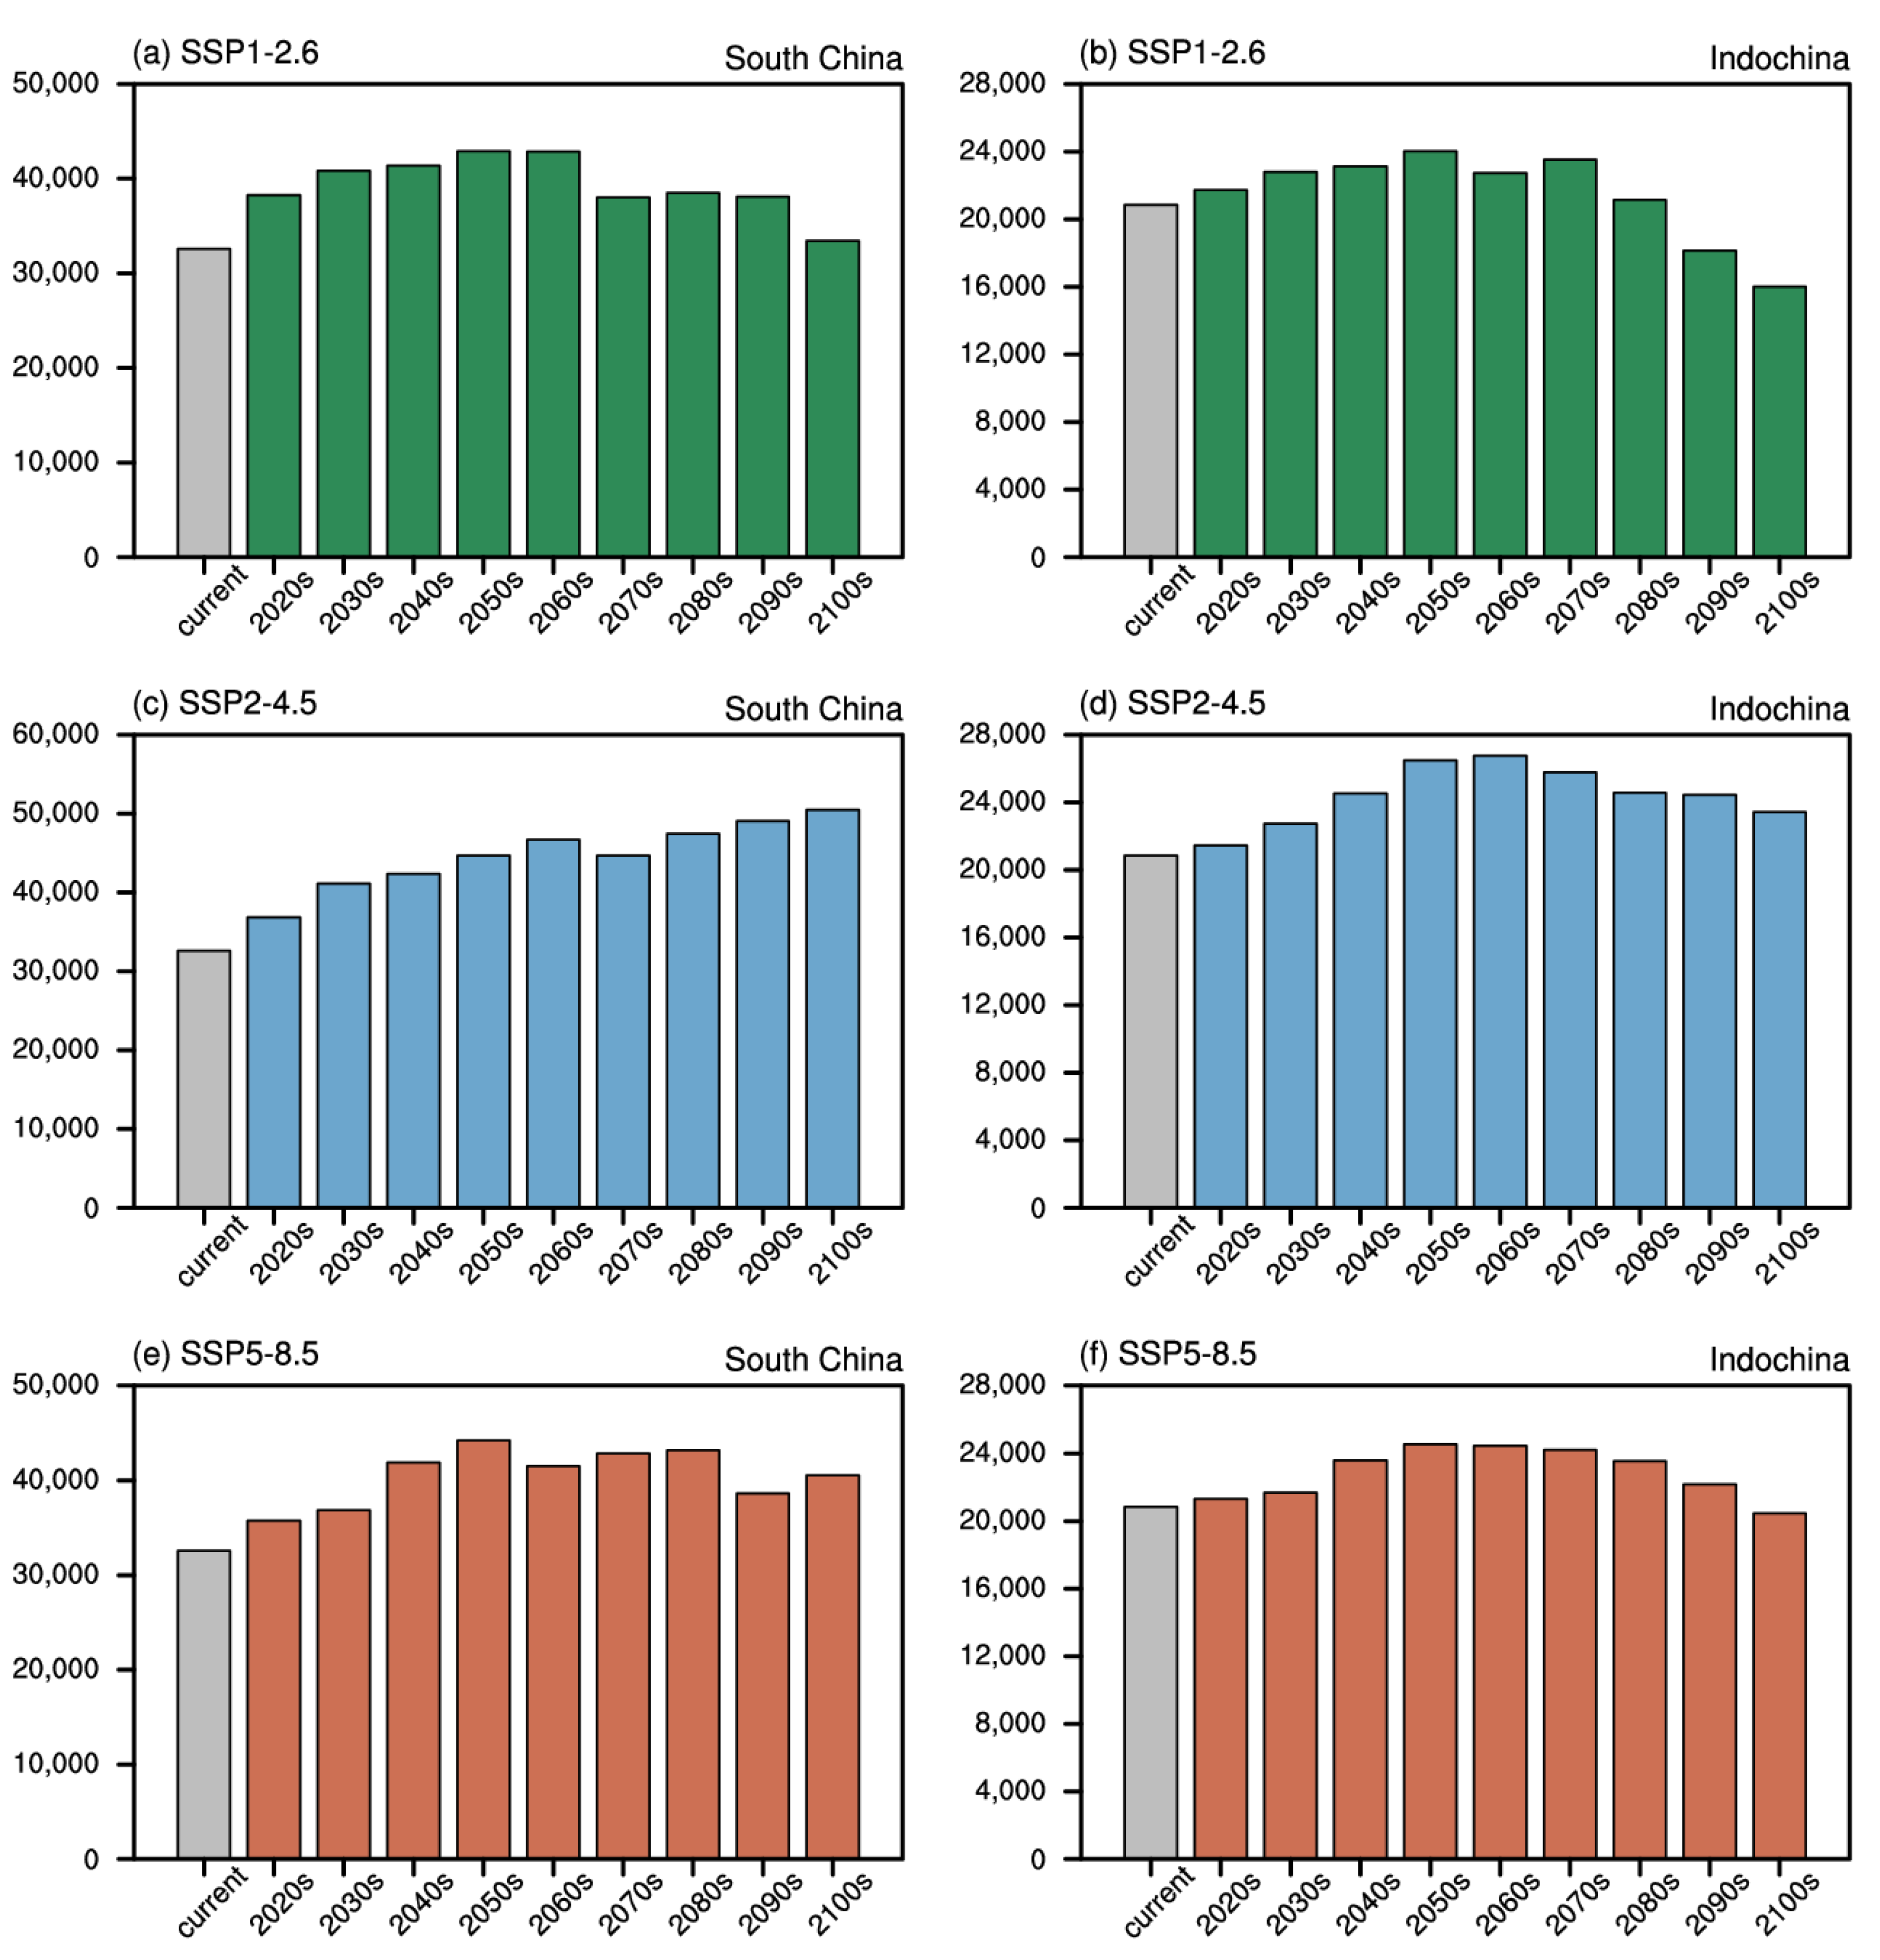
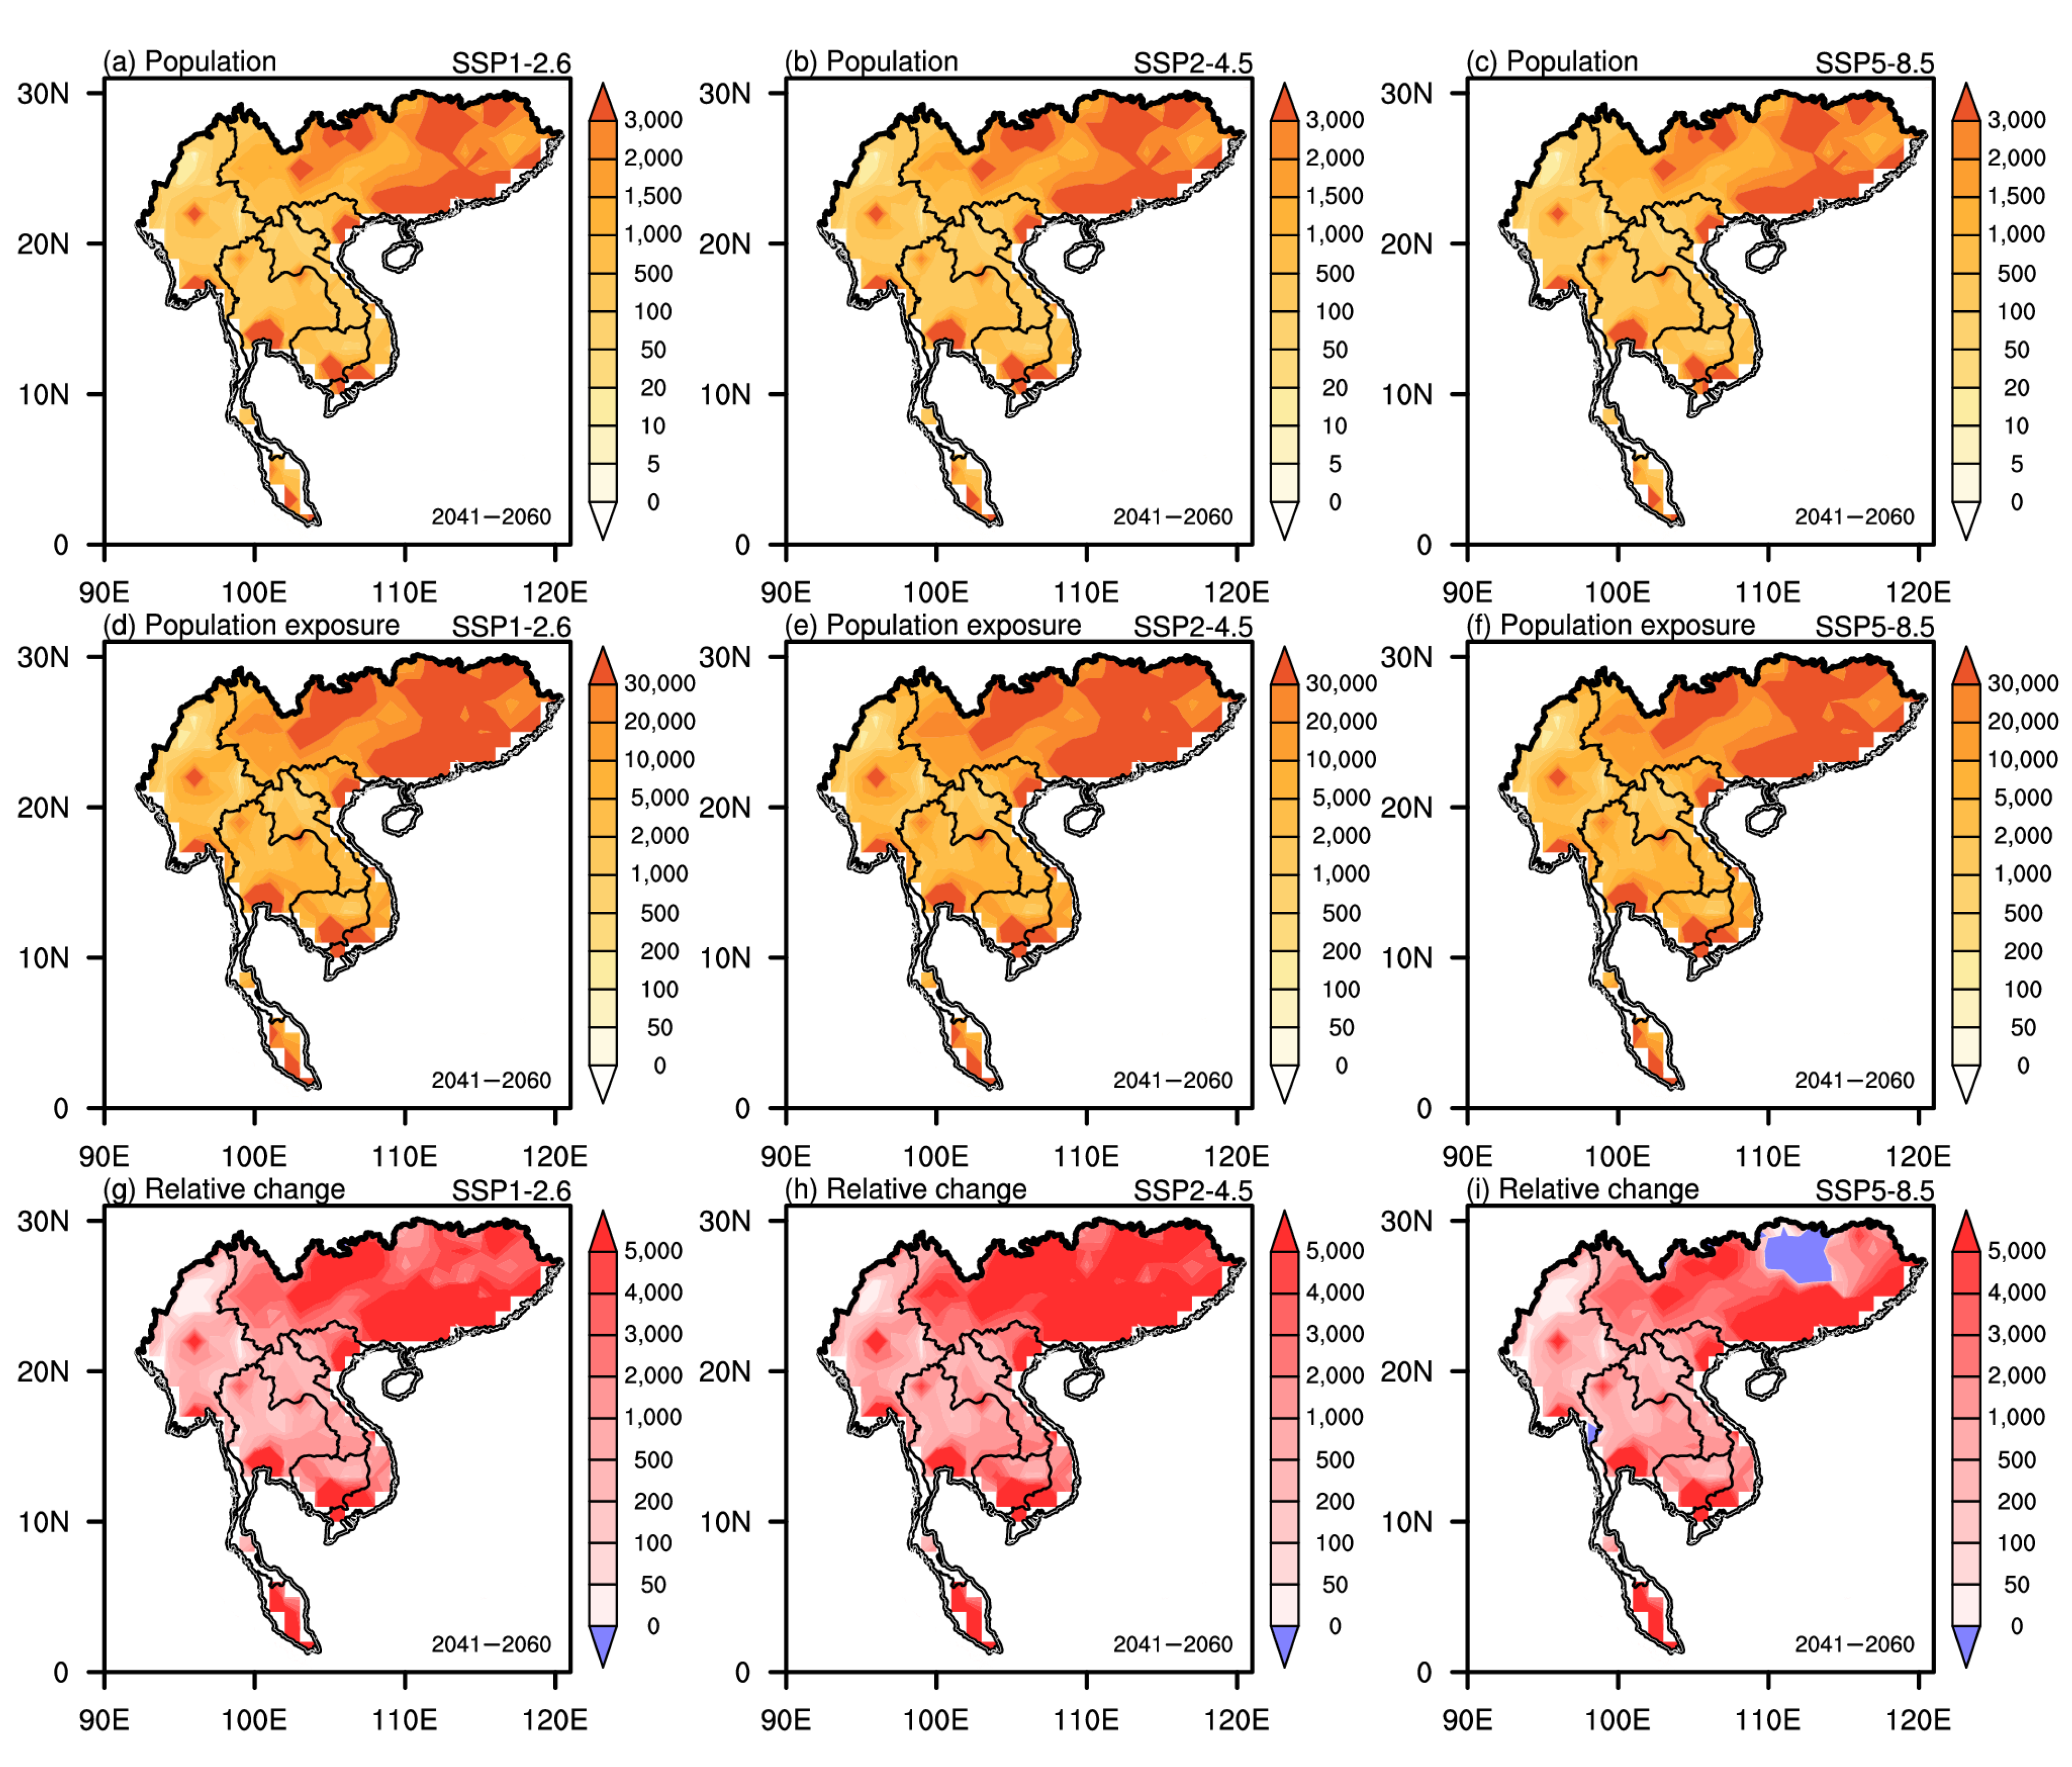
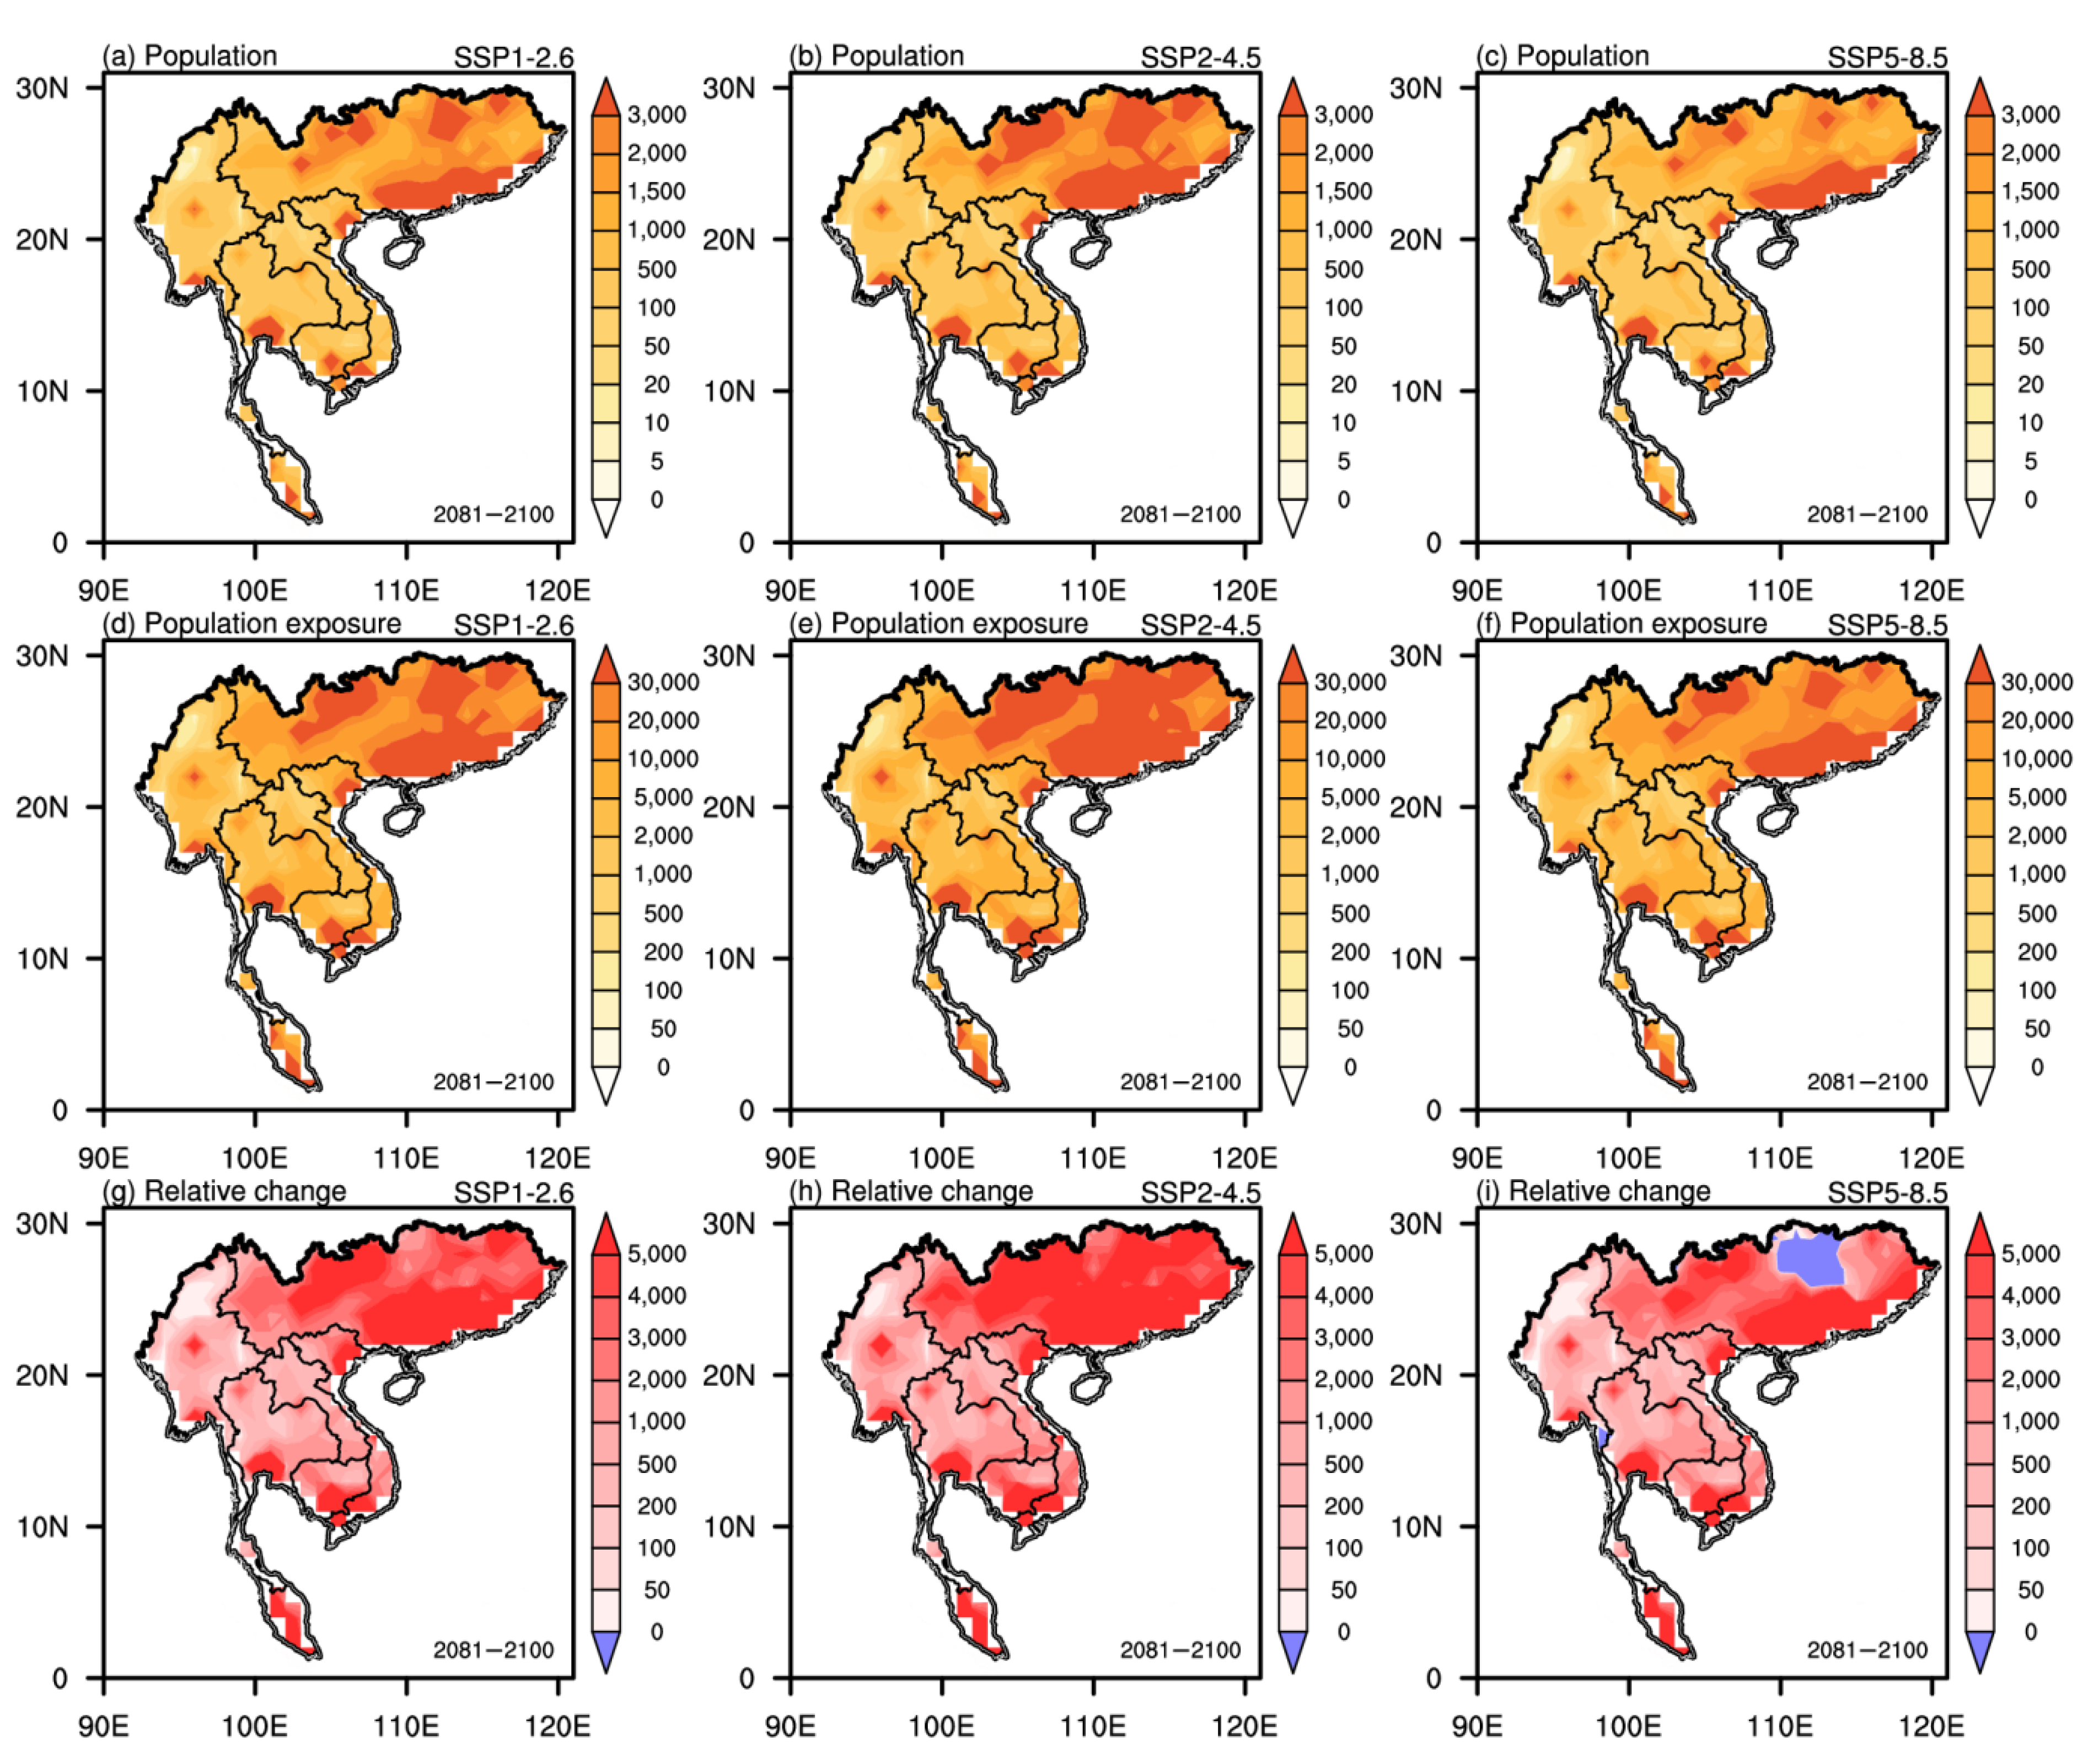
- There is expected to be a significant increase in population exposure to precipitation extremes in the INCSC region, and the largest population exposure can be expected under the SSP2-4.5 scenario. If early adoption of mitigation via the SSP1-2.6 scenario can be achieved, the average population exposure in South China can be limited to a relatively low level, while that in Indochina may even be smaller than it is currently. In terms of spatial distribution, the largest population exposure under the 3 SSPs is projected to be centered in southern South China, both in the middle and end of the 21st century.
- (3)
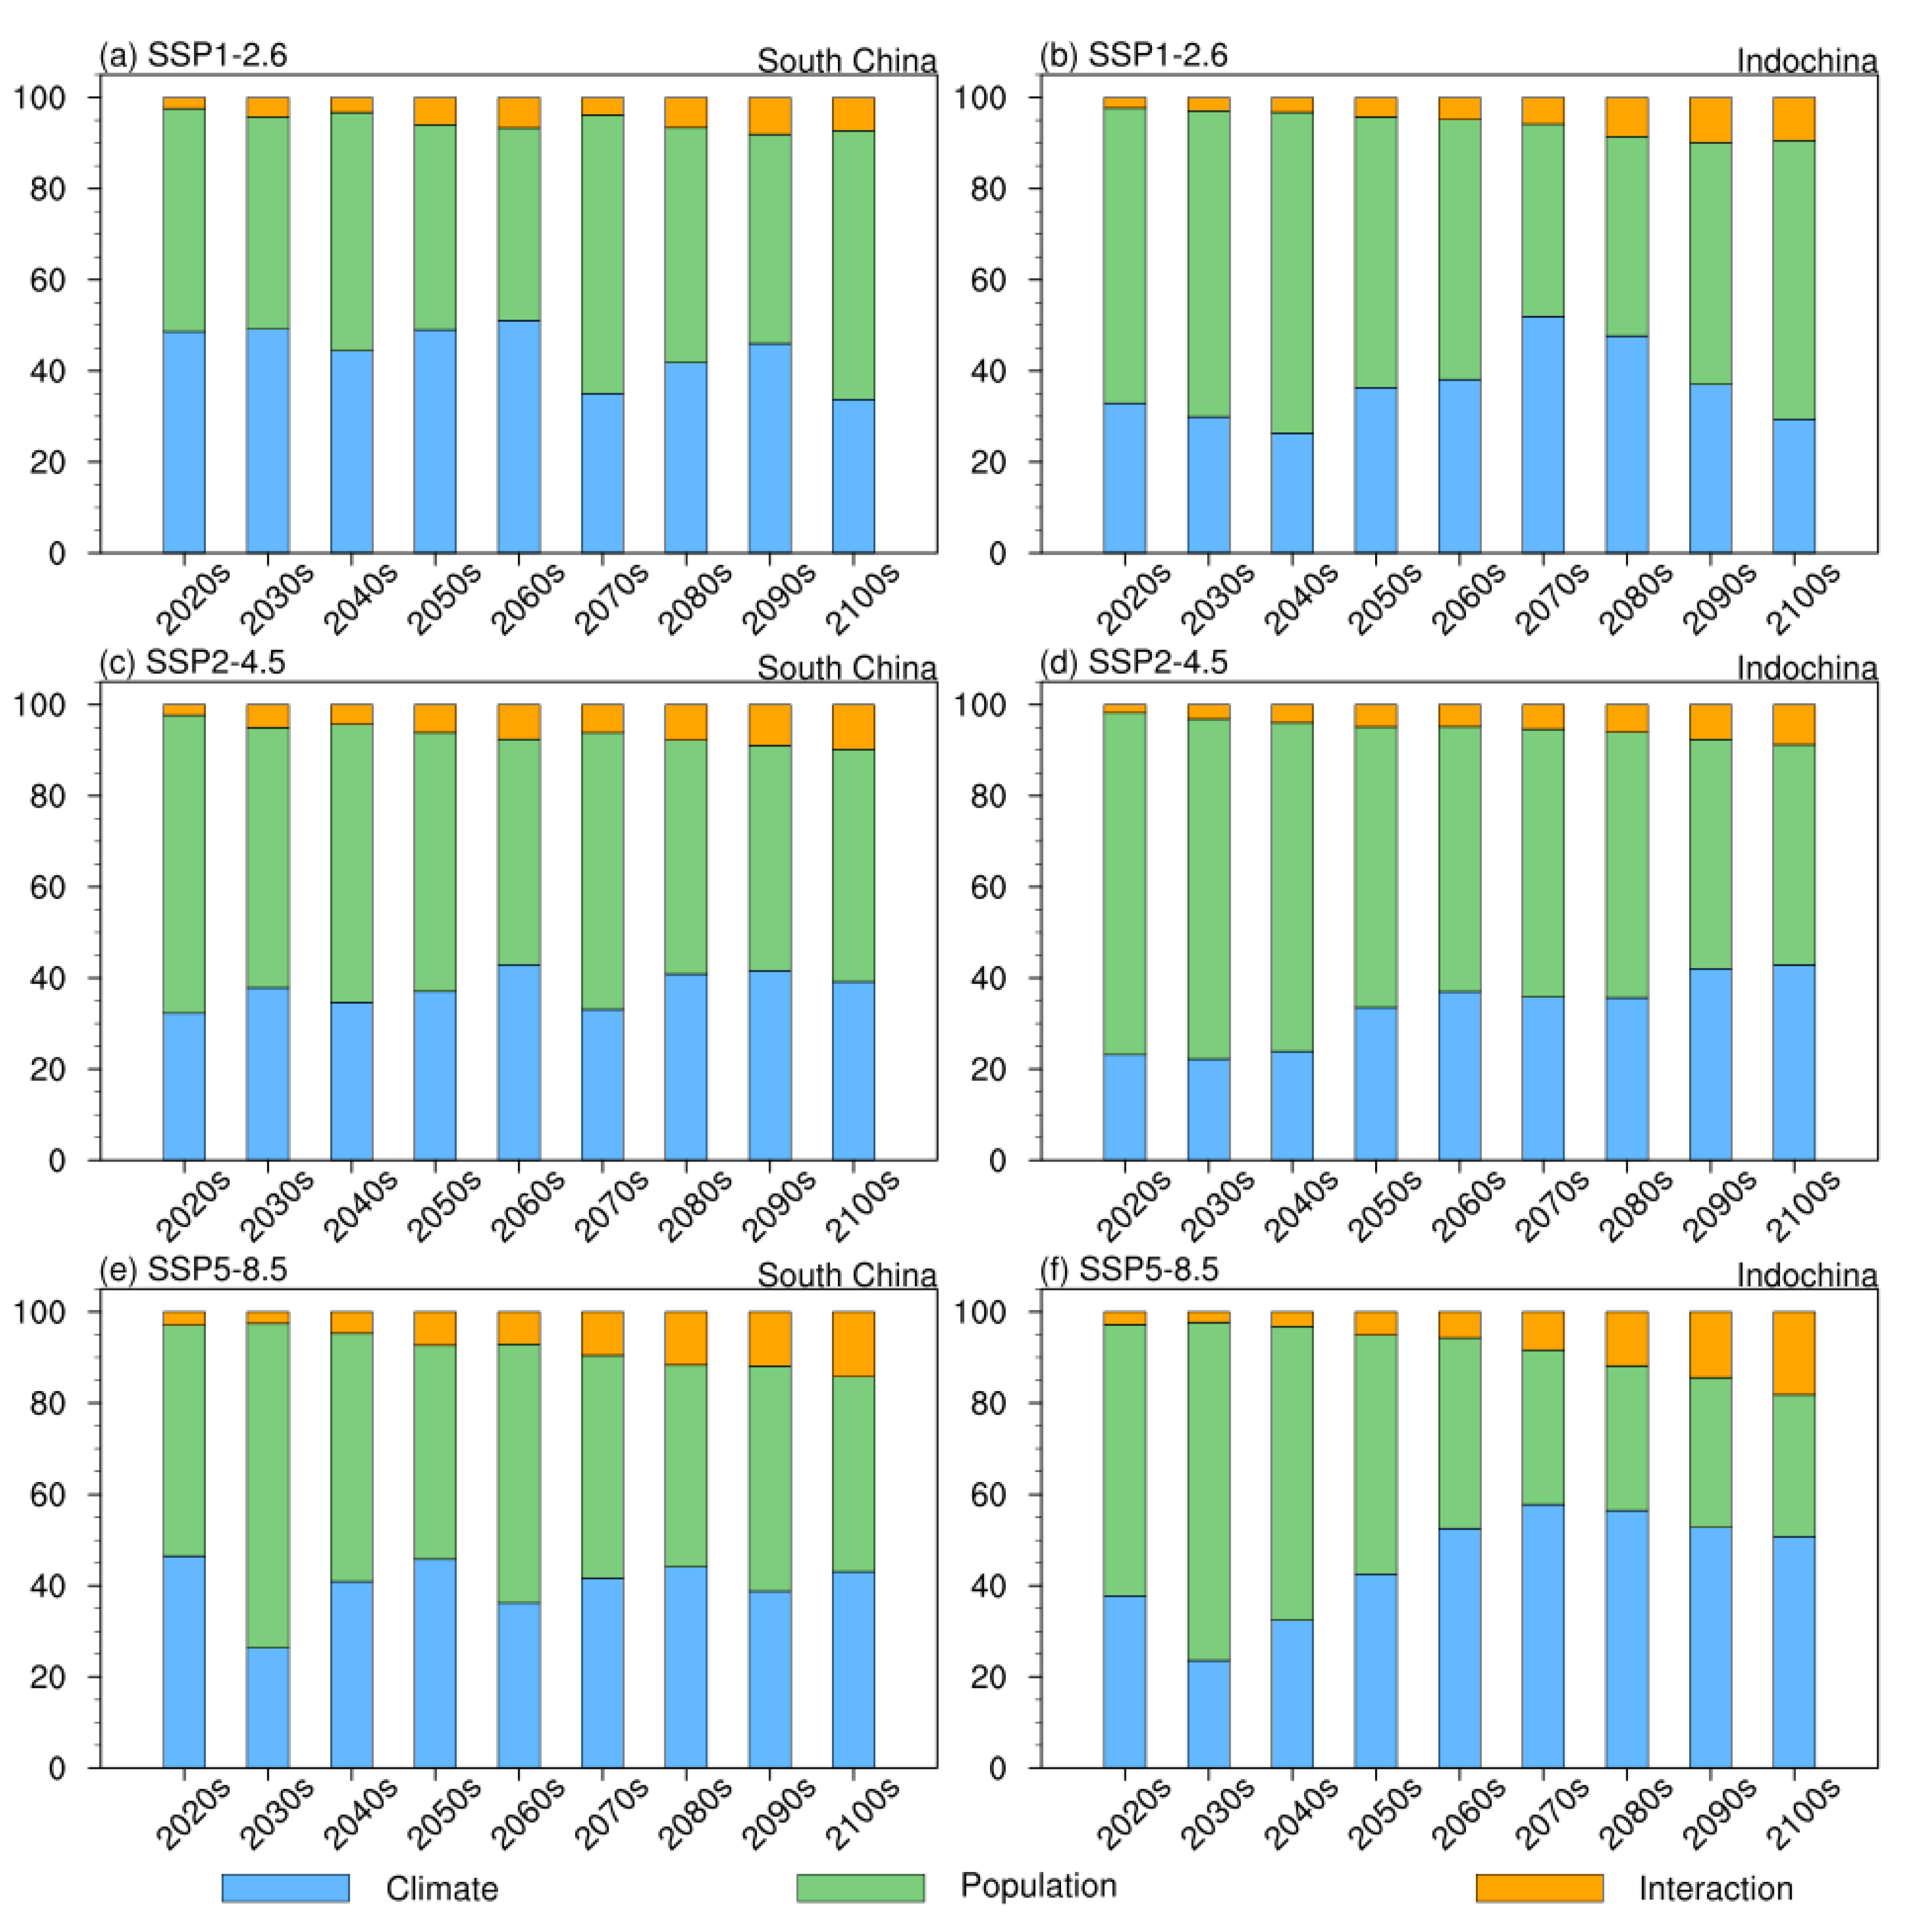
- As two pivotal factors, the frequency of extreme precipitation and the size of the human population can affect the exposure of that population to precipitation extremes. It is revealed in this study that the contribution of the population–climate interaction is likely to increase in the future, while different contributions from climate and population to population exposure correspond to different emission policies. Under SSP2-4.5, the importance of climate change and population–climate interaction is more likely to increase in the future.
Author Contributions
Funding
Institutional Review Board Statement
Informed Consent Statement
Data Availability Statement
Acknowledgments
Conflicts of Interest
References
- Groisman, P.Y.; Knight, R.W.; Easterling, D.R.; Karl, T.R.; Heger, G.C.; Razuvaev, V.N. Trends in intense precipitation in the climate record. J. Clim. 2005, 18, 1326–1350. [Google Scholar] [CrossRef]
- Alexander, L.V.; Zhang, X.; Peterson, T.C.; Caesar, J.; Gleason, B.; Klein Tank, A.M.G.; Haylock, M.; Collins, D.; Trewin, B.; Rahimzadeh, F.; et al. Global observed changes in daily climate extremes of temperature and precipitation. J. Geophys. Res. 2006, 111, D5. [Google Scholar] [CrossRef] [Green Version]
- Zhang, W.X.; Zhou, T.J. Increasing impacts from extreme precipitation on population over China with global warming. Sci. Bull. 2019, 65, 243–252. [Google Scholar] [CrossRef] [Green Version]
- Donat, M.G.; Lowry, A.L.; Alexander, L.V.; O’Gorman, P.A.; Maher, N. More extreme precipitation in the world’s dry and wet regions. Nat. Clim. Chang. 2017, 6, 508–513. [Google Scholar] [CrossRef]
- Papalexiou, S.M.; Montanari, A. Global and Regional Increase of Precipitation Extremes under Global Warming. Water Resour. Res. 2019, 55, 4901–4914. [Google Scholar] [CrossRef]
- Luo, N.; Guo, Y. Impact of model resolution on the simulation of precipitation extremes over China. Sustainability 2022, 14, 25. [Google Scholar] [CrossRef]
- Villafuerte, M.Q., II; Matsumoto, J. Significant influences of global mean temperature and ENSO on extreme rainfall in Southeast Asia. J. Clim. 2015, 28, 1905–1919. [Google Scholar] [CrossRef]
- Supari; Tangang, F.; Juneng, L.; Cruz, F.; Chung, J.X.; Ngai, S.T.; Salimun, E.; Mohd, M.S.F.; Santisirisomboon, J.; Singhruck, P.; et al. Multi-model projections of precipitation extremes in Southeast Asia based on CORDEX-Southeast Asia simulations. Environ. Res. Lett. 2020, 184, 109350. [Google Scholar] [CrossRef]
- Gao, Z.; Zhu, J.; Guo, Y.; Luo, N.; Fu, Y.; Wang, T. Impact of land surface processes on a record-breaking rainfall event on May 06–07, 2017, in Guangzhou, China. J. Geophys. Res. Atmos. 2021, 126, e2020JD032997. [Google Scholar] [CrossRef]
- Jiang, T.; Zhao, J.; Jing, C.; Cao, L.; Wang, Y.; Sun, H.; Wang, A.; Huang, J.; Su, B.; Wang, R. National and provincial population projected to 2100 under the Shared Socioeconomic Pathways in China. Clim. Chang. Res. 2017, 13, 128–137. [Google Scholar] [CrossRef]
- Matthews, T.K.R.; Wilby, R.L.; Murphy, C. Communicating the deadly consequences of global warming for human heat stress. Proc. Natl. Acad. Sci. USA 2017, 114, 3861–3866. [Google Scholar] [CrossRef] [Green Version]
- Coffel, E.D.; Horton, R.M.; de Sherbinin, A. Temperature and humidity based projections of a rapid rise in global heat stress exposure during the 21st century. Environ. Res. Lett. 2018, 13, 014001. [Google Scholar] [CrossRef]
- Chen, J.; Liu, Y.; Pan, T.; Liu, Y.; Sun, F.; Ge, Q. Population exposure to droughts in China under the 1.5 °C global warming target. Earth Syst. Dyn. 2018, 9, 1097–1106. [Google Scholar] [CrossRef] [Green Version]
- Su, B.; Huang, J.; Fischer, T.; Wang, Y.; Kundzewicz, Z.W.; Zhai, J.; Sun, H.; Wang, A.; Zeng, X.; Wang, G.; et al. Drought losses in China might double between the 1.5 °C and 2.0 °C warming. Proc. Natl. Acad. Sci. USA 2018, 115, 10600–10605. [Google Scholar] [CrossRef] [Green Version]
- Chen, H.; Sun, J. Significant increase of the global population exposure to increased precipitation extremes in the future. Earth’s Future 2021, 9, e2020EF001941. [Google Scholar] [CrossRef]
- Smirnov, O.; Zhang, M.; Xiao, T.; Orbell, J.; Lobben, A.; Gordon, J. The relative importance of climate change and population growth for exposure to future extreme droughts. Clim. Chang. 2016, 138, 41–53. [Google Scholar] [CrossRef] [Green Version]
- Chen, H.P.; Sun, J.Q. Increased population exposure to precipitation extremes in China under global warming scenarios. Atmos. Ocean. Sci. Lett. 2020, 13, 63–70. [Google Scholar] [CrossRef] [Green Version]
- Tang, B.; Hu, W.T.; Duan, A.M. Future projection of extreme precipitation indices over the Indochina Peninsula and South China in CMIP6 models. J. Clim. 2021, 34, 8793–8811. [Google Scholar] [CrossRef]
- Eyring, V.; Cox, P.M.; Flato, G.M.; Gleckler, P.J.; Abramowitz, G.; Caldwell, P.; Collins, W.D.; Gier, B.K.; Hall, A.D.; Hoffman, F.M.; et al. Taking climate model evaluation to the next level. Nat. Clim. Chang. 2019, 9, 102–110. [Google Scholar] [CrossRef] [Green Version]
- Jiang, D.B.; Hu, D.; Tian, Z.P.; Lang, X.M. Differences between CMIP6 and CMIP5 models in simulating climate over China and the East Asian monsoon. Adv. Atmos. Sci. 2020, 37, 1102–1118. [Google Scholar] [CrossRef]
- Zhu, H.H.; Jiang, Z.H.; LI, J.; Li, W.; Sun, C.X.; Li, L. Does CMIP6 inspire more confidence in simulating climate extremes over China? Adv. Atmos. Sci. 2020, 37, 1119–1132. [Google Scholar] [CrossRef]
- O’Neill, B.C.; Tebaldi, C.; van Vuuren, D.P.; Eyring, V.; Friedlingstein, P.; Hurtt, G.; Knutti, R.; Kriegler, E.; Lamarque, J.-F.; Lowe, J.; et al. The scenario model intercomparison project (ScenarioMIP) for CMIP6. Geosci. Model Dev. 2016, 9, 3461–3482. [Google Scholar] [CrossRef] [Green Version]
- Zhai, P.; Zhang, X.; Wan, H.; Pan, X. Trends in total precipitation and frequency of daily precipitation extremes over China. J. Climate 2005, 18, 1096–1108. [Google Scholar] [CrossRef]
- Qian, W.; Lin, X. Regional trends in recent precipitation indices in China. Meteorol. Atmos. Phys. 2005, 90, 193–207. [Google Scholar] [CrossRef]
- Wu, Y.; Wu, S.; Zhai, P. The impact of tropical cyclones on Hainan Island’s extreme and total precipitation. Int. J. Climatol. 2007, 27, 1059–1064. [Google Scholar] [CrossRef]
- Li, J.; Dong, W.; Yan, Z. Changes of climate extremes of temperature and precipitation in summer in eastern China associated with changes in atmospheric circulation in East Asia during 1960–2008. Chin. Sci. Bull. 2012, 57, 1856–1861. [Google Scholar] [CrossRef] [Green Version]
- Wang, Y.; Ding, Y.Y.; Miao, Q.L. Spatial and temporal variations of extreme precipitation events in Northeast China. Adv. Mat. Res. 2012, 573, 395–399. [Google Scholar] [CrossRef]
- Wu, C.; Huang, G.; Yu, H.; Chen, Z.; Ma, J. Spatial and temporal distributions of trends in climate extremes of the Feilaixia catchment in the upstream area of the Beijiang River Basin, South China. Int. J. Climatol. 2013, 34, 3161–3178. [Google Scholar] [CrossRef]
- Zhang, K.; Pan, S.; Cao, L.; Wang, Y.; Zhao, Y.; Zhang, W. Spatial distribution and temporal trends in precipitation extremes over the Hengduan Mountains region, China, from 1961 to 2012. Quat. Int. 2014, 349, 346–356. [Google Scholar] [CrossRef]
- Cui, D.; Wang, C.; Santisirisomboon, J. Characteristics of extreme precipitation over eastern Asia and its possible connections with Asian summer monsoon activity. Int. J. Climatol. 2018, 39, 711–723. [Google Scholar] [CrossRef]
- Tang, B.; Hu, W.T.; Duan, A.M. Assessment of extreme precipitation indices over Indochina and South China in CMIP6 models. J. Clim. 2021, 34, 7507–7524. [Google Scholar] [CrossRef]
- Yang, J.H.; Jiang, Z.H.; Wang, P.X.; Chen, Y.S. Temporal and spatial characteristic of extreme precipitation event in China. Clim. Environ. Res. 2008, 13, 75–83. [Google Scholar] [CrossRef]
- Choi, G.; Collins, D.; Ren, G.; Trewin, B.; Baldi, M.; Fukuda, Y.; Afzaal, M.; Pianmana, T.; Gomboluudev, P.; Huong, P.T.T.; et al. Changes in means and extreme events of temperature and precipitation in the Asia-Pacific Network region, 1955–2007. Int. J. Climatol. 2009, 29, 1906–1925. [Google Scholar] [CrossRef]
- Fatichi, S.; Caporali, E. A comprehensive analysis of changes in precipitation regime in Tuscany. Int. J. Climatol. 2009, 29, 1883–1893. [Google Scholar] [CrossRef]
- Zhang, X.; Alexander, L.; Hegerl, G.C.; Jones, P.; Tank, A.K.; Peterson, T.C.; Trewin, B.; Zwiers, F.W. Indices for monitoring changes in extremes based on daily temperature and precipitation data. Wiley Interdiscip. Rev. Clim. Chang. 2011, 2, 851–870. [Google Scholar] [CrossRef]
- Peng, Y.; Zhao, X.; Wu, D.; Tang, B.; Xu, P.; Du, X.; Wang, H. Spatiotemporal variability in extreme precipitation in China from observations and projections. Water 2018, 10, 1089. [Google Scholar] [CrossRef] [Green Version]
- Ou, T.; Chen, D.; Linderholm, H.W.; Jeong, J.-H. Evaluation of global climate models in simulating extreme precipitation in China. Tellus A Dyn. Meteorol. Oceanogr. 2013, 65, 19799. [Google Scholar] [CrossRef]
- Zhang, H.; Fraedrich, K.; Blender, R.; Zhu, X. Precipitation extremes in CMIP5 simulations on different time scales. J. Hydrometeorol. 2013, 14, 923–928. [Google Scholar] [CrossRef] [Green Version]
- Jiang, D.; Yue, S.; Lang, X. Timing and associated climate change of a 2 °C global warming. Int. J. Climatol. 2016, 36, 4512–4522. [Google Scholar] [CrossRef]
- Wang, X.; Jiang, D.; Lang, X. Extreme temperature and precipitation changes associated with four degree of global warming above pre-industrial levels. Int. J. Climatol. 2018, 39, 1822–1838. [Google Scholar] [CrossRef]
- Jones, B.; O’Neill, B.C.; McDaniel, L.; McGinnis, S.; Mearns, L.O.; Tebaldi, C. Future population exposure to US heat extremes. Nat. Clim. Chang. 2015, 5, 652–655. [Google Scholar] [CrossRef]

| Model Name | Atmospheric Resolution (lat × lon) | Country | Source Link |
|---|---|---|---|
| ACCESS-CM2 | 1.25° × 1.875° | Australia | http://doi.org/10.22033/ESGF/CMIP6.4332 (accessed on 8 May 2022) |
| ACCESS-ESM1-5 | 1.25° × 1.875° | Australia | http://doi.org/10.22033/ESGF/CMIP6.4333 (accessed on 8 May 2022) |
| BCC-CSM2-MR | 1.125° × 1.225° | China | http://doi.org/10.22033/ESGF/CMIP6.3050 (accessed on 8 May 2022) |
| CanESM5 | 1.406° × 1.406° | Canada | http://doi.org/10.22033/ESGF/CMIP6.3696 (accessed on 8 May 2022) |
| CESM2 | 0.938° × 1.25° | United States | http://doi.org/10.22033/ESGF/CMIP6.7768 (accessed on 8 May 2022) |
| CESM2-WACCM | 0.938° × 1.25° | United States | http://doi.org/10.22033/ESGF/CMIP6.10115 (accessed on 8 May 2022) |
| CNRM-CM6-1 | 1.406° × 1.406° | France | http://doi.org/10.22033/ESGF/CMIP6.4224 (accessed on 8 May 2022) |
| CNRM-ESM2-1 | 1.406° × 1.406° | France | http://doi.org/10.22033/ESGF/CMIP6.4226 (accessed on 8 May 2022) |
| EC-Earth3 | 0.703° × 0.703° | EC-EARTH consortium | http://doi.org/10.22033/ESGF/CMIP6.4912 (accessed on 8 May 2022) |
| EC-Earth3-Veg | 0.703° × 0.703° | EC-EARTH consortium | http://doi.org/10.22033/ESGF/CMIP6.4914 (accessed on 8 May 2022) |
| FGOALS-g3 | 2.25° × 2° | China | http://doi.org/10.22033/ESGF/CMIP6.3503 (accessed on 8 May 2022) |
| GFDL-ESM4 | 1° × 1.25° | United States | http://doi.org/10.22033/ESGF/CMIP6.9268 (accessed on 8 May 2022) |
| HadGEM3-GC31-LL | 1.25° × 1.875° | United Kingdom | http://doi.org/10.22033/ESGF/CMIP6.10901 (accessed on 8 May 2022) |
| INM-CM4-8 | 1.5° × 2° | Russia | http://doi.org/10.22033/ESGF/CMIP6.12337 (accessed on 8 May 2022) |
| INM-CM5-0 | 1.5° × 2° | Russia | http://doi.org/10.22033/ESGF/CMIP6.12338 (accessed on 8 May 2022) |
| IPSL-CM6A-LR | 1.259° × 2.5° | France | http://doi.org/10.22033/ESGF/CMIP6.5271 (accessed on 8 May 2022) |
| KACE-1-0-G | 1.25° × 1.875° | Korea | http://doi.org/10.22033/ESGF/CMIP6.8456 (accessed on 8 May 2022) |
| MIROC6 | 1.406° × 1.406° | Japan | http://doi.org/10.22033/ESGF/CMIP6.5771 (accessed on 8 May 2022) |
| MIROC-ES2L | 1.25° × 1.875° | Japan | http://doi.org/10.22033/ESGF/CMIP6.5770 (accessed on 8 May 2022) |
| MPI-ESM1-2-HR | 0.938° × 0.938° | Germany | http://doi.org/10.22033/ESGF/CMIP6.4403 (accessed on 8 May 2022) |
| MPI-ESM1-2-LR | 1.875° × 2.5° | Germany | http://doi.org/10.22033/ESGF/CMIP6.6705 (accessed on 8 May 2022) |
| MRI-ESM2-0 | 1.125° × 1.125° | Japan | http://doi.org/10.22033/ESGF/CMIP6.6929 (accessed on 8 May 2022) |
| NESM3 | 1.875° × 1.875° | China | http://doi.org/10.22033/ESGF/CMIP6.8790 (accessed on 8 May 2022) |
| NorESM2-LM | 1.875° × 2.5° | Norway | http://doi.org/10.22033/ESGF/CMIP6.8319 (accessed on 8 May 2022) |
| NorESM2-MM | 0.938° × 1.25° | Norway | http://doi.org/10.22033/ESGF/CMIP6.8321 (accessed on 8 May 2022) |
| UKESM1-0-LL | 1.25° × 1.875° | United Kingdom | http://doi.org/10.22033/ESGF/CMIP6.8321 (accessed on 8 May 2022) |
| Abbreviation | Descriptive Name | Definition | Unit |
|---|---|---|---|
| R95d | Extreme precipitation days | The number of days in the year when the daily precipitation exceeds the extreme precipitation threshold. | day |
| AEPI | Extreme precipitation intensity | Intensity of extreme precipitation. AEPI = total precipitation amount when the daily precipitation exceeds the extreme precipitation threshold/R95d. | mm day−1 |
Publisher’s Note: MDPI stays neutral with regard to jurisdictional claims in published maps and institutional affiliations. |
© 2022 by the authors. Licensee MDPI, Basel, Switzerland. This article is an open access article distributed under the terms and conditions of the Creative Commons Attribution (CC BY) license (https://creativecommons.org/licenses/by/4.0/).
Share and Cite
Tang, B.; Hu, W. Significant Increase in Population Exposure to Extreme Precipitation in South China and Indochina in the Future. Sustainability 2022, 14, 5784. https://doi.org/10.3390/su14105784
Tang B, Hu W. Significant Increase in Population Exposure to Extreme Precipitation in South China and Indochina in the Future. Sustainability. 2022; 14(10):5784. https://doi.org/10.3390/su14105784
Chicago/Turabian StyleTang, Bin, and Wenting Hu. 2022. "Significant Increase in Population Exposure to Extreme Precipitation in South China and Indochina in the Future" Sustainability 14, no. 10: 5784. https://doi.org/10.3390/su14105784
APA StyleTang, B., & Hu, W. (2022). Significant Increase in Population Exposure to Extreme Precipitation in South China and Indochina in the Future. Sustainability, 14(10), 5784. https://doi.org/10.3390/su14105784