Article

Sustainable Agriculture and Self-Sufficiency in Sweden—Calculation of Climate Impact and Acreage Need Based on Ecological Recycling Agriculture Farms

Biodynamic Research, Järna International Steiner College, 153 96 Mölnbo, Sweden
*
Author to whom correspondence should be addressed.
Sustainability 2022, 14(10), 5834; https://doi.org/10.3390/su14105834
Submission received: 31 March 2022 / Revised: 25 April 2022 / Accepted: 26 April 2022 / Published: 11 May 2022
(This article belongs to the Special Issue Just Food System Transformations)

Abstract

:
A necessary reduction in climate impact and raised interest in the self-sufficiency of food in Sweden serve as the major background for the study. The purpose was to examine whether conversion of Swedish agriculture following principles of Ecological Recycling Agriculture (ERA) could be a realistic alternative. Case studies of 22 ERA farms were performed, and results were presented for five production groups in kg production, carbon sequestration, and nutrient balance per hectare. The farms show climate impact substantially lower than Swedish average agriculture, through 85% lower commodity purchases and 2.3 times larger carbon sequestration due to more ley cropping. Target diets with varying amounts of meat and dairy products were defined and matched with the production and presented in scenarios where the farms’ staple food production is upscaled for a Swedish population of 11 million inhabitants. Results are presented in kg of food category produced, hectares of arable land, CO2 equivalents, and kg of N surplus per capita. The scenario results show that it is possible to achieve at least a 90% decrease in climate impact. It is concluded that it is within range for Sweden to be self-sufficient in staple foods based on the available acreage of arable land by adopting Ecological Recycling Agricultural principles in a similar manner as the studied farms.

1. Introduction

There are well-known challenges to future food supply and security with concerns for the growing human population, climate changes, loss of biological diversity, decreasing acreages for food production, heavy dependence on fossil resources, decreased animal welfare, farmers’ welfare, and so forth. This study is focused on climate impact, efficient nutrient supply with reduced emissions of plant nutrients to the water systems and atmosphere, production capacity, and self-reliance in the food system in Sweden.
The UN climate conference in Paris 2015 (COP21), followed by Glasgow 2026 (COP 2026) [1], established guidelines for the need to decrease emissions of greenhouse gases in order to safeguard that the rise in global temperature will be kept below 1.5–2 °C by the year 2050. The coming years will be absolutely vital for avoiding disastrous climate change according to the IPCC (Intergovernmental Panel on Climate Change) [2]. The EU, contributing to 10% of the global greenhouse gas emissions in 2009, set the target of diminishing emissions by 80–95% by 2050. The Swedish Environmental Protection Agency has formed scenarios and action plans for the Swedish emissions and uptakes of greenhouse gases for 2045. The target is that the climate impact from all sectors in Sweden must be lowered by at least 85 percent compared to 1990 [3].
In total, the greenhouse gas emissions from all Swedish consumption are around 8 tons of CO2e per person per year. The yearly net emissions from consumption increased until 2011 but have thereafter decreased, but over the years, a larger portion has been imported. Food is the second largest contributor to household emissions, equalling about 25% of the total climate impact, whereof 64% was imported emissions from food and commodities such as fodder, fertilisers, chemicals, and fuels used in the food system. The possibilities of changed land use, deforestation, or soil losses are not considered in these numbers. If these factors are considered, food’s climate impact is around 40% [4]. In order to follow the Paris agreement, assuming equal distribution between sectors, the household’s food climate impact needs to be reduced from 1.4 to 0.14 tons of CO2e per capita per year within less than 30 years.
We should also remember that photosynthesis is the primary source of all biological activity on Earth. Strictly speaking, only green plants produce; everything else is consumption and breakdown. Agriculture and silviculture were, until quite recently in history, the only sectors providing food and energy to society using only local resources. A big agricultural step was taken during the 19th century with the introduction of crop rotations, including nitrogen-fixating legumes. In combination with technological development, plant and animal improvements, breaking new land, and ditching, the rise in productivity was absolutely vital for feeding a rising population [5]. In Sweden, the population went from 2 to 7 million inhabitants from the year 1800 to 1950. This population growth happened largely before the introduction of chemical fertilisers and pesticides.
By the 1960s, Sweden was largely self-sufficient in food supply. However, at that time, dependence on imported commodities was already much larger than earlier in the century. Food consumption has of course changed since then; particularly noticeable is the increased consumption of white meat, pork, and chicken, from 27 to 54 kg per capita, and vegetable consumption, which has tripled. The increase in white meat is mostly chicken. This is, from a systems perspective, troublesome, since hens and chickens are largely fed with grain that could be used for human food. Regarding meat from grazing animals, beef and lamb, consumption is on the same level, but the domestic production nowadays is only 54% for beef and 28% for lamb [6].
The significant use of plant nutrients in the conventional agriculture, and parts of the ecological agriculture, are dubiously sustainable since it is largely based on fossil fuels and mineral sources. The main problem may be that it was possible to break biological recycling principles when mineral fertilisers were introduced in the 20th century. The result was specialised animal production farms, dependent on purchased fodder and creating nutrient excess, gathering in some regions [7]. This led to increased eutrophication of waters and emissions of the greenhouse gas nitrous oxide. In other regions (on the plains), cropping farms, dependent on imported fertilisers, are dominant. Often, there is not enough ley cropping, which results in degraded soils with lower humus (carbon) content, loss of biological diversity, and dependence on chemical pesticides [8]. Thus, it is desirable to have legume–grass leys on at least 35% of the arable land in the Swedish plains, where a large percentage of farms are currently cropped totally without leys [9].
Animal husbandry with a high degree of fodder and nutrients on all farms in combination with crop rotations, including legume–grass leys, was previously a prerequisite and resulted in a largely self-supportive recycling agricultural system. This was studied in the Baltic Sea project BERAS (Baltic Ecological Recycling Agriculture and Society) [10,11].

1.1. Clarifications

  • Following the Nordic guidelines, we use the term ecological as a synonym for organic;
  • CO2e is the used abbreviation for CO2 equivalents (carbon dioxide equivalents);
  • ERA (e.g., ERA farms) is an abbreviation of Ecological Recycling Agriculture (defined below).

1.2. Hypothesis, Aim and Goal

Our hypothesis was that Sweden could be self-sufficient in staple foods, and fulfil the climate goals, by converting the Swedish agriculture following the principles of Ecological Recycling Agriculture (ERA), but that we would need to decrease our meat consumption to the level seen in Sweden in the 1960s. Such a change would be in line with the New Nordic Diet developed by Saxe et al. [12], but not as drastic as that suggested by the EAT–Lancet Commission [13]. The aim was to assess the whole food system including both production and consumption patterns, and to determine whether a hypothetical conversion of the Swedish agriculture, resembling existing ERA farms in Sweden today, could both fulfil the staple food demand of the Swedish population, and, at the same time, decrease climate impact by 90% in accordance with the national climate goals, while minimising the risk of eutrophication.
The goal was to create a numerical hypothetical conversion and find out what possible changes in our diet it would imply, based on what the studied farms produce today. The study focuses on Sweden, but we believe that many of the principles and results could be used in many regions around the world. One should, however, bear in mind that we were not able to include economy or policies needed for a major conversion. Production of fuels, transports, and infrastructure were also omitted.

1.3. Contribution

The study presents an alternative picture of what sustainable food production could look like, compared to the conventional high-input system mostly promoted in the Western world today.
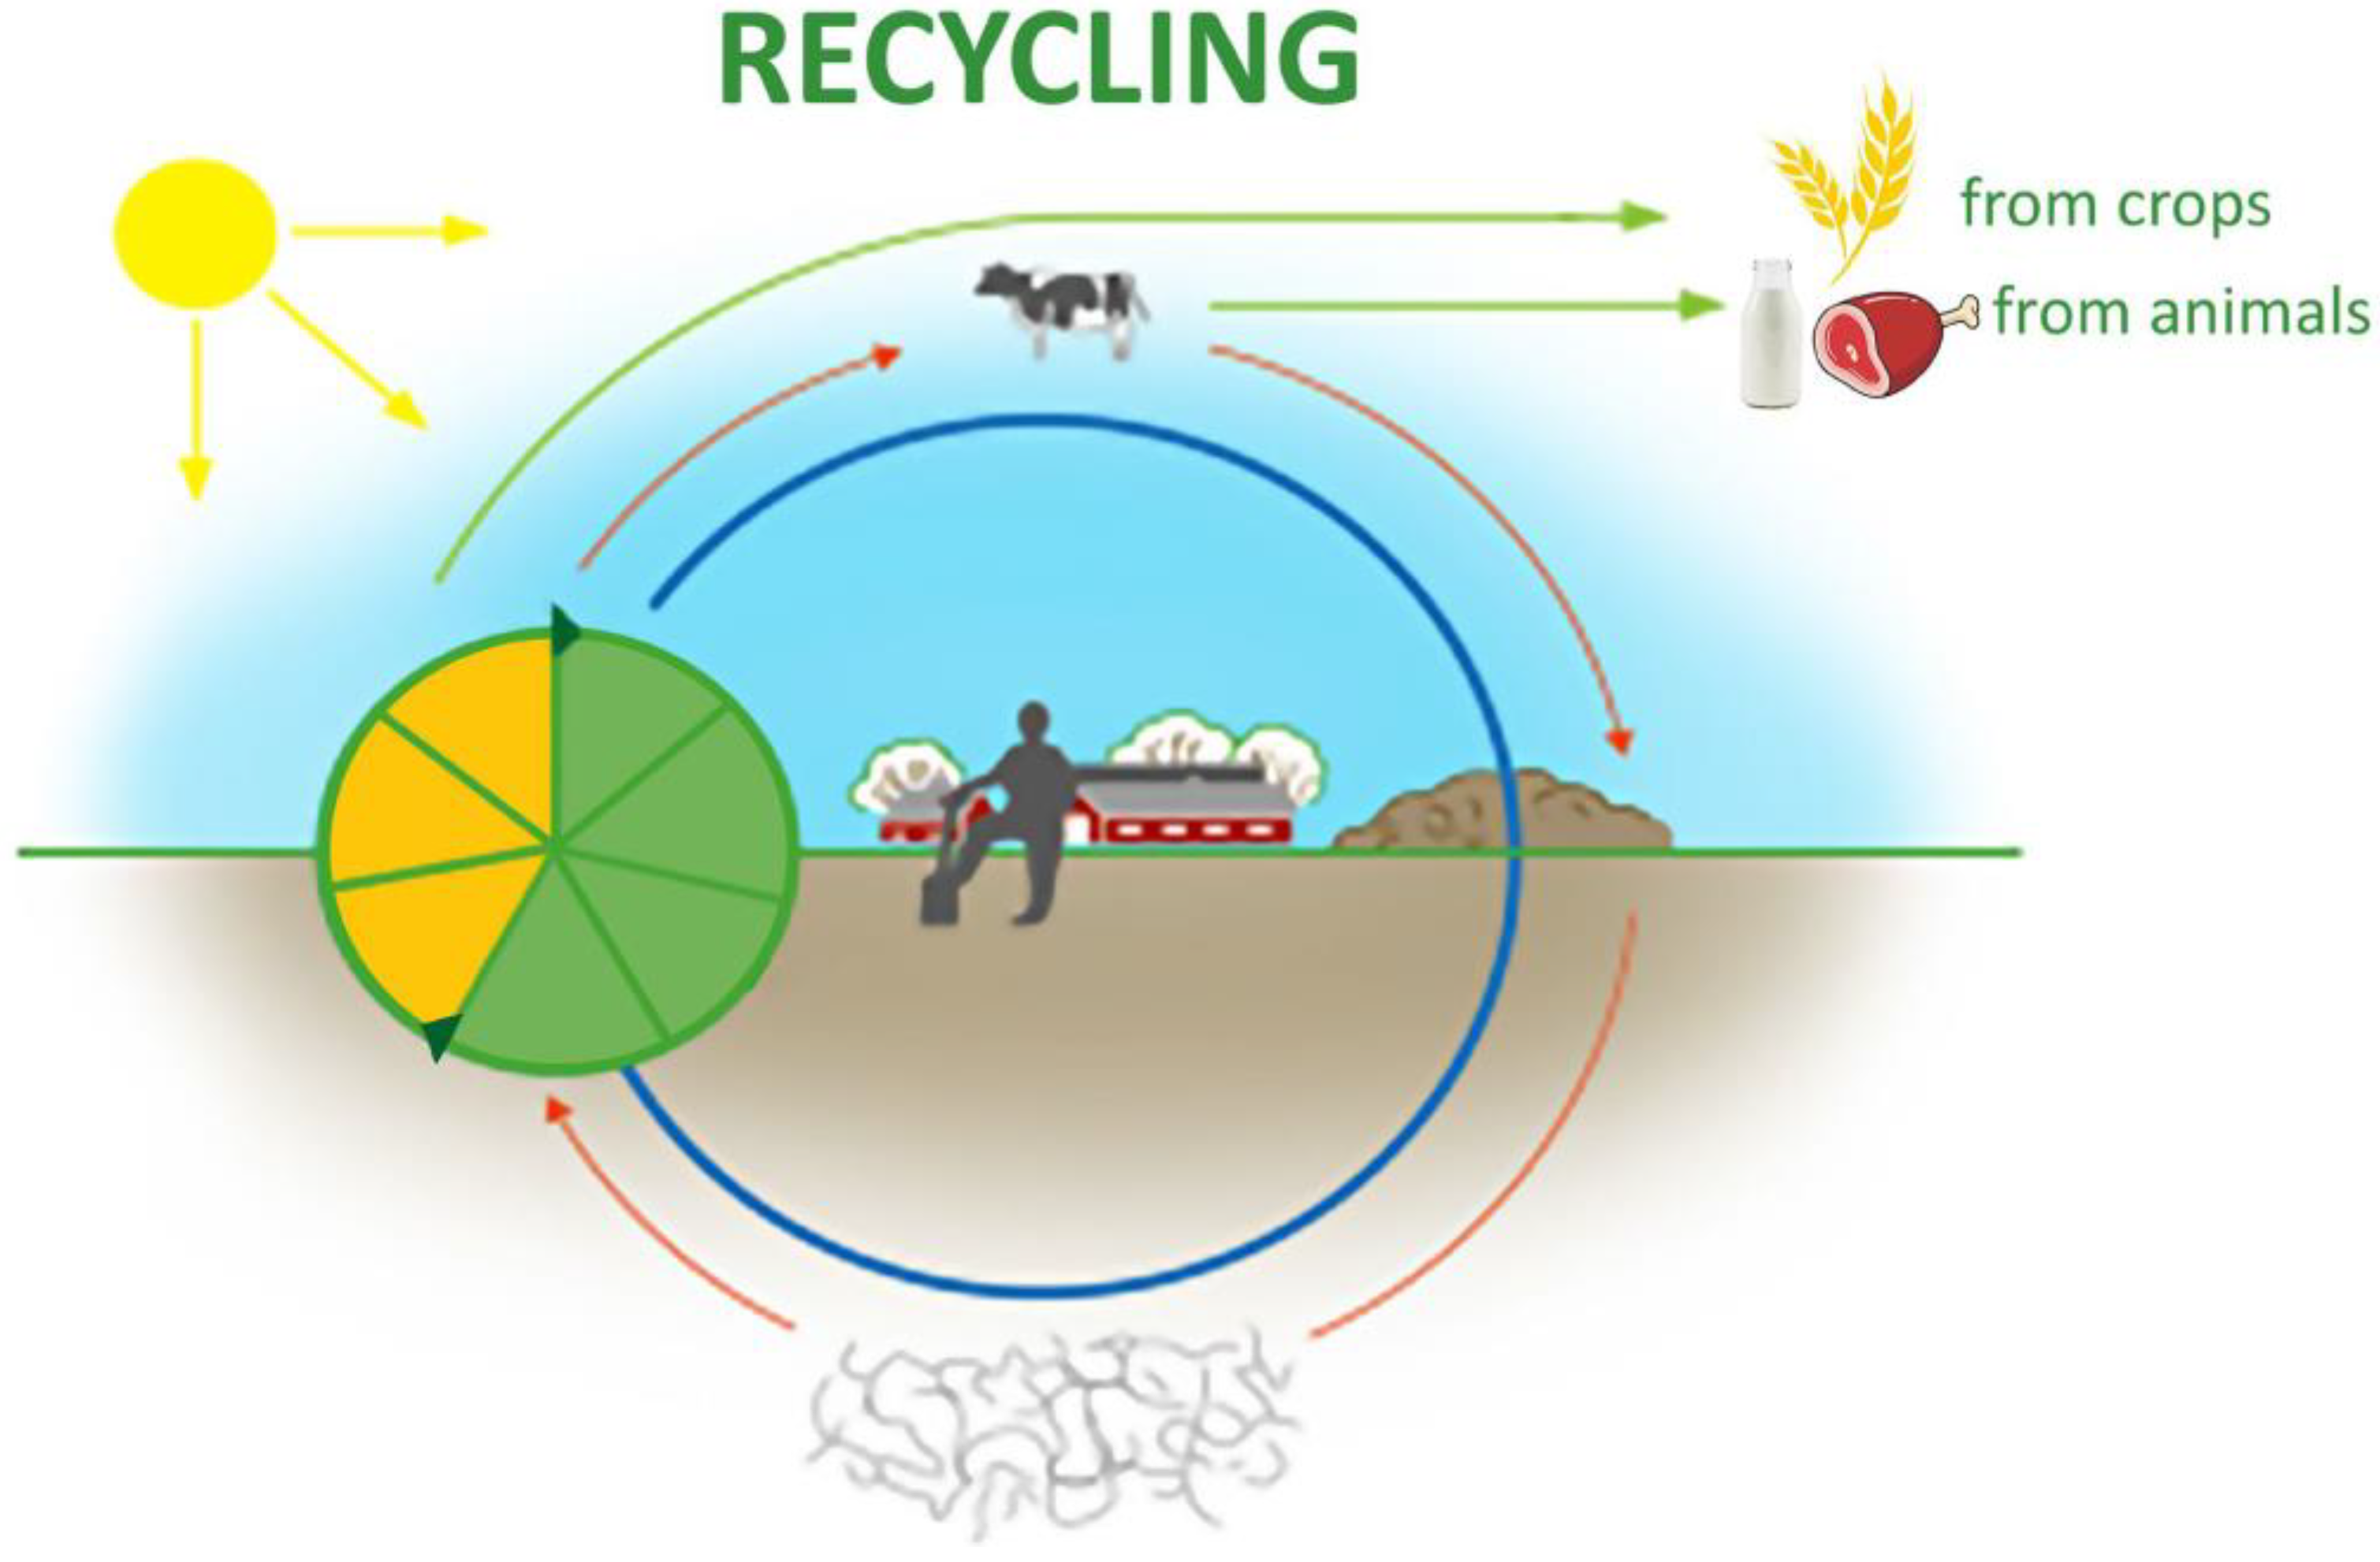
  • Ecological (organic) Recycling Agriculture (ERA) is in focus. It is both self-supplying and productive agriculture. It imports no or very little manure/fertilisers and animal fodder, uses no chemical pesticides, and produces more than one product category of food. The nutrients needed are supplied by legume–grass leys on a large part of the acreage, in combination with well-adapted animal stock and crop rotation.
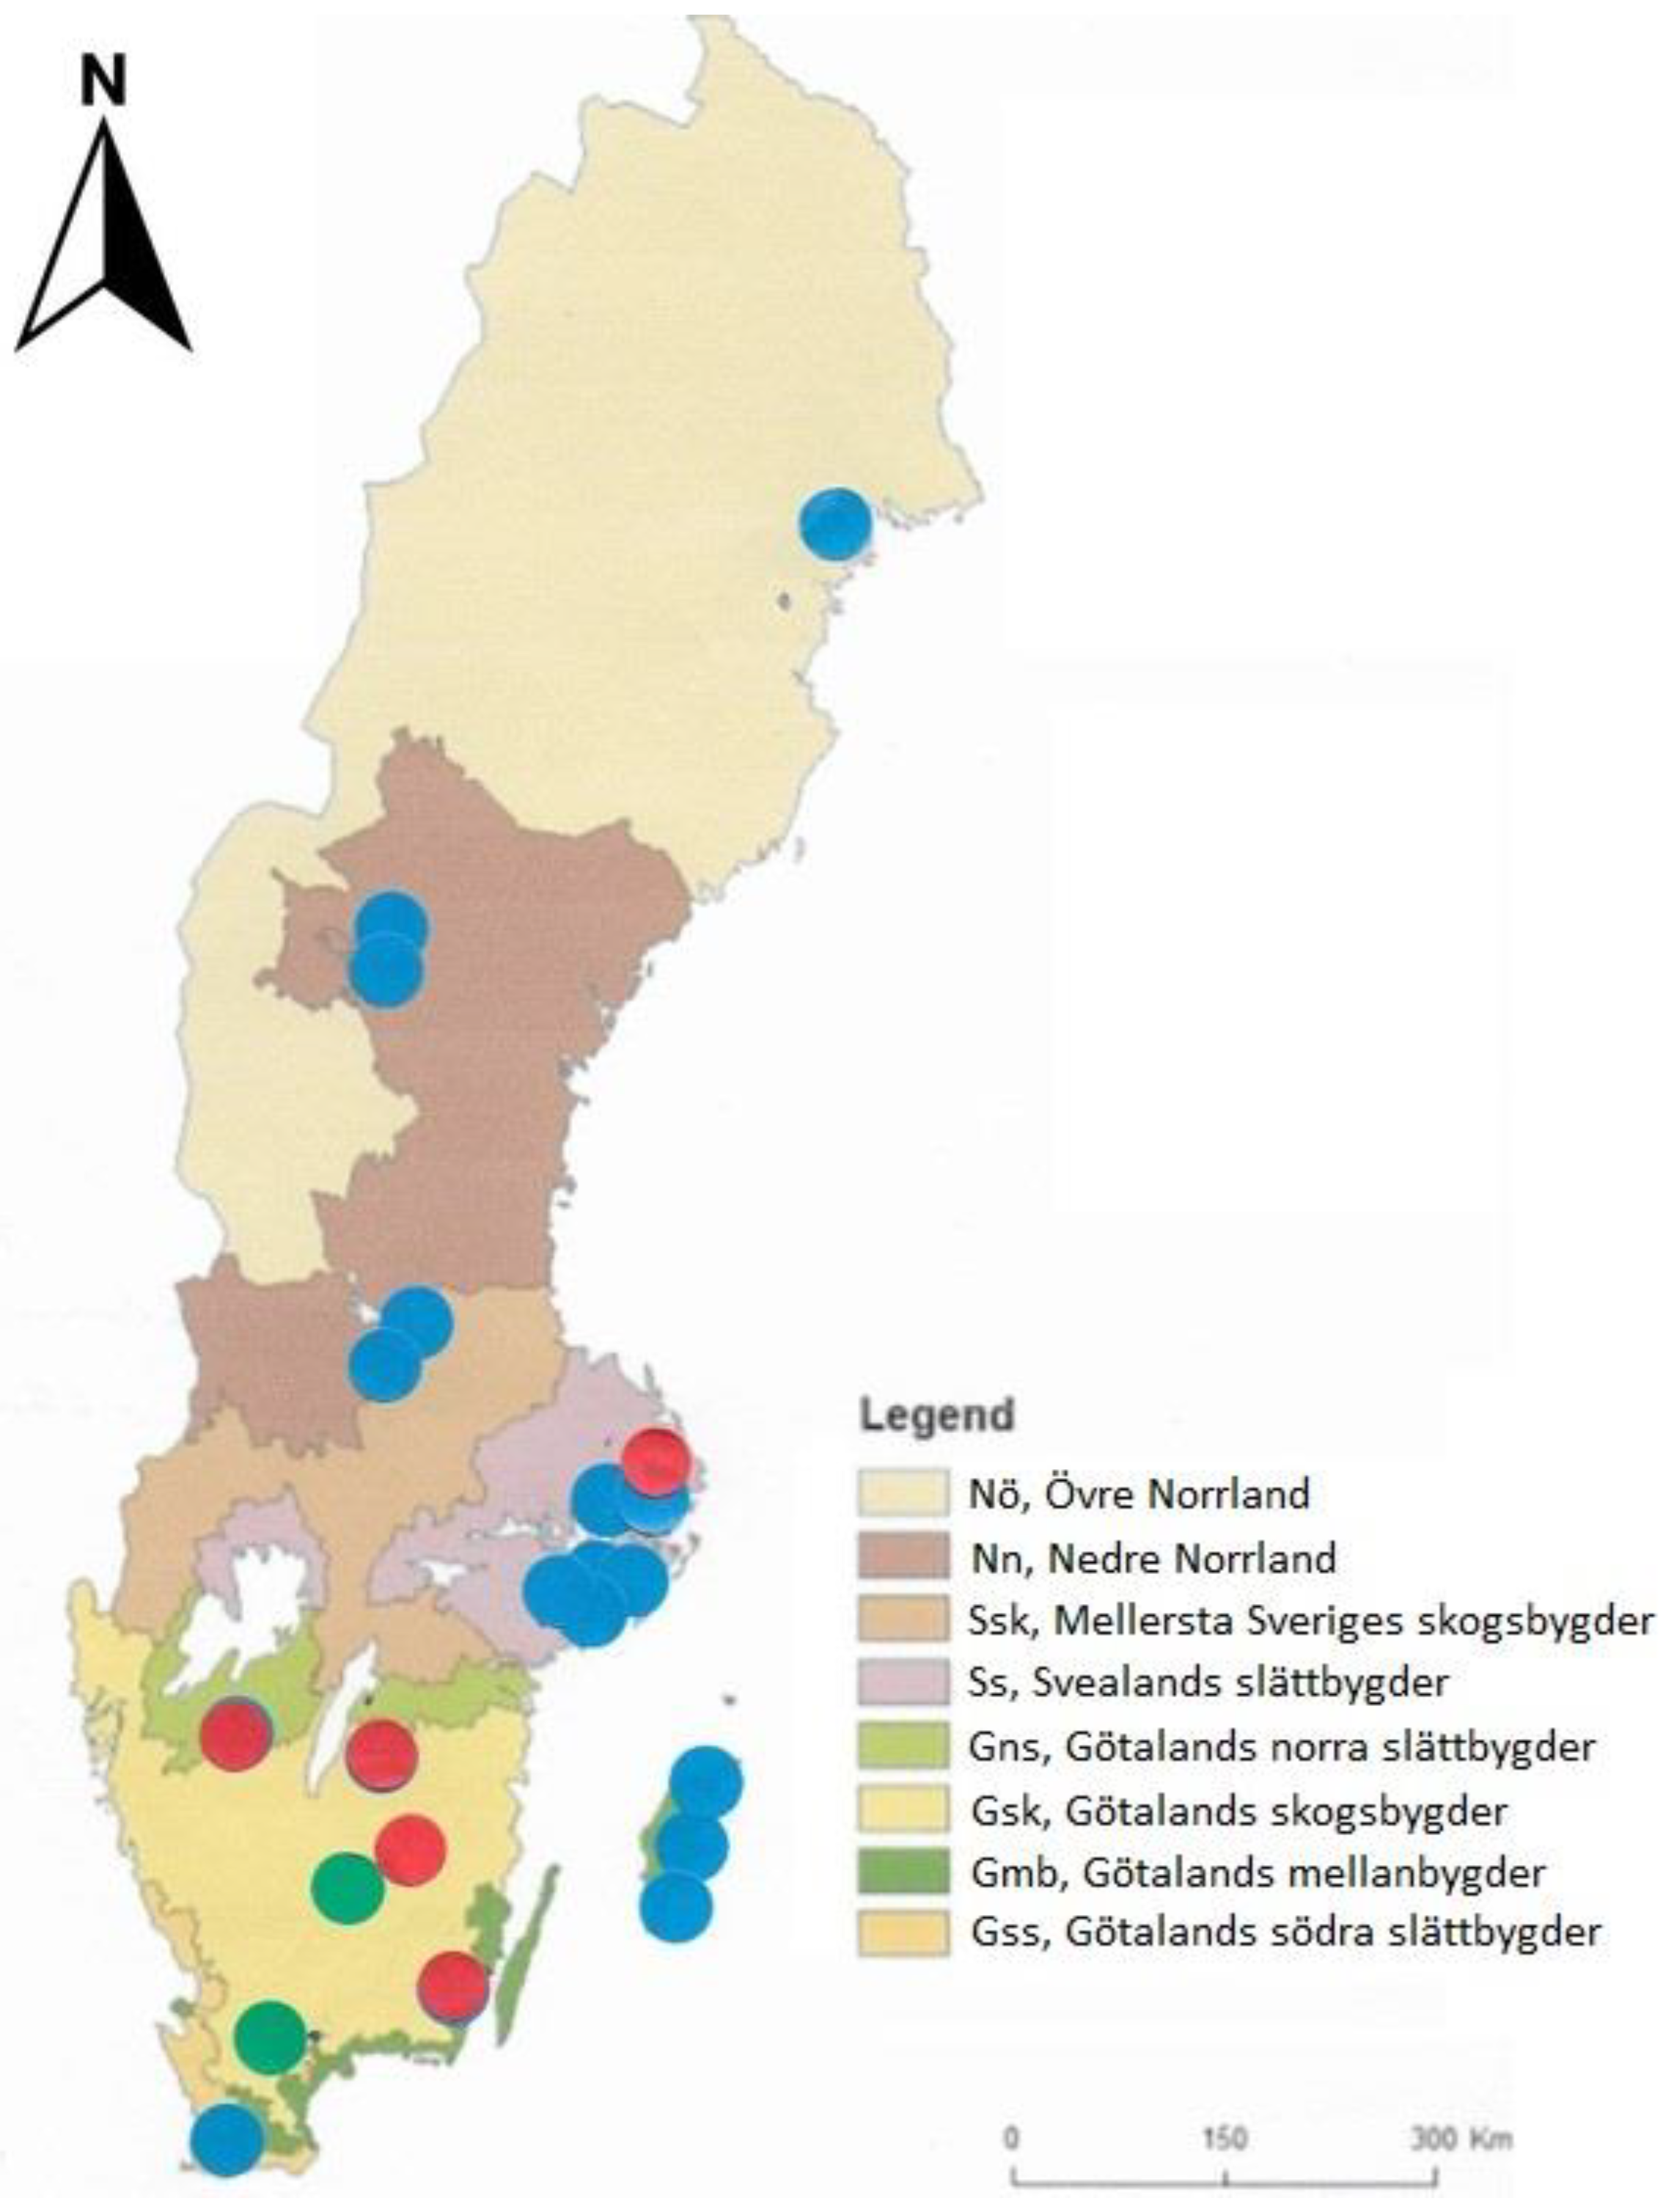
  • Collected data from 22 ERA farms in Sweden are used for the calculations.
  • Carbon sequestration in soil is included in the climate impact calculations.
  • Food production and demand are matched for Sweden in scenarios with different diets (staple foods only) for the Swedish population. Results are presented for climate impact, nutrient balance, acreage needs, and kg food produced/consumed in different categories.

2. Materials and Methods

2.1. Ecological Recycling Agriculture

What we call Ecological Recycling Agriculture (ERA) is based on the ecological principles mentioned above and illustrated in Figure 1. The concept has been developed during many years of research [14] but was finally defined in the EU-financed project BERAS (Baltic Ecological Agriculture and Society) 2003–2006 [10] and in BERAS Implementation [11]. In short, ERA farms have:
  • Diversified crop rotations with a large portion of perennial, deep-rooted, humus-building (C sequestering), and nitrogen-fixating leys;
  • Integrated animal husbandry (mostly grazing animals transforming grass to protein), adapted to the farm’s own fodder production and thus more or less self-sufficient on-farm or on farms in close collaboration;
  • Manure management and recirculation with least possible loss of organic matter and plant nutrients;
  • Focus on soil health and humus building.
A literature study by Serikstad [15] shows that ecological agriculture (in general) has lower climate impact than “conventional” agriculture calculated per hectare. In terms of impact per kg food product, the impact is equal or somewhat higher for the ecological agriculture, due to lower yields in many ecological systems, and that much ecological production also imports many commodities. Furthermore, the yields reported for ecological production in Europe are not a fully fair comparison since some of the ecological production acreage is used for “subsidy-optimisation”, i.e., some of the acreage is low-intensity cropping in order to qualify for ecological farming subsidies. The report also reveals large differences in climate impact between farms and management layouts.

2.2. Carbon Sequestration in Soil

Carbon sequestration in soil is most often not accounted for in earlier research, nor in official statistics and reporting. Since a basic element of ERA farming is the legume–grass ley cropping, which builds humus in soil, nowadays most often referred to as sequestration, its inclusion is one of the major issues in this study.
Long-term experiments of animal-free cropping without leys show a consumption of around 200 kg carbon per ha and year, i.e., 720 kg CO2e [16], after some time resulting in lower yields. This cannot be compensated for by chemical fertilisers, due to soil compaction which results in reduced root development, lower capacity to hold water and nutrients, and lower soil microbial activity. The yield increases reported after the start of using chemical fertilisers have stagnated in later years, despite new breeds, new technology, and new chemical pesticides [17].
An ecological first year legume–grass ley sequesters around 5 tonnes carbon and 200 kg nitrogen per ha, taken from the air and stored in the soil. Around 35% of the organic substance is transformed to stable humus [18]. Other literature studies indicate larger C sequestration in the upper layer of soils in ecological farming compared to conventional farming [19].
Börjesson et al. [20] show that the design of the farming systems in terms of shared legume–grass leys and the use of organic manure is vital for performance, and that the type of soil has a large impact on C-sequestering capacity. In short, it can be concluded that lighter soil conditions, allowing good root development, have more potential for C-storage in humus. In both lighter and heavier (clay) soils, the mineral-fertilised plots showed negative C sequestration. The portion of carbon from the supplied organic matter that becomes stable humus in the soil, the so-called humification coefficient [21], depends on both soil conditions and the type and form of organic matter distributed.
The long-term K-experiment in Järna, Sweden, comparing different cropping systems over 32 years, showed that after 10 years an ecological cropping system (similar to what we now call ERA) produced at the same level as the conventional test plots despite 30 kg less N (but supplied in organic form). The production increase recorded over the years was closely connected to the increase in humus content. In long-term field experiments on Skilleby farm, Järna, Sweden with a 5-year crop rotation, with 3-year leys, the C sequestration in the topsoil was on average 1.5 tons CO2e per ha and year. The use of composted manure treated with biodynamic substances resulted in higher C-levels in the soil. Sampling the subsoil down to 90 cm indicated a total C sequestration of 3 tons CO2e per ha and year [22].
Combining results from a large project 1979–1988 [23] and case studies in mid- and southern Sweden [24], it was concluded that 25% of the ley crop’s total biomass yield is roots, with another 15% stubble and litter, meaning that 40% of the total biomass yield remains in the soil. The mineralisation of the organic matter was rapid the first year, slower the second, and stabilised at a level of 60–70% in year 3–4 [23], i.e., 30–40% of the original amount carbon left in the field became humus. See Figure 2.

2.3. Calculations

In short, the following steps were performed to calculate acreage needs, climate impact, and nutrient balance for a domestic staple food production in Sweden capable of delivering enough food for a population of 11 million inhabitants. Details are presented below.
  • Case studies of 22 Swedish ERA farms, clustered in 5 production groups;
  • Definition of 3 target diets;
  • Matching of production and consumption in scenarios.

2.4. Case Study Farms

Farms following ERA principles were sought all over the country. The most important priorities were to find ecological farms that are more or less self-sufficient in manure/fertilisers and animal fodder, while carrying out a combination of cropping and animal husbandry. With regard to the fodder purchase, we set the limit to a maximum of 15–20% of the livestock’s protein needs. Many of the farms buy nothing but mineral fodder for their animals. Secondly, farms were chosen only if they produce human food from at least two different product categories, e.g., milk and grain or meat and vegetables. Thirdly, we made a concerted effort to find farms in all production regions of the country. See Figure 3.
Basic production data for the study were collected from 22 ERA farms in different parts of the country for the year 2019 or, in some cases, 2020. See Table 1. They are of different sizes and focused on different production. First, their acreage of arable land and natural pastures, crops, animals, manure systems, commodity purchases, and product sales were documented. Second, the climate impact and the nutrient farm balances were calculated for each farm. The results are provided per farm and per hectare. Comparison with Swedish agriculture and agricultural production in general was made using statistical data and the same calculation methods.
For Solmarka farm which has the largest production of eggs, poultry, and vegetables, the in-data were adjusted by exclusion of the imported hen fodder they use, that is about half of the total amount. The farm is within the limits for fodder purchase even including that fodder, but we chose to exclude it in order to strengthen the focus on self-sufficiency. We estimate that the exclusion diminishes the egg production by 60%, the meat production by 50%, and the vegetable production by 20%.

2.5. Calculation of Climate Impact and Nutrient Surplus

Greenhouse gas emissions and nutrient balances are calculated following the method used in the Vera calculation tool distributed by the Swedish official extension service Greppa Näringen (Eng. Focus on Nutrients) administered by the Swedish Board of Agriculture. The calculation model in Vera builds on Berglund et al., 2009 [25]. Data related to different products such as climate impact and nutrient content are occasionally updated. The Vera model does not yet include carbon sequestration in soil. Thus, we developed that aspect separately in this project. Our results are based on earlier research and field studies of the value of preceding leys in crop rotations presented above. Thus, we assume that 40% of the total biomass in the legume–grass ley crop remains on the field or in ground. The assumed humification coefficient is 35%. For organic manure the humification coefficient used is assumed to be 30%.
Possible carbon sequestration in natural pastures is omitted here due to lack of data for Nordic conditions. A literature study of mineral soils in Europe [26] shows sequestration numbers between 770 and 1290 kg C per ha and year. On the other hand, we did not include the loss of organic matter in organic soils on neither the farms nor in Swedish agriculture as a whole.

2.6. Farm Production Groups

Many of the farms have diversified production but they all were grouped into five production groups according to the most dominant, or in some cases, the most productive production branch. The production groups are:
  • Grain;
  • Dairy;
  • Potatoes/garden products;
  • Red meat (from grazers);
  • White meat (from monogastric animals).
The results for each group are given in kg products of each product category per hectare, CO2e per hectare, and kg N, P, K balance per hectare. The calculations were made per hectare arable land, since the natural pastures make only a small contribution of the total food production.

2.7. Climate Impact from Consumption and Target Diets

Two target diets were designed and compared to the Swedish average food consumption 2018, see Table 2. Statistics and diet investigations were used to establish the total consumption of foodstuffs in the different product categories. The total consumption is the total consumption of different raw foodstuffs for human consumption [27], i.e., included are both raw foodstuffs consumed in households and large-scale catering establishments, and the raw foodstuffs and semi-processed foodstuffs used in the food industry. Raw foodstuffs in imported processed foodstuffs are included, while raw foodstuffs in exported products are excluded. The calculation formula is:
Total consumption = Production of raw foodstuffs + import of raw foodstuffs and raw foodstuff content in processed food—export of raw foodstuffs and raw foodstuff content in processed food
Fish, sugar, and fruit are omitted in the calculation since their production in Sweden today is on a small scale. Exports of foodstuffs are not included either since the aim was to establish the possibility for self-sufficiency in Sweden. The target diets were modified during the process following the production data attained in the project. The diets were also further modified and varied in the process of finding possible production levels and carrying out sensitivity analyses.

2.7.1. Scenario 1. 1960-Inspired Diet

This scenario is the first investigated since its target diet follows our hypothesis. Compared to the Swedish diet of 2018, it means a decrease in meat consumption to the level experienced in the 1960s, with a substantially lower consumption of white meat. Regarding the other product categories, the scenario is adapted to what we eat today since we recognise that a return to a strict 1960 diet is neither possible nor desirable.

2.7.2. Scenario 2. Diet BERAS 2019

This scenario is a more radical diet developed from a diet presented in the BERAS project [28]. It is based on a consumer survey of 15 environmentally aware families in Järna, Sweden, 2004. Their meat consumption was 80–90% lower than average but very few were strictly vegetarians. This diet has also been modified since the original consumption of dairy products was very high due to a high use of butter, where each kg butter requires 20 kg of raw milk. This diet has been subject to variations since in its original form it showed the best results in terms of acreage needed. In the first step, it was divided in scenario 2a with the original milk consumption, and 2b with a lower milk consumption. Scenario 2b was finally used for most of the sensitivity analyses.

2.8. Matching of Production and Consumption

The last step of the calculations is matching the production and the consumption defined in scenarios. The farm group production results (average hectare yields of the farms in the group) are used for calculation of the acreage needed to produce the amount of foodstuffs defined in the target diets. The matching is performed by division of the diet value, kg/capita, by the production (kg/ha) from the respective production group (grain/grain, milk/milk, etc.). The matching starts with the most frequent product categories grain and dairy. Thereafter, the less commonly produced product categories potatoes/garden crops, red meat, and white meat are adjusted. Egg and oilseeds are reported without matching.
Since the farms in all production groups have produce in several product categories, the product quotas will be overfilled. Therefore, an adjustment factor was added to adjust each production group’s contribution. A step-by-step fine-tuning of the adjustment factor for the different production groups was conducted in an interactive process until the set diet was fulfilled. The results are given in hectares per capita, which multiplied by 11 million gives the total demand for arable land in the country for the scenario. For a visualisation, see Results.
In parallel, the climate impact and nutrient balance were calculated in kg CO2e per capita and kg N-P-K-balance per capita. Additionally, actual attained production in each product category was reported since exact matching is often not possible.

3. Results

Firstly, the results for the farm calculations are presented and compared to Swedish agriculture in general. The results for Sweden in 2019 were calculated using the same method as for the case study farms. Secondly, we present the results for scenarios matching production and consumption, including estimates of environmental impact when imported food is taken into account.

3.1. Case Study Farms

The climate impact and plant nutrient balance for the studied farms are presented in the following subsections. The results are compared to Swedish agriculture, which is mainly conventional. Results are presented both per hectare arable land and per hectare total farmland including natural pastures. The latter is the statistics reported in official statistics and climate reports.

3.1.1. Climate Impact

The calculated climate impact for each individual farm is shown in Table 3 (per hectare arable land) and in Table 4 (per hectare total farmland). The climate impact emission and net including C sequestration, are presented in two scenarios in order to make a fair comparison: fossil fuels and renewable fuels, where all farms use either type of fuels. For both these scenarios, the electricity used is the assumed Swedish average since several of the farms buy renewable electricity but use is low, and there is little difference since average Swedish electricity is dominated by water and nuclear power.
Figure 4 shows the climate impact divided per emission source for the individual farms. Here, it becomes very clear that counting the carbon sequestration is very important for the result.
Figure 5 shows the average farm results. The use of purchased commodities is lower on the study farms, while the emission of methane from ruminant animals is larger due to more grazing animals and the average higher portion of roughage in animal husbandry. However, considering the increased carbon sequestration in soils due to a larger proportion of legume–grass leys in the crop rotations, the net climate impact is substantially lower than the Swedish average.

3.1.2. Plant Nutrient Balance

The calculated plant nutrient balances for the individual study farms are shown in Table 5. The plant nutrient balances at the farm level generally show lower surpluses of both nitrogen and phosphorus compared to Swedish agriculture in general.

3.2. Scenarios for Matching of Production and Consumption

The results for the calculation of scenarios, which assume that the studied farms can produce all staple food for the Swedish population of 11 million, are presented below. In other words, it is assumed that the Swedish agriculture is converted to correspond to the 22 ERA farms in study. The scenarios show the results for matching the two target diets, presented in Table 2, and some variations of them, with the production of the study farms, grouped in five production groups as described in Methods. Red-marked numbers indicate that the value is changed from the original diet. The product category dairy is the one which varies most since it has a large impact on acreage needed. For the product category red meat, all variants of scenario 2 produce more than the original target, explaining why the target value had to be increased in order to not make negative values (which would give erratic results).
The results’ main focus is the acreage needed to meet the population’s demand for food, i.e., the target diets. Arable land in Sweden in production today is 2.55 million ha, of which 0.3 million ha is used for production of horse fodder, leaving 2.25 million ha for food production today. Historically, Sweden had 3.5 million ha in use at most. Both the Swedish Farmers Association (LRF) [29] and the Swedish Board of Agriculture [30] estimate that it would be possible to bring back 0.6 million ha into production, making a maximum of 3.15 million ha available, or 2.85 million ha for food production if we assume the number of horses remains equal to the present population.

3.2.1. Scenario 1

The results for the 1960-inspired diet in scenario 1, which was our starting point, is shown in Figure 6. The acreage demand exceeds that available by a million hectares if we want to feed 11 million inhabitants. If we omit the demand for white meat, and let it be the 7.6 kg/capita that the other production groups produce, the acreage needed is reduced but still more than what is available; see Figure 7.

3.2.2. Scenario 2

As expected, scenario 2a, with a more lacto-vegetarian diet, comes closer to fulfilling the food demand within the acreage limits; see Figure 8.
In scenario 2b, the demand for dairy products was lowered. Instead, the target for grain was increased by 10 kg, for increased production of peas, beans, and pulse crops. This resulted in an acreage need just over the assumed available arable land, 2,85 million ha, Figure 9. In both scenarios 2a and 2b, the consumption of red meat had to be increased, from the target diet 10 kg to 20 and 18, respectively, in order to match farm production.

3.2.3. Scenario 2 Variations

In order to broaden the picture, reveal hidden connections, and investigate the sensitivity of the small number of farms, many variations of scenario 2 were carried out, some of which are presented below. Figure 10 shows the consumption/production of each product category of the Swedish consumption including imported food 2018, scenarios 2a, 2b, 2b grass milk, 2a five productive farms, and 2b five productive farms. The three last scenarios represent:
  • Scenario 2b: Grass milk, just the four dairy farms feeding the cows only roughage included in the dairy production group. Other groups unchanged.
  • Scenario 2a: Five productive farms, scenario 2a with only the most productive farm (kg/ha) in each production group included.
  • Scenario 2b: Five productive farms, scenario 2b with only the most productive farm (kg/ha) in each production group included.
In Figure 10, bars represent foodstuff produced in six product categories, kg per capita, and year. In most cases, we set the levels but, in all scenarios, the red meat category produces more than the target 10 kg. The number of eggs produced, not matched, is almost doubled in the two scenarios with the five most productive farms only because the dairy farm included also produces eggs from hens kept outdoors. The acreage needed is represented by dots, with values on the right scale. The solid line represents the arable land acreage in production in Sweden today. The dashed line represents the assumed possible acreage for food production. Since we import much of our food, as a rough estimation we set the acreage actually needed today to 1.5 times that used domestically.
Since one of our main starting points is the need for increased ley cropping, we were interested in what is grown on the arable land in the different scenarios. Figure 11 shows the proportion of legume–grass leys, field crops, and natural pastures for the scenarios, and for Swedish average agriculture. The solid line represents the arable land acreage in production in Sweden today, and the dashed line represents the assumed possible acreage for food production in Sweden. About 450,000 ha natural pastures are in use in Sweden today, 0.041 ha/capita. All scenarios presented show doubled or tripled use of natural pasture acreage. Some of that could be substituted for by grazing on arable land, but then that arable land acreage would have to be increased.

3.3. Calculated Environmental Impacts for the Scenarios

The climate impact of the scenarios and the scenario variations are presented in two variants so as to make fair comparisons. Thus, the total fuel consumption was assumed to be either of fossil origin, Figure 12, or renewable, Figure 13. For the latter, HVO, with 10% climate impact compared to fossil fuels, was used. Electricity is assumed to be according to Swedish average in both cases.
Since dairy cows and ruminants often are claimed to be vital (negative) factors for climate impact due to their methane emissions, we also present the results for how many dairy cows are needed in the production of different diets, Figure 14. All scenarios have substantially larger numbers of cows, but, since we included carbon sequestration in the climate impact calculations, which is larger in the scenarios due to increased cropping of legume–grass leys, the net climate impact still is lower.
When it comes to nutrient balances, Figure 15 clearly shows that the scenarios result in lower nitrogen surpluses compared to average Swedish agriculture and thereby pose a lower risk of contributing to the eutrophication of lakes and seas.

4. Discussion

The results presented should be interpreted cautiously since only 22 farms are included, and they were examined only over the course of one year. Furthermore, they are set up and produce what they do in today’s context, which tells us little about their true potential. However, the results show an alternative picture of what might be possible by adopting Recycling Ecological Agriculture (ERA) principles, compared to the mostly raised policy of “produce more on a smaller acreage, and set aside the rest for nature conservation”, which we believe not to be sustainable, or which at least has many hidden dangers [31]. A comment on Swedish agriculture is that the average shown here is not bad, but the problem is that the regional differences are vast, with almost no leys on the plains, and too many animals fed on “imported” feed in other regions, resulting in nutrient excess. However, the ley cropping has increased in Sweden from 32% of the arable land year 1981 to 47% the arable land 2013 [32], and, thus, the average content of soil organic matter from 2.47% to 2.67%. However, that is due largely to an increased number of horses kept for leisure and sports activities. The 300,000 ha used for the horses is omitted in the study but indicates a potential to increase content of soil organic matter and carbon sequestration through increased portion of ley in the crop rotations.

4.1. Acreage Needs and Changed Diets for Staple Food Self-Sufficiency in Sweden

We claim that the results of our study show that our hypothesis about ERA farming was largely confirmed. These farms exist and, in most cases, are under development. Additionally, the development of new practices in the field of regenerative agriculture, adopted by some of the farms, gives hope. However, the hypothesis that a diet similar to the Swedish average during the 1960s (scenario 1), could be an alternative, even today, proved to be unrealistic. When scaling up the production on all the farms included in the study to a Sweden level, we find that food habits must be adjusted more drastically than “back to 1960s”, if we wish Sweden’s staple food production to become self-sustainable.
In scenario 2 and its variations, we examine how diets could be adjusted in order to eat what is produced within the country. There is plenty of acreage to feed a population of 11 million inhabitants with a vegetarian diet, something advocated by, for example, the EAT–Lancet report [13]. However, we claim that such a diet would not be sustainable since the soils and the climate both require cropping of deep-rooted perennial crops. In the Nordic climate, leys (grass) are that natural crop, and that, when combined with legumes as clover and lucerne, is also a prerequisite for self-sustaining agriculture [5]. In order to utilize the ley products (hay and silage), there is a need for grazing animals, which in turn implies that we need to eat meat from these animals. The perspective is supported by van Selm et al., 2022 [33].
The results indicate the possible levels, requiring substantially lower consumption of white meat and slightly less red meat from grazing animals as cows and sheep. Otherwise, it is often claimed that white meat should be promoted since it is “efficient”, referring to LCA (Life Cycle Assessment) data, but questioned in later years by researchers [31] as well as the Swedish branch of WWF (the World Wildlife Fund for Nature) [34,35] that instead advocates meat from grazing animals. Pigs and hens/chickens are present on only a few of the studied farms, and on a very small scale. From a systems perspective, it could be claimed that pigs have a more natural place in the food system since they could be, and actually are, partially fed on by-products and leftovers from food processing, while nowadays hens and chickens are fed largely on grain and protein sources that could be used for human consumption. The number of eggs produced, not matched, is almost doubled in the two scenarios with only the five most productive farms, since the dairy farm included also produces eggs from outdoor kept hens. This indicates that a greater egg production would probably be possible in Sweden using the same (small-scale ecological) concept.
When it comes to dairy products, our results imply that lower consumption is probably necessary. In the scenarios 2b and 2b grass milk, where dairy products are 250 kg/capita (compared to 357 kg/capita in Sweden 2018), the acreage needs are close to the possible available acreage. The acreage needed in scenario 2b grass milk is about the same as for 2b, which seems a bit surprising since the cows produce less milk and thus a larger number of cows are needed. This is explained by the fact that some of the acreage otherwise used for fodder production can produce human food instead.
In the last two scenarios, where included only the most productive farm in each production group, the self-sufficiency target is reached within the available acreage of arable land, even with a consumption of dairy products at today’s level in Sweden. It is probably very optimistic to assume that all farms in Sweden could be as productive as these, but at least it shows the potential.
All the scenarios presented show a doubled or tripled use of natural pastures. Today, 460,000 ha of pastures eligible for subsidies are in use, and there has been an increase the latest years [36], but Statistics Sweden [37] also reports 709,000 ha of grazing lands registered the year 2000. Historically, we have had more than one million ha [38], and some sources mention several million hectares, e.g., [39]. We believe that it could be possible to regain a good deal of the lost pastures if grazing becomes more profitable.

4.2. Climate Impact Calulations

When it comes to the climate impact calculations, there is some uncertainty, but we judge the results to be conservative. The calculated value for carbon sequestration in Swedish average agriculture (786 CO2e/ha arable land) is lower than the one given by Röös [40]. She writes (translation by the authors): “Measurements of carbon levels in Swedish arable land indicate that the increased ley cropping during the last decades yearly increase the carbon sequestration by a total of 2.4 million tons CO2 yearly”. Spread over the arable land, that would make 940 CO2e/ha, and for the total farmland it would be 800 CO2e/ha. Thus, our model can be assumed to underestimate the sequestration slightly. The increased ley cropping Röös mentions is mainly associated with the increase in number of horses in the country, i.e., it is acreage not used for food production.
When comparing the greenhouse gas emissions calculated in our model and data from Wirsenius for Swedish agriculture 2017 [41], it is also likely that our model is an underestimation. Our model gives 6.8 million tons CO2e for the whole country, while Wirsenius reported 14 million tons CO2e. That number, however, includes transports and emissions from cropping on organic soils that our calculations omit. Doing a rough re-calculation of Wirsenius’s data excluding the transport and organic soils, we come to 9 million tons CO2e.
Both probable underestimations partly compensate each other, but since the results are uncertain these results should be used for comparison between our farms and Swedish agriculture, not as raw data for other calculations. The fact that our data have only been collected over the course of one year emphasises this even more.
As can be seen in Figure 4 and by comparison of Figure 12 and Figure 13, the choice of energy source makes a difference, but does not solely solve the question of the food system’s climate impact. Compared to the level of about 140 kg CO2 equivalents per capita and year indicated by the Swedish Environmental Protection Board, we can conclude that scenario 2 and its variations are on target or, in most cases, well under the target. However, one should remember that we did not include the whole food chain. Transports and trade were omitted.

4.3. Nutrient Balance Calulations

In terms of nutrient balances, the scenarios result in lower nitrogen surpluses compared to average Swedish agriculture and, thereby, are a lower risk for contributing to eutrophication of lakes and seas. Some may argue that the surplus is too low, but it works in practise on the farms, probably due to increased humus content in the soils, which results in an increased capacity for nutrient and water retention.

4.4. Shortcomings and Uncertainties

Finally, we recognize the fact that we were not able to include either the economical demands a conversion to ERA farming would imply in terms of raised prices or distribution infrastructure, or how the energy supply could be solved using local resources. In addition, the timespan, and practical and social complications that would have to be solved, were not examined. Lastly, one should remember that the study is a case study with only a few farms assessed over a one-year period, making the results more of a glimpse of possibilities than a well-documented prediction. Hopefully these shortcomings can be assessed in further research.

5. Conclusions

We believe the study to be quite unique in the sense that it has a systematic food supply perspective for a whole country, using an agriculture based on self-supportive circular principles. From the results, it can be concluded that the net climate impact is substantially lower on the studied farms compared to Swedish agriculture in general, mainly as a result of 85% lower use of external resources and 2.3 times larger carbon sequestration in soils due to the larger share of ley cropping.
It can also be concluded that it would be possible, although not easy, for Sweden to become self-sufficient in staple food production given the available acreage of arable land by adopting Ecological Recycling Agricultural principles in a similar manner to the studied farms.
In short:
Yes, our farm studies indicate that it would be possible to reduce the climate impact by more than 90% from agriculture in Sweden, compared to the situation in 2019 by conversion to self-sufficient ecological recycling agriculture with legume–grass leys integrated in crop rotations on all cropland, despite an increase in the number of grazing cattle. Into the bargain, we would attain substantially lowered nitrogen surpluses and thereby a lower risk of contributing to the eutrophication of lakes and seas.
Yes, this kind of agriculture would be able to produce enough staple food for the Swedish population based on the available arable land in Sweden.
However, it is suggested that it would demand an adaption of our diets with considerably lower consumption of white meat (pigs and poultry), along with slightly lower consumption of red meat (beef and sheep) and dairy products. As compensation, consumption of vegetables, grain, and legumes can be increased.
Additionally, it should be pointed out that neither the timespan nor the possibility of carrying out a total conversion to ERA farming in practise, with all economical, practical, and social complications that would have to be solved, were not examined. There is still much research to conduct.

Author Contributions

Conceptualization, A.G.; data curation, O.T.; formal analysis, O.T.; funding acquisition, A.G.; investigation, A.G.; supervision, A.G.; validation, O.T.; writing—original draft, A.G. and O.T.; writing—review & editing, O.T. All authors have read and agreed to the published version of the manuscript.

Funding

This research was funded by Axel and Margaret Ax: son Johnson Foundation. The APC was funded by the authors.

Institutional Review Board Statement

Not applicable.

Informed Consent Statement

Informed consent was obtained from all subjects involved in the study.

Data Availability Statement

Not applicable.

Acknowledgments

Above all, we want to express our warm gratitude to the farmers, giving their time and generously offering farm data. Thanks also to the farmers who for some reason were not included in the study, whose contributions were equally important. Several colleagues in the “food business” have helped with data and feedback. Here, we mention only two, Erika Vestgöte Dreber, who helped us finding farms and formulating critical questions, and Sara Seing (f. Jervfors), Head of Diet Södertälje Municipality who contributed with her knowledge about food and diets.

Conflicts of Interest

The authors declare no conflict of interest. The funders had no role in the design of the study; in the collection, analyses, or interpretation of data; in the writing of the manuscript, or in the decision to publish the results.

References

  1. COP26 The Glasgow Climate Pact. In Proceedings of the The UN climate conference UK 2021 (COP26), Scotland, UK, 31 October–13 November 2021; Available online: https://ukcop26.org/the-conference/cop26-outcomes/ (accessed on 24 March 2022).
  2. Intergovernmental Panel on Climate Change (IPCC). Recommendations for Guidelines for National Greenhouse Inventories. 2006. Available online: https://www.ipcc.ch/report/2006-ipcc-guidelines-for-national-greenhouse-gas-inventories/ (accessed on 24 March 2022).
  3. Naturvårdsverket. Handlingsplan för att nå Sveriges Klimatmål. Available online: https://www.naturvardsverket.se/klimatmal (accessed on 24 March 2022).
  4. Cederberg, C.; Persson, M.; Schmidt, S.; Hedenius, F.; Wood, R. Beyond the borders—Burdens of Swedish food consumption due to agrochemicals, greenhouse gas emissions and land use change. JCLP J. Clean. Prod. 2019, 214, 644–652. [Google Scholar] [CrossRef]
  5. Kjaergaard, T. The Danish Revolution; Cambridge University Press: Cambridge, UK, 1994. [Google Scholar]
  6. Linderholm, K. Sveriges Självförsörjningsgrad—Energi Till Människor och Motorer Från Svenskt Jordbruk 2017–2018; Silvbergs Miljöteknik AB: Borlänge, Sweden, 2018; Available online: https://silvberg.se/Rapporter/ (accessed on 24 March 2022). (In Swedish)
  7. Formas. Jordbruk Som Håller i Längden. Formas Fokuserar 17, 2010. Available online: https://www.formas.se/download/18.462d60ec167c69393b9a1d0/1549956100364/jordbruk_som_haller_i_langden.pdf (accessed on 25 April 2022). (In Swedish: Long Term Sustainable Agriculture).
  8. Jordbruksverket. Rapport 2019:1. Plan för Odlingslandskapets Biologiska Mångfald—Ett Samverkansprojekt Inom Miljömålsrådet. Available online: https://www2.jordbruksverket.se/download/18.36d57baa168c704154d46f04/1549611543321/ra19_1.pdf (accessed on 25 April 2022). (In Swedish).
  9. Jordbruksstatistisk Sammanställning 2020. Available online: https://jordbruksverket.se/om-jordbruksverket/jordbruksverkets-officiella-statistik/jordbruksverkets-statistikrapporter/statistik/2020-08-14-jordbruksstatistisk-sammanstallning-2020 (accessed on 24 March 2022). (In Swedish).
  10. Granstedt, A.; Schneider, T.; Seuri, P.; Thomsson, O. Ecological Recycling Agriculture to Reduce Nutrient Pollution to the Baltic Sea. J. Biol. Agric. Horticulture 2008, 26, 279–307. Available online: http://sbfi.se/public/images/SBRI/Ecological-Recycling-Agriculture-to-Reduce-Nutrient-Pollution.pdf (accessed on 24 March 2022). [CrossRef]
  11. Granstedt, A.; Seuri, P. Conversion to Ecological Recycling Agriculture and Society Environmental, Economic and Sociological Assessments and Scenarios. In COMREC Studies on Environmental Development 8, BERAS Implementation Report 3; Granstedt, A., Seuri, P., Eds.; Södertörns Högskola (Södertörn University): Huddinge, Sweden, 2013. [Google Scholar]
  12. Saxe, H.; Meinert Larsen, T.; Mogensen, L. The global warming potential of two healthy Nordic diets compared with the average Danish diet. Clim. Chang. 2013, 116, 249–262. [Google Scholar] [CrossRef]
  13. Willett, W.; Rockström, J.; Loken, B.; Springmann, M.; Lang, T.; Vermeulen, S.; Garnett, T.; Tilman, D.; DeClerck, F.; Wood, A.; et al. Food in the Anthropocene: The EAT–Lancet Commission on healthy diets from sustainable food systems. Lancet 2019, 393, 447–492. [Google Scholar] [CrossRef]
  14. Granstedt, A. Case studies on the flow and supply of nitrogen in alternative farming in Sweden. Biol. Agric. Hortic. 1992, 9, 15–63. [Google Scholar] [CrossRef]
  15. Serikstad, G.L. Økologisk Landbruk og Klimagasser: Metan, Lustgass og CO2; NORSØK Rapport; Norsk Senter for Økologisk Landbruk: Tingvoll, Norway, 2018; Available online: https://orgprints.org/id/eprint/32812/1/NORS%C3%98K%20Rapport%20nr%202%202018%20Klimagasser.pdf (accessed on 24 March 2022). (In Swedish)
  16. Bertilsson, G. Mat, Klimat Och Miljö; Recito Förlag AB: Everöd, Sweden, 2010; Available online: www.greengard.se (accessed on 24 March 2022). (In Swedish)
  17. Lal, R. Enhancing Eco-efficiency in Agro-ecosystems through Soil Carbon Sequestration. Crop Sci. Soc. Am. 2012, 50 (Suppl. S1), 120–131. [Google Scholar] [CrossRef] [Green Version]
  18. Granstedt, A.; L-Baeckström, G. Studier av Vallens Förfruktsvärde i Ekologisk Odling; Ekologiskt Lantbruk 25; Swedish University of Agricultural Sciences: Uppsala, Sweden, 1998. (In Swedish) [Google Scholar]
  19. Gattinger, A.; Muller, A.; Haeni, M.; Skinner, C.; Fliessbach, A.; Buchmann, N.; Mäder, P.; Stolze, M.; Smith, P.; El-Hage Scialabba, N.; et al. Enhanced top soils carbon stocks under organic farming. Proc. Natl. Acad. Sci. USA 2012, 109, 18226–18231. [Google Scholar] [CrossRef] [PubMed] [Green Version]
  20. Börjesson, B.; Bolinder, M.; Kirchmann, H.; Kätterer, T. Organic carbon stocks in topsoil and subsoil in long-term ley and cereal monoculture rotations. Biol. Fertil. Soils 2018, 54, 549–558. [Google Scholar] [CrossRef] [Green Version]
  21. Kolenbrander, G.J. Efficiency of organic manure in increasing soil organic matter content. In Transactions of the 10th International Congress of Soil Science; Nauka: Moscow, Russia, 1974; pp. 129–136. Available online: https://www.iuss.org/index.php?rex_media_type=download&rex_media_file=1974_10_kothpecc__10th_congress_ii_compressed.pdf (accessed on 25 April 2022).
  22. Granstedt, A.; Kjellenberg, L. Carbon sequestration in long-term on-farm studies in Organic and Biodynamic Agriculture, Sweden. In Innovative Research for Organic 3.0, Proceedings of the Scientific Track at the Organic World Congress 2017, Delhi, India, 9–11 November 2017; Rahmann, G., Andres, C., Yadav, A.K., Ardakani, R., Babalad, H.B., Devakumar, N., Willer, H., Eds.; Thünen Report 54—Volume 1; Thünen-Institut: Braunschweig, Germany, 2017; pp. 200–204. [Google Scholar]
  23. Andrén, O.; Lindberg, T.; Paustain, K.; Rosswall, T. (Eds.) Organic carbon and nitrogen flows. In Ecology of Arable Land—Organisms, Carbon and Nitrogen Cyclings; Ecological Bulletins 40; Munksgaard: Copenhagen, Denmark, 1990. [Google Scholar]
  24. Granstedt, A. Fallstudier av Kväveförsörjningen i Alternativ Odling. Alternativ Odling 4. Forsknings-och Försöksnämnden för Alternativ Odling. Ph.D. Thesis, Sveriges Lantbruksuniversitet, Uppsala, Sweden, 1990. (In Swedish). [Google Scholar]
  25. Berglund, M.; Cederberg, C.; Clason, C.; Henriksson, M.; Törner, L. Jordbrukets Klimatpåverkan—Underlag för att Beräkna Växthusgasutsläpp på Gårdsnivå och Nulägesanalyser av Exempelgårdar; Delrapport i JOKER-Projektet; Hushållningssällskapet Halland: Eldsberga, Sweden, 2009; Available online: http://hs-n.hush.se/attachments/82/2888.pdf (accessed on 24 March 2022). (In Swedish)
  26. Soussana, J.F.; Tallec, T.; Blanfort, V. Mitigating the greenhouse gas balance of ruminant production systems through carbon sequestration in grasslands. Animal 2010, 43, 334–350. [Google Scholar] [CrossRef] [PubMed] [Green Version]
  27. Jordbruksverket. Kort om Statistiken. 2021. Available online: https://jordbruksverket.se/om-jordbruksverket/jordbruksverkets-officiella-statistik/jordbruksverkets-statistikrapporter/statistik/2021-03-16-livsmedelskonsumtion-av-animalier.-preliminara-uppgifter-2020#h-Kortomstatistiken (accessed on 24 March 2022). (In Swedish).
  28. Granstedt, A.; Thomsson, O.; Schneider, T. Environmental Impacts of Eco-Local Food Systems; Baltic Ecological Agriculture and Society (BERAS) Nr. 5.; Swedish University of Agricultural Sciences: Uppsala, Sweden, 2005; Available online: www.slu.se/globalassets/ew/org/centrb/epok/aldre-bilder-och-dokument/publikationer/ekolantbruk46.pdf (accessed on 25 April 2022).
  29. Lantbrukarnas Riksförbund. Ökad Försörjningstrygghet Avseende Livsmedel. 2019. Available online: www.lrf.se/politikochpaverkan/foretagarvillkor-och-konkurrenskraft/nationell-livsmedelsstrategi/sjalvforsorjning/forsorjningstrygghet/ (accessed on 24 March 2022). (In Swedish).
  30. Jordbruksverket. Kartläggning av Mark Som Tagits ur Produktion. Rapport 2008:7. Available online: www2.jordbruksverket.se/webdav/files/SJV/trycksaker/Pdf_rapporter/ra08_7.pdf (accessed on 25 April 2022). (In Swedish).
  31. van der Werf, H.M.G.; Trydeman Knudsen, M.; Cederberg, C. Towards better representation of organic agriculture in life cycle assessment. Nat. Sustain. 2020, 3, 419–425. [Google Scholar] [CrossRef]
  32. Poeplau, C.; Bolinder, M.A.; Eriksson, J.; Lundblad, M.; Kätterer, T. Positive trends in organic carbon storage in Swedish agricultural soils due to unexpected socio-economic drivers. Biogeosciences 2015, 12, 3241–3251. [Google Scholar] [CrossRef] [Green Version]
  33. Van Selm, B.; Frehner, A.; de Boer, I.J.M.; van Hal, O.; Hijbeek, R.; van Ittersum, M.K.; Talsma, E.F.; Lesschen, J.P.; Hendriks, C.M.J.; Herrero, M.; et al. Circularity in animal production requires a change in the EAT-Lancet diet in Europe. Nat. Food 2022, 3, 66–73. [Google Scholar] [CrossRef]
  34. World Wide Fund for Nature (WWF). Naturbetesprojekt. Långsiktiga Effekter av 25 års Arbete. (Natural Pastures Project). Report. 2015. Available online: https://www.wwf.se/dokument/wwfs-naturbetesprojekt-2015-langsiktiga-effekter-av-25-ars-arbete/pdf (accessed on 25 April 2022). (In Swedish).
  35. World Wide Fund for Nature (WWF). Marknadsundersökning Grönt ljus i Köttguiden. Rapport 2021-11-12. (Marketassessment Green Light in the Meat Guide). Available online: https://www.wwf.se/pressmeddelande/wwfs-kottguide-rott-ljus-for-svensk-kyckling-4116966/ (accessed on 24 March 2022). (In Swedish).
  36. Statistics Sweden. Agricultural Statistics 2020 Including Food Statistics—Tables. Available online: https://jordbruksverket.se/download/18.78dd5d7d173e2fbbcda98893/1597390150166/JS_2020.pdf (accessed on 29 March 2022).
  37. Statistics Sweden. Land Cover 2000, Sweden. Available online: https://www.scb.se/en/finding-statistics/statistics-by-subject-area/environment/land-use/other-statistics-on-land-use/pong/tables-and-graphs/marktackedata/land-cover-2000-sweden/ (accessed on 29 March 2022).
  38. Swedish University of Agricultural Sciences (SLU). Goodla. Lärarhandledning (Teachers Guidance). Available online: https://www.slu.se/globalassets/ew/org/inst/mom/collaboration/goodla/handledningar/lararhandl_naturbete.pdf (accessed on 29 March 2022). (In Swedish).
  39. Jordbruksverket. Jordbruket i Siffror. Available online: https://jordbruketisiffror.wordpress.com/2019/07/31/det-fanns-526-tusen-hektar-slatterangar-ar-1927-ar-2019-ar-arealen-12-tusen-hektar-men-den-har-mer-an-fordubblats-sedan-ar-2003/ (accessed on 24 March 2022).
  40. Röös, E. Kor Och Klimat; EPOK—Centrum för Ekologisk Produktion och Konsumtion Sveriges Lantbruksuniversitet: Uppsala, Sweden, 2019; Available online: https://www.slu.se/globalassets/ew/org/centrb/epok/dokument/koroklimat_web.pdf (accessed on 24 March 2022). (In Swedish)
  41. Wirsenius, S. Utsläpp av Växthusgaser Från Svensk Produktion Och Konsumtion av Mat år 2045; Chalmers Tekniska Högskola: Göteborg, Sweden, 2019; Available online: https://research.chalmers.se/publication/515057/file/515057_Fulltext.pdf (accessed on 24 March 2022). (In Swedish)
Figure 1. Ecological Recycling Agriculture, ERA, follows the rules for ecological certified agriculture, but also includes animal husbandry (on-farm or on farms in ecological cooperation) with animal stocks limited to be fed by grazing, and fodder production based on perennial legume–grass leys (green sections of the circle representing the arable land). Thus, the animals are mainly fed on roughage, which allows space for more food crops in the crop rotation. Figure composed after idea from Granstedt A., 1992 [14].
Sustainability 14 05834 g001
Figure 2. Experiments with mineralization of 14C in straw and root litter incubated 4.5 years in soil indicate that 35% of root and crop residues have been transformed into more stable forms, while the rest is broken down into carbon dioxide and water in the organic breakdown in the soil. Data from Persson J., 1987 in [23].
Sustainability 14 05834 g002
Figure 3. Location of the study farms in Sweden marked with dots. The red dots mark the five most productive farms used in some scenarios.
Sustainability 14 05834 g003
Figure 4. Climate impact on the study farms from different sources in GWP (Global Warming Potentials), kg CO2e per hectare arable land.
Sustainability 14 05834 g004
Figure 5. Average climate impact on the study farms in GWP (Global Warming Potentials), kg CO2e per hectare arable land. Presented in two scenarios where fossil and renewable fuels are used, respectively.
Sustainability 14 05834 g005
Figure 6. Target fulfilment for scenario 1, 1960-inspired diet.
Sustainability 14 05834 g006
Figure 7. Target fulfilment for scenario 1, 1960-inspired diet, when white meat demand is omitted.
Sustainability 14 05834 g007
Figure 8. Target fulfilment for scenario 2a, BERAS 2019. The target diet of 10 kg red meat had to be increased in order to match the farms’ production.
Sustainability 14 05834 g008
Figure 9. Target fulfilment for scenario 2b, BERAS 2019 with less milk. The target diet of 10 kg red meat had to be increased in order to match the farms’ production. The grain target was increased in order to meet nutritional demands when the dairy product target was lowered.
Sustainability 14 05834 g009
Figure 10. Food consumed in Sweden (2018), and food produced in scenarios 2a, 2b, 2b grass milk (where only the four farms feeding their dairy cows exclusively with hay and silage fodder are included in the milk group), and 2a and 2b with only the one most productive farm (kg/ha) in each production group included. The arable land acreage needed (dots) is represented on the right scale.
Sustainability 14 05834 g010
Figure 11. Acreage needs, hectares per capita. Five scenarios compared to Swedish domestic production and Sweden including imports (where only imports of meat and animal fodder are included and estimated to be 0.5 times Swedish domestic production, in total 1.5 times the domestic production).
Sustainability 14 05834 g011
Figure 12. Climate impact, Global Warming Potential, kg CO2 equivalents per capita. Five scenarios, where all farms use fossil fuels, compared to Swedish domestic production and Sweden including imports.
Sustainability 14 05834 g012
Figure 13. Climate impact, Global Warming Potential, kg CO2 equivalents per capita. Five scenarios, where all farms use renewable fuels, compared to Swedish domestic production and Sweden including imports.
Sustainability 14 05834 g013
Figure 14. Number of dairy cows per capita. Five scenarios compared to Swedish domestic production and Sweden including imports (where only imports of meat and animal fodder are included and estimated to be 0.5 times the Swedish domestic production, in total 1.5 times the domestic agriculture).
Sustainability 14 05834 g014
Figure 15. Plant nutrient balance, kg N surplus per capita. Five scenarios compared to Swedish domestic production and Sweden including imports (where only imports of meat and animal fodder are included and estimated to be 1.5 times the Swedish domestic production).
Sustainability 14 05834 g015
Table 1. The chosen example farms and Swedish agriculture; acreage, animal density, location, and production.
Study FarmsArable Land HaNatural Pastures HaShare Ley of Arable Land %Animal Density
Au 1/Ha
Production Region 2Farm Production 3
Blomfeltsgården *150067%0.44milk, beef, oilseed
Fjöset 359250100%0.31Nnlivestock, beef
Trappnäs12083%0.00Nnvegetables, ley (cropped by Fjöset)
Ingelsbo603067%0.59Sskmilk, beef, bread grain
Björnens Eko5138%0.48Sskvegetables, pork, ley (cropped by Ingelsbo)
Östanå381068%0.77Ssmilk, beef
Resta1108055%0.42Ssmilk, beef, mutton, pork
Åsbergby *2257053%0.57Sspork, beef, grain
Uppmälby7356%0.48Ssmutton, bread grain, vegetables, egg
Nibble1222074%0.50Ssmilk, beef, bread grain, egg, vegetables
Sörbro851579%0.35Ssgoat milk and meat, beef, grain, egg, vegetables
Ullberga903484%0.51Ssmilk, beef, bread grain
Markusgården801040%0.18Gnsbeef, heritage cereals, egg
Älmås607183%0.67Gskbeef, livestock, vegetables
Alvans803069%0.58Gmbmilk, beef
Buters57050%-Gmbgrain, vegetables, ley (cropped by neighbor)
Sigsarve801056%0.23Gmbmutton, heritage cereals, lenses
Stig in Mörtelek *124067%0.52Gskpork, mutton, beef, poultry, egg, vegetables
Västregård *17011060%0.75Gskmilk, beef, oilseed
Solmarka1222549%0.78Gmbmilk, beef, poultry, egg, vegetables, cereals
Källunda *802050%0.28Gmbpork, beef, heritage cereals, vegetables
Ängavallen1043550%0.56Gssmilk, beef, pork, mutton, grain, vegetables
Sweden 20192,251,499450,00038%
1 animal units, 1 au = 1 dairy cow or 6 calves 1–6 months or 3 other cattle > 6 months or 3 sows incl. piglets or 10 slaughter pigs > 10 weeks or 1 horse or 10 sheep or goats > 6 months or 40 sheep or goats < 6 months or 100 hens > 16 weeks or 200 chickens < 16 weeks; 2 Nö North upper, Nn North lower, Ssk Mid forest, Ss Mid plains, Gns South northern plains, Gsk South forest, Gmb South middle, Gss, South southern plains; 3 vegetables include vegetables, potatoes, and root crops; * data from 2020.
Table 2. Two scenarios with alternative diets. Scenario 1 (1960-inspired), scenario 2 (BERAS 2019), and the comparative values for Swedish average diet 1960, 2018, and the diet BERAS 2004. Source: Swedish Board of Agriculture (total consumption) and BERAS.
Food Product Category
Kg per Capita, Year
Target Diets 1Comparative Data
Scenario 1Scenario 2SwedenSwedenBERAS
196020182004
Grain products6270716289
Vegetables incl. potatoes168180118168169
Milk and dairy products380380442357555
Red meat, ruminants2210222710
White meat, monogastrics27527555
Egg12812158
1 Target diet is the set total consumption of the different food categories.
Table 3. Climate balance including C sequestration on the study farms, kg CO2e per ha arable land, presented in fossil and renewable scenarios, where all farms use either type of fuels.
Study FarmsCarbon Sequestration in SoilScenario Fossil FuelsScenario Renewable Fuels
EmissionsNETEmissionsNET
Blomfeltsgården−212622451192081−45
Fjöset + Trappnäs−25411813−7281486−1055
Ingelsbo + Björnens Eko−193629309942522586
Östanå−268935708803100411
Resta−16401195−4451094−545
Åsbergby−140916041941340−69
Uppmälby−167520193441511−164
Nibble−158323787942143560
Sörbro−137816312541480103
Ullberga−26722366−3062081−591
Markusgården−5661100534925359
Älmås−23444349200438731528
Alvans−16723263159130121340
Buters−1287679−607378−908
Sigsarve−8391117278959120
Stig in Mörtelek−23602330−292042−318
Västregård−2705387311673499794
Solmarka−210627426362424317
Källunda−102610348910−116
Ängavallen−143623148782070635
Average−179922284281947147
Weighted average−196222312691953−9
Sweden 2019−78630382 25326491863
Table 4. Climate balance including C sequestration on the study farms, kg CO2e per ha farmland (arable land + natural pastures), presented in fossil and renewable scenarios, where all farms use either type of fuels.
Study FarmsCarbon Sequestration in SoilScenario Fossil FuelsScenario Renewable Fuels
EmissionsNETEmissionsNET
Blomfeltsgården−212622451192081−45
Fjöset + Trappnäs−15181083−435888−630
Ingelsbo + Björnens Eko−131219866741710397
Östanå−212928266972454325
Resta−949692−258634−316
Åsbergby−107512231481022−53
Uppmälby−117214132411058−114
Nibble−136020436831841481
Sörbro−11711387216125887
Ullberga−19391717−2221510−429
Markusgården−503978475823319
Älmås−107419929181774700
Alvans−1216237311572190974
Buters−1287679−607378−908
Sigsarve−745993247852107
Stig in Mörtelek−545538−7471−73
Västregård−164223517092125482
Solmarka−174822765282012263
Källunda−8218276728−93
Ängavallen−107417316571549475
Average−12701568297136898
Weighted average−1341153619513465
Sweden 2019−6552532187722071552
Table 5. Plant nutrient balance on the example farms, kg nutrient per ha. Calculated on arable land only and total farmland including natural pastures. The share of purchased fodder is calculated from protein needs for the livestock production.
Study FarmsFarm Plant Nutrient Balance
kg per ka Arable Land
Farm Plant Nutrient Balance
kg per ha Farmland
Fodder Part Purchased %
NPKNPK
Blomfeltsgården54−2−254−2−211%
Fjöset + Trappnäs65−2039−100%
Ingelsbo + Björnens Eko64−1−343−1−26%
Östanå49−5−739−4−50%
Resta60−1035004%
Åsbergby59−2045−1017%
Uppmälby63−3−744−2−50%
Nibble50−3−343−2−211%
Sörbro35−2−330−1−36%
Ullberga19−3−314−2−22%
Markusgården15−3−513−3−40%
Älmås68010310512%
Alvans67−1−249−1−118%
Buters11−1−811−1−8no animals
Sigsarve25−2−222−2−22%
Stig in Mörtelek55−2013−108%
Västregård7403450217%
Solmarka60−4−950−3−83%
Källunda62−1−150−1−17%
Ängavallen61−3−345−2−23%
Average51−2−236−2−27%
Weighted average56−2−138−1−17%
Sweden 20197604630418%
Publisher’s Note: MDPI stays neutral with regard to jurisdictional claims in published maps and institutional affiliations.

