Article

Oil Spill Environmental Risk Assessment and Mapping in Coastal China Using Automatic Identification System (AIS) Data

1
Laboratory of Transport Pollution Control and Monitoring Technology, Transport Planning and Research Institute, Ministry of Transport of the People’s Republic of China, Beijing 100028, China
2
College of Marine Science & Engineering, Nanjing Normal University, Nanjing 210023, China
3
Key Laboratory of Coastal Salt Marsh Ecosystems and Resources, Ministry of Natural Resources, Nanjing 210007, China
*
Authors to whom correspondence should be addressed.
Sustainability 2022, 14(10), 5837; https://doi.org/10.3390/su14105837
Submission received: 23 March 2022 / Revised: 8 May 2022 / Accepted: 9 May 2022 / Published: 11 May 2022

Abstract

:
The rapid expansion in shipping traffic, oil tankers, and oil field exploration in coastal and marine areas has, inevitably, resulted in the occurrence of many oil spill accidents. Oil spill accidents, which cause serious socio-economic, health, and environmental risks in coastal and marine areas, are a global concern. An oil spill pollution risk distribution map, combining multiple spill sources, is an effective tool by which to identify high-risk areas, which may help decision-makers in adopting contingency response and integrated coastal management. However, the assessment of oil spill distribution and risk assessment has been restricted, due to their heavy dependence on laboratory experiments and model simulations lacking reliable shipping data, which often derive inaccurate mapping results. This study combines the automatic identification system (AIS) and other data to precisely quantify the spatial extent of accident risk in coastal China. Based on oil quantity, oil spill rate, and accident probability, the ship, oil storage tank, submarine pipeline, and oil platform accidents spill risk index is analyzed. Next, combined with the sensitive degree of a coastal area, considering environmental and social issues, the oil spill environmental risk index is calculated. The oil spill pollution risk level is classified into five categories based on the oil spill pollution risk index, namely the low-risk zone, relatively low-risk zone, moderate-risk zone, relatively high-risk zone, and high-risk zone. The relatively high oil spill environmental risk concentration zone is located in the Bohai Sea, inter-border area between the Yellow Sea and Bohai Sea, the Yangtze River estuary, south of the Taiwan Strait, and the Pearl River estuary. The high-risk zone in the Bohai Sea is 36,018 km2 in area, with an average risk value of 32.23, whereas the high-risk area in the Pearl River estuary is only 14,007 km2. The high-risk area proportions in Tianjin are 23.5%, while those in Fujian, Hainan, Jiangsu, and Guangxi are very low. The low-risk area proportion in Hainan Province is 62%, while the value in Tianjin is only 2.9%. This study will be helpful in assisting decision-makers in mapping the influence area of oil spills and adopting the important strategies and effective management and conservation countermeasures for ship accidents in the coastal areas of China.

1. Introduction

Oil is the world’s most important strategic resource, and oil transportation via maritime shipping has increased over the past several decades, which bears prominent economic advantages compared with other transport types for long-distance mass good delivery [1]. The International Tanker Owners Pollution Federation (ITOPF) concluded that the rapid increment of oil import quantities of crude oil transportation and large-scale ship operations has increased the density of ports and transportation ships [2], which will, ultimately, cause oil incidents to occur in the coastal areas at different scales and frequencies [3,4,5,6,7]. Oil spill incidents, one of the most crucial issues in coastal and marine environments, is defined as the combination of the probability that a spill event will occur and the magnitude of the consequences of impacts on the coastal ecosystems and crucial economic loss [8,9]. Oil spills occur, primarily, during crude oil exploration, ship collisions, wrecking, pipeline blowing, refinery activities, pipeline vandalism, and natural disasters [10,11,12]. Between 1907 and 2014, approximately 7 million tons of oil were leaked into coastal areas [13]. The oil spill quantity during the period of 2010–2016 across the world totaled 39,000 t, in which accidents with an oil spill quantity greater than 700 t accounted for 12 accidents, based on the ITOPF’s statistics data. The Deepwater Horizon oil spill of 2010 in the Gulf of Mexico (GOM), one of the largest marine oil spill disasters in the history of the petroleum industry, released 4,900,000 barrels of crude oil into the northern Gulf of Mexico and cost USD 68 billion in restoration of the degraded ecosystems. It affected approximately an 11,200 km2 area of the surface offshore environment, 2000 km of shoreline from Texas to Florida, and 8400 km2 of the sea bed [14]. In China, a noticeable accidental oil spill is the Sanchi oil tanker collision in the East China Sea [15].
Oil spills have a long-lasting, disastrous, and critical effect on marine ecosystems, along with immediate economic losses [6,16,17]. They, also, cause coastal landscape fragmentation, vegetation degradation, and hydrology alteration, due to the toxicity of petroleum-related compounds [14,18,19]. It is important to monitor oil spillage spatial distribution, assess the ship oil spill risk, and identify the impacts upon marine and coastal ecosystems. Spill risk modeling and impact assessments provide the geospatial information required to support the prioritization of spill containment and cleanup efforts, as well as the conservation of ecologically sensitive areas [20,21,22,23,24]. Oil spill risk is demonstrated as the multiplication of its sensitivity index, oiling spill likelihood, and the magnitude of the consequences [15,25]. Current research focuses on the mapping of temporal and spatial variations of different models of spill scenarios [5,24,26,27,28]. Chiri et al. [29] proposed mid-to-long-term probabilistic predictions of oil spill trajectories. Oil spill detection and mapping (OSPM) has been applied to remotely detected data for monitoring, surveillance, and management [30]. Guo integrated multiple dimensions from statistics data to characterize the comprehensive oil spill risk from potential sources to the surrounding marine-protected zone [4]. However, the identification of higher-risk areas is critical for decision-making, and considering the potential for transnational impacts of oil spills, it is necessary to define a common methodology for oil spill risk assessment [28,31,32]. Santos et al. [22] developed a quantitative methodology, by which to assess the spatial distribution and degree of coastal vulnerability to oil spills, and presented a map of the spatial distribution of vulnerability for mainland Portugal. To determine high risk areas in the Persian Gulf, a probabilistic risk analysis was conducted based on statistical results from a fast Lagrangian oil spill model [6].
The fuel oil contained in ships is the main risk resource in coastal and marine areas. Along with the rapid development of import and export trades, ship transportation flow and density have increased. In the coastal and marine areas of China, there have been at least 100 accidents greater that 50 t, of which the total oil spill total amount was 75,470 t, in the period of 1973–2013. The oil spill accident area and amounts demonstrate the, evidently, increased trend, combined with the close proximity from the coastline [23]. Approximately 72% of oil spill accidents and 88% of spill amounts occur within the distance of 18 m from the coastline. They have occurred in the Bohai Strait, Yangtze River estuary, Pearl River estuary, and Taiwan Strait, all of which undergo heavy ship flow. However, the previous studies have, mainly, focused on the mathematical analysis, and an obvious weakness of previous methods is the absence of the definite risk level and index of the coastal environment [17]. To address the gaps in research, a novel coastal oil spill risk, for large-scale identification of oil extent, is essential. Therefore, the use of automatic identification system (AIS) data, due to their impressive functionalities, is essential, due to its broader coverage area and more accurate data. The present study pursues the following objectives: (i) map the comprehensive oil spill accident risk index including ship, oil storage tank, submarine pipeline, and oil platform in the coastal area of China; (ii) estimate the environmental pollution risk grade of an oil spill, considering pollution sources and sensitive targets; and (iii) propose related evidence-based information on how to decrease the number of oil spill accidents, so as to better aid decision-making for the sustainable management of coastal oil spill disasters.

2. Materials and Methods

2.1. Study Area

The total length of China’s coastline is 32,000 km, of which the mainland coastline is 18,000 km. The coastal zone is the most urbanized and economically developed area in China, among which the Bohai Rim, the Yangtze River Delta, and the Guangdong–Hong Kong–Macao Greater Bay Area are the most developed. With the fast development of international trade, ports located in coastal areas have been constructed to promote goods transportation and exchanges. China has become one of the largest petroleum import countries worldwide, and ports play a vital role in storing and processing crude oil. The region with the fastest growth rate, in terms of land utilization, is found within and around the major ports, such as Tianjin Port, Tangshan Port, Shanghai, and Ningbo-Zhoushan Port. This rapid port development may, inevitably, result in the occurrence of oil spill accidents. The coastal zone contains many marine protected areas and marine reserves, however, some of them are located right next to the ports or oil platforms. If a large spillage occurs, it will be difficult to prevent environmental destruction. Oil spills pose a serious threat to these environmentally sensitive sites. Therefore, it is essential to analyze the potential hazards to the surrounding marine and coastal environments.
There are five port clusters in coastal and marine China area, i.e., Bohai Rim, the Yangtze River Delta, southeast China, the Pearl River Delta, and southwest China, exhibiting an uneven spatial port distribution. The Ningbo-Zhoushan Port (Yangtze River Delta), Shanghai Port (Yangtze River Delta), Tianjin Port (Bohai Rim), Guangzhou Port (Pearl River Delta), Tangshan Port (Bohai Rim), Qingdao Port (Bohai Rim), Suzhou Port (Yangtze River Delta), and Rizhao Port (Bohai Rim) rank among the top ten ports in the world, in terms of cargo throughput. In 2020, the port throughput in China was 14.5 billion tons, which increased by 4.3% over 2019. The coastal ship tonnage increased from 1224 to 5959 t, while the average ocean ships tonnage increased from 9911 to 27,932 t during the period of 2002–2012. The ship types may be divided into two types, i.e., oil ships and non-oil ships. The total tonnage of oil (T) is the quantity of oil ships multiplied by the average tonnage of oil ships in one specific type. The ship traffic in the Bohai Sea, Liaodong Bay, Chengtoushan, Yangtze River Delta, Zhejiang coastal area, Taiwan Strait, Pearl River estuary, and Qiongzhou Strait has a relatively high density compared with the southwestern coastal area of China and Jiangsu coastal area. In the period of 2002–2012, the oil throughput in coastal ports increased from 0.26 to 0.63 billion tons, of which the throughput in Ningbo-Zhoushan, Qingdao, Dalian, and Tianjin ranked the highest. In 2012, the national imported oil via ocean transportation was 0.25 billion tons, which was greater than 90% of the total imported oil amounts in China. During the period of 1973–2013, there were about 100 oil spill accidents with an oil spill greater than 50 t in the coastal area, with an average of 2.4 accidents per year. The total oil spill amounts are about 47,000 t, the average annual amounts of oil spill are about 1150 t, and a single oil spill above 50 t is about 470 t (Figure 1). During the past 40 years, the number of oil spill accidents showed an overall upward trend, and the oil spill amounts showed a downward trend, except for special years.

2.2. Research Method

The goal of oil spill risk analysis is to assess the area and distribution of marine oil spill accidents based on the oil transportation by ships, oil tankers, pipes, and gas platforms. Moreover, oil spill risk analysis must, also, consider the historical oil spill accidents, location of marine natural reserves, suitable statistics method, and spatial analysis approach. The specific steps are as follows: (1) considering the national port spatial distribution, oil spill emergency equipment coverage extent, the entire marine boundary of China was divided into square grid with a length of 28 km (15 nautical miles); (2) considering the risk status, such as ship types, oil tanker storage abilities, pipe lengths, transport abilities, and historical oil spill accident numbers, occurrence frequency is analyzed via risk factor in the grid size; (3) due to vulnerability, a sensitivity index analysis was conducted for the natural reserves, fishery protection areas, and coastlines; and (4) the oil spill accident risk index is identified by oil spill accident area and occurring probabilities, while the sensitivity index is based on different sensitive objects, including environmental and social sensitive objects. The coastal sensitive object has a different sensitive value; for example, the sensitive index of a national natural reserve is 100, while that of ordinary water bodies is only 5. Based on the estimation of the oil spill accident risk index and sensitivity index, the regional oil spill pollution risk index, oil pollution risk level, and high-risk zone can be identified.

2.2.1. Grid Zonation

The grid zonation in the coastal marine area is the basis for marine status investigation, risk computation, and analysis. Meanwhile, grid zonation should reveal the coastal port spatial distribution traits, oil spill emergency equipment stores coverage area, intensities of sea utility, and marine area oil spill risk level, which is the required spatiotemporal difference of an oil spill emergency. The study area could be divided into a different grid with the same spatial resolution, to represent the entire coastal area of China. The length of coastline in mainland China is 18,000 km, and there are 51 main ports, with an average distance of 352 km between them. Based on the Equipment Allocation Regulation of National Ship Oil Spill Emergency Equipment Warehouse, the service radius of a small-sized oil spill emergency equipment warehouse scale is 60 nautical miles (approximately 111 km). The grid radius is defined as one quarter of the service radius of the small-sized oil spill emergency equipment warehouse, i.e., a square grid with a length of 28 km. Next, a total of 2122 grids is determined, including the 314 grids in the North Sea (including the Bohai Sea and Yellow Sea), 896 grids in the East China Sea, and 912 grids in the South China Sea.

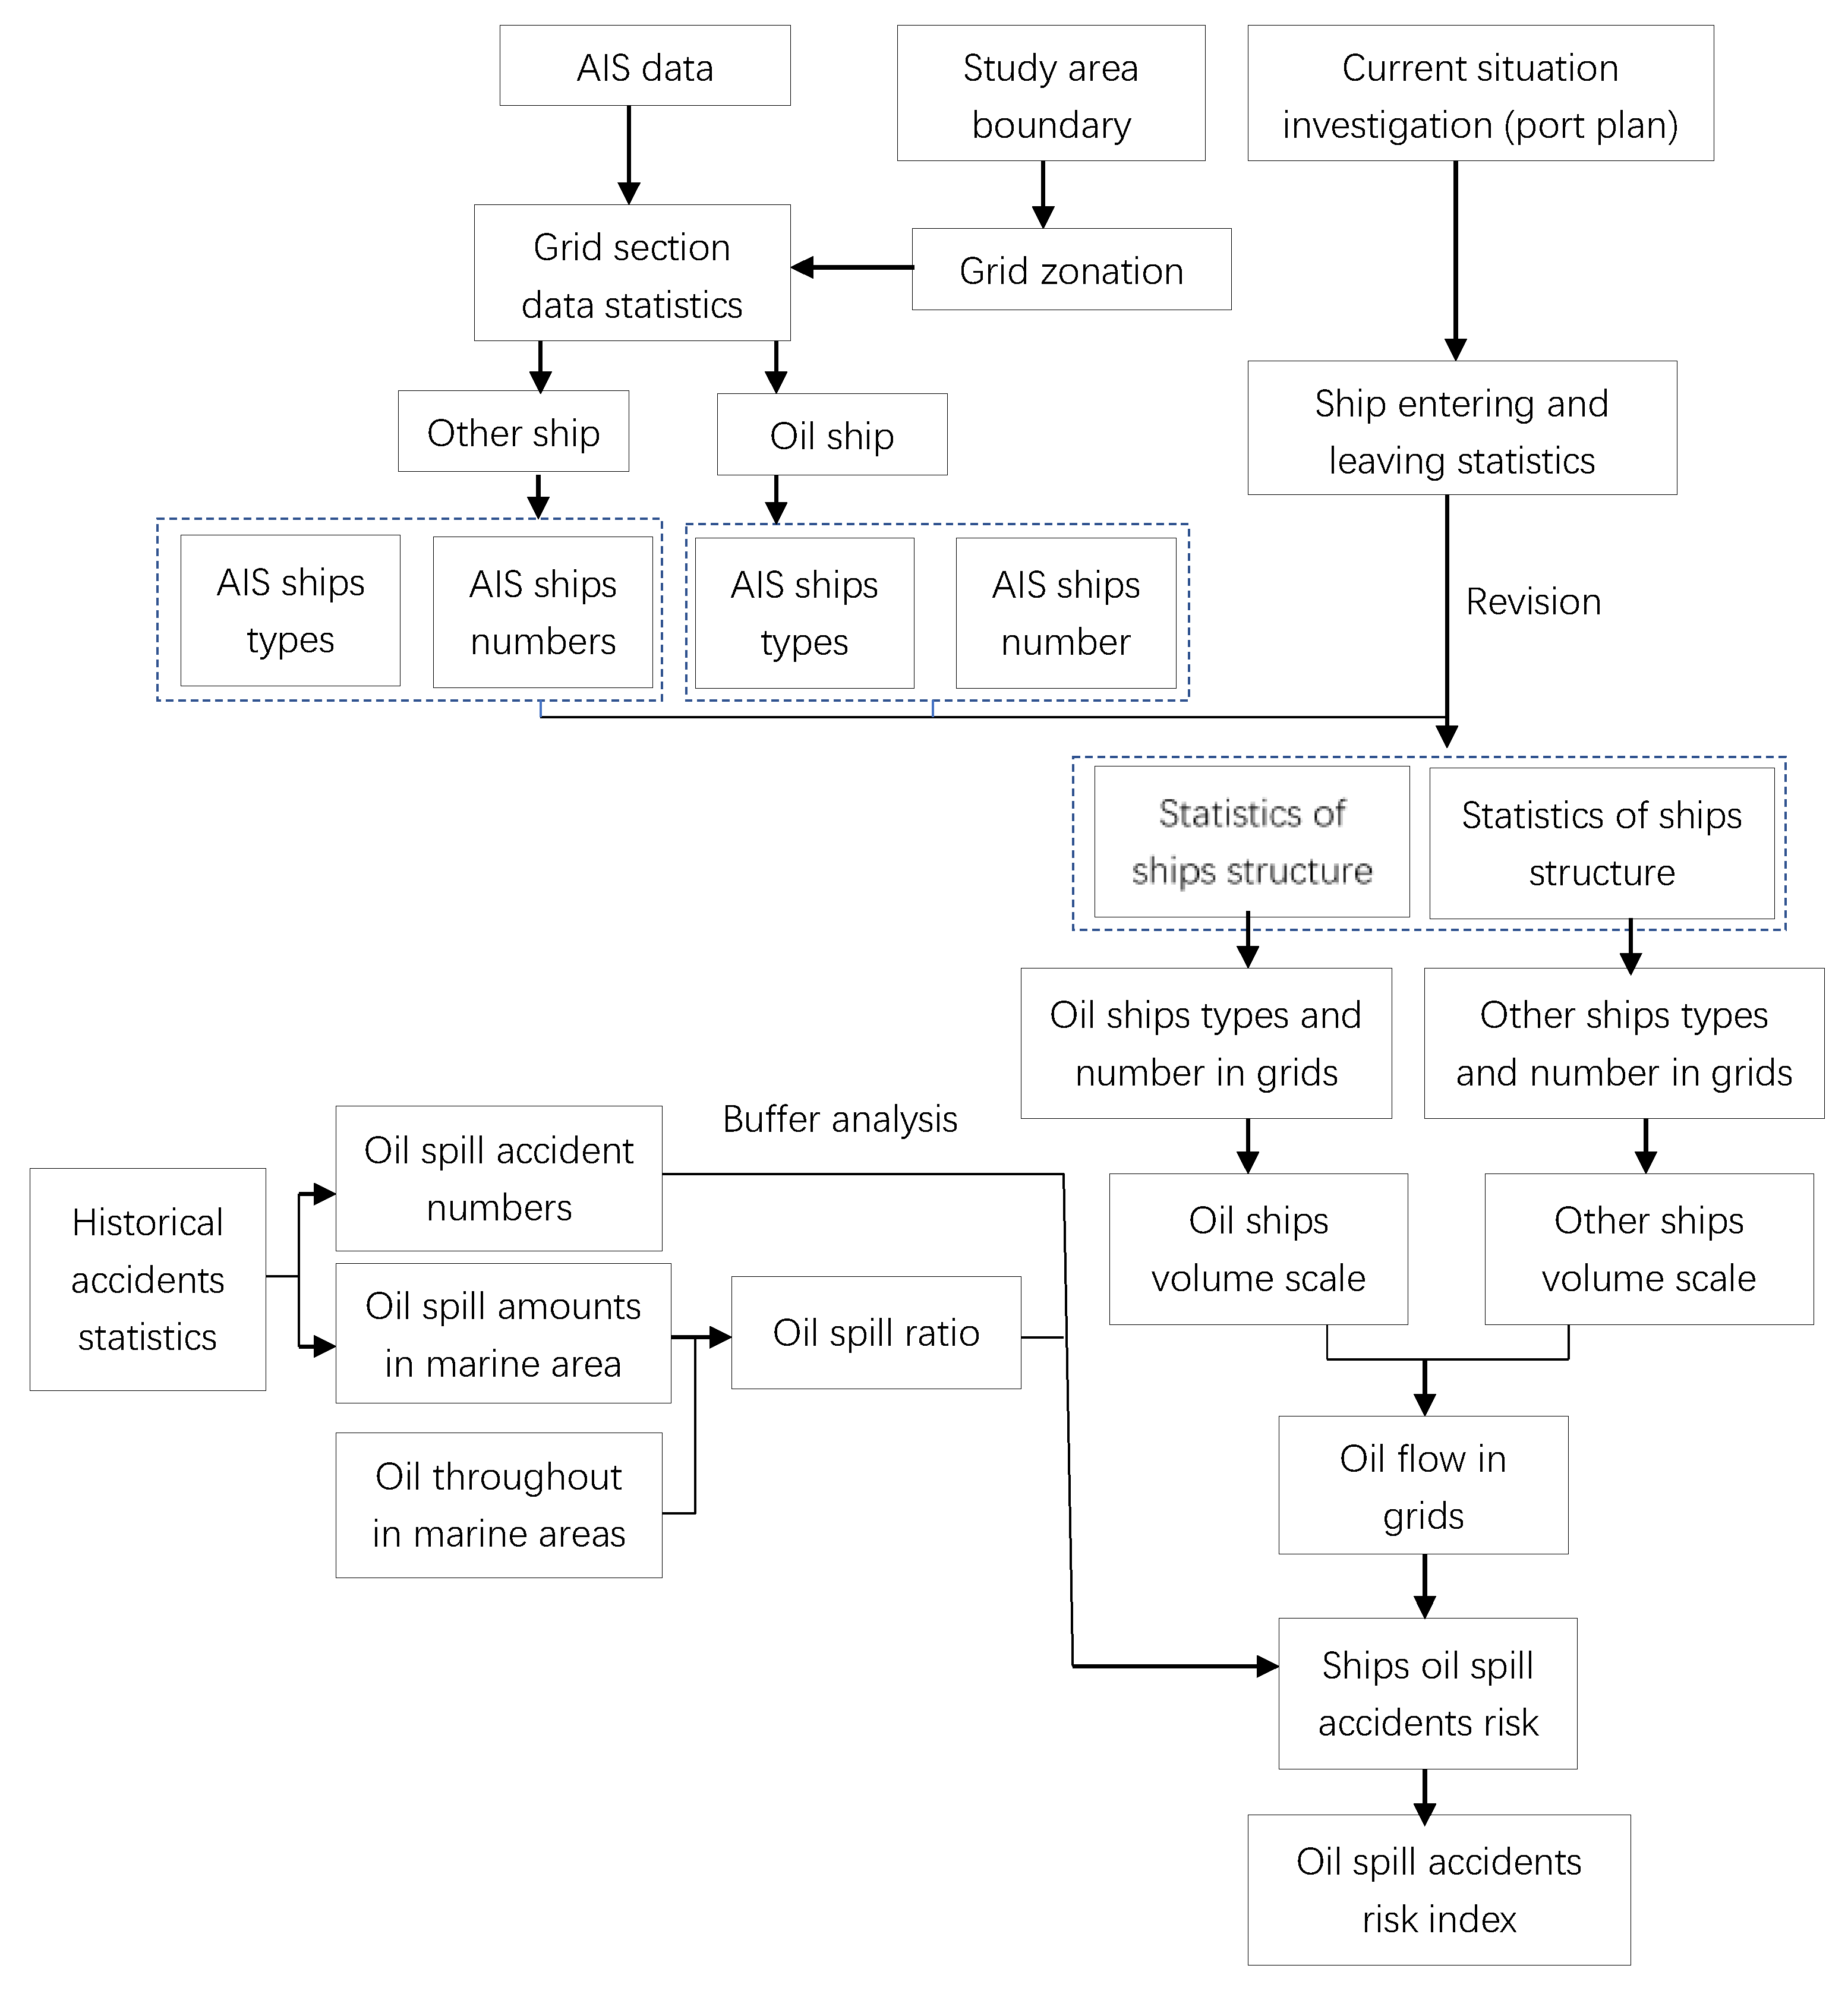
2.2.2. The Flow Chart of Ship Oil Spill Accident Risk Index

Oil spill pollution risk is not only closely related with the quantity and tonnage of a ship, but also with the leak amounts of historical accidents and the location of high-occurrence accidents. Based on the AIS in 2012, the Marine Statistics Yearbook of 2002–2012, the oil spill historical accidents having larger than 50 t during 1973–2013, and the coastal port distribution plan, the ship oil spill accident risk index was derived (Figure 2).

Oil Quantity in Each Grid (O)

Based on the Automatic Identification System (AIS) data, the ship information, including oil ships and other types of ships, in each grid was derived to estimate the ship composition and the oil amounts transported by ships in each grid in 2012:
O   =   O oil   ships   +   O non - oil   ships
O oil   ships   =   T oil   ships   ×   0.5
O non - oil   ships   =   T non - oil   ships   ×   0.1
T oil   ships   =   i = 1 n w oil   ships - i   ×   t oil   ships - i
T non - oil   ships   =   i = 1 n w non - oil   ships - i   ×   t non - oil   ships - i
where, O is the total amounts of oil quantity; O oil   ships and O non - oil   ships are the respective total quantities of oil ships and non-oil ships; T oil   ships and T non - oil   ships are the respective tonnages of oil ships and non-oil ships; w oil   ships - i and w non - oil   ships - i are the respective quantities of oil ships and non-oil ships in level I; and t oil   ships - i and t non - oil   ships - i are the respective average tonnage of oil ships and non-oil ships in level I (which can be divided into the three types, i.e., I, II, and III).
Based on the AIS data, the oil ship types are classified into three types, i.e., 100 m (I), 250 m (II), and 350 m (III), of which the respective average tonnages are 3000 t, 100,000 t, and 350,000 t. As for the non-oil ships, the respective average tonnages are 3000 t, 88,300 t, and 309,000 t.

Oil Spill Rate

Combining oil spill accidents of a quantity greater than 50 t in the period of 1973–2013, with the total oil spill quantity in each marine area in 2012, the potential oil spill quantity in each grid can be estimated as follows:
R s e a   =   S s e a O s e a
where R s e a is the oil spill rate of ships in specific marine zone; S s e a is the total oil spill quantity of each accident with larger than 50 t in a specific time span; and O s e a is the total oil quantity transported by ships within the same marine zone. According to the AIS data for 2012, the total oil quantity in the period of 1973–2012 increased at the same speed as the port throughput. Based on the data of coastal port throughout in the period of 1973–2012, the total oil quantity can then be derived.

Oil Spill Extent

Multiplying grid oil quantity and oil spill rate yields the potential oil extent.
E   =   O   ×   R s e a n s e a
where E is the potential oil spill extent of each grid; O is the total oil quantity transported by ships of each grid; R s e a is the oil spill rate in the marine zone of the grid; and n s e a is the number of oil spill accidents in the marine zone.

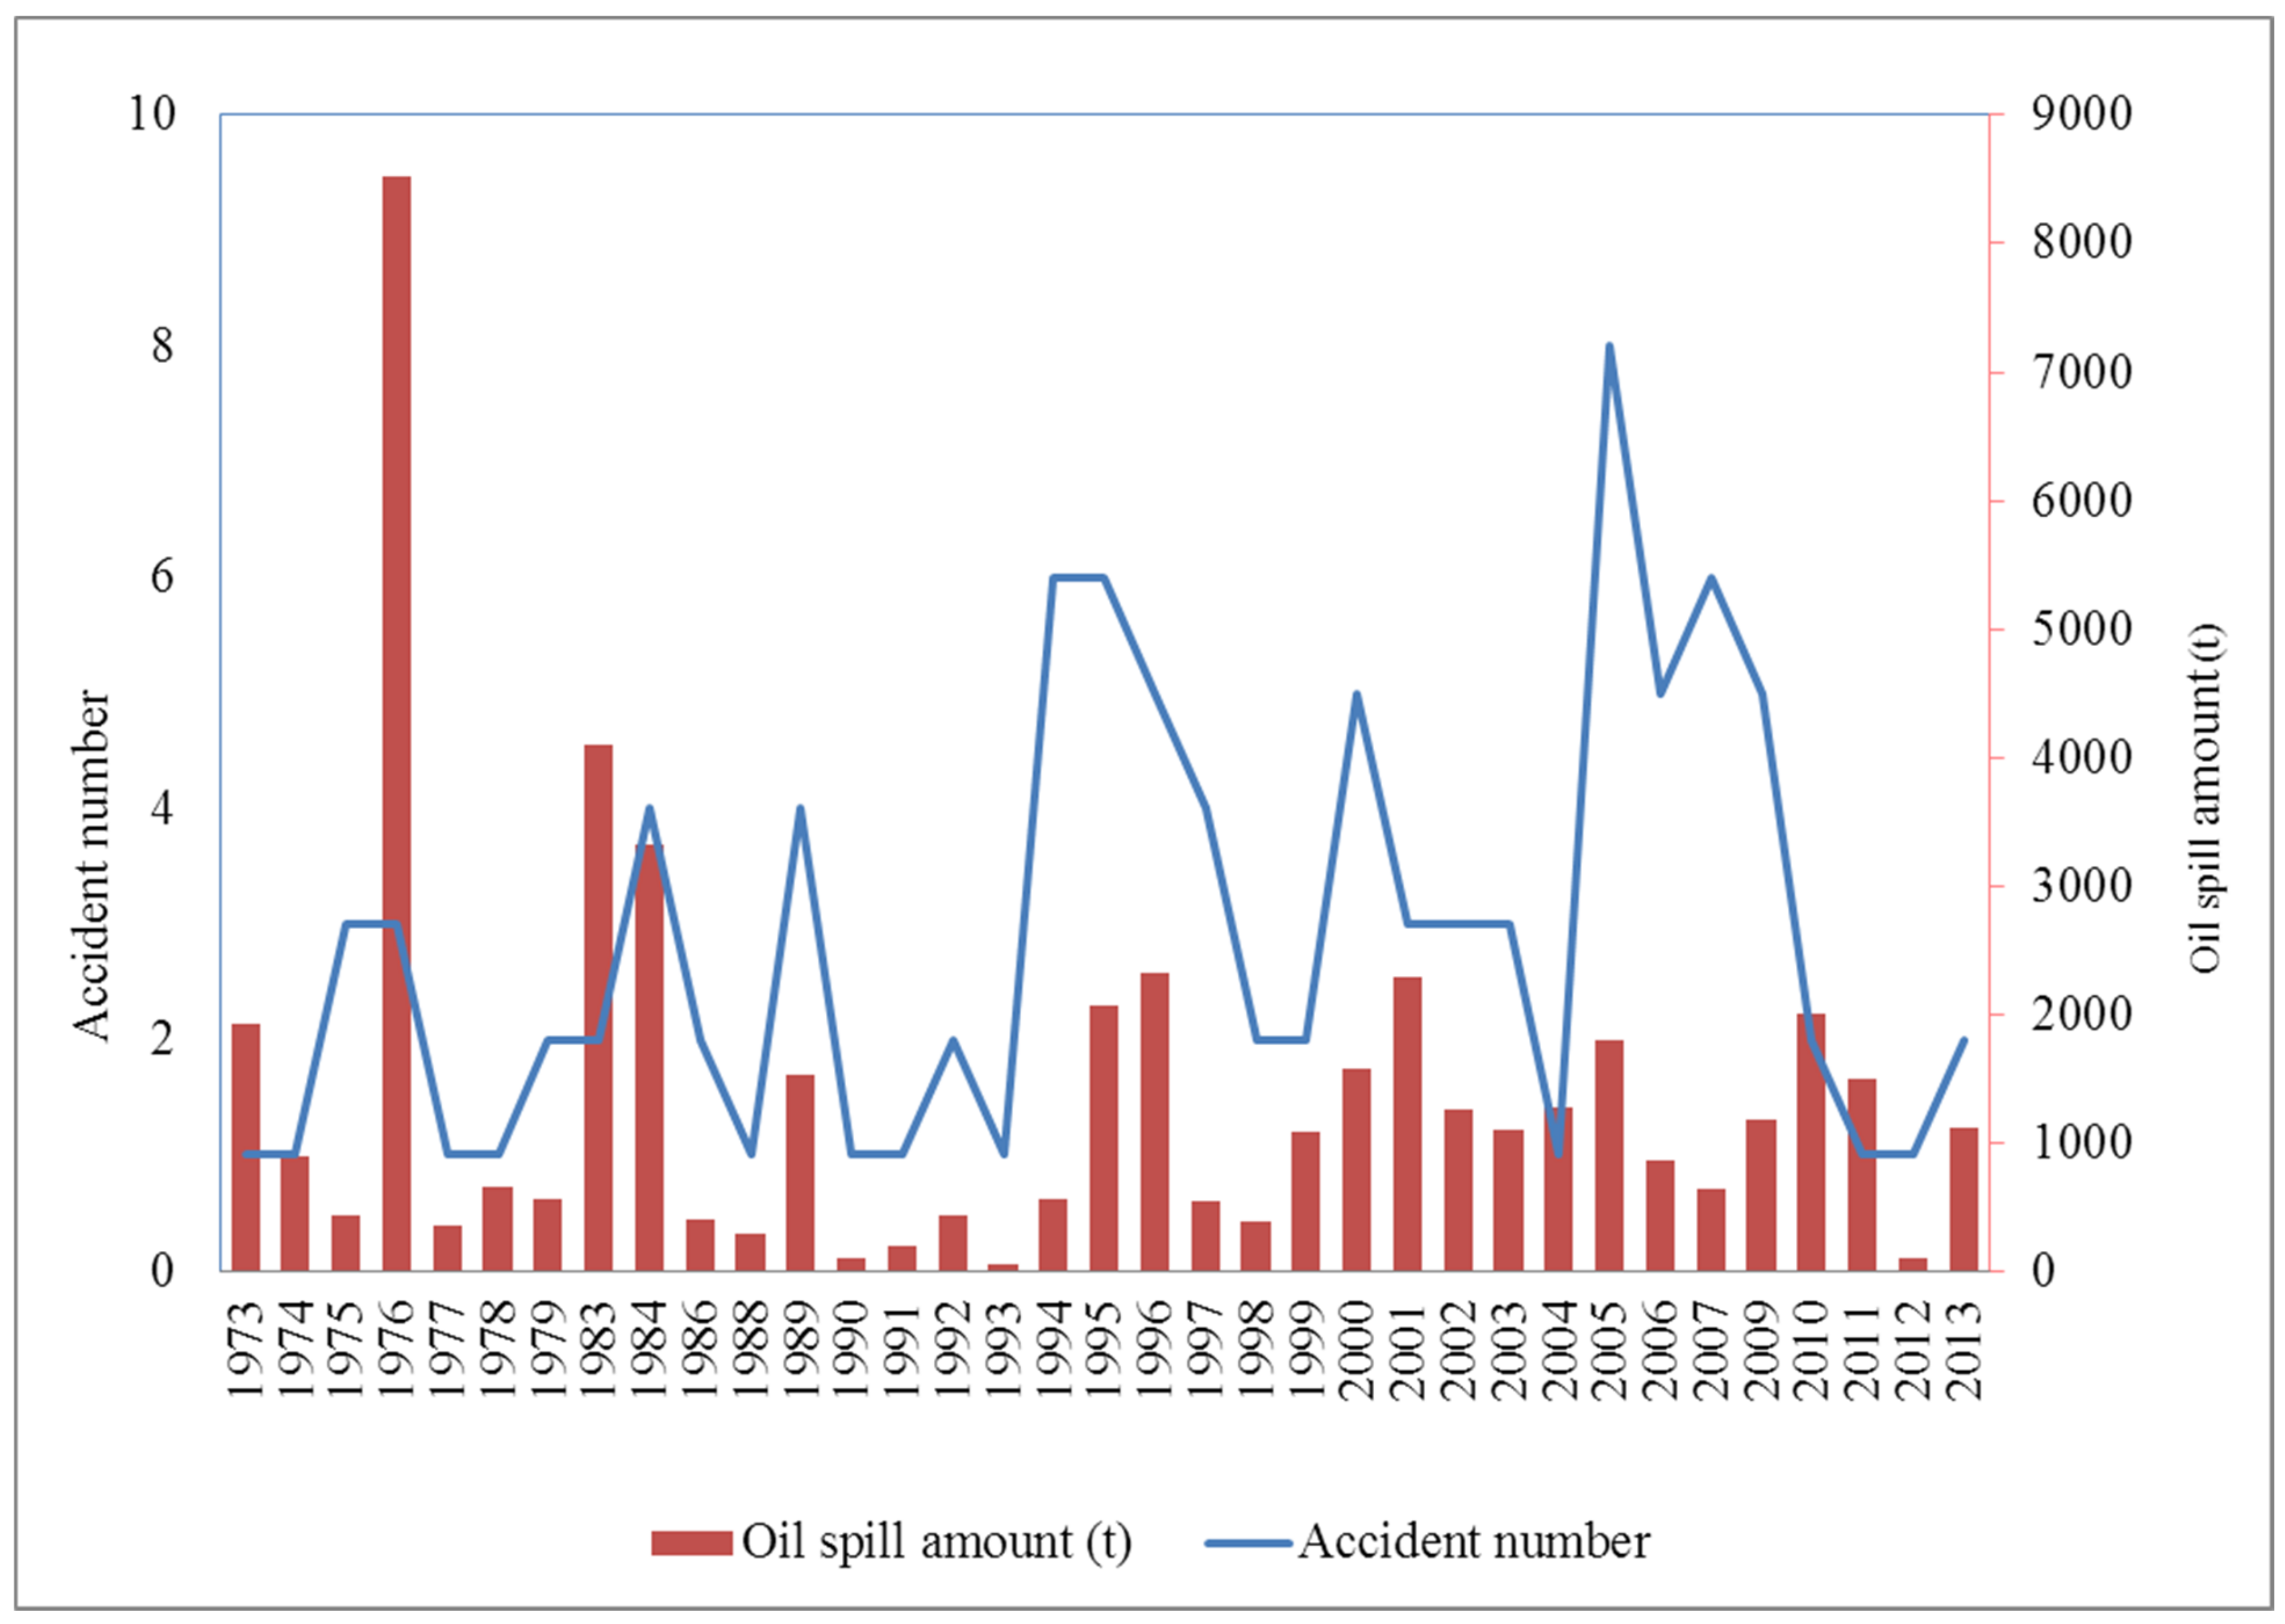
2.2.3. Accident Probability

The oil spill accidents probability throughout the entire marine area can be derived from the locations of historical accidents and frequency. The oil probability effects of the first, second, third, and fourth circles were computed (the grids have 28 km (15 n miles), 56 km (30 n miles), 83 km (45 n miles), and 111 km (60 n mile) as their respective grid centers). The oil spill accidents probability (replaced by accident frequency) in the specific grids is as follows:
P   =   ( p   +   p 15     p 2   +   p 30     p 15 4   +   p 45     p 30 6   +   p 60     p 45 8   +   p M a r i n e _ z o n e r M a r i n e _ z o n e   +   p E n t i r e _ m a r i n e _ z o n e r E n t i r e _ m a r i n e _ z o n e ) a
where, P is the grid oil spill accident probability (frequency); p is the accident quantity of the oil spill quantity greater than 50 t since 1973; p15, p30, p45, and p60 are the oil spill accidents with quantity greater than 50 t, with a surrounding distance of 15, 30, 45, and 60 miles of a specific grid, respectively; p M a r i n e _ z o n e and r M a r i n e _ z o n e are an oil spill quantity greater than 50 t in the marine zone; the ratio of marine zone radium of the grid and grid radium are 25 in the north marine area, and 54 in the other two marine zones; p E n t i r e _ m a r i n e _ z o n e and r E n t i r e _ m a r i n e _ z o n e are the accident amounts of oil spill quantity being greater than 50 t in one grid, with the ratio between marine zone radium and grid radium (set as 111); and a is the year in which an accident occurred.

2.2.4. Oil Spill Accident Risk Index (H)

Multiplying the oil spill extent and accident probability yields the oil ship accidents spill risk index in the grid:
H   =   E   ×   P
where H is oil spill accidents risk index, E is the potential oil spill extent, and P is the accident probability.

2.2.5. Oil Spill Accident Risk Index of Oil Storage Tanks, Submarine Pipelines, and Oil Platforms

According to the Investigation Analysis Report of Land-Source Oil Spill Environment Emergency Capability in Coastal China of Ministry of Environmental Protection, the report has provided the information of the oil tank amounts, oil pipelines, and offshore platforms of oil companies, and, then, determined the oil storage ability in each grid. The oil spill total quantity was derived based on the above three historical oil spill accident risk sources. Then, combining the total quantity of oil tanks in coastal areas, the designed transportation ability of pipeline, and the planned output of marine oil platform, the oil spill ratio was computed. The probable oil spill scale, following the occurrence of oil spill accidents in each grid, was determined. Integrating the information of high incidence areas of oil spill accidents, the oil spill accident risk index in each grid was then computed (Figure 3).

2.2.6. Oil Spill Environmental Risk Index ( P )

Integrated Oil Spill Accident Risk Index

Adding the oil spill accident risk index of ships, storage tanks, pipelines, and platforms, we can derive the integrated oil spill accident risk index.
H I n t e g r a t e d _ i n d e x   =   i = 2 4 H i
where H I n t e g r a t e d _ i n d e x is the integrated oil spill accident risk index, and H i is the oil spill accident risk index of the i th risk source.

Sensitive Object Assignment

This sensitive object assignment value plan refers to the sensitivity classification methods of the Pollution Marine Environmental Risk Assessment Technique Guidelines (Table 1).

Oil Spill Environmental Risk Index

Overlaying the oil spill accident risk index and sensitive index using a risk matrix can derive the marine oil spill environmental risk index. The oil spill environmental risk index is determined by the following formula:
P   =   H I n t e g r a t e d _ i n d e x   ×   M
where P is the oil spill environmental risk index, H is the oil spill accident risk index, and M is the sensitivity index. Based on the AIS data for 2012, maritime statistics data, and historical oil spill accidents being greater than 50 t in the period of 1973–2013, the oil spill environmental risk index was estimated by combining the national coastal port distribution plan with the national coastal environmental sensitive objects.

3. Results

3.1. Comprehensive Oil Spill Accident Risk Index

The main route of oil spill risk of accidents includes the route from the Bohai Rim to the Pearl River Delta via the Yangtze River Delta and the Pearl River Delta (Figure 4). The greatest risks of oil spill accidents are in the Bohai Straits, Yangtze River estuary, and Pearl River estuary, which have clustered ports as well as higher ship flow and oil transportation amounts. Taking the historical oil spill amounts, oil tankers, oil seabed transportation pipes, and ocean oil platforms as the weight, the four accidents risk index in the grid scale could be estimated. The higher risk zone of an oil spill accident is in the oil transportation route in coastal China, including the Bohai Rim ports, such as Dalian Port, Tianjin Port, Qinhuangdao Port, and Qingdao Port; the Yangtze River Delta ports of Shanghai and Ningbo-Zhoushan; and southeast coastal area ports, such as Xiamen Port, Shenzhen Port, and Guangzhou Port. The oil accidents risk index decreased along the distance to the coastline, and the high-risk areas are distributed in the main oil transportation navigation route, thus demonstrating an obvious spatial difference.
The area of high-risk for oil storage tankers is in the oil storage and petroleum chemical base in Tianjin, Dalian, Qingdao, Ningbo, Zhoushan, and Huizhou. The highest risk indexes of oil spill accidents are in the Bohai Sea and Yellow Sea. The highest risk of a pipe transportation oil spill is in the Bohai Sea. The highest risk of a platform oil spill is in the Bohai Sea. The oil spill environmental risk index decreased from offshore to the outer sea, and the higher value was in the northern area, while the lower value was in the southern area.

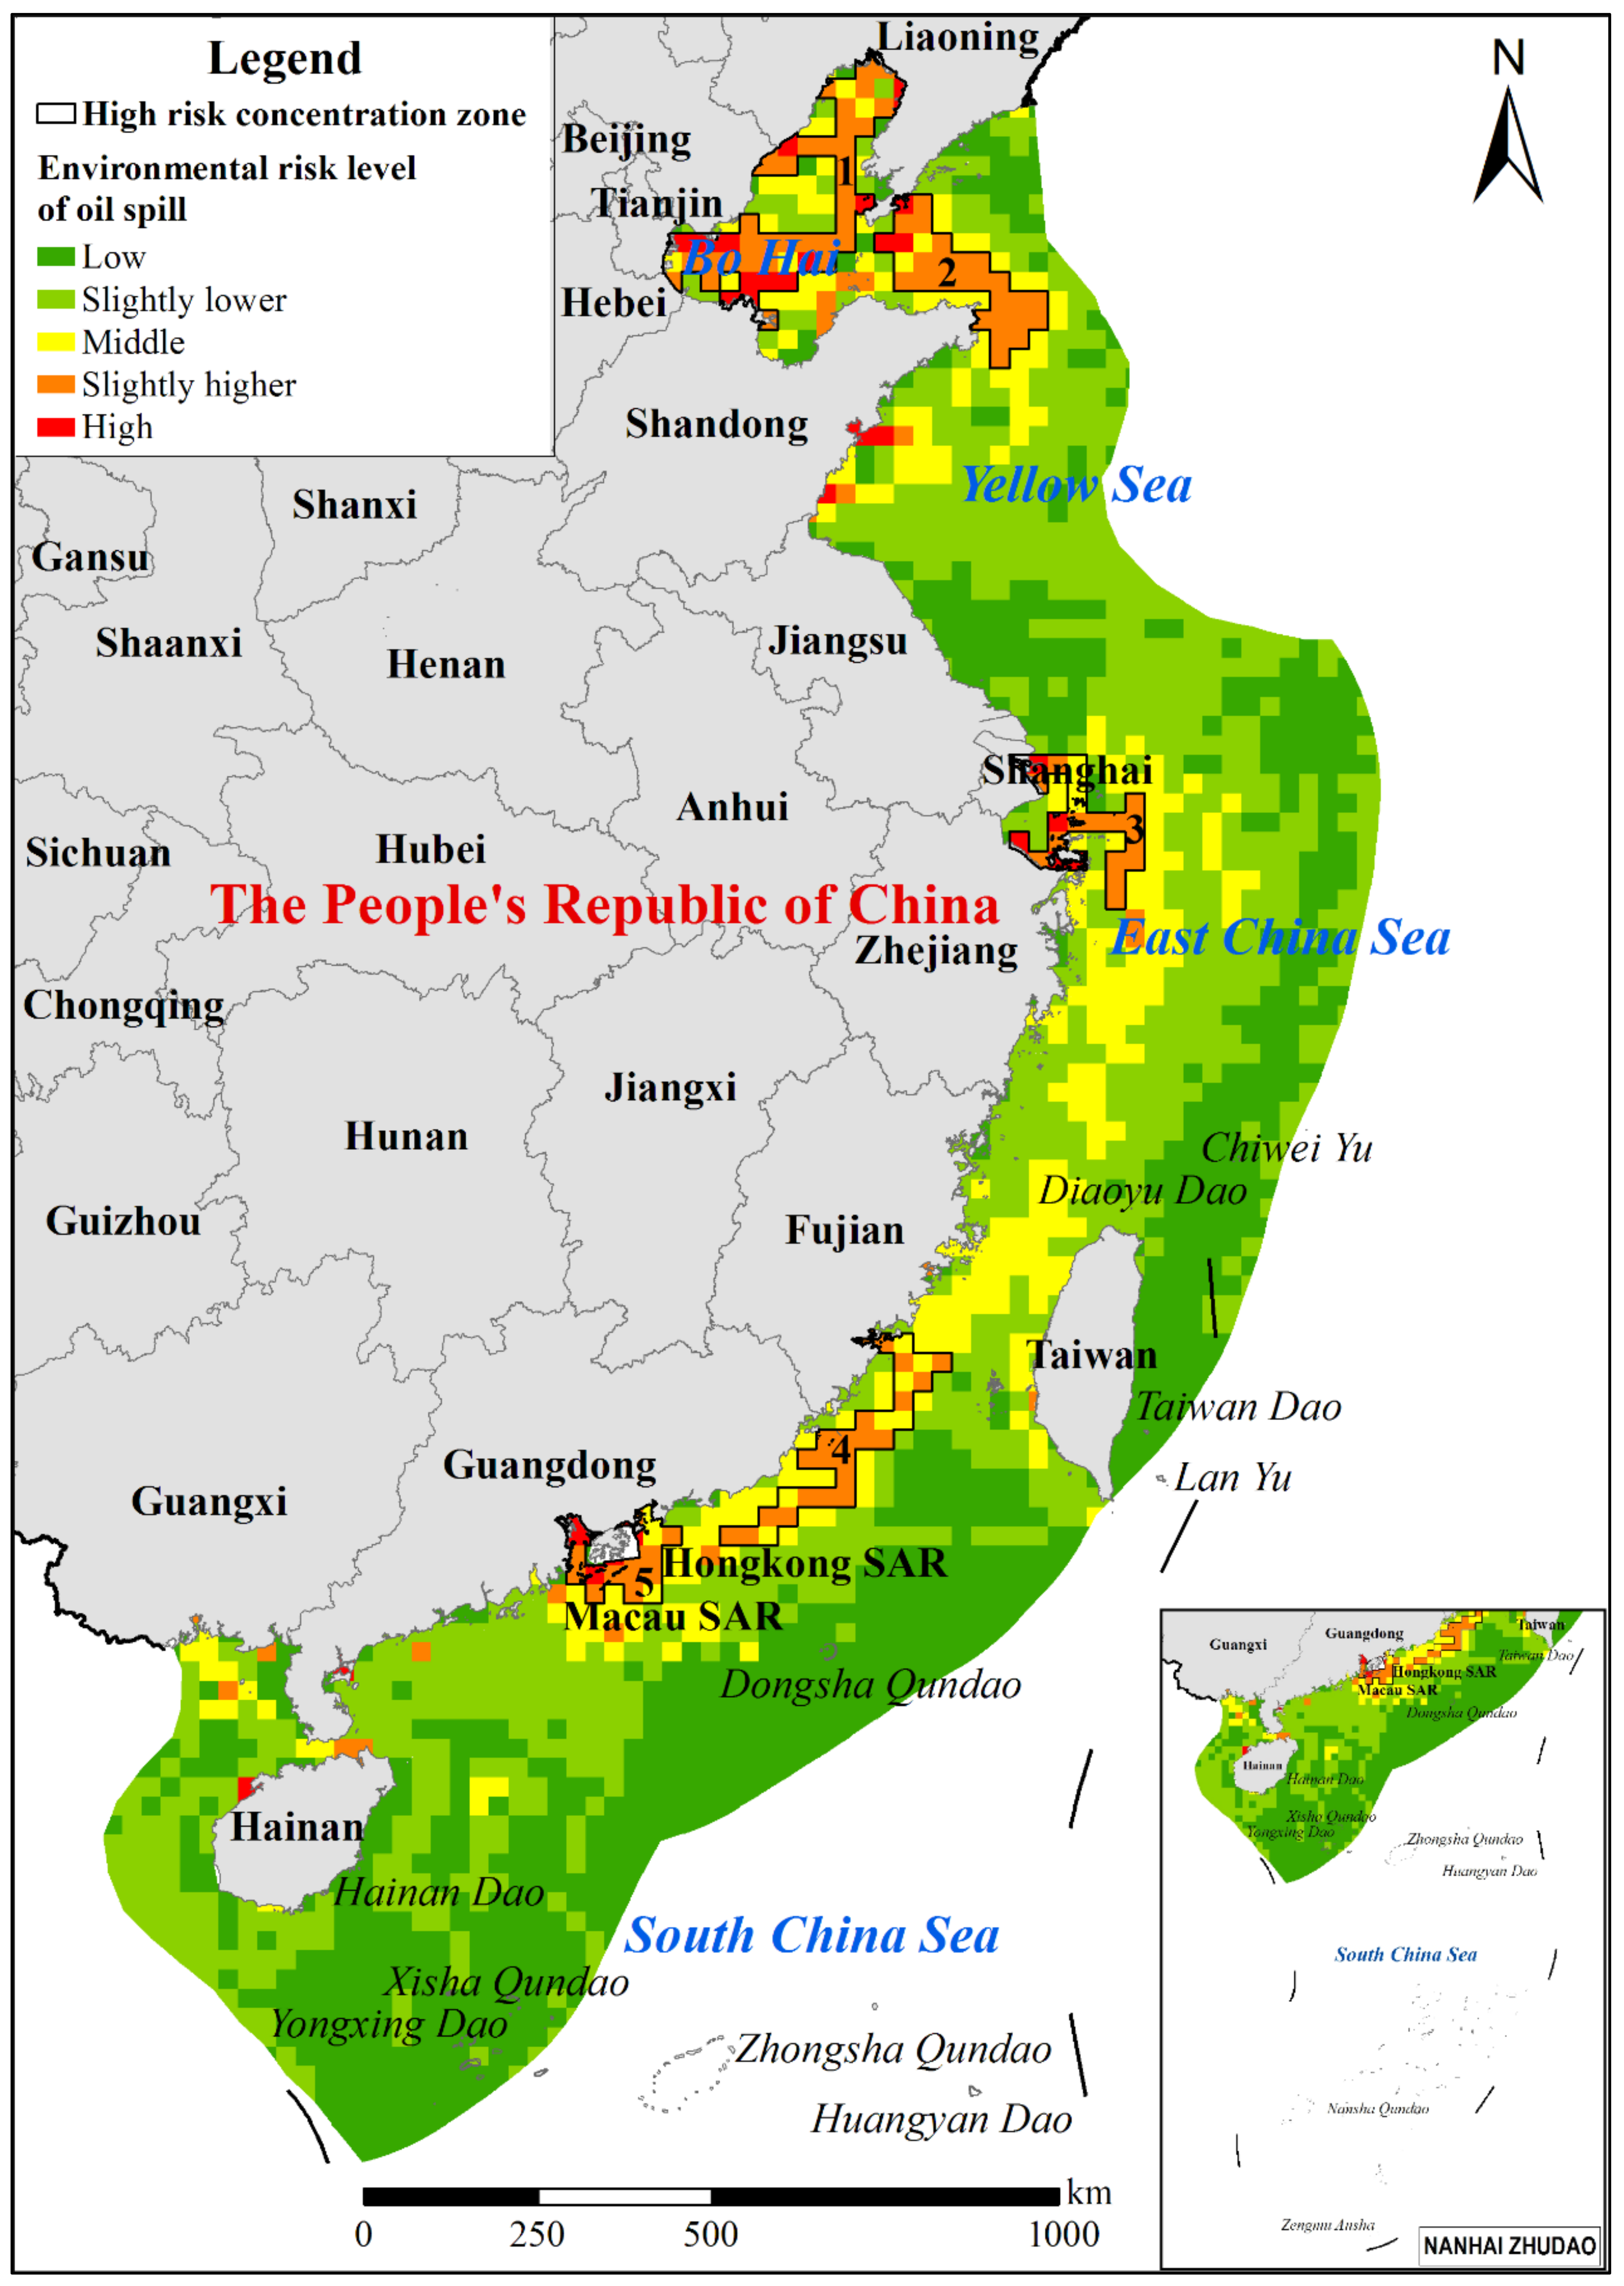
3.2. Oil Spill Environmental Pollution Risk

The oil spill environmental risk grade was classified as a high-risk area, relatively high-risk area, moderate-risk area, relatively low-risk area, and low-risk area, according to the risk index value (Table 2). The percentage of high-risk areas in Tianjin is the greatest, at 23.5%, followed by Hebei at 16.1% and Liaoning at 7.4%. The percentages of low-risk areas in Guangdong, Hainan, Shanghai, Guangxi, and Fujian are greater than 30%; moreover, the percentage of low risk in Hainan Province is the greatest, at 62.2% (Table 3). The high-risk area proportions in Fujian, Hainan, Jiangsu, and Guangxi are 0%, while that in Tianjin is 23.5%. The highest oil spill environmental risk concentration zones are in the Bohai Sea Rim, Yangtze River Delta, and Pearl River Delta (Figure 5). The low-risk area proportion in Hainan Province is 62%, while that of Tianjin is only 2.9%.
In the coastal areas of China, the risk of oil spill environmental pollution is relatively high in five regions (Table 4). The average oil spill risk index of high-risk areas in the Bohai Sea is the highest, at 32.23. The total area of the five high-risk concentration zones is 104,052 km2.

4. Discussion

4.1. Mapping of Oil Spills and Influencing Factor in Coastal China

With the development of the offshore oil and transportation industries, the probability of an oil spill has been increasing on coastal oil platforms, oil tankers, and offshore oil facilities. Oil spills usually occur due to ship collision, wrecking, pipeline blowing, refinery activities, pipeline vandalism, sabotage, and ship tank cleaning. Considering the potential for transnational impacts of oil spills, it is necessary to define a common methodology for oil spill risk assessment [17,20]. Oil spill risk assessment consists of integrating the results of the risk source release assessment, likely extent of exposure assessment, and consequence assessment in consideration of various environmental vulnerabilities, to produce quantitative measures of risk. An increasingly important component of contingency planning efforts for oil spills is the development of spill-modeling tools for generating forecasts associated with the transport and fate of oil in the environment [20]. Oil spill models account for oil type, spill rates, location, ambient environmental conditions, advection, spreading, emulsification, evaporation, response actions, and many other factors. Previous oil spill risk models have adopted empirical and intuitive approaches based on historic accident data to identify high-risk sources of oil spills [33]. This oil spill assessment can be achieved via an oil spill model (OSM) that determines the transient behavior of an oil spill, as well as its trajectory, risk assessment, and management, from which we can estimate the contamination probability and arrival time. OILMAP is a computer system that provides information regarding the trajectory of movement and behavior of an oil slick due to spillage, via a database containing the history of hydrometeorological conditions and tools for their visualization. GNOME is a tool for modelling a prediction of the possible route or trajectory of pollution, both under water and on the water surface [10]. The location of the platform, frequency of occurrence, spill volumes, and the range of damage for oil field production are by far the most important components of the model [23]. The integration of spatial data and oil spill simulation has significantly enhanced the effectiveness of oil spill risk assessment [34]. The oiling spill likelihood for a receptor area was calculated by averaging the fraction of spilled oil that reaches the area in different scenarios [35]. However, spill modelling is only one facet of the larger planning and response framework.
Shipwreck incidents are a major source of marine oil pollution, so the respective protocols for responsive actions need to be included in the contingency arrangements [10]. Oil spill hazards vary spatially, and marine oil exploration occurs in environmentally sensitive areas of a marine-protected zone, rather than in the least-sensitive area of the port/shipping zone. The sensitive marine areas, in order, are aquaculture/fishing, tourism/entertainment zones, residential zones, specific utility zones, industry/urban sea, and mineral/energy extraction zones. The coastline morphology is even more important because the shoreline type causes the level, duration, and extent of exposure to oil. The fate of the spilled oil was affected by the shape of the shoreline, the properties of the sediments, and the remediation methods. Imagery monitoring, which provides tools and information for the authorities combating pollution, is a very useful tool. The integration of spatial data and oil spill simulation has significantly enhanced the effectiveness of oil spill risk assessment.
The Bohai Sea is a C-shaped semi-enclosed marginal sea, in the northeast part of China, which extends over an area of 77,000 km2, and the Bohai Rim region is a highly industrialized coastal zone in China. As China’s largest offshore oil drilling area, the Bohai Sea oilfield has supplied over 300 million tons of crude oil since 1976. According to records, over the past 30 years, the probability of an oil spill caused by platform blowout in the Bohai Sea has been approximately 0.3 times a year. The spatial risk of the coast varies more dramatically than a marine area, depending on its morphology, wave energy on the shoreline, and social, economic, and environment importance [36]. In the Bohai Sea, the most affected areas are the central basin and Bohai Bay, and the coastlines most frequently hit are around Bohai Bay. The marine area in China consists of the North Sea, East Sea, and South Sea. In each sea area, the risk types are oil tanker accidents, pipe accidents, and platform accidents. The east side of Liaodong Bay in the Bohai Sea is more susceptible to attacks than the west. Adjacent offshore oil fields can bring quite different levels of risk, due to platform quantity variances and complex oil spill trajectories. The hydrodynamic and meteorological conditions as well as critical factors determining the risk map pattern reduce the risk of contamination of Laizhou Bay, which has high environmental vulnerability. Liu et al. [33] identified high-risk zones for the Bohai Sea, using empirical methods based on historical accident data.

4.2. Ecological Effect and Uncertainties

The oil industry has contributed to local economic growth. The coastal oil transportation increment, also, causes accident risk, which may lead to injury as well as economic and environmental problems. An oil spill on surface water spreads gradually, becomes dissolved in water, and may oxidize and, ultimately, sink to the bottom. Several factors can affect the likelihood of an oil spill: human operation error, type of drilling rigs, timing of exploration, environmental loading, properties of the seabed, and offshore oil drilling activities [23]. Asian countries are more vulnerable to coastal oil spills, due to the high population density and increasing reliance on fisheries and coastal tourism. The growing density of ships and tankers located in high-sensitivity and vulnerable protected coastal areas broadens the likelihood of marine oil spill accidents, which may, severely, cause marine environment damages [18,37]. The average oil spill amounts decreased from 1194 t in the 1970s to 312 t in the 21st century, which is beneficial to the improvements of ship navigation conditions. Spilled petroleum, ultimately, reaches the intertidal zone and accumulates in the mud and sand of the intertidal zone, where it remains for a long time and causes great harm to coastal creatures and plants. Crude oil is linked with toxic heavy metals, most of which contaminate the soil through underground deposits. Therefore, it is of the utmost importance to assess these damages and determine proper oil spill response approaches to prevent unpredicted accidents [5]. The uncertainty problem has a great importance in oil spill risk assessment because predicting the trajectory, fate, and effects of spills depends on many probabilistic variables [31]. The major contributors to uncertainty in oil spill models include the likelihood of leakage events, spilled oil behavior, extent of the impact, and vulnerability of the environment to crude oil pollution [15].

4.3. Policy Response

Human survival and well-being depend on marine and coastal ecosystem services; thus, they are also dependent on the management and conservation of those ecosystems. The response to eliminate an oil spill with the least impact on the coastal ecosystem is highly important. Therefore, response efforts and strategic planning are necessary after a spill occurs, including decision-making concerning the locations from which equipment will be dispatched, the optimal set of equipment required for a spill, and how long the equipment may be needed [20,38]. To minimize the detrimental impacts of oil spill incidents in the coastal ecosystem, detailed regulations for the arrangement and monitoring of all operations are required [5]. A stringent legal framework that supports and incorporates management strategies into a wider planning and policy framework is necessary. Previous modeling frameworks can account for oil types, spill rates, locations, and the interaction of the oil with the environment [4]. Neves et al. [31] presented a framework with a focus on the international risk management standard ISO 31000. Many impact evaluation frameworks are not structured to explore the nuances of spill scenarios, including their potential spatiotemporal variability [17].
Priority should be given to the strategic elements of the oil spill response, focusing, primarily, on where to locate adequate resources, including the emergency bases, ships, and other equipment needed to respond effectively to oil spills [24,39]. Appropriate emergency surveillance response measures, considering the spatiotemporal variability of the spills mechanism to provide information on hazard identification, vulnerability analysis, risk assessment, and response actions, must be carefully outlined. It is necessary to establish a ship malfunction hazard response center, which would coordinate the emergency response and clean-up of marine pollution, shipwreck cargo, and residual and released oil. Transnational arrangements and substantial international assistance regarding mitigation, restoration, and adaptation tools are necessary to reduce the negative socioenvironmental consequences of this extensive oil-spill disaster. Ferraro and Pavliha [40] reviewed extensive international conventions related to the monitoring and intervention of ship-sourced oil spills. National and international regulations that affect maritime transportation have been established, such as the International Convention for the Prevention of Pollution from Ships and Oil Pollution Act of 1990 (OPA). In order to mitigate the environmental impact of oil spills, the Chinese government has formulated the “National Major Marine Oil Spill Emergency Response Capacity Building Plan (2015–2020)”, which has strengthened the capabilities of comprehensive monitoring, oil spill recovery and disposal, and emergency response teams, which had achieved some success. In March 2022, the Ministry of Transport of China issued the “National Major Marine Oil Spill Response Capability Development Plan (2021–2035)”, which will further promote oil spill prevention and control in coastal China.

5. Conclusions

Maritime transportation, which has economic and environmental advantages over other transportation types, is one of the most preferred ways for intercontinental mass goods transportation. Growing global demand for oil and gas is, also, driving the advance of exploration and production operations into coastal and offshore areas of the country. Oil spills in the marine environment are an issue of concern, and, although the number of large oil spills has decreased during the past decade, small and operational spills are still very common and growing in frequency, due to increasing oil demand on a global basis. Spatial and temporal information allows users and decision-makers to evaluate the major risk status of oil spills and to take appropriate measures in a timely manner. The results show that the highest risk of ship oil spill accidents is in the Bohai Sea, Yangtze River estuary, and Pearl River estuary. The high-risk area for oil storage tankers is in the oil storage and petroleum chemical bases at Tianjin Port and Dalian Port. The average oil spill risk index of a high-risk area is the greatest in the Bohai Sea. We have also identified the location of highly-sensitive coastal areas, and calculated the oil spill environmental risk index. The higher oil spill environmental pollution risk concentration zones are in the Bohai Sea, inter-border area between the Yellow Sea and Bohai Sea, the Yangtze River Delta, the Pearl River Delta, and south of the Taiwan Strait. The percentage of high-risk area is the greatest (23.5%) in Tianjin, while the environmental risk grade of oil spill accidents of Hainan Province is the lowest. These results highlight the implications and importance of environmental monitoring for the frequency of oil spills. Future research should focus on the degree and effects of environmental contamination, along with the environmental toxicity of oil and its residues.

Author Contributions

Conceptualization, H.X. and G.Z.; methodology, L.Z.; software, N.M. and G.Z.; validation, J.C.; writing—original draft preparation, G.Z. and Z.X.; writing—review and editing, Z.X. and N.W.; visualization, G.Z.; supervision, J.C.; funding acquisition, H.X. All authors have read and agreed to the published version of the manuscript.

Funding

This research was funded by the National Natural Science Foundation of China (No. 41861041, 41601105); the opening fund of Key Laboratory of Coastal Salt Marsh Ecosystems and Resources, Ministry of Natural Resources (KLCSMERMNR2021104); the China Scholarship Council (CSC No. 201708360067); and the National Key R&D Program Funded Project of China (No. 2020YFE0201500).

Institutional Review Board Statement

Not applicable.

Informed Consent Statement

Not applicable.

Data Availability Statement

The data presented in this study are available on request from the corresponding author.

Acknowledgments

We are thankful for the editor for the constructive comments, which have greatly improved the study. Jie Liu and Li Lei at the Transport Planning and Research Institute, Ministry of Transport of the People’s Republic of China, also provided useful comments during field survey and research implementation.

Conflicts of Interest

The authors declare no conflict of interest.

References

  1. Chen, Q.; Bao, B.; Li, Y.; Liu, M.; Zhu, B.; Mu, J.; Chen, Z. Effects of marine oil pollution on microbial diversity in coastal waters and stimulating indigenous microorganism bioremediation with nutrients. Reg. Stud. Mar. Sci. 2020, 39, 101395. [Google Scholar] [CrossRef]
  2. International Tanker Owners Pollution Federation Limited (ITOPF). Oil Tanker Spill Statistics 2019. 2020. Available online: https://www.itopf.org/news-events/news/2019-oil-tanker-spill-statistics-published/ (accessed on 10 January 2020).
  3. Fan, C.; Hsu, C.-J.; Lin, J.-Y.; Kuan, Y.-K.; Yang, C.-C.; Liu, J.-H.; Yeh, J.-H. Taiwan’s legal framework for marine pollution control and responses to marine oil spills and its implementation on T.S. Taipei cargo shipwreck salvage. Mar. Pollut. Bull. 2018, 136, 84–91. [Google Scholar] [CrossRef]
  4. Guo, W. Development of a statistical oil spill model for risk assessment. Environ. Pollut. 2017, 230, 945–953. [Google Scholar] [CrossRef] [PubMed]
  5. Wang, D.; Guo, W.; Kong, S.; Xu, T. Estimating offshore exposure to oil spill impacts based on a statistical forecast model. Mar. Pollut. Bull. 2020, 156, 111213. [Google Scholar] [CrossRef]
  6. Amir-Heidari, P.; Raie, M. Probabilistic risk assessment of oil spill from offshore oil wells in Persian Gulf. Mar. Pollut. Bull. 2018, 136, 291–299. [Google Scholar] [CrossRef]
  7. Kang, J.; Zhang, J.; Bai, Y. Modeling and evaluation of the oil-spill emergency response capability based on linguistic variables. Mar. Pollut. Bull. 2016, 113, 293–301. [Google Scholar] [CrossRef]
  8. Mokhtari, S.; Hosseini, S.M.; Danehkar, A.; Azad, M.T.; Kadlec, J.; Jolma, A.; Naimi, B. Inferring spatial distribution of oil spill risks from proxies: Case study in the north of the Persian Gulf. Ocean Coast. Manag. 2015, 116, 504–511. [Google Scholar] [CrossRef]
  9. Lamine, S.; Xiong, D. Guinean environmental impact potential risks assessment of oil spills simulation. Ocean Eng. 2013, 66, 44–57. [Google Scholar] [CrossRef]
  10. Balogun, A.-L.; Yekeen, S.T.; Pradhan, B.; Wan Yusof, K.B. Oil spill trajectory modelling and environmental vulnerability mapping using GNOME model and GIS. Environ. Pollut. 2021, 268, 115812. [Google Scholar] [CrossRef]
  11. Burgherr, P. In-depth analysis of accidental oil spills from tankers in the context of global spill trends from all sources. J. Hazard. Mater. 2007, 140, 245–256. [Google Scholar] [CrossRef]
  12. Sun, S.; Lu, Y.; Liu, Y.; Wang, M.; Hu, C. Tracking an oil tanker collision and spilled oils in the East China Sea using multisensor day and night satellite imagery. Geophys. Res. Lett. 2018, 45, 3212–3220. [Google Scholar] [CrossRef]
  13. Li, P.; Cai, Q.; Lin, W.; Chen, B.; Zhang, B. Offshore oil spill response practices and emerging challenges. Mar. Pollut. Bull. 2016, 110, 6–27. [Google Scholar] [CrossRef]
  14. Balogun, A.-L.; Yekeen, S.T.; Pradhan, B.; Althuwaynee, O.F. Spatio-temporal analysis of oil spill impact and recovery pattern of coastal vegetation and wetland using multispectral satellite landsat 8-OLI imagery and machine learning models. Remote Sens. 2020, 12, 1225. [Google Scholar] [CrossRef] [Green Version]
  15. Qiao, F.; Wang, G.; Yin, L.; Zeng, K.; Zhang, Y.; Zhang, M.; Xiao, B.; Jiang, S.; Chen, H.; Chen, G. Modelling oil trajectories and potentially contaminated areas from the Sanchi oil spill. Sci. Total Environ. 2019, 685, 856–866. [Google Scholar] [CrossRef] [PubMed]
  16. Lee, M.; Jung, J.-Y.; Park, K.-C.; Choi, S.-H. Environmental and economic loss analyses of the oil discharge from shipwreck for salvage planning. Mar. Pollut. Bull. 2020, 155, 111142. [Google Scholar] [CrossRef]
  17. Nelson, J.R.; Grubesic, T.H. A spatiotemporal analysis of oil spill severity using a multi-criteria decision framework. Ocean Coast. Manag. 2021, 199, 105410. [Google Scholar] [CrossRef]
  18. Ko, J.-Y.; Day, J.W. A review of ecological impacts of oil and gas development on coastal ecosystems in the Mississippi Delta. Ocean Coast. Manag. 2004, 47, 597–623. [Google Scholar] [CrossRef]
  19. Xiao, C.L.; Jian, H.M.; Chen, L.F.; Liu, C.; Gao, H.Y.; Zhang, C.S.; Liang, S.K.; Li, Y.B. Toxic metal pollution in the Yellow Sea and Bohai Sea, China: Distribution, controlling factors and potential risk. Mar. Pollut. Bull. 2017, 119, 381–389. [Google Scholar] [CrossRef]
  20. Grubesic, T.; Wei, R.; Nelson, J. Protecting sensitive coastal areas with exclusion booms during oil spill events. Environ. Model. Assess. 2019, 24, 479–494. [Google Scholar] [CrossRef]
  21. Alves, T.M.; Kokinou, E.; Zodiatis, G.; Lardner, R.; Panagiotakis, C.; Radhakrishnan, H. Modelling of oil spills in confined maritime basins: The case for early response in the Eastern Mediterranean Sea. Environ. Pollut. 2015, 206, 390–399. [Google Scholar] [CrossRef] [Green Version]
  22. Santos, C.F.; Carvalho, R.; Andrade, F. Quantitative assessment of the differential coastal vulnerability associated to oil spills. J. Coast. Conserv. 2013, 17, 25–36. [Google Scholar] [CrossRef]
  23. Guo, W.; Zhang, S.; Wu, G. Quantitative oil spill risk from offshore fields in the Bohai Sea, China. Sci. Total Environ. 2019, 688, 494–504. [Google Scholar] [CrossRef] [PubMed]
  24. Spaulding, M.L. State of the art review and future directions in oil spill modeling. Mar. Pollut. Bull. 2017, 115, 7–19. [Google Scholar] [CrossRef] [PubMed]
  25. Depellegrin, D.; Pereira, P. Assessing oil spill sensitivity in unsheltered coastal environments: A case study for Lithuanian-Russian coasts, south-eastern Baltic Sea. Mar. Pollut. Bull. 2016, 102, 44–57. [Google Scholar] [CrossRef] [PubMed]
  26. Olita, A.; Cucco, A.; Simeone, S.; Ribotti, A.; Fazioli, L.; Sorgente, B.; Sorgente, R. Oil spill hazard and risk assessment for the shorelines of a Mediterranean coastal archipelago. Ocean Coast. Manag. 2012, 57, 44–52. [Google Scholar] [CrossRef]
  27. Nelson, J.R.; Grubesic, T.H.; Sim, L.; Rose, K.; Graham, J. Approach for assessing coastal vulnerability to oil spills for prevention and readiness using GIS and the blowout and spill occurrence model. Ocean Coast. Manag. 2015, 112, 1–11. [Google Scholar] [CrossRef] [Green Version]
  28. Denner, K.; Phillips, M.R.; Jenkins, R.E.; Thomas, T. A coastal vulnerability and environmental risk assessment of Loughor Estuary, South Wales. Ocean Coast. Manag. 2015, 116, 478–490. [Google Scholar] [CrossRef]
  29. Chiri, H.; Abascal, A.J.; Castanedo, S.; Medina, R. Mid-long term oil spill forecast based on logistic regression modelling of met-ocean forcings. Mar. Pollut. Bull. 2019, 146, 962–976. [Google Scholar] [CrossRef]
  30. Vasconcelos, R.N.; Lima, A.T.C.; Lentini, C.A.D.; Miranda, G.V.; Mendonça, L.F.; Silva, M.A.; Cambuí, E.C.B.; Lopes, J.M.; Porsani, M.J. Oil spill detection and mapping: A 50-year bibliometric analysis. Remote Sens. 2020, 12, 3647. [Google Scholar] [CrossRef]
  31. Neves, A.A.S.; Pinardi, N.; Martins, F.; Janeiro, J.; Samaras, A.; Zodiatis, G.; De Dominicis, M. Towards a common oil spill risk assessment framework—Adapting ISO 31000 and addressing uncertainties. J. Environ. Manag. 2015, 159, 158–168. [Google Scholar] [CrossRef]
  32. Jolma, A.; Lehikoinen, A.; Helle, I.; Venesjärvi, R. A software system for assessing the spatially distributed ecological risk posed by oil shipping. Environ. Model. Softw. 2014, 61, 1–11. [Google Scholar] [CrossRef]
  33. Liu, X.; Meng, R.; Xing, Q.; Lou, M.; Chao, H.; Bing, L. Assessing oil spill risk in the Chinese Bohai Sea: A case study for both ship and platform related oil spills. Ocean Coast. Manag. 2015, 108, 140–146. [Google Scholar] [CrossRef]
  34. Singkran, N. Classifying risk zones by the impacts of oil spills in the coastal waters of Thailand. Mar. Pollut. Bull. 2013, 70, 34–43. [Google Scholar] [CrossRef] [PubMed]
  35. Goldman, R.; Biton, E.; Brokovich, E.; Kark, S.; Levin, N. Oil spill contamination probability in the southeastern Levantine basin. Mar. Pollut. Bull. 2015, 91, 347–356. [Google Scholar] [CrossRef] [PubMed] [Green Version]
  36. Yu, F.J.; Xue, S.Y.; Zhao, Y.; Chen, G. Risk assessment of oil spills in the Chinese Bohai Sea for prevention and readiness. Mar. Pollut. Bull. 2018, 135, 915–922. [Google Scholar] [CrossRef]
  37. Beyer, J.; Trannum, H.C.; Bakke, T.; Hodson, P.V.; Collier, T.K. Environmental effects of the Deepwater Horizon oil spill: A review. Mar. Pollut. Bull. 2016, 110, 28–51. [Google Scholar] [CrossRef] [PubMed] [Green Version]
  38. Azevedo, A.; Fortunato, A.B.; Epifânio, B.; den Boer, S.; Oliveira, E.R.; Alves, F.L.; de Jesus, G.; Gomes, J.L.; Oliveira, A. An oil risk management system based on high-resolution hazard and vulnerability calculations. Ocean Coast. Manag. 2017, 136, 1–18. [Google Scholar] [CrossRef] [Green Version]
  39. Ndungu, K.; Beylich, B.A.; Staalstrøm, A.; Øxnevad, S.; Berge, J.A.; Braaten, H.F.V.; Schaanning, M.; Bergstrøm, R. Petroleum oil and mercury pollution from shipwrecks in Norwegian coastal waters. Sci. Total Environ. 2017, 593–594, 624–633. [Google Scholar] [CrossRef]
  40. Ferraro, G.; Pavliha, M. The European and International legal framework on monitoring and response to oil pollution from ships. J. Environ. Monit. 2010, 12, 574–580. [Google Scholar] [CrossRef]
Figure 1. Statistics of oil spill accidents over 50 t in coastal areas of China from 1973 to 2013.
Sustainability 14 05837 g001
Figure 2. Computation flow of the ship oil spill accidents risk index.
Sustainability 14 05837 g002
Figure 3. The flow chart of oil spill accident risks of oil tanks/submarine pipelines/oil platforms in coastal China.
Sustainability 14 05837 g003
Figure 4. Oil spill accident risk distribution in 2013. The highest risk of oil ship spill accidents is located in the Bohai Sea Rim, and the risk index shows an obvious spatial difference.
Sustainability 14 05837 g004
Figure 5. Oil spill environmental pollution risk distribution in 2013. Note: The number are the high oil spill environmental risk concentration zones. 1 is the Bohai Sea; 2 is inter-border area between the Yellow Sea and Bohai Sea; 3 is the Yangtze River estuary; 4 is south of the Taiwan Strait; and 5 is the Pearl River estuary.
Sustainability 14 05837 g005
Table 1. The sensitive objects assignment values in coastal areas.
TypesSensitive ObjectsAssignment ValueExplanation
Environmental sensitive objectsNational natural reserves100
Provincial natural reserves70
National aquatic resources reserves60
County natural reserves40
Spawning areas30
Migration pathway of animals20
Social sensitive objectsPopulation density of county10, 20, 30, 40, 50The population density is divided into five levels.
Political sensitive objectsAdjacent water area between two countries or regions70The adjacent water area with neighboring countries and Hong Kong, Macao, and Taiwan.
OthersCommon water areas5
Table 2. Oil spill pollution risk grade.
Risk GradesOil Spill Pollution Risk Index
Low-risk areas0–0.01
Relatively low-risk areas0.01–0.1
Mediate-risk areas0.1–1
Relatively high-risk areas1–10
High-risk areas10–1229
Table 3. Risk area percentages of different grades in coastal areas of China.
ProvinceLow RiskRelatively Low RiskMediate RiskRelatively High RiskHigh Risk
Fujian38.026.931.83.40.0
Guangdong48.528.015.36.81.4
Guangxi41.328.323.96.50.0
Hainan62.032.34.90.50.2
Hebei3.212.938.729.016.1
Jiangsu31.657.98.62.00.0
Liaoning28.420.022.122.17.4
Shandong13.626.836.616.46.6
Shanghai37.745.913.21.91.3
Tianjin2.911.820.641.223.5
Zhejiang25.836.732.44.01.1
Table 4. High risk area grid status.
No.Name of High-Risk ZoneArea (km2)Average Risk Value
1Bohai Sea36,01832.23
2Inter-border area between the Yellow Sea and Bohai Sea19,34319.79
3Yangtze River estuary15,3417.99
4South of the Taiwan Strait19,3431.71
5Pearl River estuary14,00710.93
Publisher’s Note: MDPI stays neutral with regard to jurisdictional claims in published maps and institutional affiliations.

