Article

An Analysis of Land-Use Conflict Potential Based on the Perspective of Production–Living–Ecological Function

College of Earth Science, Jilin University, Changchun 130061, China
*
Author to whom correspondence should be addressed.
Sustainability 2022, 14(10), 5936; https://doi.org/10.3390/su14105936
Submission received: 1 April 2022 / Revised: 24 April 2022 / Accepted: 12 May 2022 / Published: 13 May 2022

Abstract

:
Under the influence of human activities, natural climate change and other factors, the function-folding phenomenon of land use has appeared in China. The conflict levels of different land-use functions has intensified. Based on the perspective of production–living–ecological function, we constructed a land-use function evaluation model by using a multi-criteria evaluation analysis (MCE) method. According to the different arrangement and combination of each function intensity of land units, we constructed an intensity diagnosis model of land-use function conflicts (LUFCs) and divided LUFCs into eight types and four stages. The LUFCs potential was calculated and divided into four ranks, represented by four types of LUFC potential zones. We selected western Jilin Province, a typical, ecologically fragile area in Northeast China, as an empirical analysis area. Empirical research showed that the production, living and ecological functions in western Jilin Province were at low, high and medium intensity levels, respectively, in 2020. The proportions of different LUFCs stages were 54.90%, 24.99%, 19.06% and 1.05%, respectively. The entire study area was basically at risk of potential conflicts, with the area’s proportions accounting for 17.50%, 40.75%, 24.55% and 17.20% from zones of low potential to extreme potential. The hot spots for LUFC potential were concentrated in the east and south of the central area, which were basically consistent with the hot spots’ aggregation areas of LUFCs. The models and indicators established in this research can better reflect the conflict associated with regional land use, which can provide reference for land space planning and management.

1. Introduction

Land-use conflicts (LUCs) refer to spatial competition and functional conflict caused by stakeholders in land use mode [1,2]. Their essence is the disharmony and imbalance of natural land quality and social and economic development demands [3]. There are various causes of LUCs. In addition to the conflict and competition between different land-use types and stakeholders [4,5], natural disasters [6,7], external characteristics of the land [8], and multi-functional use of the land will also lead to LUCs [9]. With the demand for social development and the progress of production capacity, the intensity of LUCs has become stronger [10]. This constitutes an obstacle to the sustainable development of the human living environment [3].
Compared with research that focuses on the characteristics of land itself, such as land-use-cover change, the research of LUCs can reflect the interaction and impact between human and land more directly [11,12]. At present, research on LUCs mainly focuses on the source of conflict [13], types of conflict [14,15,16], conflict identification [17,18,19], conflict intensity diagnosis [20,21], conflict evolution and driving factors analysis [22], and conflict management [23,24]. The identification of conflict is considered the most important content in the study of LUCs [25]. The types of LUCs mainly focus on the differences between conflicts, including the conflict between construction land and agricultural land [4,26], the conflict among different land-use functions [20,27], and the conflict among economic development, food security and ecological protection land [16,28]. The conflict intensity diagnosis pays more attention to the quantification of LUCs. It is the study of quantifying the specific use of land through indicators such as nature, location, and social economic policy, as well as through obtaining a comprehensive score of conflict intensity associated with excavated land use, which can more intuitively reflect the severity of LUCs [20].
The main research methods regarding LUCs include participatory mapping, game theory, the pressure–state–response (PSR) model, landscape ecological risk assessment and multi-criteria evaluation (MCE) [20]. Participatory mapping and game theory can help us comprehend the mechanism of LUCs and formulate targeted strategies [29,30,31,32]. This kind of qualitative analysis method has become an effective means to effectively identify and explore the evolution process and driving mechanism of LUCs. However, the difficulty in quantifying LUCs and the huge investigation workload make such measures difficult to be used in large-scale research [29,31]. The PSR model or its extended model can quantitatively evaluate LUCs through multiple relevant indicators [33]. It can evaluate the relative intensity of land use, but the evaluation content is not detailed enough to support the decision-making process. Based on the dynamic change of “complexity vulnerability” of a land system, landscape ecological risk assessments can carry out more detailed conflict identification and intensity diagnoses at the grid level; however, it often underestimates the importance of social and economic factors [21,34]. In contrast, MCE takes the land in a single grid as the unit, combined with natural, location, socio-economic and other indicators. It can overcome the limitations of the above methods so as to study the LUCs better [35,36,37].
With the realization of the equalization of land resource use and distribution, the essential conflict around land use will gradually decrease, while the conflict between different use functions will gradually increase [22]. When multiple land-use patterns overlap in space or time scale and cannot be coordinated, potential conflicts may occur [26], and conflicts may come from the differences of land-use elements or functions [38]. At first, relevant studies mainly involved a single land-use system, such as an agricultural system [39], a natural ecosystem [40], an urban land-use system, etc. [41,42]. After entering the 21st century, the Millennium Ecosystem Assessment (MEA) established a land-use function classification system of ecosystem service functions based on the relationship between the ecosystem and human wealth [43]. With the deepening of the research on land-use function conflicts (LUFCs), some scholars subdivided the land-use functions into regulation, habitat, production, information and carrying functions from the perspective of sustainability [44], while others divided the land-use functions into three categories: production, ecology and culture, including 15 specific functions [45,46]. The diversity of land function in the same unit makes the types of LUFCs complex and diverse, and the difference in function intensity between different units makes the strength of LUFCs different. Different evaluation models have provided a rich perspective for the study of LUFCs.
Production–living–ecological space is a theory put forward by the Chinese government in the strategy of ecological civilization construction, aiming at realizing sustainable utilization and focusing on the perspective of land multi-functional utilization [47]. It originated from the multi-function of agriculture and pays attention to the multi-functional utilization of land. According to the functional attributes of land, China’s land is divided into production space, living space and ecological space [48]. Production space is the basis for the operation of a regional land-use system [21], which refers to the land that can be used as the direct work object or the indirect carrier of product production [49]. It is the space that mainly provides places for agricultural farming, industrial production and commercial activities [50]. Living space is the ultimate purpose of the operation of a regional land-use system [21], which refers to the land with the functions of providing various spatial security, material security and spiritual security for human life [49]. It is the space for human activities to realize needs such as residence, consumption, entertainment, medical treatment and education [51,52]. Ecological space is the guarantee for the operation of a regional land-use system [21], which refers to land that can realize the basic ecological needs of mankind and has the ability to regulate, maintain and ensure the stability of regional ecological functions [53]. It is the space that undertakes the evolution of an ecosystem and maintains the natural conditions required for human survival [52].
In order to explore the level of production, living and ecological function, and diagnose the intensity of LUFCs in western Jilin Province, China, we constructed a production–living–ecological function evaluation model through MCE and an intensity diagnosis model of LUFCs. The potential of LUFCs was calculated by neighborhood analysis so that the further aggravation of LUFCs can be prevented early. A cold and hot spot analysis was used to reveal the spatial distribution characteristics of LUFCs so as to implement regional governance in areas with serious LUFC aggregation. In these ways, this research may not only provide a new perspective for the study of LUFCs, but also provide reference and basis for regional sustainable development and coordinated use of land function.

2. Materials and Methods

2.1. Study Area and Data Source

Western Jilin Province (121°38′~126°11′ E, 43°59′~46°18′ N) has a total area of about 4.67 × 10⁶ ha, accounting for 25.4% of the whole of Jilin Province (Figure 1). It is located in the north end of Liaohe plain, the east of Horqin prairie and the southwest of Songnen Plain. It includes ten county-level administrative regions: Baicheng district, Songyuan, Da’an City, Qianguo County (Mongolian Autonomous County of Qian Gorlos), Qian’an County, Fuyu District, Taonan City, Tongyu County, Changling County and Zhenlai County. The terrain is vast and high in the northwest and low in the middle, slightly uplifted in the middle and south. As a semi-humid and semi-arid area, the annual precipitation in the study area is 300~500 mm, and the average relative humidity is 60~65%; the frost-free period is 140~160 D. In 2020, the total population in western Jilin Province reached 4.59 × 10⁶ people, with a regional GDP of 1.26 × 10³ million yuan. The total grain output reached 1.21 × 10⁷ tons, and the total meat output reached 3.82 × 10⁵ tons. As a national grain warehouse, the demand of grain output and economic development has brought great pressure to the region. The contradiction between the demand for construction land and cultivated land protection has become more and more obvious, and the conflict between different land-use functions has grown more and more prominent.
Data types include remote sensing image interpretation data, DEM elevation data, vectorization data of roads and main rivers, geographic coordinate points of interest data (POI) and socio-economic data in western Jilin Province in 2020 (Table 1). In order to obtain research data on land classes, patch characteristics, distance to specific land classes etc., we downloaded remote sensing image interpretation data from the Resources and Environmental Science and Data Center (https://www.resdc.cn (accessed on 15 June 2021)). DEM elevation data were downloaded from the Geospatial data cloud (gscloud.cn (accessed on 11 November 2021)) for obtaining slope and aspect data. Vectorization data of roads and main rivers were extracted from national land use survey data downloaded from the Geographic Situation Monitoring cloud platform (http://www.dsac.cn ((accessed on 17 June 2021)). They characterize the extent of accessible human activities and ecologically critical areas. The POI data of medical and educational facilities were extracted from Baidu map geographic coordinate device for the evaluation of living functions. Socio-economic data can be downloaded from the Statistical Yearbook of Jilin Province (2021) (http://tjj.jl.gov.cn/tjsj/tjnj/2021/ (accessed on 1 March 2022)). This was used to characterize regional economic development and to provide data support for research at the socio-economic level.
The data processing was as follows. Firstly, according to the “National land use/cover classification system for ecological remote sensing monitoring”, it was confirmed that there were 21 land-use types in the study area, and their names and numbers were: paddy field (11), dry land (12), forest land (21), shrub forest (22), open woodland (23), other forest land (24), high coverage grassland (31), medium coverage grassland (32), low coverage grassland (33), canal (41), lake (42), reservoir and pond (43), beach land (46), urban land (51), rural residential areas (52), other construction land (53), sandy land (61), saline alkali land (63), swamp land (64), bare land (65) and bare rock land (66) [54]. Secondly, a 100 m × 100 m fishing net was used to intersect with the remerged maps to form 4,672,721 evaluation units, which can ensure the consistency and accurately reflect the micro-scale effect of land use.

2.2. Research Framework

From the perspective of production–living–ecological function, the LUFCs are caused by the disharmony of production, living and ecological functions in the region. If the demand of a certain function is not met, LUFCs may occur. This research constructed the function evaluation models by MCE, evaluated each function strength in combination with remote sensing image data, terrain data, vectorized data, geographic coordinate data and socio-economic data, calculated the comprehensive score, and divided the function strength of production, living and ecological into three levels, strong, medium and weak, through the natural breakpoint method. The LUFCs strength were identified and diagnosed by comparing the strength of different functions in the same unit. The LUFCs were divided into eight types and four stages. A cold and hot spot analysis was used to identify the spatial relationship of different conflict types. Neighborhood analysis was used to calculate the potential of LUFCs. Finally, according to the conclusions of these analysis, combined with the natural, social and economic conditions of the study area, we put forward targeted governance strategies for regions in different conflict stages.

2.3. Construction of Land-Use Function Evaluation Model

2.3.1. Selection of Land-Use Function Evaluation Index

LUFCs are the result of the comprehensive action of various factors. We selected indicators from natural, location and social factors to construct the evaluation model of production, living and ecological functions. Land-use type was selected as the fundamental natural index, slope and aspect were selected as the natural index of production and living function evaluation model, and patch edge density was selected as the natural index of ecological function evaluation model. We selected the distance from national road, provincial road, county road, township road and water body as the basic location factor index of production, living and ecological function evaluation models. Distances from Nenjiang and Songhua Rivers were selected and added into the ecological function evaluation model. The proportion of secondary industry, total meat output, sowing area and grain output were selected as the social factor indicators of the production function evaluation model. The distance from medical facilities, distance from educational facilities, total retail sales of social consumer goods and public financial expenditure were selected as the social factor indicators of the living function evaluation model. The forest coverage was selected as the social factor indicators of the ecological function evaluation model.
Patches that have internal homogeneity and can either diffuse or converge around areas are called “sources” [20]. For example, patches close to rural settlements and arable land are more likely to perform a productive function. Patches close to urban land are influenced by human activities and are likely to become targets of urban expansion and then perform living functions. Patches close to grasslands, forests and water bodies play an increasing role in the ecosystem due to environmental influences. Referring to the concept of “sources”, we selected paddy fields and dry lands with an area of more than 50,000 ha as the “production sources”, selected the largest patches of urban land and rural residential areas as the “living sources”, selected major rivers, reservoirs and ponds with an area larger than 20 ha and forests with an area larger than 300 ha as the “ecological sources”, and added them into the location factor indicators of production, living and ecological function evaluation model respectively.
The natural breakpoint method was used to deal with the location factor indexes and distance related indexes. The score of each unit was given according to the distance from the target. In the process of dealing with the natural related indicators, we learned from the existing achievements of other scholars, gave the score of each unit according to the functional characteristics of land use types and the unified evaluation standard of slope and aspect [20,36,55]. In the process of dealing with socio-economic related data indicators, we gave the corresponding index scores according to the difference between each index and its average value (Table 2).

2.3.2. Weight Calculation of Land-Use Function Evaluation Index

In this research, the entropy weight method was used to calculate the weight of indicators in each evaluation model, and the corresponding weight was determined according to the information entropy of each indicator [26]. The calculation steps are as follows:
First, arrange the data in each evaluation model in the data matrix X,
X = ( x i j ) m × n = [ x 11 x 12 x 1 n x 21 x 22 x 2 n x m 1 x m 2 x m n ] ,
where, xij is the initial value of the ith index of the jth function evaluation model (j = 1, 2, 3).
The second step is to standardize the initial data. Standardize each index so that the value of each index can be converted to the number between 0 and 1. The calculation formula is as follows:
Positive   index :   z i = ( x i M i n ( x i ) ) ( M a x ( x i ) M i n ( x i ) ) ,
Negative   index :   z i = 1 ( x i M i n ( x i ) ) ( M a x ( x i ) M i n ( x i ) ) ,
where, xij is the initial value of index i in jth evaluation models; zij is the standardized value of xij; Max(xi) and Min(xi) are the respective maximum and minimum values of index i in each function evaluation model.
The third step is to calculate the proportion of the average value of each index in the total of this index. The calculation formula is as follows:
p i j = z i j j = 1 n z i j ,
where, Zij is the standardized value of the ith index in the jth evaluation model.
The fourth step is to calculate the entropy of each index in each evaluation system. The calculation formula is as follows:
H i = k i = 1 n p i j l n p i j ,
where, n is the total number of observed values, representing the number of units, n = 4,672,721, k ≥ 0, k = 1/ln(n), Hi ≥ 0. When pij = 0, pijlnpij = 0.
The fifth step is to calculate the weight of each index and each criterion layer in each index system. The calculation formula is as follows:
Index   weight :   w i j = 1 H i i = 1 m ( 1 H i ) ;   ( 0 w i j 1 ) ,   i = 1 m w i j = 1
Criterion   layer   weight :   W v j = 1 H i v = 1 y ( 1 H i ) ;   ( 0 W v j 1 ) ,   v = 1 y W v j = 1 ,
where, wij is the weight of the ith index in the jth evaluation model, 1 − Hi is the deviation degree of the ith index, indicating the difference between the indexes of the evaluation unit, m is the number of evaluation indexes, Wvj is the weight of the vth criterion layer in the jth evaluation model, and y is the number of indexes in the factor layer.

2.3.3. Comprehensive Scoring of Land-Use Function Evaluation Model

Calculate the comprehensive score of each unit in each evaluation model. The calculation formula is as follows:
F i j = ( W v j · w i j · f i j ) ,
where, Fij represents the score of the ith evaluation unit in the jth evaluation model. The greater the value, the greater the corresponding functional intensity. Wvj and Wij are the weights of the criterion layer and the factor layer respectively, and Fij is the score of the index.

2.4. Identification and Intensity Diagnosis Model of LUFC Zones

The scores in each function model were divided into strong (S), medium (M) and weak (W) levels in descending order by using the natural breakpoint method. According to the division results, the scores for production, living and ecological functions were arranged and combined, and 27 kinds of composition relations were obtained. According to the commonness and difference of each constituent relationship, eight types of LUFCs zones were obtained (Table 3).
In addition, according to the existing research results, we introduced four stages used to describe the degree of LUFCs, namely the stable and controllable stage, basic controllable stage, basic out-of-control stage and serious out-of-control stage [20,27,30]. In this way, the intensity of LUFCs was divided into four levels for further analysis and discussion. At the stable and controllable stage, the conflict has not yet formed or is in the potential stage, which will not have a negative impact on regional land use; At the basic controllable stage, conflicts begin to form and gradually appear, but most of them are constructive conflicts rather than destructive conflicts. Only appropriate measures should be taken to regulate and try to avoid or reduce the negative impact of conflicts; In the basic out-of-control stage, the conflict broke out gradually, and the direction of land use transformation gradually lost control. Effective measures need to be taken to curb the conflict, otherwise the regional land use will gradually be unbalanced. At the stage of serious out-of-control, the conflict completely breaks out, which requires the intervention of various administrative, economic and legal measures, otherwise it may evolve from LUFCs to a conflict of social nature.

2.5. Spatial Relationship of Land-Use Function Conflicts

We used the method of cold and hot spot analysis to reflect the spatial relationship of LUFCs and conflict potential, obtained the distribution of “cold spots” and “hot spots”, and determine the agglomeration location of LUFCs and the LUFCs’ potential.
If there is a large difference in the level of conflict between adjacent units, the interference of adjacent units to the land use mode is stronger, which is likely to make the nearby units evolve into stronger conflict intensity [20]. Taking the “3 × 3” rectangular element as the range, the standard deviation of the central element can be obtained through the neighborhood analysis function of ArcGIS10.6, so as to judge the influence degree of the surrounding units on the central unit. The calculation formula is as follows:
δ i = i = 1 N ( x i x ¯ ) 2 N ,
where, δi represents the standard deviation of the ith unit, which means that the greater the conflict level difference between the surrounding unit and the central unit, the greater the conflict potential of the land-use function of the central unit, and the more likely it is to develop into a unit with higher conflict level. xi represents the conflict level of the central unit, which is replaced by the intensity of eight conflict areas (xi = 1, 2, 3, …, 8). The greater the value, the stronger the conflict intensity, x ¯ represents the average value of the conflict level of units in the range, and N is the number of units in the range (n = 2, 3, 4, …, 9).

3. Results

3.1. Spatial Distribution Characteristics of Land-Use Function Intensity

3.1.1. Spatial Distribution Characteristics of Production Function Intensity

The spatial agglomeration characteristics of production functions were obvious in 2020. The units with strong production functions were mainly concentrated in the southeast of the study area. The land-use types in these areas were mainly paddy fields and dry lands. These areas were also the areas with dense distributions of county roads and township roads, which made the nearby area transportation convenient. The units with weak production function were basically concentrated in the center and the west. Due to the poor traffic conditions in the west of the study area and a large number of land unsuitable for farming, the production function of this area was generally low (Figure 2a). The areas of strong, medium and weak production function units accounted for 9.43%, 24.77% and 66.07%, respectively, indicating that the entire production function of the region was at a low level in 2020. Among the units with strong and medium function levels, the areas of dry land accounted for 6.61% and 15.74%, respectively, indicating that dry land was the dominant land-use type for the production function. However, due to the limitations of regional climate conditions, distance from water bodies, roads and other regional conditions, 26.69% of the dry land production was evaluated to be at the weak level, indicating that the production function was not brought into full play (Table 4).

3.1.2. Spatial Distribution Characteristics of Living Function Intensity

The spatial agglomeration characteristics of living functions were significant, and the connectivity between units of different functional levels was good, forming two clusters with Songyuan District and Baicheng District as the core (Figure 2b). The areas with strong, medium and weak living functions accounted for 36.10%, 45.12% and 18.78% respectively. The entire living functions of the region were at a medium high level, 96.08% of urban land units and 68.11% of rural residential units were strong functional units. In addition, 21.38% of the strong functional units were dry land and 3.40% were paddy fields, indicating that urban land and rural residential areas were the dominant land types for living functions in 2020, and some cultivated lands were also part of the living function (Table 4).

3.1.3. Spatial Distribution Characteristics of Ecological Function Intensity

The spatial agglomeration characteristics of ecological functions were not as significant as production and living functions, and the spatial connectivity between units with different intensity levels was poor. The units with higher functional levels were mainly concentrated in the northern marginal, the western marginal areas and the east of the central field (Figure 2c). The northern marginal areas were close to the main rivers in the study area—Nenjiang River and Songhua River—while the western marginal areas and east of the central field were mostly large areas of forest. The units with weak functional levels were mainly concentrated in the marginal areas of the west, south and east. Most of the areas were urban land or rural residential areas with convenient transportation, which were the main areas of human activities. The areas of strong, medium and weak ecological function units accounted for 25.18%, 46.24% and 28.58%, respectively, indicating that the entire ecological function of the region was at a medium level in 2020. Among the units with a strong function level, 8.52% were dry land, 2.52% were swamp land, 2.19% and 2.11% were medium coverage grassland and high coverage grassland, 2.08% were saline alkali land, and 2.04% were forest land. Among the units with medium functional level, 22.83% were dry land and 8.38% were saline alkali land. This shows that, in addition to most forest land, grassland and some unused land (such as saline alkali land and swamp land) playing a strong ecological function, some dry lands also had an ecological function. According to Table 4, the level structure of production function units and ecological function units is relatively similar, indicating that there is a functional folding between them, and fierce LUFCs may occur in the study area.

3.2. Spatial Distribution Characteristics of LUFC Zones

Figure 3 was obtained according to the arrangement and combination relationship in Table 3. The results show that the triple function mild conflict zone, dual function mild conflict zone, and single function mild conflict zone were mainly concentrated in the north and south of the center of the study area, accounting for 54.90% of the total area, including 24.04% of dry land and 13.30% of saline alkali land. The rest, in descending order, were swamp land, medium coverage grassland, paddy field, high coverage grassland, rural residential areas, forest land, lake, low coverage grassland, open woodland, sandy land, shrub forest, other forest land, urban land, other construction land, canal, reservoir and pond, bare land and bare rock land. The conflict stage of such zones is stable and controllable. At this stage, land development and utilization level are low, and the functional requirements are relatively simple. The folding of unit functions occurs less, and the threat posed by conflict will not be dangerous.
The dual function moderate conflict and triple function moderate conflict zones were mainly concentrated in marginal areas in the west, north and east of the study area, accounting for 24.99% of the total area, including 13.33% of dry land and 1.69% of paddy field. The rest, in descending order, were saline alkali land, high coverage grassland, forest land, medium coverage grassland, rural residential areas, swamp land, lakes, shrub forest, beach land, reservoir and pond, low coverage grassland, urban land, other forest land, canal, sandy land, open woodland, other construction land, bare land and bare rock land. This kind of zone is the transition area between human activities and ecological protection. The conflict stage of such zones is basically at the controllable stage. At this stage, the probability of LUFCs increases gradually, but is still controllable.
The single function strong conflict and dual function strong conflict zones were mainly concentrated in the middle of the north of the study area, as well as the east and southeast, accounting for 19.06% of the total area, including 10.98% of dry land and 1.76% of paddy field. The rest, in descending order, were forest land, high coverage grassland, rural residential area, medium coverage grassland, lake, saline alkali land, swamp land, shrub forest, canal, beach land, urban land, open woodland, other forest land, reservoir and pond, low coverage grassland, other construction land, sandy land, bare land and bare rock land. Such zones are areas within or close to the scope of human daily activities. The conflict stage of such zones is basically at the out-of-control stage. At this stage, land use is significantly multi-functional. The production, living and ecological functions show obvious characteristics, and the competition of various functions in the same unit is fierce. The LUFCs in this stage are basically out-of-control.
The triple function violent conflict zone was mainly concentrated in the middle of the east of the study area, accounting for 1.05% of the total area, including 0.70% of dry land and 0.17% of paddy field. This kind of zone is not only a high-intensity area of production and living functions, but also a sensitive and fragile area of ecological functions. The violent and intense expression of the functions makes the confrontation between various functions particularly intense. Conflict will occur more and more frequently, and the conflicts at this stage are seriously out-of-control.

3.3. Spatial Relationship of Land-Use Function Conflicts Area

The hot spots of LUFCs were concentrated in the middle of the east, south and north of the study area, mainly in Da’an City, Qianguo County (Mongolian Autonomous County of Qian Gorlos) and Changling County. Complex socio-economic activities and convenient transportation facilities have made the diversified the modes of land use. Each function of each unit in the region has had a certain degree of play, which has led the region into a hot spot concentration area. Cold spots were mainly distributed in the west area, and mainly concentrated in Qian’an County, Taonan City, Tongyu County and Zhenlai County. Poor climate and soil conditions, as well as the remote geographical location and fragile ecosystem were the main reasons for the low concentration of LUFCs (Figure 4a).
The result of a neighborhood analysis shows that the entire area faced the risk of LUFCs, but not to a serious degree. The zones of low potential conflict, general potential conflict, high potential conflict and extreme potential conflict account for 17.50%, 40.75%, 24.55% and 17.20%, respectively. The extreme conflict potential areas were still concentrated in the middle of the east of the study area, indicating that strict spatial boundary control measures need to be implemented in the area as soon as possible. The influence of adjacent units needs to be blocked so that intensification of conflict will not arise (Figure 4b).
The cold and hot spots of each unit were analyzed based on LUFC potential. The results show that the hot spots of LUFC potential were concentrated in the middle of the eastern and southern areas of the study area (Figure 4c). This zone is not only a gathering area with high conflict level, but also area with high conflict potential. This further shows that the land use competition in this area was fierce, and that the conflict between different functions was particularly serious. The local government needs to quickly coordinate the production, living and ecological functions of the land in this area through reasonable means, reduce the conflict level and alleviate the pressure of conflict through the introduction of land policies or regional use control.

4. Discussion

In this research, we established a production–life–ecological function evaluation model and a diagnostic model of LUFCs intensity with reference to the mature methods of domestic LUFC-related studies [20], and selected western Jilin Province as a new study area. We hope to have provided targeted management strategies for different LUFC zones in western Jilin Province and policy recommendations for regional development by combining the findings of our team’s previous research on Jilin Province and different governance strategies for LUFCs at international and national levels.
Although the situation of LUFCs can present different characteristics depending on variables such as country, geography, climate, etc., the government, as the manager of the country, still plays an essential role in the governance process of LUFCs. At the international level, scholars have proposed approaches to governance strategies for LUFCs. In the study of spatial conflicts in the Bucharest metropolitan area, scholars have proposed mitigating conflicts by re-planning the siting distribution of different projects [2]. To some extent, rigid policy and legal constraints help deal with conflicts in unused land issues in Lusaka, Africa [4]. The government has added incentives related to the future sustainable development of the region as a means to manage land conflicts in the Sierra Madre de Chiapas, Mexico [19]. A conceptual contribution to the integrated consideration of conflicts has been presented in land use planning processes in Switzerland and Romania, focusing on expectations and means of negotiation for conflict prevention and management [56]. In a study of agricultural and environmental vulnerability in Romania, scholars have proposed mitigating regional land-use conflicts by enhancing public measures related to serving the best interests of citizens [39]. It is clear that although the types of LUFCs vary from region to region, timely government and regulatory interventions can play a crucial role in the effectiveness of their governance. Policy constraints and legal forces are indispensable for achieving better governance goals and results. However, the irrational use of policies can potentially escalate LUFCs to the social level and trigger unnecessary violence [32]. Thus, the selection of key populations and the control of policy intensity must be precise.
At the national level, scholars have proposed different management strategies in their studies regarding land-use conflicts in China for areas with low human activities, such as pastoral areas, ecologically degraded areas, ecologically diverse areas, and areas with high human activities, such as urban and peri-urban areas [9,12]. In pastoral areas, measures such as strengthening herders’ awareness of environmental protection and strictly limiting the amount of grazing have been suggested [3]. Areas with severe desertification should consider ecological restoration in the oasis–desert transition zone [9]. For areas with high biodiversity, the construction and management of nature reserves and national ecological parks should be adequate measures [27]. For urban and neighboring areas, the delineation of the fundamental farmland protection line, ecological protection line and urban expansion boundary line can effectively avoid land-use conflicts between agricultural land and construction land from a macro perspective to some extent [12,26]. From the micro perspective, scholars suggest more detailed measures. For example, implementing fallowing to grass or fallowing to the forest for arable land far from rural settlements or with low cultivation rates can also effectively mitigate land-use conflicts [27]. To avoid negative impacts on other land functions and further expansion of LUFCs, the sites selected for large constructive projects within urban areas should be considered carefully [20]. The implementation of these governance measures includes the delimitation of functional areas, land function protection in ecologically fragile areas, conflict mitigation in the process of urbanization, etc., which provides a reference for the governance scheme of these LUFCs.
In our team’s past research on the “production–living–ecological” space in Jilin Province, we have found that most of the production space in Jilin Province was concentrated in the western part, and there was a trend of an increasing area in recent years [57]. Compared with other regions in Jilin Province, the coupling of production, living and ecological functions is better in the western part of Jilin Province. This part of the conclusion is consistent with the conclusion of this research that the overall intensity of production, living and ecological functions in western Jilin Province is “low–high–medium”, with 79.89% of the areas in the initial stable stage of LUFCs and 1.05% in the serious out-of-control stage of LUFCs. By reviewing the policy documents of Jilin Province, it is found that development in the western region has been accompanied by supportive policies for agriculture and animal husbandry. Although industry has grown in recent years, the primary industry is still an essential component of the regional GDP. In order to ensure that the overall area of agricultural land is not significantly reduced by the encroachment of construction land in the urban expansion process, initiatives such as shaking up key industries, returning grass to farmland, and saline land management are being carried out in parallel. This explains why the overall production function in western Jilin province is low. The overall regional level of production function is temporarily at a low level because large areas of new arable land converted from grassland or saline land are not fully qualified for cultivation. The regional production capacity can be raised to a higher level through proper traffic planning in the future and the improvement of arable land quality after multiple rounds of cultivation. In addition to the interlocking agricultural and pastoral zones, western Jilin Province is also a typical ecologically fragile area [57]. In order to protect the sensitive ecological environment, the local government has taken various initiatives, such as bringing water from the Nengjiang River, which is at the border of Jilin Province, into the hinterland for agricultural irrigation and saline land management or ongoing reforestation projects for years to prevent wind and sand and improve the soil. A series of initiatives are likely to play an essential role in protecting the local ecosystem.
Based on the current status of governance in western Jilin Province and the results of our research, the governance strategies of LUFCs in different stages were discussed pertinently.

4.1. Stable and Controllable Stage

The zones at this stage include the triple function mild conflict zone, dual function mild conflict zone and single function mild conflict zone, accounting for 0.82%, 35.68% and 18.41% of the total area, which were mainly distributed in the low terrain areas of north, west and central areas. In essence, this stage is peaceful and secure. The extent of LUFCs is weak, and the production, living and ecological functions are balanced. If the area at this stage is not particularly affected by drastic impacts such as natural disasters, large-scale development projects and so on, the likelihood of further upgrading any LUFCs will be minimal. If such zones need to be managed or utilized, it is possible to take advantage of the stronger functions of the range unit and use them in a simple way, such as small-scale farming, a slight expansion of human life range and so on. If there is no intention to use the area, it is possible to designate a specific range of ecological nature reserves to reduce human activities and allow the ecosystem to evolve naturally. In this way, the self-regulating ability of the ecosystem can be enhanced, and the protection of the ecologically fragile areas in western Jilin Province will be achieved.

4.2. Basic Controllable Stage

The zones at this stage include the dual function moderate conflict zone and triple function moderate conflict zone, accounting for 20.13% and 4.86% of the total area, which were mainly distributed in the east and north, and also the marginal areas of south and west. In essence, this stage is full of potential and possibilities. The slightly dominant function of this stage of the units has increased compared with the stable and controllable stage. Therefore, slightly stronger management measures and more diverse management methods will also be applied. The improvement of the function level must be accompanied by the increase of the evaluation index score, whether it is the change of natural, locational or social indexes, which represents the units that have a better performance in production, living or ecological functions.
On the other hand, the basic controllable stage shows that it is not prone to develop any LUFCs with significant potential hazards, and moderate utilization of such zones with policy support and drive can maximize the function of the land. In areas where production and living functions are more prominent, the location will be closer to the main crop cultivation areas and human living areas. The government can choose a location with convenient transportation to set up processing plants for agricultural and sideline products, which can expand the advantages of the primary industry while saving transportation costs and enabling human beings to enjoy fresher agricultural and sideline products for the first time. In areas with more prominent living and ecological functions, the government can plan to create natural ecological protection resorts to maintain the ecological environment while maximizing the ecological and living functions of land units and promoting the development of tertiary industries. In areas with more prominent ecological and production functions, the government can appropriately increase the resources of farming inputs, create multi-species cultivation of agricultural products with the advantage of an ecological environment, expand the variety of agricultural products in the market and realize the horizontal development of the primary industry.

4.3. Basic Out-of-Control Stage

The zones at this stage include the single function strong conflict zone and dual function strong conflict zone, accounting for 9.40% and 9.66% of the total area, which were mainly distributed in the east, southeast and north-central regions, close to urban land and rural residential areas. Compared to the first two stages, the basic out-of-control stage represents a state that is not healthy anymore. Land units in this stage are facing the impact of LUFCs, and the incoherence and underutilization of multiple functions prevent the land from being fully utilized at the functional level. The governance tools for this phase change from those that were previously encouraged to those that are restricted. The policy attitude will also become more stringent. In the process of governance, the definition of the status of the “production–living–ecological space” function is followed, in which the production function is the basis, the living function is the purpose, and the ecological function is the guarantee [21]. The government must consider the regional characteristics of the ecologically fragile areas in western Jilin Province and make the protection of ecological functions the priority in such zones. Strong ecological protection policies must be introduced, and the ecological protection concept of management personnel in the region must also be strengthened. In addition, due to the spatially connected nature of land units, uncontrolled land in LUFCs can easily affect neighboring units. Therefore, in the process of land use, regional boundaries need to be strictly limited to guarantee that LUFCs do not spread further.

4.4. Serious Out-of-Control Stage

The zone at this stage is the triple function violent conflict zone, accounting for 1.05% of the total area. It was mainly distributed in the central and eastern part of the study area, concentrated in the urban hinterland. This stage is perilous. The production, living and ecological functions of the land have been greatly exploited, and the conflicts of land functions are particularly intense. For this stage of LUFCs, the government must take the strictest control measures and the most robust protection measures. Firstly, the minimum ecological function must be guaranteed; otherwise, the land will not be able to perform other functions without the most fundamental guarantee. Secondly, as the sensitive zones in the ecologically fragile zone, the collapse of any land unit may trigger a series of unpredictable consequences. These units are constantly threatening the ecological stability and balance of the whole area. Thankfully, the land at this stage only accounts for 1.05% of the total area in western Jilin Province, and the government can take timely measures to control the zone and curb its impact on the surrounding land. Production and living areas with “Green Ecology” as the primary orientation can be established in the form of points in the region to support the stability of the ecosystem. The expansion of construction land and land use that occupies ecological land or affects ecological safety should be strictly prohibited.

5. Conclusions

This research constructed a function evaluation model of production–living–ecological functions through MCE, and further constructed an intensity diagnosis model that can identify LUFCs through the arrangement and combination of the function evaluation results. We obtained the spatial distribution and spatial relationship of LUFCs and the LUFC potential of the study area by cold and hot spot analysis and neighborhood analysis. According to the research results, the following conclusions were drawn.
(1)
The production, living and ecological functions in western Jilin Province were at low, high and medium intensity level respectively in 2020. The areas of strong, medium and weak production levels accounted for 9.43%, 24.77% and 66.07%, respectively, and the units with strong levels were mainly concentrated in the southeast. The living function units formed two core clusters with Songyuan District and Baicheng District, and the areas of strong, medium and weak living levels accounted for 36.10%, 45.12% and 18.78% respectively. The areas of strong, medium and weak ecological levels accounted for 25.18%, 46.24% and 28.58%, respectively, and the units with strong levels were mainly concentrated in the north, western edge and east of central of the study area.
(2)
The proportions of the stable and controllable stage, basic controllable stage, basic out-of-control stage and serious out-of-control stage were 54.90%, 24.99%, 19.06% and 1.05%, respectively. Among these, the units at the basic out-of-control stage were mainly concentrated in the north, east and southeast of the study area. The units at the serious out-of-control stage were mainly concentrated in the central of east of the study area.
(3)
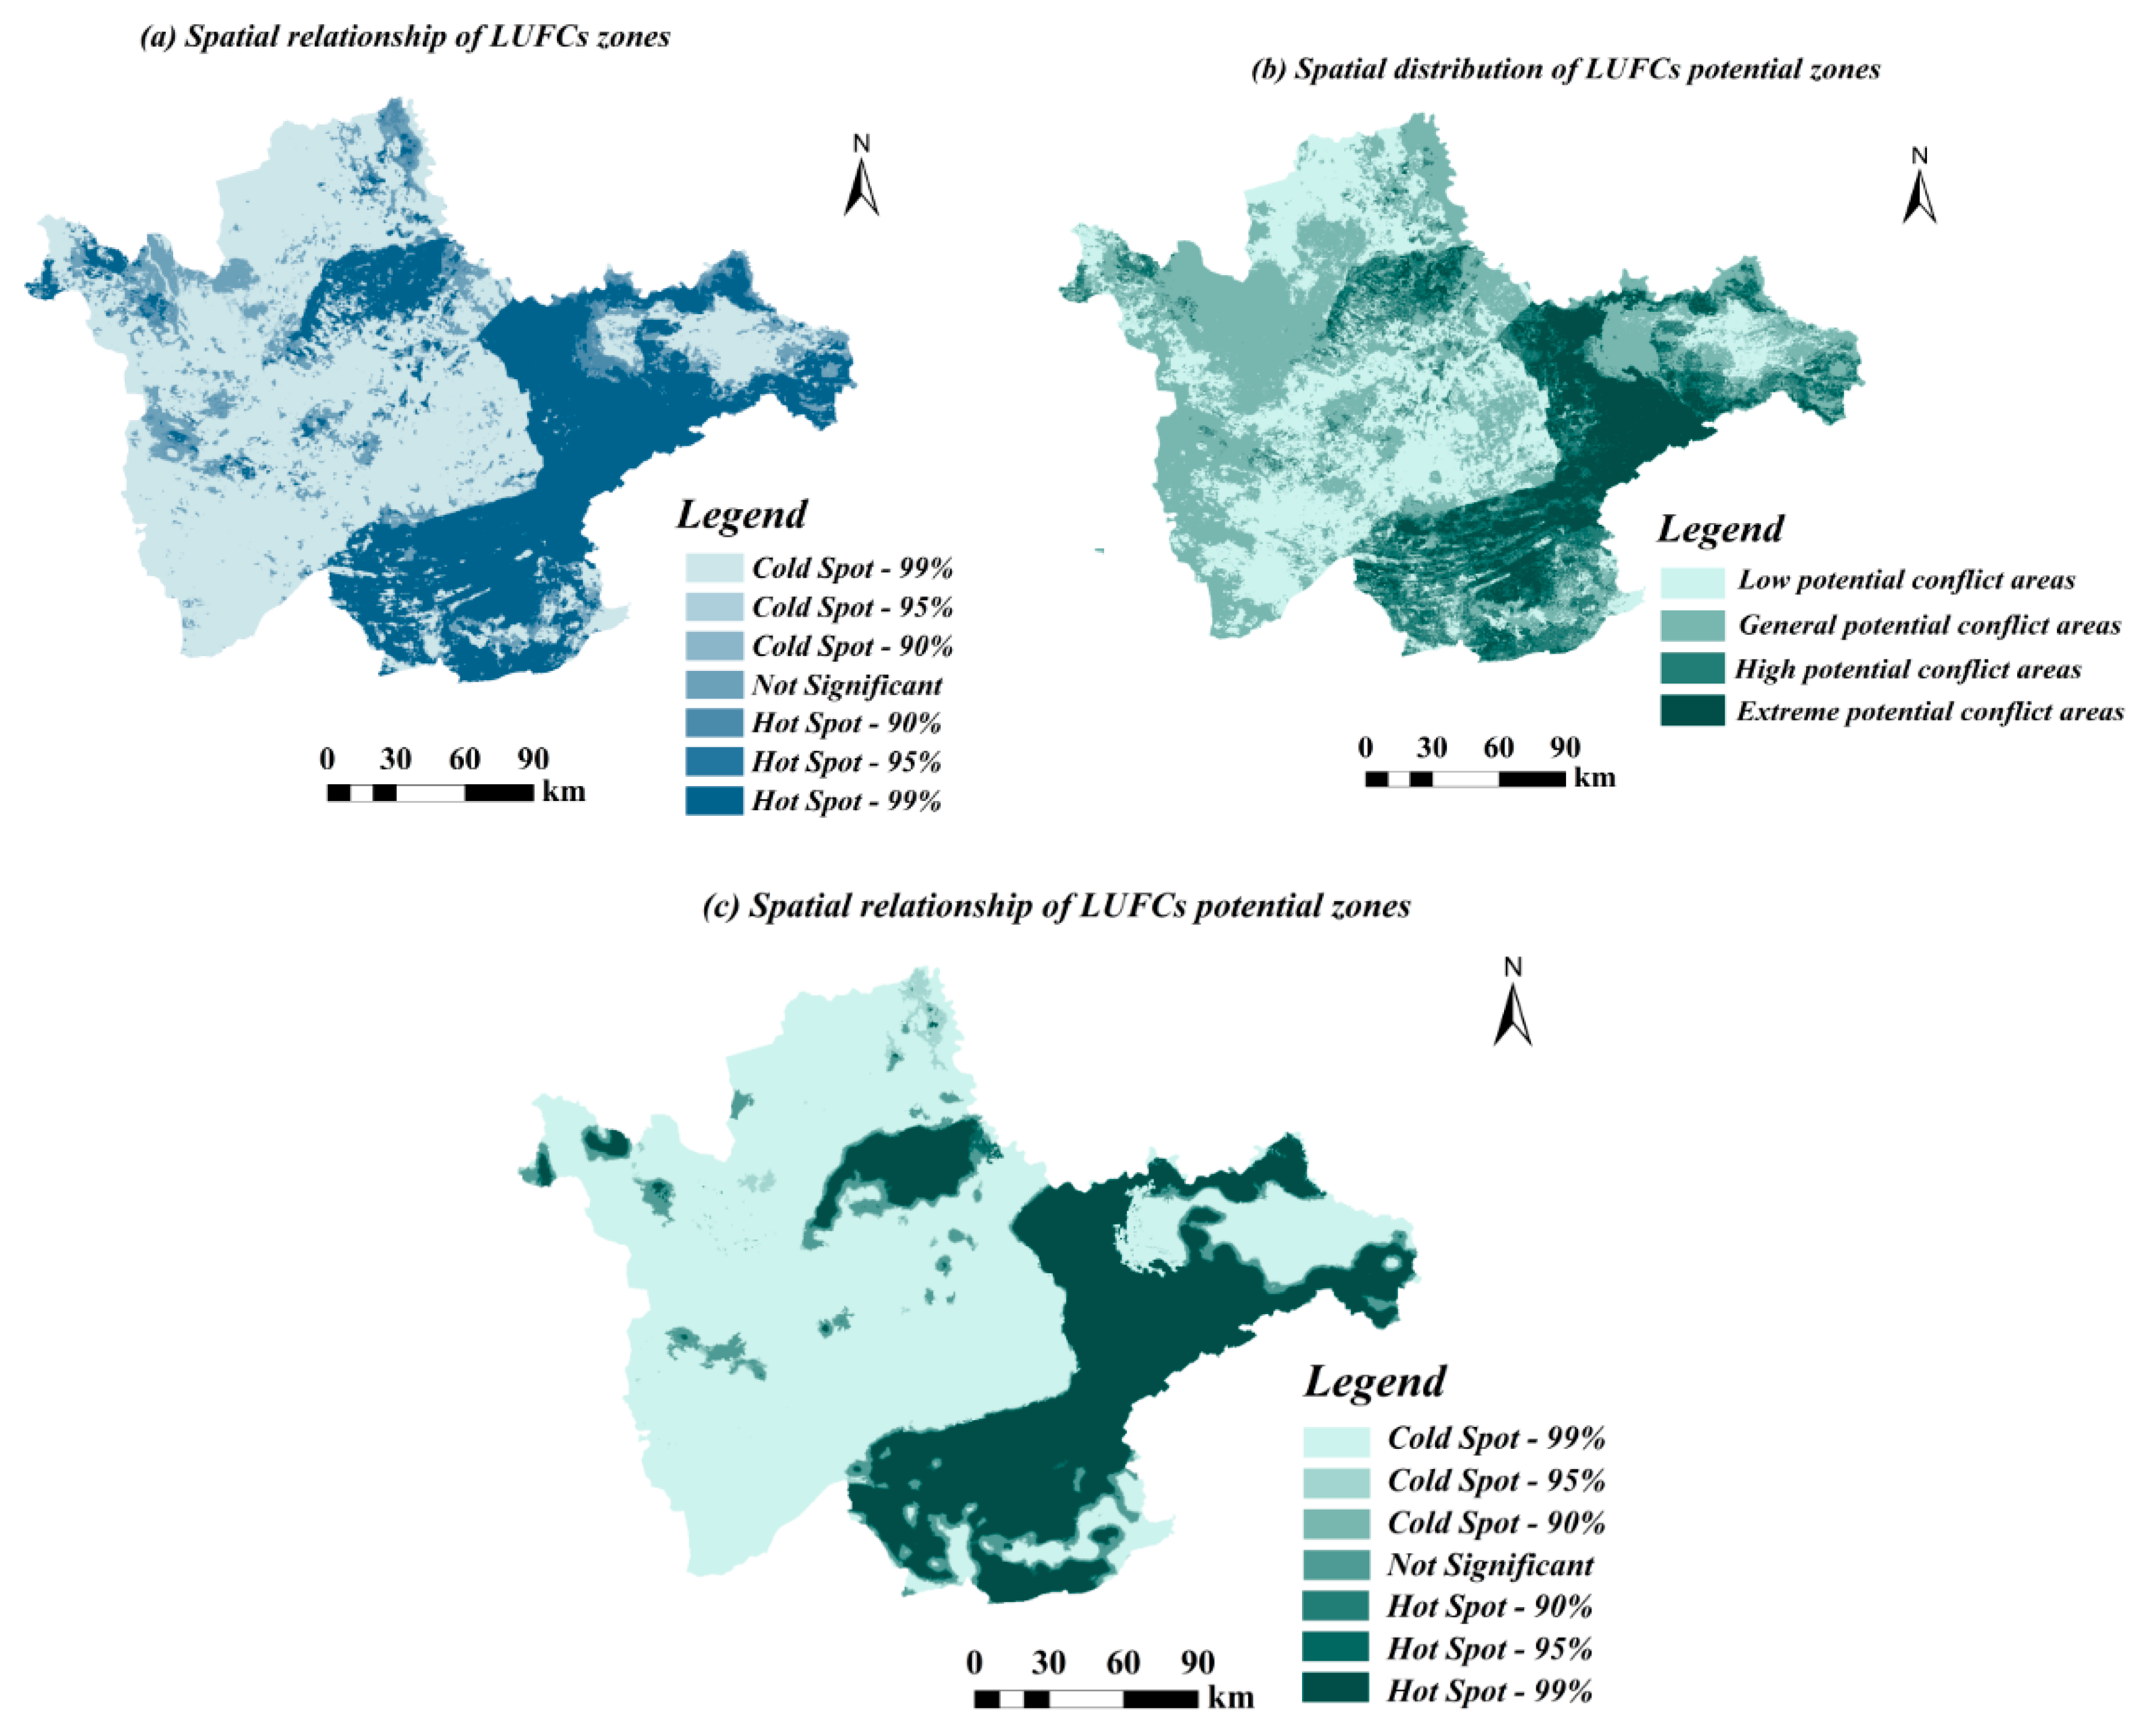
The hot spots for LUFCs were concentrated in the east-central, south and north of the study area, mainly in Da’an City, Qianguo County (Mongolian Autonomous County of Qian Gorlos) and Changling County. The cold spots were mainly distributed in the west of the study area, mainly in Qian’an County, Taonan City, Tongyu County and Zhenlai County.
(4)
The proportions of low potential conflict, general potential conflict, high potential conflict and extreme potential conflict areas were 17.50%, 40.75%, 24.55% and 17.20%, respectively. The units with extreme conflict potential were concentrated in the east-central area. The hot spots for LUFCs potential distribution were concentrated in the east-central and southern areas of the study area, which was consistent with the distribution of areas at the basic out-of-control and serious out-of-control stages.
Since western Jilin Province is a typical, ecologically fragile area, in future planning local governments should continue to grasp the key concept of “ecological function is the guarantee” to ensure the stable performance of ecological function as much as possible. It is necessary to control the strength of management and make targeted investments at different LUFC stages. This research presents the distribution characteristics of LUFCs and their potential for conflict through the selection of indicators in natural, regional, and social dimensions. The results can be used as a reference for policy formulation by disciplines and local governments. However, the research methodology for LUFCs is not unique. It may be more authoritative and enjoyable to adopt different research methods for the same study area and compare the results. Different choices of indicators may also lead to different results. These are all issues that our team will think about and address in future related studies in the field.

Author Contributions

Conceptualization, Z.C. and Y.Z.; methodology, Z.C. and X.W.; software, Z.C.; validation, Y.Z. and L.W. (Lanyi Wei); formal analysis, Z.C.; resources, L.W. (Lingzhi Wang); data curation, Z.C. and L.W. (Lanyi Wei); writing—original draft preparation, Z.C.; writing—review and editing, Y.Z. and L.W. (Lingzhi Wang); project administration, Y.Z.; funding acquisition, L.W. (Lingzhi Wang) and Y.Z. All authors have read and agreed to the published version of the manuscript.

Funding

This study was supported by Science and Technology Research Project of the Education Department of Jilin Province (JJKH20211131KJ) and National Natural Science Foundation of China (42101252).

Institutional Review Board Statement

Not applicable.

Informed Consent Statement

Not applicable.

Data Availability Statement

Not applicable.

Acknowledgments

Thank you to everyone who contributed to this study.

Conflicts of Interest

The authors declare no conflict of interest.

References

  1. Nantel, P.; Bouchard, A.; Brouillet, L.; Hay, S. Selection of areas for protecting rare plants with integration of land use conflicts: A case study for the west coast of Newfoundland, Canada. Biol. Conserv. 1998, 84, 223–234. [Google Scholar] [CrossRef]
  2. Ioja, C.I.; Niţă, M.R.; Vânău, G.O.; Onose, D.A.; Gavrilidis, A.A. Using multi-criteria analysis for the identification of spatial land-use conflicts in the Bucharest Metropolitan Area. Ecol. Indic. 2014, 42, 112–121. [Google Scholar] [CrossRef]
  3. Jiang, S.; Meng, J.; Zhu, L.; Cheng, H. Spatial-temporal pattern of land use conflict in China and its multilevel driving mechanisms. Sci. Total Environ. 2021, 801, 149697. [Google Scholar] [CrossRef] [PubMed]
  4. Chitonge, H.; Mfune, O. The urban land question in Africa: The case of urban land conflicts in the City of Lusaka, 100 years after its founding. Habitat Int. 2015, 48, 209–218. [Google Scholar] [CrossRef]
  5. Milczarek-Andrzejewska, D.; Zawalinska, K.; Czarnecki, A. Land-use conflicts and the Common Agricultural Policy: Evidence from Poland. Land Use Policy 2018, 73, 423–433. [Google Scholar] [CrossRef] [Green Version]
  6. Abdullah, A.Y.M.; Masrur, A.; Adnan, M.S.G.; Baky, M.A.A.; Hassan, Q.K.; Dewan, A. Spatio-temporal Patterns of Land Use/Land Cover Change in the Heterogeneous Coastal Region of Bangladesh between 1990 and 2017. Remote Sens. 2019, 11, 790. [Google Scholar] [CrossRef] [Green Version]
  7. Kiem, A.S.; Johnson, F.; Westra, S.; Van Dijk, A.; Evans, J.; O’Donnell, A.; Rouillard, A.; Barr, C.; Tyler, J.; Thyer, M.; et al. Natural hazards in Australia: Droughts. Clim. Chang. 2016, 139, 37–54. [Google Scholar] [CrossRef]
  8. Hilson, G. An overview of land use conflicts in mining communities. Land Use Policy 2002, 19, 65–73. [Google Scholar] [CrossRef]
  9. Zhou, D.; Lin, Z.; Lim, S.H. Spatial characteristics and risk factor identification for land use spatial conflicts in a rapid urbanization region in China. Environ. Monit. Assess. 2019, 191, 677. [Google Scholar] [CrossRef]
  10. Ma, W.; Jiang, G.; Chen, Y.; Qu, Y.; Zhou, T.; Li, W. How feasible is regional integration for reconciling land use conflicts across the urban–rural interface? Evidence from Beijing–Tianjin–Hebei metropolitan region in China. Land Use Policy 2020, 92, 104433. [Google Scholar] [CrossRef]
  11. Mannarini, T.; Roccato, M.; Russo, S. The false consensus effect: A trigger of radicalization in locally unwanted land uses conflicts? J. Environ. Psychol. 2015, 42, 76–81. [Google Scholar] [CrossRef]
  12. Yu, A.T.; Wu, Y.; Shen, J.; Zhang, X.; Shen, L.; Shan, L. The key causes of urban-rural conflict in China. Habitat Int. 2015, 49, 65–73. [Google Scholar] [CrossRef]
  13. Wehrmann, B. Land Conflicts: A Practical Guide to Dealing with Land Disputes; GTZ: Eschborn, Germany, 2008; ISBN 978-3-00-023940-3. [Google Scholar]
  14. Pavón, D.; Ventura, M.; Ribas, A.; Serra, P.; Saurí, D.; Breton, F. Land use change and socio-environmental conflict in the Alt Empordà county (Catalonia, Spain). J. Arid Environ. 2003, 54, 543–552. [Google Scholar] [CrossRef] [Green Version]
  15. Calvert, K.; Mabee, W. More solar farms or more bioenergy crops? Mapping and assessing potential land-use conflicts among renewable energy technologies in eastern Ontario, Canada. Appl. Geogr. 2015, 56, 209–221. [Google Scholar] [CrossRef]
  16. Yuan, Z.; Hu, Y.; Wang, J.; Ren, L. Analysis of Rural Land Use Change Based on Participatory Mapping: A Case Study of Dazhuanghu Village in Pinggu Distric, Beijing. Areal Res. Dev. 2013, 32, 138–143. [Google Scholar]
  17. de Groot, R. Function-analysis and valuation as a tool to assess land use conflicts in planning for sustainable, multi-functional landscapes. Landsc. Urban Plan. 2006, 75, 175–186. [Google Scholar] [CrossRef]
  18. Kim, I.; Arnhold, S. Mapping environmental land use conflict potentials and ecosystem services in agricultural watersheds. Sci. Total Environ. 2018, 630, 827–838. [Google Scholar] [CrossRef]
  19. Cortina-Villar, S.; Plascencia-Vargas, H.; Vaca, R.; Schroth, G.; Zepeda, Y.; Soto-Pinto, L.; Nahed-Toral, J. Resolving the Conflict Between Ecosystem Protection and Land Use in Protected Areas of the Sierra Madre de Chiapas, Mexico. Environ. Manag. 2012, 49, 649–662. [Google Scholar] [CrossRef]
  20. Zou, L.; Liu, Y.; Wang, J.; Yang, Y. An analysis of land use conflict potentials based on ecological-production-living function in the southeast coastal area of China. Ecol. Indic. 2021, 122, 107297. [Google Scholar] [CrossRef]
  21. Zhou, D.; Xu, J.; Lin, Z. Conflict or coordination? Assessing land use multi-functionalization using production-living-ecology analysis. Sci. Total Environ. 2017, 577, 136–147. [Google Scholar] [CrossRef]
  22. Zou, L.; Liu, Y.; Wang, J.; Yang, Y.; Wang, Y. Land use conflict identification and sustainable development scenario simulation on China’s southeast coast. J. Clean. Prod. 2019, 238, 117899. [Google Scholar] [CrossRef]
  23. Cieślak, I. Identification of areas exposed to land use conflict with the use of multiple-criteria decision-making methods. Land Use Policy 2019, 89, 104225. [Google Scholar] [CrossRef]
  24. Dadashpoor, H.; Ahani, S. Land tenure-related conflicts in peri-urban areas: A review. Land Use Policy 2019, 85, 218–229. [Google Scholar] [CrossRef]
  25. Adam, Y.O.; Pretzsch, J.; Darr, D. Land use conflicts in central Sudan: Perception and local coping mechanisms. Land Use Policy 2015, 42, 1–6. [Google Scholar] [CrossRef]
  26. Shan, L.; Yu, A.T.; Wu, Y. Strategies for risk management in urban–rural conflict: Two case studies of land acquisition in urbanising China. Habitat Int. 2017, 59, 90–100. [Google Scholar] [CrossRef]
  27. Zou, L.; Liu, Y.; Wang, Y. Research progress and prospect of land-use conflicts in China. Prog. Geogr. 2020, 39, 298–309. [Google Scholar] [CrossRef]
  28. Qi, X.; Fu, Y.; Wang, Y.; Ng, C.N.; Dang, H.; He, Y. Improving the sustainability of agricultural land use: An integrated framework for the conflict between food security and environmental deterioration. Appl. Geogr. 2018, 90, 214–223. [Google Scholar] [CrossRef]
  29. Fraser, E.D.; Dougill, A.J.; Mabee, W.E.; Reed, M.; McAlpine, P. Bottom up and top down: Analysis of participatory processes for sustainability indicator identification as a pathway to community empowerment and sustainable environmental management. J. Environ. Manag. 2006, 78, 114–127. [Google Scholar] [CrossRef]
  30. Jing, W.; Yu, K.; Wu, L.; Luo, P. Potential Land Use Conflict Identification Based on Improved Multi-Objective Suitability Evaluation. Remote Sens. 2021, 13, 2416. [Google Scholar] [CrossRef]
  31. Hui, E.C.M.; Bao, H. The logic behind conflicts in land acquisitions in contemporary China: A framework based upon game theory. Land Use Policy 2013, 30, 373–380. [Google Scholar] [CrossRef]
  32. Alston, L.J.; Libecap, G.D.; Mueller, B. Land Reform Policies, the Sources of Violent Conflict, and Implications for Deforestation in the Brazilian Amazon. J. Environ. Econ. Manag. 2000, 39, 162–188. [Google Scholar] [CrossRef]
  33. Yang, Y.; An, Q.; Zhu, L. Diagnosis Based on the PSR Model of Rural Land-Use Conflicts Intensity. Prog. Geogr. 2012, 31, 1552–1560. [Google Scholar]
  34. Peterseil, J.; Wrbka, T.; Plutzar, C.; Schmitzberger, I.; Kiss, A.; Szerencsits, E.; Reiter, K.; Schneider, W.; Suppan, F.; Beissmann, H. Evaluating the ecological sustainability of Austrian agricultural landscapes—the SINUS approach. Land Use Policy 2004, 21, 307–320. [Google Scholar] [CrossRef]
  35. Zhang, Y.; Li, A.; Fung, T. Using GIS and Multi-criteria Decision Analysis for Conflict Resolution in Land Use Planning. Procedia Environ. Sci. 2012, 13, 2264–2273. [Google Scholar] [CrossRef] [Green Version]
  36. Jiang, S.; Meng, J.; Zhu, L. Spatial and temporal analyses of potential land use conflict under the constraints of water resources in the middle reaches of the Heihe River. Land Use Policy 2020, 97, 104773. [Google Scholar] [CrossRef]
  37. Reyes-García, V.; Orta-Martínez, M.; Gueze, M.; Luz, A.C.; Paneque-Gálvez, J.; Macía, M.J.; Pino, J. Does participatory mapping increase conflicts? A randomized evaluation in the Bolivian Amazon. Appl. Geogr. 2012, 34, 650–658. [Google Scholar] [CrossRef]
  38. Reuveny, R.; Maxwell, J.W.; Davis, J. On conflict over natural resources. Ecol. Econ. 2011, 70, 698–712. [Google Scholar] [CrossRef]
  39. Petrescu-Mag, R.M.; Petrescu, D.C.; Azadi, H.; Petrescu-Mag, I.V. Agricultural land use conflict management—Vulnerabilities, law restrictions and negotiation frames. A wake-up call. Land Use Policy 2018, 76, 600–610. [Google Scholar] [CrossRef]
  40. Costanza, R.; d’Arge, R.; de Groot, R.; Farber, S.; Grasso, M.; Hannon, B.; Limburg, K.; Naeem, S.; O’Neill, R.V.; Paruelo, J.; et al. The value of the world’s ecosystem services and natural capital. Nature 1997, 387, 253–260. [Google Scholar] [CrossRef]
  41. Hamstead, Z.A.; Kremer, P.; Larondelle, N.; McPhearson, T.; Haase, D. Classification of the heterogeneous structure of urban landscapes (STURLA) as an indicator of landscape function applied to surface temperature in New York City. Ecol. Indic. 2016, 70, 574–585. [Google Scholar] [CrossRef]
  42. von der Dunk, A.; Grêt-Regamey, A.; Dalang, T.; Hersperger, A. Defining a typology of peri-urban land-use conflicts—A case study from Switzerland. Landsc. Urban. Plan. 2011, 101, 149–156. [Google Scholar] [CrossRef]
  43. Costanza, R.; De Groot, R.; Braat, L.; Kubiszewski, I.; Fioramonti, L.; Sutton, P.; Farber, S.; Grasso, M. Twenty years of ecosystem services: How far have we come and how far do we still need to go? Ecosyst. Serv. 2017, 28, 1–16. [Google Scholar] [CrossRef]
  44. De Groot, R.S.; Wilson, M.A.; Boumans, R.M.J. A typology for the classification, description and valuation of ecosystem functions, goods and services—ScienceDirect. Ecol. Econ. 2002, 41, 393–408. [Google Scholar] [CrossRef] [Green Version]
  45. Bradford, J.B.; D’Amato, A.W. Recognizing trade-offs in multi-objective land management. Front. Ecol. Environ. 2012, 10, 210–216. [Google Scholar] [CrossRef] [Green Version]
  46. Gulickx, M.; Verburg, P.; Stoorvogel, J.; Kok, K.; Veldkamp, T. Mapping landscape services: A case study in a multifunctional rural landscape in The Netherlands. Ecol. Indic. 2013, 24, 273–283. [Google Scholar] [CrossRef]
  47. Liu, D.; Ma, X.; Gong, J.; Li, H. Functional identification and spatio-temporal pattern analysis of production-living- ecological space in watershed scale: A case study of Bailongjiang Watershed in Gansu. Chin. J. Ecol. 2018, 37, 1490–1497. [Google Scholar] [CrossRef]
  48. Zhang, Y.; Long, H.; Ma, L.; Ge, D.; Tu, S.; Qu, Y. Spatio-temporal characteristics and dynamic mechanism of farmland functions evolution in the Huang-Huai-Hai Plain. J. Geogr. Sci. 2018, 28, 759–777. [Google Scholar] [CrossRef] [Green Version]
  49. Zhang, H.; Xu, E.; Zhu, H. An ecological-living-industrial land classification system and its spatial distribution in China. Resour. Sci. 2015, 37, 1332–1338. [Google Scholar]
  50. Huang, J.; Lin, H.; Qi, X. A literature review on optimization of spatial development pattern based on ecological-production-living space. Prog. Geogr. 2017, 36, 378–391. (In Chinese) [Google Scholar] [CrossRef] [Green Version]
  51. Jiang, M.; Liu, Y. Discussion on the concept definition and spatial boundary classification of “production-living-ecological” space. Urban Dev. Stud. 2020, 27, 43–48+61. [Google Scholar]
  52. Kong, D.-Y.; Chen, H.-G.; Wu, K.-S. The evolution of “Production-Living-Ecological” space, eco-environmental effects and its influencing factors in China. J. Nat. Resour. 2021, 36, 1116–1135. [Google Scholar] [CrossRef]
  53. Li, G.; Fang, C. Quantitative function identification and analysis of urban ecological-production-living spaces. Acta Geogr. Sin. 2016, 71, 49–65. [Google Scholar]
  54. National Land Use/Cover Classification System for Ecological Remote Sensing Monitoring. Available online: https://www.resdc.cn/data.aspx?DATAID=335 (accessed on 15 June 2021).
  55. Wang, J.; Yu, D.; Lu, Y.; Zhang, T.; Zheng, Y. Recognition and analysis of land use conflicts at country level based on “Production-Living-Ecological” suitability. J. Nat. Resour. 2021, 36, 14. [Google Scholar]
  56. Hersperger, A.M.; Ioja, C.; Steiner, F.; Tudor, C.A. Comprehensive Consideration of Conflicts in the Land-Use Planning Process: A Conceptual Contribution. Carpathian J. Earth Environ. Sci. 2015, 10, 5–13. [Google Scholar]
  57. Wei, L.; Zhang, Y.; Wang, L.; Mi, X.; Wu, X.; Cheng, Z. Spatiotemporal Evolution Patterns of “Production-Living-Ecological” Spaces and the Coordination Level and Optimization of the Functions in Jilin Province. Sustainability 2021, 13, 13192. [Google Scholar] [CrossRef]
Figure 1. The location of western Jilin Province.
Sustainability 14 05936 g001
Figure 2. Spatial distribution of production–living–ecological functional intensity of western Jilin.
Sustainability 14 05936 g002
Figure 3. Spatial distribution of land-use function conflicts zones in western Jilin.
Sustainability 14 05936 g003
Figure 4. Spatial relationship of LUFCs and LUFCs potential zones in western Jilin.
Sustainability 14 05936 g004
Table 1. Data of western Jilin in 2020.
Data TypesInvolved IndicatorsDate SourcesRemarks
Remote sensing image dataLand use type (LUT); Distance from urban land (DUL), rural residential area (DRA), water body (DWB); production source (DPS), living sources (DLS) and ecological source (DES); Edge density (ED)Downloaded from the Resources and Environmental Science and Data Center (https://www.resdc.cn (accessed on 15 June 2021))Based on the Landsat TM image of the United States, the data were generated through manual visual interpretation. The spatial resolution of the data is 30 m and the comprehensive accuracy is more than 90%. Distance datasets were calculated by the “Euclidean Distance” analysis function of ArcGIS10.6.
Terrain dataSlope (SLP); Aspect (APC)Downloaded from the Geospatial data cloud (https://www.gscloud.cn (accessed on 11 November 2021))Based on Aster GDEM global digital elevation model, the spatial resolution is 30 m. The slope and aspect of the divided units were calculated by the “Slope” and “Aspect” analysis functions of ArcGIS10.6.
Vectorized dataDistance from national roads (DNR), provincial roads (DPR), county roads (DCR) and township roads (DTR); Distance from major rivers (RIV)Downloaded from the Geographic Situation Monitoring cloud platform (http://www.dsac.cn (accessed on 17 June 2021))Based on the data extraction of national land use survey. Distance datasets were calculated by the “Euclidean Distance” analysis function of ArcGIS10.6.
Geographic coordinate dataDistance from medical facilities (DMF) and educational facilities (DEF)Extract from Baidu map geographic coordinate deviceConduct vector diagram and position calibration by ArcGIS10.6. Distance datasets were calculated by the “Euclidean Distance” analysis functions of ArcGIS10.6.
Socio economic dataProportion of secondary industry (PSI); Total meat output (TMO); Sown area (SNA); Total grain output (TGO); Forest coverage (FCE); Total retail sales of social consumer goods (TSG); Public financial expenditure (PFE)Statistical Yearbook of Jilin Province (2021) (http://tjj.jl.gov.cn/tjsj/tjnj/2021/ (accessed on 1 March 2022))
Table 2. Production–living–ecological function evaluation index, grading assignment and weight.
Target LayerCriteria Layer
(Weights)
Factor LayerFactor Grading and Score
IndexesValueWeights10080604020
Land use production functionNatural
Factors
(0.2009)
LUT/0.331611, 1224, 51, 5221, 31, 41, 43, 5322, 23, 32, 33, 4246, 61, 63, 64, 65, 66
SLP°0.3356<33~88~1515~25≥25
APC°0.3328Sunny slopeSemi-sunny slopeSemi-shady slopeShady slope
Location
Factors
(0.5316)
DULm0.1262≤120012,000~21,00021,000~31,00031,000~44,000>44,000
DRAm0.1265≤720720~25001500~25002500~4000>4000
DNRm0.1262≤17,50017,500~37,00037,000~60,00060,000~87,000>87,000
DPRm0.1247≤80008000~18,00018,000~28,00028,000~40,000>40,000
DCRm0.1263≤60006000~12,50012,500~20,00020,000~30,000>30,000
DTRm0.1242≤13001300~30003000~47004700~7300>7300
DWBm0.1240≤20002000~50005000~85008500~14,000>14,000
DPSm0.1219≤17001700~52005200~93009300~14,300>14,300
Social
Factors
(0.2675)
PSI%0.2488HigherHighGeneralLowLower
TMOt0.2498HigherHighGeneralLowLower
SNAha0.2507LagerLagerGeneralSmallSmaller
TGOt0.2507HigherHighGeneralLowLower
Land use living functionNatural
Factors
(0.1911)
LUT/0.2959515211, 12, 21, 22, 31, 32, 41, 4323, 24, 33, 42, 5346, 61, 63, 64, 65, 66
SLP°0.3800<33~88~1515~25≥25
APC°0.3241Sunny slopeSemi-sunny slopeSemi-shady slopeShady slope
Location
Factors
(0.5585)
DULm0.1133≤120012,000~21,00021,000~31,00031,000~44,000>44,000
DRAm0.1199≤720720~25001500~25002500~4000>4000
DNRm0.1152≤17,50017,500~37,00037,000~60,00060,000~87,000>87,000
DPRm0.1141≤80008000~18,00018,000~28,00028,000~40,000>40,000
DCRm0.1131≤60006000~12,50012,500~20,00020,000~30,000>30,000
DTRm0.1563≤13001300~30003000~47004700~7300>7300
DWBm0.1556≤20002000~50005000~85008500~14,000>14,000
DLSm0.1125≤28,00028,000~50,00050,000~74,00074,000~100,000>100,000
Social
factors
(0.2504)
DMFm0.2816≤10,00010,000~20,00020,000~33,00033,000~50,000>50,000
DEFm0.2760HigherHighGeneralLowLower
TSGyuan0.1991HigherHighGeneralLowLower
PFEyuan0.2433HigherHighGeneralLowLower
Land use ecological functionNatural
factors
(0.1848)
LUT/0.558421, 3122, 32, 4211, 12, 23, 24, 33, 41, 43, 4651, 52, 53, 6461, 63, 65, 66
EDm/ha0.4416LowerLowGeneralHighHigher
Location
Factors
(0.7269)
DULm0.1101>44,00031,000~44,00021,000~31,00012,000~21,000≤1200
DRAm0.1036>40002500~40001500~2500720~2500≤720
DNRm0.1161>87,00060,000~87,00037,000~60,00017,500~37,000≤17,500
DPRm0.0927>40,00028,000~40,00018,000~28,0008000~18,000≤8000
DCRm0.1055>30,00020,000~30,00012,500~20,0006000~12,500≤6000
DTRm0.1037>73004700~73003000~47001300~3000≤1300
RIVm0.1149≤33,00033,000~72,00072,000~110,000110,000~150,000>150,000
DWBm0.1281≤20002000~50005000~85008500~14,000>14,000
DESm0.1253≤45004500~93009300~15,00015,000~22,000>22,000
Social
factors
(0.0883)
FCE%1HigherHighGeneralLowLower
Table 3. Composition relationships and conflict types of LUFCs.
NumberProductionLivingEcologicalConflict Types
IWWWTriple function mild conflict zone
IIMWWDual function mild conflict zone
WMW
WWM
MMW
MWM
WMM
IIISWWSingle function mild conflict zone
WSW
WWS
IVSWMDual function moderate conflict zone
MWS
WSM
WMS
SMW
MSW
VMMMTriple function moderate conflict zone
VISMMSingle function strong conflict zone
MSM
MMS
VIISSMDual function strong conflict zone
MSS
SMS
VIIISSSTriple function violent conflict zone
Table 4. Area composition of production, living and ecological land-use functions in western Jilin.
Number of Land-Use TypeProductionLivingEcologicalTotal
WMSWMSWMS
Paddy field3.341.191.150.272.023.401.452.751.495.68
Dry land26.6915.746.635.9921.6921.3817.7122.838.5249.06
Forest land2.431.330.360.602.031.480.301.772.044.11
Shrub forest0.800.130.010.250.430.260.050.260.630.94
Open woodland0.500.070.000.360.130.080.020.210.340.57
Other forest land0.450.080.000.240.220.080.030.240.260.53
High coverage grassland2.901.170.181.082.350.820.251.882.114.25
Medium coverage grassland3.740.890.051.262.261.170.551.952.194.68
Low coverage grassland0.630.070.000.280.300.120.080.370.250.70
Canal0.320.090.000.030.090.290.070.110.230.41
Lake1.940.590.250.361.450.740.131.031.402.55
Reservoir and pond0.270.050.000.050.200.080.020.080.220.32
Beach land0.720.090.010.040.420.410.180.340.360.88
Urban land0.370.100.040.010.010.490.350.160.010.51
Rural residential area1.641.090.500.100.932.201.821.170.243.23
Other construction land0.150.040.080.010.040.130.120.040.010.18
Sandy land0.500.010.000.370.070.080.020.220.290.52
Saline alkali land13.711.720.135.118.252.195.098.382.0815.56
Swamp land4.980.310.022.382.230.700.332.452.525.30
Bare land0.000.000.000.000.000.000.000.000.000.01
Bare rock land0.000.000.000.000.000.000.000.000.000.00
Total66.0724.779.4318.7845.1236.1028.5846.2425.18100.00
Publisher’s Note: MDPI stays neutral with regard to jurisdictional claims in published maps and institutional affiliations.

