
Analysis of the Dynamic Characteristics of the Top Flange Pile Driving Process of a Novel Monopile Foundation without a Transition Section


Abstract
:1. Introduction
2. Theory of Computation
2.1. Hiley Equation
2.2. Wave Equation
3. Numerical Model
3.1. Introduction to GRLWEAP Software
3.2. Numerical Model Description
4. Stress Analysis of Pile Head Flange
4.1. Statical Analysis
4.2. Dynamic Analysis
4.2.1. Calculation of Static Force
4.2.2. Study on Different Sudden Loading Methods
4.2.3. Time-Procedure Analysis
5. Conclusions
Author Contributions
Funding
Conflicts of Interest
References
- Ren, Z.; Verma, A.S.; Li, Y.; Teuwen, J.J.; Jiang, Z. Offshore wind turbine operations and maintenance: A state-of-the-art review. Renew. Sustain. Energy Rev. 2021, 144, 110886. [Google Scholar] [CrossRef]
- Jonkman, J. Definition of the Floating System for Phase IV of OC3; National Renewable Energy Lab.(NREL): Golden, CO, USA, 2010. [Google Scholar]
- Wang, Y.; Shi, W.; Michailides, C.; Wan, L.; Kim, H.; Li, X. WEC shape effect on the motion response and power performance of a combined wind-wave energy converter. Ocean. Eng. 2022, 250, 111038. [Google Scholar] [CrossRef]
- Zhang, L.; Shi, W.; Karimirad, M.; Michailides, C.; Jiang, Z. Second-order hydrodynamic effects on the response of three semisubmersible floating offshore wind turbines. Ocean. Eng. 2020, 207, 107371. [Google Scholar] [CrossRef]
- Ren, Y.; Venugopal, V.; Shi, W. Dynamic analysis of a multi-column TLP floating offshore wind turbine with tendon failure scenarios. Ocean. Eng. 2022, 245, 110472. [Google Scholar] [CrossRef]
- Zeng, X.; Shi, W.; Michailides, C.; Zhang, S.; Li, X. Numerical and experimental investigation of breaking wave forces on a monopile-type offshore wind turbine. Renew. Energy 2021, 175, 501–519. [Google Scholar] [CrossRef]
- Huang, W.; Liu, J.; Zhao, Z. The state of the art of study on offshore wind turbine structures and its development. Ocean. Eng. 2009, 27, 130–134. [Google Scholar]
- Shang, J.; Luo, R.; Zhang, L. Foundation structure selection and construction process for offshore wind turbines. Appl. Sci. Technol. 2009, 36, 6–10. [Google Scholar]
- Randolph, M.F.; Carter, J.P.; Wroth, C.P. Driven piles in clay—The effects of installation and subsequent consolidation. Geotechnique 1979, 29, 361–393. [Google Scholar] [CrossRef] [Green Version]
- Zhu, H.; Yin, Z. Finite Element Analysis of Pile Driving Effect. J. Hohai Univ. 1996, 24, 56–61. [Google Scholar]
- Carter, J.P.; Randolph, M.F.; Wroth, C.P. Stress and pore pressure changes in clay during and after the expansion of a cylindrical cavity. Int. J. Numer. Anal. Met. 1979, 3, 305–322. [Google Scholar] [CrossRef]
- Mabsout, M.E.; Tassoulas, J.L. A finite element model for the simulation of pile driving. Int. J. Numer. Meth. Eng. 1994, 37, 257–278. [Google Scholar] [CrossRef]
- Isaacs, D.V. Reinforced concrete pile formulas. Trans. Inst. Eng. 1931, 12, 305–323. [Google Scholar]
- Smith, E.A.L. Pile-driving analysis by the wave equation. J. Soil Mech. Found. Div. 1960, 86, 35–61. [Google Scholar] [CrossRef]
- Yuan, J.; Zhu, G. Pile wave Analysis Program by Optimization Methods under Large Strain of Soil. Chin. J. Geotech. Eng. 1990, 12, 1–11. [Google Scholar]
- Ozgurluk, Y.; Karaoglanli, A.C.; Ahlatci, H. Comparison of calcium-magnesium-alumina-silicate (CMAS) resistance behavior of produced with electron beam physical vapor deposition (EB-PVD) method YSZ and Gd2Zr2O7/YSZ thermal barrier coatings systems. Vacuum 2021, 194, 110576. [Google Scholar] [CrossRef]
- Doleker, K.M.; Ozgurluk, Y.; Karaoglanli, A.C. TGO growth and kinetic study of single and double layered TBC systems. Surf. Coat. Technol. 2021, 415, 127135. [Google Scholar] [CrossRef]
- Jia, Z.; Lian, J.; Chen, K.; Yang, A.; Yuan, X.; Wang, X. Computational method for end resistance of large-diameter ultra-long piles during pile sliding. Chin. J. Geotech. Eng. 2017, 39, 240–243. [Google Scholar]
- Jia, Z.; Yan, S.; Yan, A.; Zhang, X. Application of cone penetration test for the analysis of pile-run of long and large diameter piles in offshore geotechnical engineering. Chin. J. Rock Mech. Eng. 2016, 35, 3274–3282. [Google Scholar]
- Li, S.; Han, Z.; Yang, Q.; Zhou, Y.; Jiang, B. The formation mechanism of super large diameter and deep penetration pile in offshore platform. Eng. Mech. 2010, 27, 241–245. [Google Scholar]
- Li, S.; Wang, Y.; Pu, Y.; Sun, Z.; Fan, Z.; Han, L. Influence of Pile Sinking on Pile Capacity during Pile Driving on Offshore Platforms. China Earthq. Eng. J. 2014, 36, 462–467. [Google Scholar]
- Yan, S.; Chen, H.; Jia, Z.; Lin, S.; Sun, L. Research on the mechanism and calculation method for pile-running of long and large diameter piles based on energy conservation method. Ocean. Eng. 2016, 34, 63–71. [Google Scholar]
- Chen, Q.; Liu, F.; Xiao, J. Key technologies for construction of monopile foundation without transition in wind farm in intertidal zone. China Harb. Eng. 2016, 36, 56–59. [Google Scholar]
- Ma, K.; Liu, G. Three-Dimensional Discontinuous Deformation Analysis of Failure Mechanisms and Movement Characteristics of Slope Rockfalls. Rock Mech. Rock Eng. 2022, 55, 275–296. [Google Scholar] [CrossRef]
- Peng, Z.; Zhao, H.; Li, X. New ductile fracture model for fracture prediction ranging from negative to high stress triaxiality. Int. J. Plasticity 2021, 145, 103057. [Google Scholar] [CrossRef]
- Dong, W. Study on Driveability Analysis Method for Large Diameter and Long Piles of Offshore Oil Drilling Platform. Ph.D. Thesis, Tianjin University, Tianjin, China, 2009. [Google Scholar]
- Huang, J. Analysis of Pile Driving for Pile Foundation of Offshore Platform. Master Thesis, Tianjin University, Tianjin, China, 2010. [Google Scholar]
- Jia, Z. Study on soil resistance of offshore platform pile foundation during pile driving. Master Thesis, Tianjin University, Tianjin, China, 2017. [Google Scholar]
- Liu, R.; Zhou, R.; Yan, S. Plug effect on drivability of large-diameter steel piles. Ocean. Eng. 2005, 23, 71–76. [Google Scholar]
- Pu, Y. Study on Driving Refusal of Steel Pipe Pile in Large Diameter. Port Eng. Technol. 2012, 49, 31–33. [Google Scholar]


| Parameters | Values |
|---|---|
| Piling hammer type | IHC-S1800 |
| Surface load applied to the piling hammer (kN) | 1.35 × 10⁵ |
| Turning radius of flange corners (mm) | 20 |
| Wall thickness (mm) | 60 |
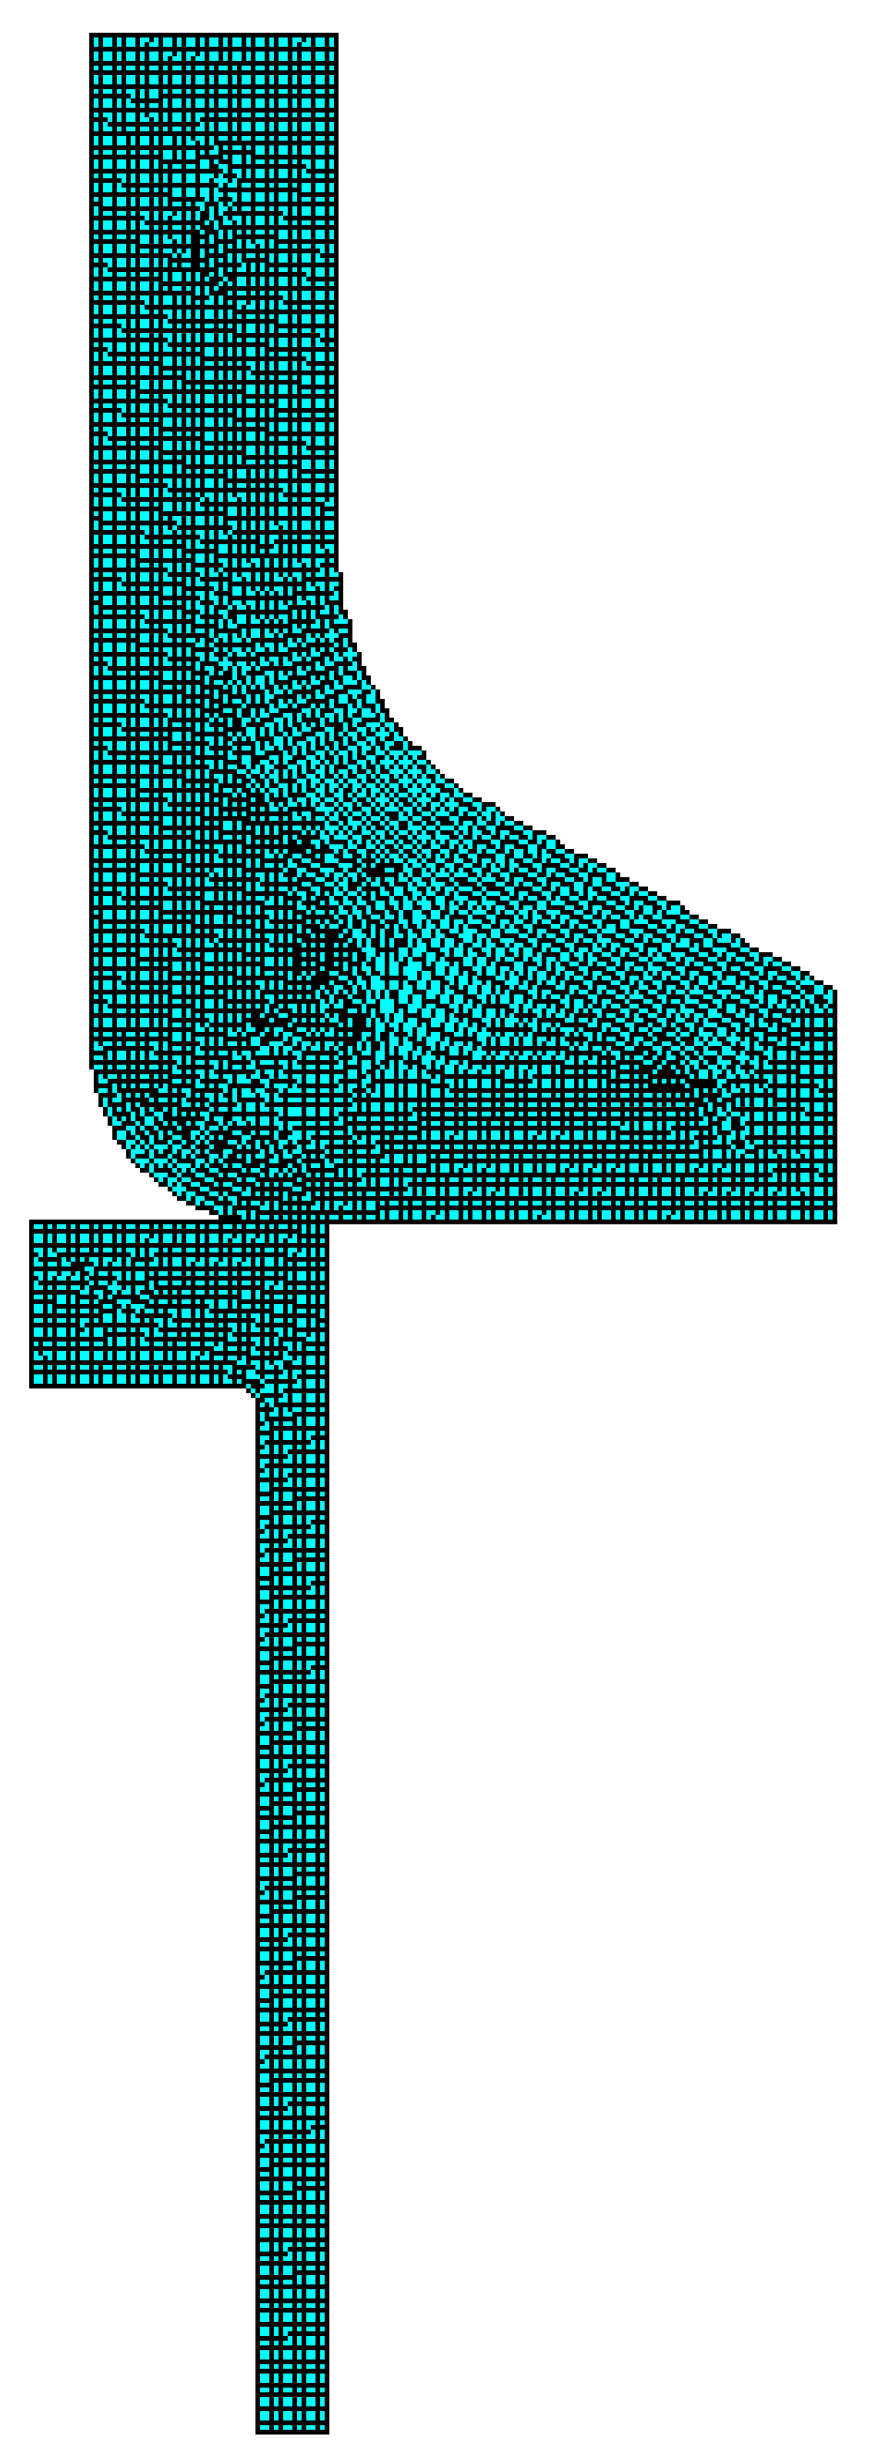
| Grid size (m) | 0.01 × 0.01 |
| Pile End Bearing Capacity Reduction Factor | Total Hammers | Penetration of Final Hammer (mm) | Ultimate Bearing Capacity of Pile (kN) | Maximum Compressive Stress of Pile Body (Mpa) | Maximum Tensile Stress of Pile Body (Mpa) |
|---|---|---|---|---|---|
| 0.3 | 6015 | 3.51 | 58864.9 | 182.2 | 74.98 |
| 0.4 | 8067 | 2.28 | 65268.8 | 182.2 | 52.80 |
| 0.5 | 11072 | 1.38 | 71672.6 | 190.4 | 53.10 |
| Different Sudden Loading Methods | Load Step (s) | Load Time (s) | Maximum Stress (Mpa) | Maximum Stress Moment (s) |
|---|---|---|---|---|
| Sudden load 1 | 1.0 × 10⁻⁴ | 0.01 | 528 | 0.0050 |
| Sudden load 2 | 1.0 × 10⁻⁸ | 0.01 | 554 | 0.0048 |
| Sudden load 3 | 1.0 × 10⁻⁸ | 0.05 | 595 | 0.0030 |
Publisher’s Note: MDPI stays neutral with regard to jurisdictional claims in published maps and institutional affiliations. |
© 2022 by the authors. Licensee MDPI, Basel, Switzerland. This article is an open access article distributed under the terms and conditions of the Creative Commons Attribution (CC BY) license (https://creativecommons.org/licenses/by/4.0/).
Share and Cite
Li, Y.; Li, J.; Shi, W.; Li, X.; Wang, B. Analysis of the Dynamic Characteristics of the Top Flange Pile Driving Process of a Novel Monopile Foundation without a Transition Section. Sustainability 2022, 14, 5950. https://doi.org/10.3390/su14105950
Li Y, Li J, Shi W, Li X, Wang B. Analysis of the Dynamic Characteristics of the Top Flange Pile Driving Process of a Novel Monopile Foundation without a Transition Section. Sustainability. 2022; 14(10):5950. https://doi.org/10.3390/su14105950
Chicago/Turabian StyleLi, Ying, Jinghui Li, Wei Shi, Xin Li, and Bin Wang. 2022. "Analysis of the Dynamic Characteristics of the Top Flange Pile Driving Process of a Novel Monopile Foundation without a Transition Section" Sustainability 14, no. 10: 5950. https://doi.org/10.3390/su14105950
APA StyleLi, Y., Li, J., Shi, W., Li, X., & Wang, B. (2022). Analysis of the Dynamic Characteristics of the Top Flange Pile Driving Process of a Novel Monopile Foundation without a Transition Section. Sustainability, 14(10), 5950. https://doi.org/10.3390/su14105950