Abstract
This paper divides the Silk Road Economic Belt into four regions. Based on the economic characteristics of these regions, the authors construct a regional equilibrium gravity model with a multilateral resistance variable. The results of the theoretical analysis show that China’s three measures (trade liberalization, financial assistance, and technological assistance) will lead to different trade effects and welfare effects. This paper conducts numerical simulations to analyze these effects among regions under different circumstances, and the authors confirm that the simulation results are consistent with real trade changes. The main results are: (1) Trade liberalization can greatly increase China’s exports to the four major regions, and the welfare of all regions will also increase (Simulation 1). (2) Technological cooperation and assistance can continuously improve local production technology, which in turn leads to a slight decline in China’s exports to the four major regions, but in the long run, the welfare of all regions has improved (Simulation 2). (3) The financial assistance from international institutions will increase the regional trade and welfare linearly (Simulation 3). Finally, this paper draws some conclusions based on the numerical simulation results.
1. Introduction
The Belt and Road Initiative (BRI) is an initiative that aims promote to regional economic integration and sustaining China’s peaceful rise and growth [1]. As a vital part of BRI, the Silk Road Economic Belt is a new concept of economic development regions extended and developed from the ancient Silk Road. It has great potential in connecting the Eurasian economy for common development. The trade effect of regional cooperation is clear. Viner [2] first proposed the influence pathway of international cooperation to participating countries and nonparticipating countries. He believes that trade cooperation between countries will eventually be substantially achieved through free trade agreements, which can generate trade creation and trade diversion. However, technological assistance and financial assistance will also promote regional trade growth and social development. What impact did trade liberalization, technical assistance, and financial assistance in the Silk Road Economic Belt cooperation have on participating countries? Are there different transmission mechanisms and influencing factors for these effects? This is the core issue that this article focuses on. Methodologically, putting trade liberalization, technological assistance, and financial assistance into one model is another ambition of this paper. This model can show the influence of three different driving factors in regional cooperation separately, and then the authors can propose several new explanations for BRI.
To comprehensively analyze the effects of various policies, the authors introduce necessary variables related to trade costs, technological assistance, and financial assistance into a trilateral trade model, forming a general equilibrium gravity model that can reflect the characteristics of different countries in the Silk Road Economic Belt. Then, the parameters were calibrated, and a numerical simulation was conducted in alignment with the conclusions of the theoretical model. It is worth noting that the calibration model fits the actual value very well. The numerical simulation results show that: (1) Trade liberalization can greatly increase China’s exports to the four major regions; the welfare of all regions will increase at the same time (See Simulation 1). Specifically, the growth rate of China’s trade with West Asia and Eastern Europe was significantly higher than the growth rate of trade with other regions. However, in terms of quantity, South Asia and Eastern Europe will remain China’s main export destinations. (2) Technological cooperation and assistance can continuously improve local production technology, which in turn leads to a slight decline in China’s exports to the four major regions, but in the long run, the welfare of all regions has improved (See Simulation 2). When local production technology improves, local consumers will consume more domestic products, which will slightly reduce China’s exports to the local area. (3) With the deepening of Silk Road Economic Belt cooperation, international financial cooperation institutions will bring more funds to local enterprises. China’s exports to the four regions will increase proportionally, and the welfare of all regions will increase at the same time (See Simulation 3). This change is because financial support has reduced the financial pressure of local countries on infrastructure investment and increased the consumption capacity of local countries. Finally, based on the analysis results, this paper discusses some key points and issues related to China’s cooperation with the Silk Road Economic Belt under different circumstances.
2. Literature Review
Existing research about BRI tends to analyze the impact from the perspective of trade and investment. Lin et al. [3] believe the strategic interactions of mega-regional blocs, such as the Trans-Pacific Partnership (TPP), the Regional Comprehensive Economic Partnership, and even the BRI in the Asia-Pacific reflects the dual purposes of large countries as they seek not only the welfare gains from trade liberalization, but also the leadership in a trading bloc or the right to set the rules. Mahadevan and Nugroho [4] find that the global gains provided by the Asia-Pacific area cooperation not enough to overcome the negative impacts of the United States-China trade dispute. However, the results obtained were conservative, as reduction in nontariff barriers and other positive spillover effects of trade liberalization related to investment and productivity improvements due to competition or increased intra-industry trade could not be accounted for. Shi et al. [1] investigate the changing investment motives of state-owned and private-owned enterprises (SOEs and POEs) before and after the implementation of the BRI in two periods, namely 2010–2013 and 2014–2015. Their conditional logit models show that POEs pursued natural resources in ASEAN based on geographical and relational proximity in the pre-BRI period while SOEs are directed to exploit natural resources in ASEAN besides more remote destinations after the launch of the BRI; the BRI promotes Chinese OFDI in ASEAN through increased senior leader visits and enhanced diplomatic relations. Luo et al. [5] investigates the impact of BRI as an exogenous policy shock on the utilization of foreign capital in China in the short term. Du and Zhang [6] find that after the BRI, China’s overseas direct investment (ODI), especially whole or majority-ownership mergers and acquisitions, rose significantly in the belt-road countries, especially the ones along the continental route. Comparatively speaking, China’s state-controlled acquirers played a leading role in infrastructure sectors, whereas the non-state-controlled acquirers were particularly active in non-infrastructure sectors. Central and West Asia, Western Europe and Russia are favorable destinations of Chinese ODI.
Studies have also shown that the path and order of trade cooperation in the BRI region are quite important. Macho-Stadler and Xue [7] show that when global free trade is reached gradually, the countries that are initially excluded gain less than the rest and may even be made worse off by the final free trade agreement than they were in the initial state of no trading blocs. Although global free trade is efficient, each country’s benefit from free trade depends on the path that leads to the global free trade agreement. Baldwin and Jaimovich [8] tested the hypothesis that the domino-like spread of regionalism is partly driven by “defensive” free trade agreements, that is, free trade agreements signed to reduce the risk of third-country free trade agreements. The study also found evidence for the BRI area.
In addition to trade and investment liberalization, an important issue of the BRI is financial problems and local technology improvement. The Chinese government launched a ‘vision and action’ plan in 2015 to promote the BRI. This plan addresses transportation, energy, and a communications-based infrastructure interconnection. However, most studies on the impact of BRI beyond the liberalization of trade and investment, such as infrastructure construction assistance, can only be conducted from a broad overview perspective (Huang [9]; Ramasamy and Yeung [10]). Although Ramasamy and Yeung [10] compared the main measures of the BRI, namely strengthening physical infrastructure and improving border management, the impact on the trade of the countries that signed the project, especially the countries along the six major economic corridors. However, it still settles on the importance of trade facilitation.
The above literature analysis shows that the current studies of BRI effects is relatively vague, or only considers the trade and welfare effects of trade liberalization and does not model other measures (such as financial and technological assistance) separately. They cannot fully reflect the impact of such a large-scale regional cooperation framework. It also cannot alleviate the worries of different countries about this vast regional cooperation [11].
Methodologically, as trade is the most intuitive form of economic ties among economies, it can be considered as ‘gravity’ between different economies [12]. Currently, a large number of RTA effect studies follow the gravity framework (Hamilton and Winters [13]; Hassan [14]; Baier and Bergstrand [15]; Baier et al. [16]; Besedes et al. [17]). In addition to the above empirical studies, a large number of theoretical studies have derived the structure of the gravitational model from the perspective of mathematical economics, whether it was a representative enterprise model or a heterogeneous enterprise model (Anderson and van Wincoop [18]; Anderson et al. [19]; Jacks and Novy [20]; Chaney [21]). Through a three-country general equilibrium trade model based on the constant elasticity of substitution (CES) utility form and the existence of economies of scale, the authors obtained the analytic solution of the export volume of a country under the general equilibrium state. Compared to other existing forms of complex gravity models, this model is more analyzable and bypasses random mathematics (Chaney [21]; Arkolakis [22]; Donaldson [23]; Melitz and Ottaviano [24]; Mayer et al. [25]). However, the disadvantage of this model is that it does not have a more detailed description of the heterogeneity of firm behavior and does not take into account the intra-product trade. These sacrifices are to ensure the analyzability of the model structure (and the multilateral resistance variables), which in turn enables quantitative simulations.
In addition, China’s trade cooperation with the countries in the Silk Road Economic Belt have produced a neighboring country effect. The neighboring country effects, also known as third-country effects, mean that a country’s exports will be affected by other countries that are not trading partners [18]. Bahmani-Oskooee and Bolhassani [26] examine the impact of exchange rate fluctuations and third-country effects on bilateral trade between the United States and Canada based on data for 152 industries. Unlike the conclusion of Cushman [27], Bahmani-Oskooee and Bolhassani [26] show that the third-country effect also has a significant effect on the bilateral trade between the United States and Canada. Considering the impact of a possible third-country effect on the cooperation of the Silk Road Economic Belt, this area must be analyzed by a model that includes more than two countries. Therefore, our model includes the third country as a separate country while analyzing the bilateral impact in detail.
This paper makes two contributions to the existing literatures on BRI and sustainable regional economic cooperation effect. First, it introduces related variables of trade costs, technological assistance, and financial assistance into a multilateral model. This mathematical analysis method is different from the current overview analysis of various measures (Huang [9]; Ramasamy and Yeung [10]). Second, the authors conduct a simulation analysis of the multilateral impact of BRI on the Silk Road Economic Belt, which has distinguished the trade effects and welfare effects of the three policy measures, and expands the trade and investment perspective of understanding of the Belt and Road Initiative (Shi et al. [1]; Lin et al. [3]; Mahadevan and Nugroho [4]; Luo et al. [5]; Du and Zhang [6]).
3. Model Analysis on the Silk Road Economic Belt Construction
The authors consider the general economic situation of the regions in the Silk Road Economic Belt, including China. That is, the economic behavior of each country is affected by three aspects, namely, the country itself, China, and the other countries. Therefore, a model is constructed comprising three economies to analyze the basic economic factors that affect the construction of the Silk Road Economic Belt. Clearly, the differences among the four regions of the Silk Road Economic Belt are reflected not only in the production of products but also in the level of technology and factor endowments. Therefore, in the process of analyzing factors affecting economic cooperation between China and the countries along the Silk Road Economic Belt, a general equilibrium model with production technology differences must also be considered.
3.1. Model Structure
This study first considers consumer behaviors. Products from different regions may act as alternatives for a country’s consumers. Considering the CES assumption in Krugman’s paper, the authors assume the same elasticity of substitution between various types of industrial products. However, each economy’s total products were added to highlight the differences between economies. An aggregated domestic consumer utility function is considered as follows:
where UL is the utility of all local consumers, and SC is the sum of the products from China that citizen-consumers buy, that is, the import volume of Chinese products. SL is the sum of the products from local producers that citizen-consumers buy. SO represents domestic products, which is measured as the sum of the products citizen-consumers use from other countries. σ is the elasticity of substitution between any two country’s products, and the greater it is, the less difference there is in the products for consumers,. At the same time, consumers are faced with the following constraints.
where IL represents the income of the local country, represents the personal assets of the local country, and then represents a raw personal disposable income of the local country. Assets held by individuals are used to invest in enterprises, which should be higher than the fixed costs of enterprises (). Since the authors consider only typical consumers, the authors did not make a distinction between the average national income and total income (If the authors must distinguish between these two situations, then the summing process is simply multiplying by the total number of people). SC, SL, and SO still represent the production of China, the local country, and other countries. PC, PL, and PO represent the original price of the products of these three economies. This paper uses the form of price increase to express trade costs. Positive parameter δC and δO represent the trade cost factor, which means that local consumers have to pay a price higher than the original price to buy imported products.
To analyze the maximizing behavior of consumers, according to Formulas (1) and (2), the authors constructed the Lagrangian function. Since the second-order condition for the maximum by the CES utility function met the requirement, the authors considered only the first-order conditions. Then the authors could obtain inverse demand functions:
Please note that these are both personal consumption functions and aggregate consumption functions. Next, this paper considers producer behaviors. The construction of the Silk Road Economic Belt promotes commercial intercourse among nations by reducing trade costs between countries, or by technological and financial assistance. To highlight the differences of countries in the Silk Road Economic Belt, trade costs appear only for international trade rather than in domestic trade.
Producer behaviors are particularly embodied in the production function or cost function; this paper adopts production technology, which can reflect economies of scale. Notably, this model considers only one country’s domestic market now (the ‘local’ country). The total cost functions of the enterprises from three different economies are shown as follows:
In the function, CC, CL and CO, represent the production cost of the three economies. F is the fixed cost; this comes from personal investment A. Since it does not affect the final result, this paper assumes that the fixed costs of typical enterprises in the three economies are the same, and the sum of the fixed costs is the same as well. τC, τL, and τO represent the marginal costs of the three economies, which also represent the production technologies. SC, SL, and SO represent the sum of the outputs of the three economies. Since this paper analyzes the general equilibrium and the quantity of production and demand are equal, production is expressed with the same letters as demand in the previous section.
The authors only considered the product market of the regions under study. According to Formulas (6)–(8), the authors can obtain the profit function of the overall enterprises of the three economies in the studied area:
By putting Formulas (3)–(5) into (9)–(11), the authors can obtain the corporate profit function at equilibrium.
Then, considering the optimizing behavior of three manufacturers after summing the data, the authors obtain the first order of SC, SL, and SO for solving the Formulas (12)–(14) respectively, which are shown as follows:
Notably, to simplify the analysis, the authors do not use the item for small quantities of higher orders as a coefficient. This does not affect the final result in a real case where production is higher than one; Krugman [28] used a similar simplification in his famous trade model.
3.2. Gravity Equation with Multilateral Resistance
Since the three companies segment the country’s market and a Cournot game relation is developed between them, mutually maximizing behavior occurs on the basis of the individual mutually optimizing behavior. Therefore, the authors need to solve (15)–(17) together for the equilibrium SC (China’s export volume to the local country), SL (Local consumption of domestically produced products), and SO (ROW’s export volume to the local country):
where SC* represents the general equilibrium of the local country’s typical consumer under the common optimizing behavior of the consumer and producer regarding the imports of Chinese products (China to local). SO* represents the similar imports of products from the rest of the world (ROW to local). SL* represents the local country’s typical aggregated consumer consumption of domestically produced products (local to local).
The solution (18)–(20) has the characteristics of the trade gravity model, which is consistent with the traditional trade theory and trade experience data. Take (18) as an example; the term and term in numerator represent the economic scale of the import and export. The term in the numerator represents the trade distance. Interestingly, the model in this paper also reveals a multilateral resistance term. The denominator of (18) is a linear combination of trade costs , which represents the multilateral resistance proposed by Anderson and van Wincoop [18]. This multilateral resistance item collectively represents the influence of countries other than the trading parties on this group of bilateral trade, which could fully reflect the trade effect of sustainable regional economic cooperation. Letting , the authors get:
Substitutings (21)–(23) into the utility function (1), the authors can get the indirect utility function of the local country for welfare analysis:
The economic meaning of Formula (24) is also very clear. The higher the disposable income, the higher the national welfare. Otherwise, national welfare is positively related to production technology and trade freedom.
3.3. Comparative Static Analysis of Sustainable Regional Economic Cooperation
The following is the analysis of the impact of the cooperation of the Silk Road Economic Belt with China and the country’s trade. The cooperation includes three aspects: the increase in trade freedom between local countries and China, the technological assistance that China provides to local countries, and the financial assistance that China provides to local countries.
3.3.1. Trade Liberalization
First, the authors focus on using the rate of decrease in the transaction costs coefficient δC to represent the level of effort in trade liberalization of the Silk Road Economic Belt. It is foreseeable that this will cause a trade effect. The authors might take the derivation of the China’s export volume to the local country (21) for δC; then the authors easily have:
where . It can be seen from (25), in the process of constructing the Silk Road Economic Belt, that the efforts in trade liberalization are effective. Furthermore, the effect of this trade liberalization is positively related to the economic scale of both parties. This means that a larger trade liberalization partner will bring about a larger increase in trade. The size of the original trade barrier between the two parties is negatively related to the effect of trade liberalization. This means that if the initial barriers between the two countries are relatively high, trade liberalization cooperation will produce greater benefits.
Next, the authors analyze the welfare effect of trade liberalization. Similarly, the authors take the derivation of the indirect utility function of local country (24) for δC, so that the authors easily have:
It can be seen from (26), in the process of constructing the Silk Road Economic Belt, that China’s efforts in trade liberalization promoted the national welfare of the local country. Similarly, this welfare effect increases as the size of the partner country increases.
3.3.2. Technological Assistance
Secondly, the authors focus on using the rate of decrease in the marginal costs of local country τC to represent the technological assistance that China provides to local countries of the Silk Road Economic Belt. Let us also first observe the impact of technological assistance on trade. The authors might take the derivation of China’s export volume to the local country (21) for τL; then the authors easily have:
It can be seen from (27), in the process of constructing the Silk Road Economic Belt, that the technological assistance that China provides to local countries led to a decline in bilateral trade. This is because when local production technology improves, local consumers will consume more domestic products, which will slightly reduce China’s exports to the local area.
However, increasing short-term trade flows is not the entire goal of economic cooperation. Next, the authors analyze the welfare effect of the technological assistance that China provides to local countries. Similarly, the authors take the derivation of the indirect utility function of local country (24) for τL, wherein the authors have:
It can be seen from (28), in the process of constructing the Silk Road Economic Belt, that the technological assistance that China provides to local countries promoted the national welfare of the local country. Similarly, this welfare effect increases as the size of the partner country increases.
3.3.3. Financial Assistance
Third, the authors focus on using the rate of decrease in the income leakage used for corporate fixed asset investment of the local country AL to represent the financial assistance that China provides to local countries of the Silk Road Economic Belt. Let’s also first observe the impact of financial assistance on trade. The authors might take the derivation of China’s export volume to the local country (21) for AL; then the authors easily have:
It can be seen from (29), in the process of constructing the Silk Road Economic Belt, that the financial assistance that China provides to local countries improves bilateral trade. This is because financial support reduces the financial pressure of local countries for infrastructure investment, which increases the consumption power of local countries.
Next, the authors analyze the welfare effect of the financial assistance that China provides to local countries. Similarly, the authors take the derivation of the indirect utility function of local country (24) for AL, then the authors have:
It can be seen from (30), in the process of constructing the Silk Road Economic Belt, that the financial assistance that China provides to local countries promoted the national welfare of the local country. On the whole, the three aspects of cooperation in the Silk Road Economic Belt have different effects on China’s exports, but they all have a positive effect on the national welfare of local countries. In the short term, trade liberalization and financial support have effectively increased the volume of trade between China and local countries. In the long term, technological assistance will increase the economic scale of the local country, thereby increasing overall regional trade.
4. The Simulation Analysis of Economic Cooperation between China and the Regions of the Silk Road Economic Belt
This section first discusses the calibrations of the corresponding parameters of Formula (18) and (24) using existing studies and experience data. Since the quantitative influences of parts of variables that affect the Silk Road Economic Belt are unclear, the authors must develop a numerical simulation to analyze the difference between the different areas and the factors influencing the construction of the Silk Road Economic Belt. Due to the significant differences among the four regions of the Silk Road Economic Belt, the authors mainly focus on the different features of for the countries in the Silk Road Economic Belt and China. Therefore, before the specific calibration of the parameters, the authors first give a brief introduction to the economic differences of the four regions.
4.1. Descriptions of the Spatial Heterogeneity Characteristics of the Silk Road Economic Belt
The Silk Road Economic Belt is a new concept of economic development regions extended and developed from the ancient Silk Road. The ancient ‘Silk Road’ has two main land routes: a northwest ‘Silk Road’ and a southern ‘Silk Road’. The northwest ‘Silk Road’ refers to the route originating at Chang’an, leaving Xinjiang through Central Asia to Europe. The southern ‘Silk Road’ mainly refers to the trade route starting in Chengdu, leaving Teng Chong Yunnan through Myanmar to India [29]. These regions have been expanded to the west and south while Central Asia serves as the core region. By considering the results of existing research, the authors can calculate the spatial extent of the Silk Road Economic Belt. The range of this space has been extended from the heartland of Central Asia to the Middle East and Eastern Europe [30]. Thus, based on the differences in geographical locations and economic characteristics, this vast zone can be divided into four regions, namely, Central Asia, South Asia, West Asia, and Eastern Europe. Specific countries included in each region are shown in Table 1.

Table 1.
The regional divisions and countries of the Silk Road Economic Belt.
Table 1 indicates that the areas included in the Silk Road Economic Belt cover the main part of Eurasia, and there are enormous differences in their respective economic development. Due to the limited availability of data, this paper selected only the countries without the * notation in Table 1 as representatives of each region for describing and analyzing the economic characteristics of the region. Meanwhile, to eliminate the subjectivity of dividing the regions and selecting nations, this paper uses the weighted average (weighted by economic scale) of all the nations to describe the economic characteristics of the different regions. Unless specified, all data was obtained from databases compiled by the National Bureau of Statistics of China and the World Bank, and pricing data are shown in current dollar amounts.
To analyze the economic characteristics of the different regions, this paper first studies economic growth and national incomes. The disposable income per capita of four regions of the Silk Road Economic Belt are shown in Table 2. Clearly, Table 2 shows that West Asia countries possess absolute advantages in per capita income. The per capita income of the South Asia region is consistently ranked last, followed by the Central Asia region. This means that the living standard of the two regions closest to the Silk Road Economic Belt is relatively low. The growth of the per capita income in the South Asia region is the slowest while the economies of the other three regions are growing significantly. It is worth noting that around 2015, the per capita disposable income of East Europe and Central Asia experienced a short-term decline. It is worth noting that around 2015, the per capita disposable income of East Europe and Central Asia experienced a short-term decline. This shows that the income situation of residents in these two regions is not stable, and the effect of financial assistance may be more obvious.
Table 2.
Comparison of the disposable income per capita of four regions (US dollar).
Patent applications can be used as an indicator of a country’s technological capabilities and technological innovation capabilities. It can be seen from Table 3 that the technological capabilities of East Europe have significant advantages. The technological capabilities of South Asia and West Asia have experienced substantial progress in the past 20 years. However, at the same time, the technological capabilities of Central Asia have not grown. This shows that China and Central Asia have a large room for technological cooperation. Technological assistance will improve the indicators of regional cooperation in the long term.
Table 3.
Comparison of the average resident patent application of four regions.
The authors analyzed China’s exports compared to the four regions in the Silk Road Economic Belt, as shown in Table 4. It can be seen from Table 4 that the South Asia is far ahead of the other three regions. China’s exports to East Europe did not grow as rapidly as to South Asia, but they still maintained a considerable scale. China’s exports to Central Asia have grown at a high rate but on a limited scale. Compared with Central Asia and South Asia, China’s export growth to West Asia and East Europe is relatively slow, which means there is greater potential for trade cooperation between these two regions and China. This result is fully reflected in the numerical simulation results in Section 3.3.1.
Table 4.
China’s exports to the four regions (10,000 US dollar).
4.2. Parameters Calibration
For the elasticity of product substitution , this paper makes fine adjustments based on the values set by Krugman [28], let . In the numerical simulation, the authors also conducted a robustness test for this value. The results show that when this value changes in the range of 2 to 10, the result is still basically valid.
For the national disposable income , this paper uses the aggregated adjusted net national income (current US dollars) from 2000 to 2018 as the basic data. Because in the model is equal to the sum of price multiplied by quantity, it is a nominal quantity. This paper directly uses current US dollars as the unit.
For the marginal cost , the authors use the reciprocal of resident patent applications. In Melitz’s famous paper on trade theory [31], marginal cost and the reciprocal of production technology are the same variable. It is worth noting that simply taking the reciprocal will lead to deviations in the numerical units of the results, but the authors pay more attention to the regional comparison and dynamic changes of the simulation results.
For the trade cost , the authors use the value of a function of distance, . This is a common form of geographic distance and trade cost conversion. Regarding the value of cost in other countries, the authors use the average cost of each region instead. The specific distance from each region to China refers to the geographic distance of a straight line from the capital city of each country to Beijing and refers to the weighted average of the GDP of each country in each region, which is also referred to as the economic distance. For the trade cost parameter , this paper adjusts based on the value set by Desmet and Rossi-Hansberg [32], let . This parameter is also related to the selected distance unit. In this study, the Euclidean distance is measured with 5000 km as the unit. If the unit is 1 km, .
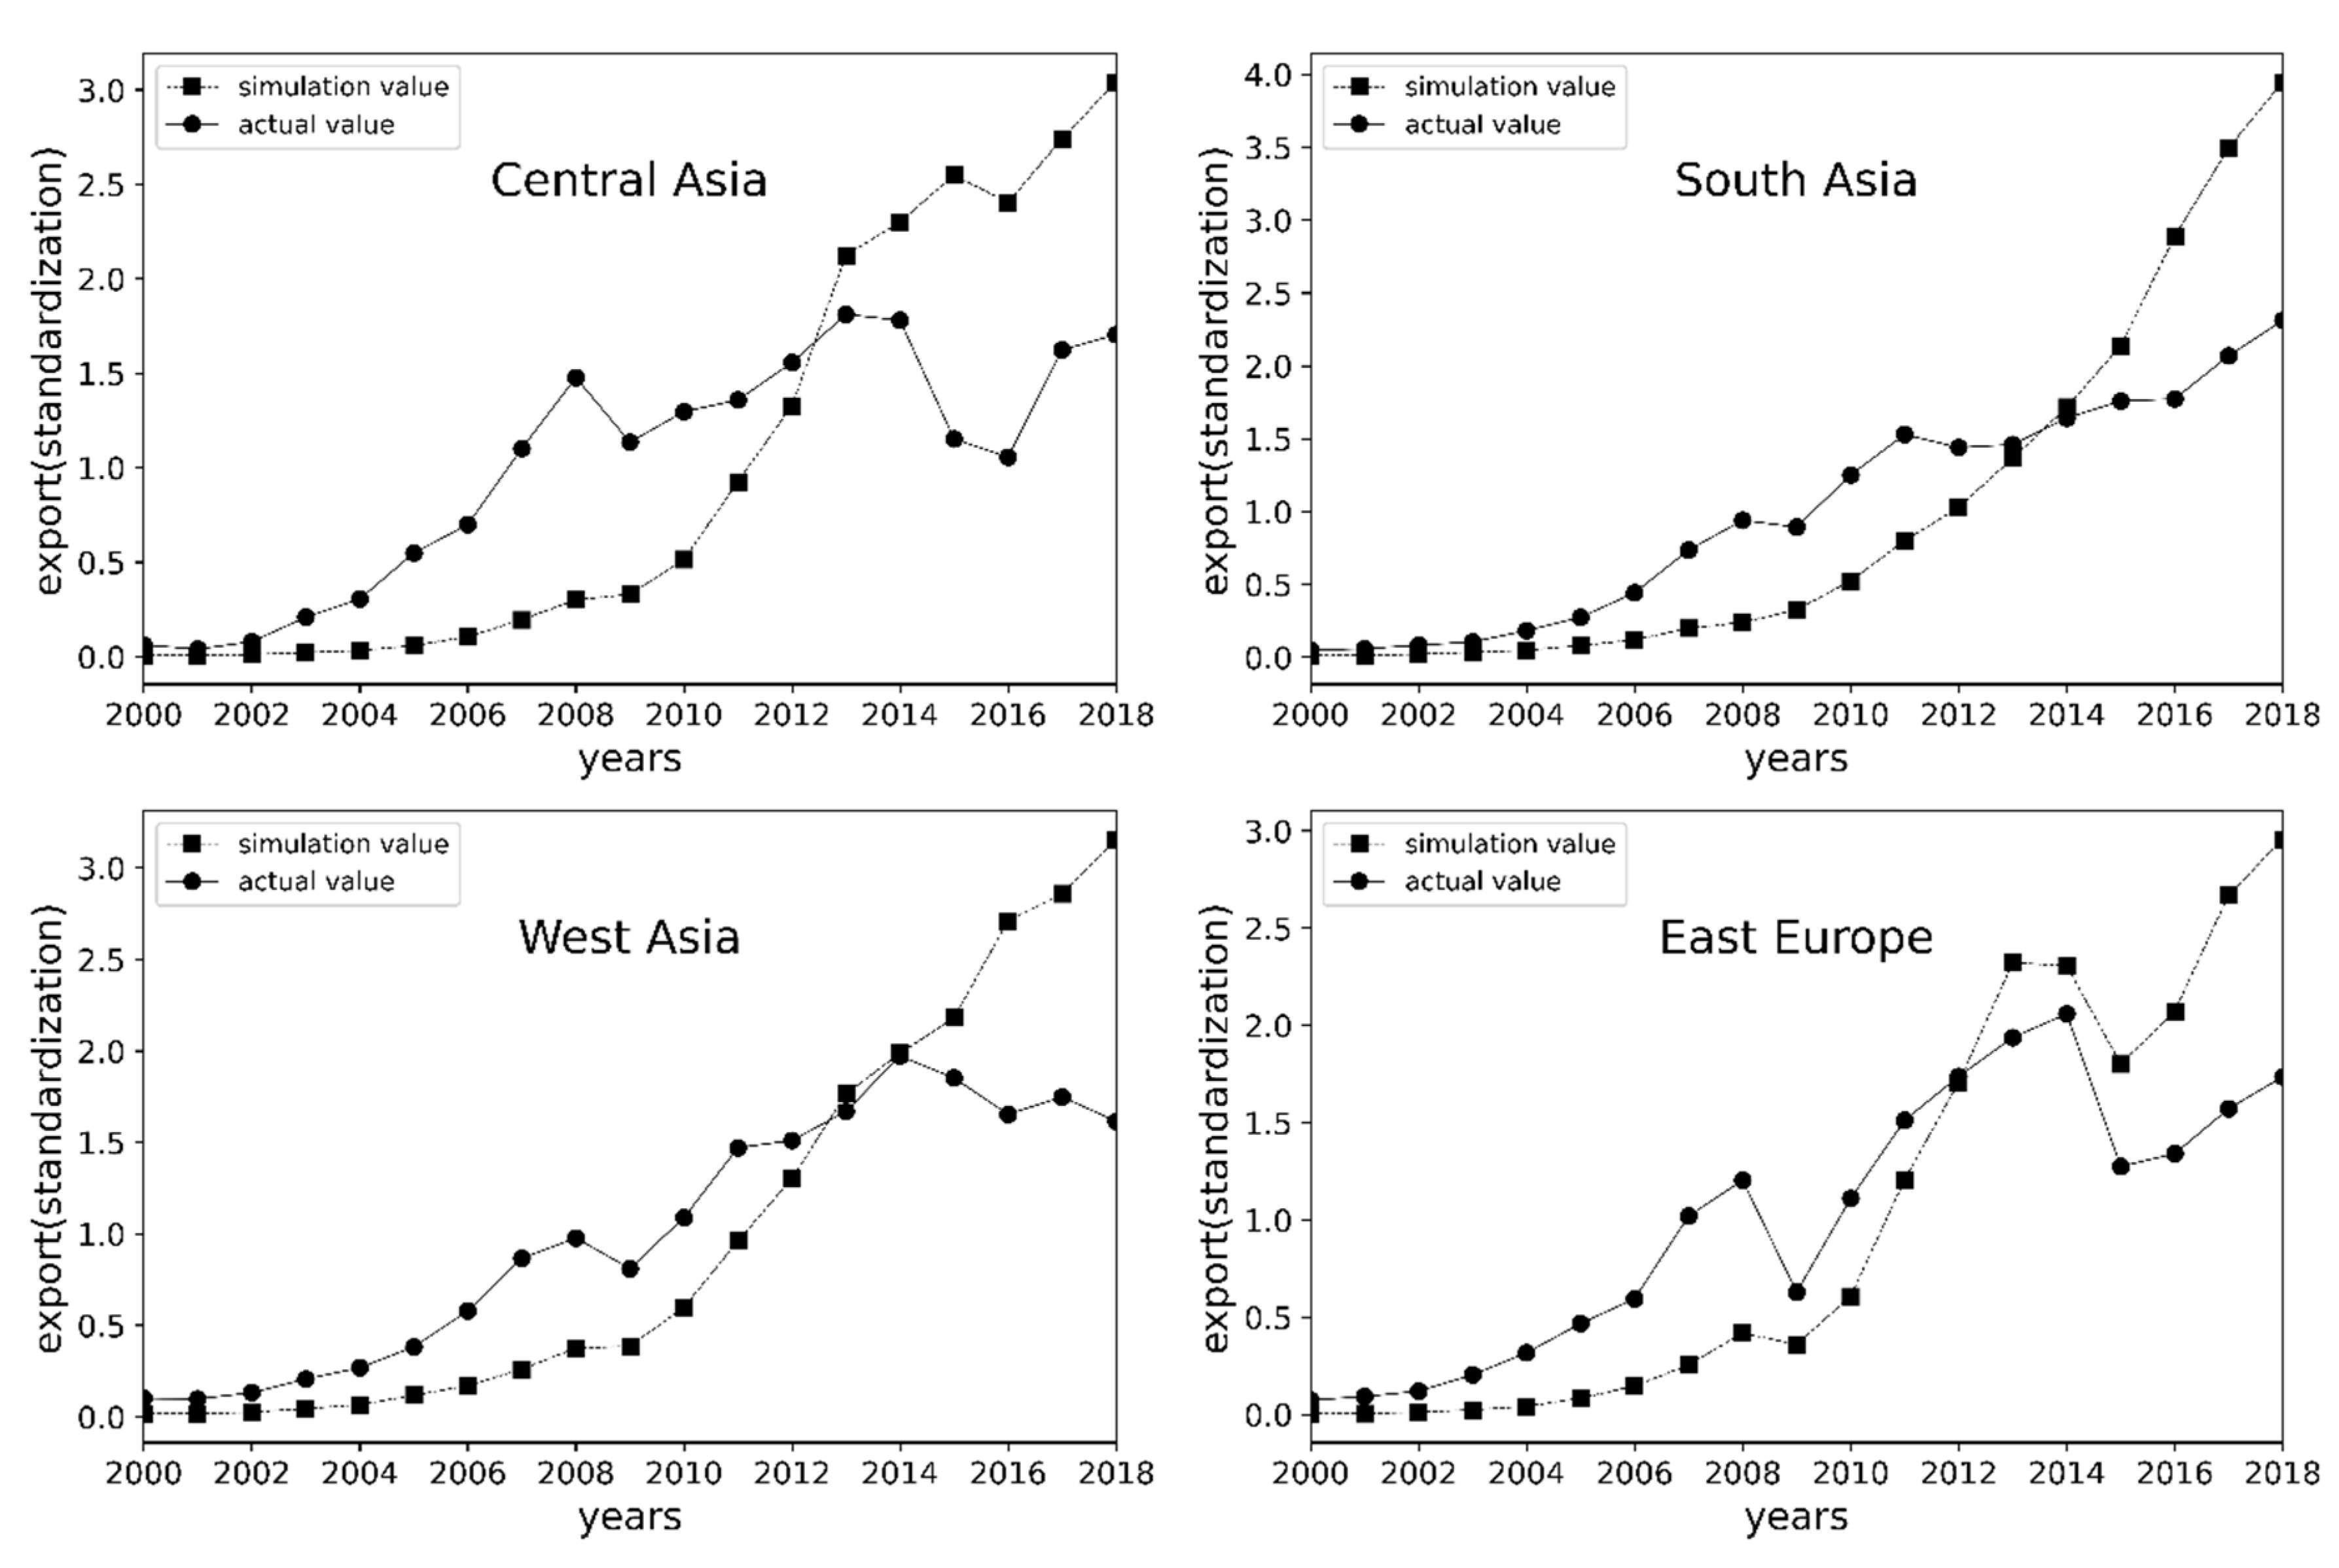
In order to observe the rationality of the parameter calibration results, the authors compared the simulated and actual values of China’s exports to the four major regions from 2000 to 2018.
The Figure 1 show that the simulation results in this paper reflect the actual export structure and dynamic changes of China to the four major regions. The graphs of Figure 1 remove the average value, which shows that the simulated values also reflect the fluctuation of the actual value. The results show that the model in this paper can basically show the actual changes in the four areas. These facts all show that the result of parameter calibration is reasonable, and the calibrated model can be used for different types of numerical simulations.

Figure 1.
Calibrated simulation value and actual value.
4.3. Simulation
After calibrating the theoretical model, the authors conducted the numerical simulation and obtained a model process of China’s construction of the Silk Road Economic Belt, by which the authors analyzed China’s economic cooperation with the regions in the belt: Central Asia, South Asia, West Asia, and East Europe. This section considers the gradual change of the policy variables in (21) and (24) to observe the trade effects and welfare effects of different types of policies on the equilibrium solution. The simulation process in this part is implemented based on Python 3.8.3. All data was obtained from databases compiled by the National Bureau of Statistics of China and the World Bank.
4.3.1. Trade Liberalization Simulation
Trade liberalization in sustainable regional economic cooperation is reflected in the reduction of trade costs. In this part, this paper reduces the trade cost multiple from 100% to 0% in the calibrated model (China to local). This process is divided into 20 periods to complete. Of course, reducing to 0 is only a mathematical ideal value. Under normal circumstances, there is a fixed proportion of trade costs that cannot be reduced, such as transportation costs.
It can be seen in Figure 2, with the deepening the Silk Road Economic Belt cooperation, trade costs are continuously declining, China’s exports to the four regions have increased significantly. From (26), the authors know that the welfare of all regions will also increase. This is the core reason for trade liberalization. In addition, the increase in China’s trade with West Asia and East Europe is significantly higher than that with the other regions. This trend became more obvious after the tenth period. In terms of quantity, South Asia and East Europe will remain China’s main export destinations. Since the unit of trade volume calculated using Formula (18) and (24) is uncertain, there is no need to analyze the numbers on the longitudinal axis for the simulation results; only the comparisons among the four regions are analyzed.
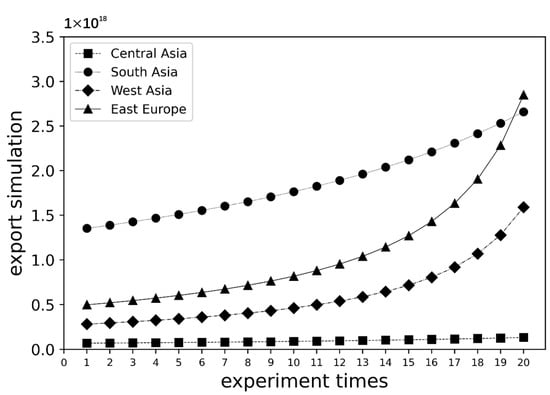
Figure 2.
Trade liberalization simulation results.
4.3.2. Technological Assistance Simulation
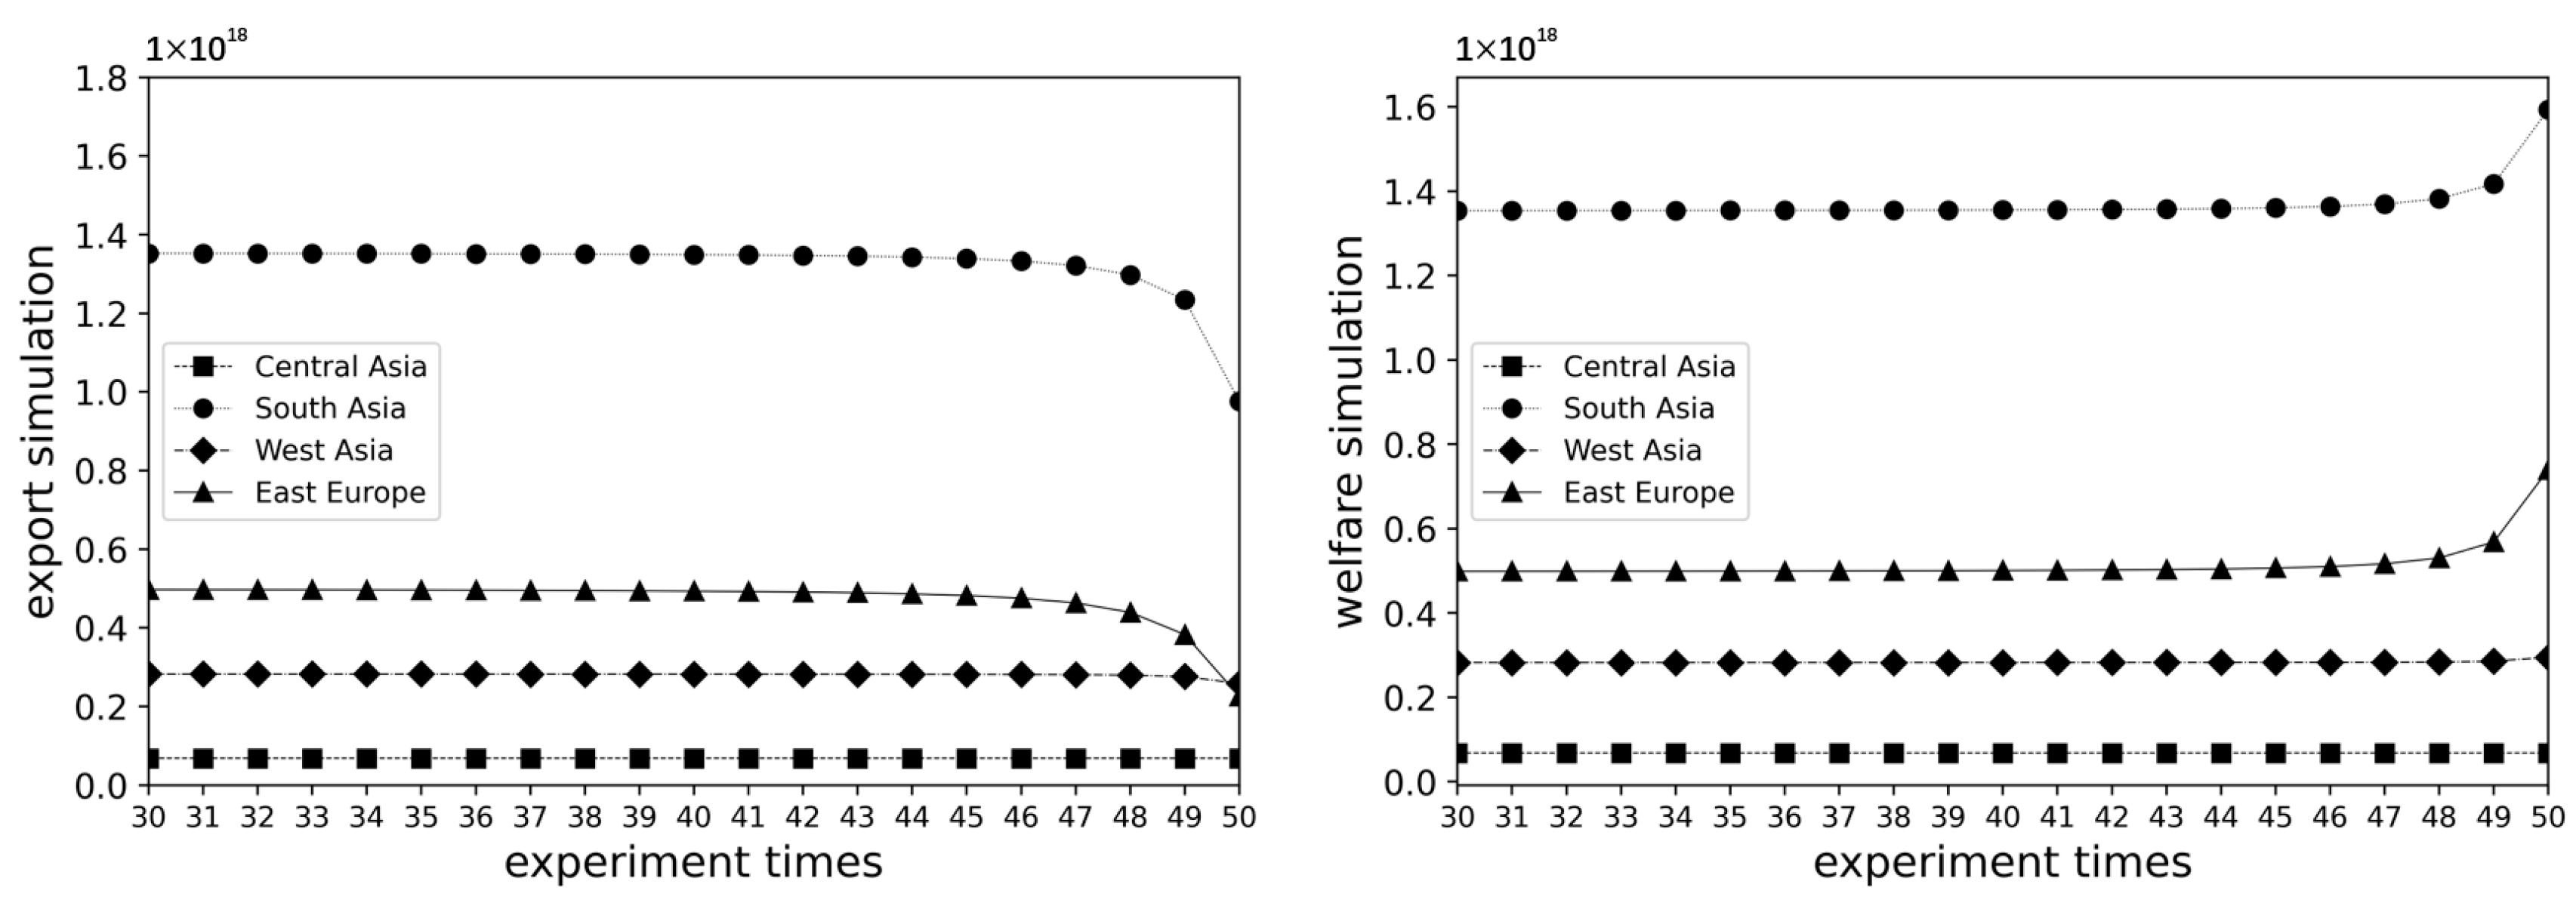
The technological assistance in sustainable regional economic cooperation will enhance the production technology of local companies. Therefore, the marginal costs of local companies will decrease. In this section, this paper reduces the local company marginal costs from 100% to 2%. Because of the zero-denominator problem, the degree of decline here is not as low as 0%, similar to trade costs. This process is divided into 50 periods to complete. Only the last 20 periods are reported here because the changes in the first 30 periods are relatively small. This means that technological progress may be a long-term process affecting product trade.
It can be seen in Figure 3, with the deepening of the Silk Road Economic Belt cooperation, that production technology of local regions is continuously increasing, and China’s exports to the four regions have experienced a small drop, but the welfare of all regions increased in the long term. This result is consistent with (28) and (29). When the local production technology improves, local consumers will consume more domestic products, which will slightly reduce China’s exports to the local area. However, increasing short-term trade flows is not the entire goal of economic cooperation. The core reason for the regional cooperation is the welfare growth of all regions.
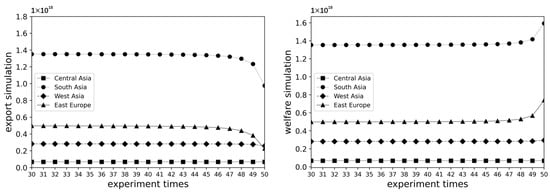
Figure 3.
Technological assistance simulation results.
4.3.3. Financial Assistance Simulation
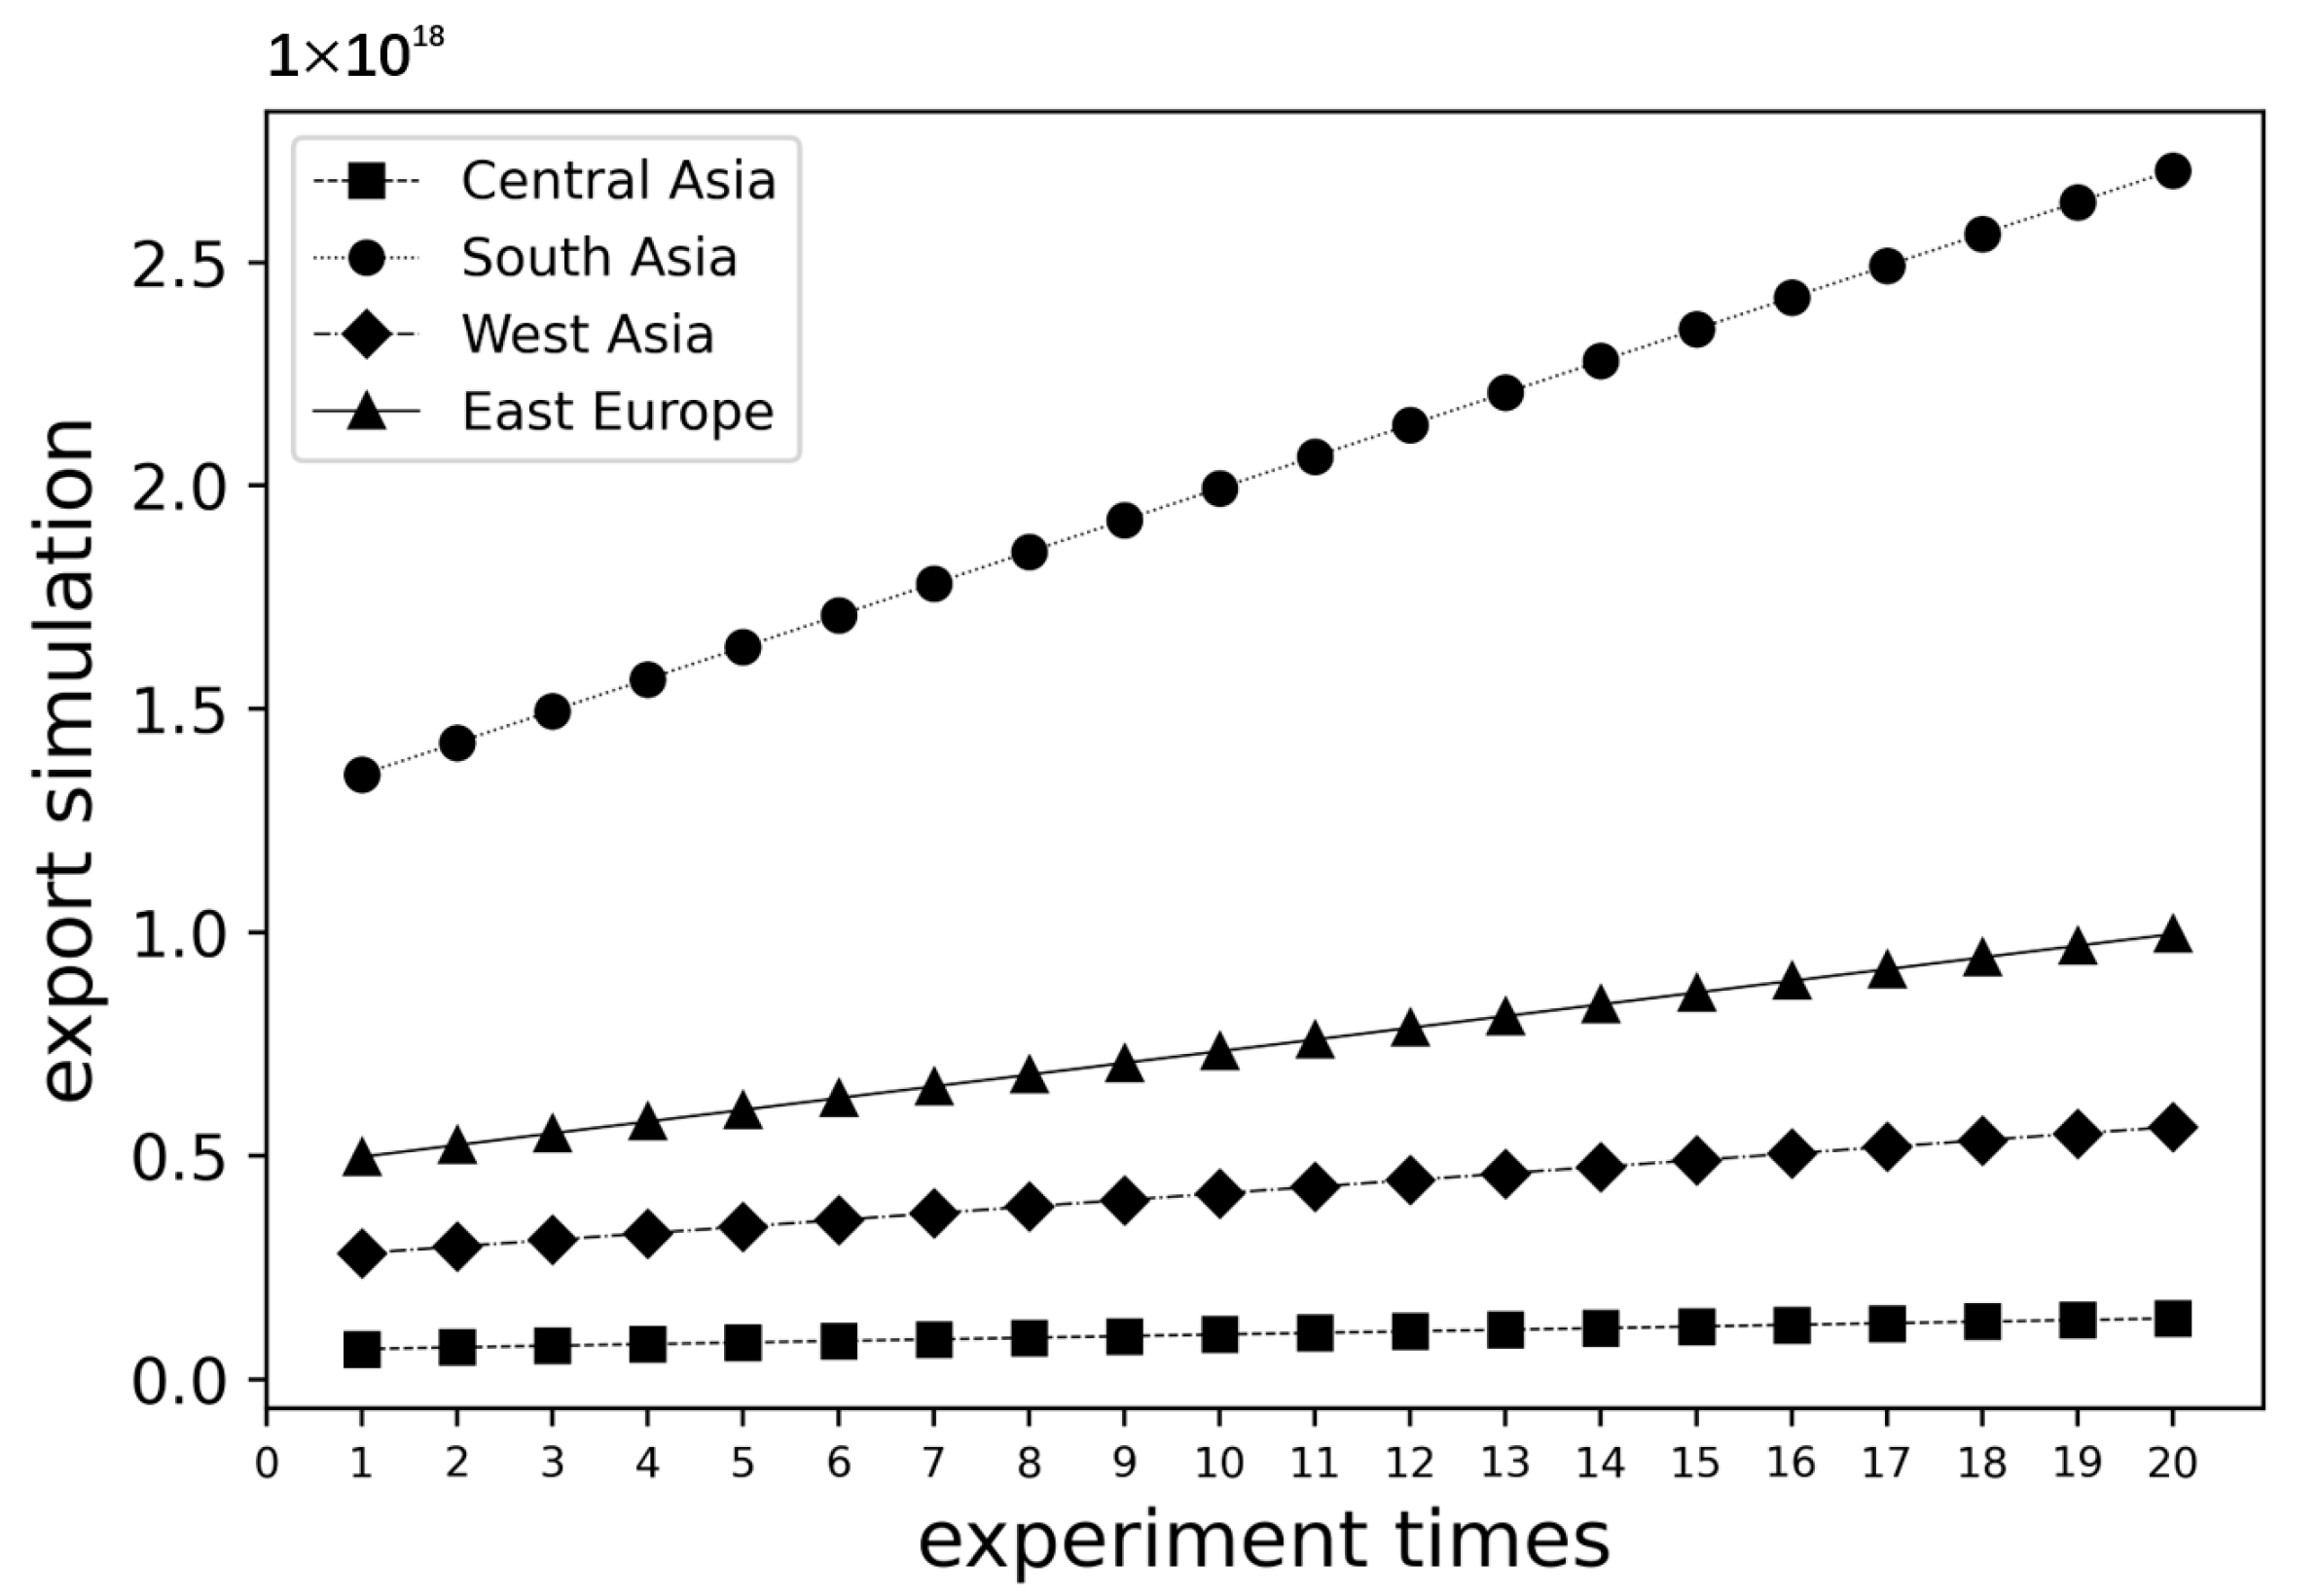
The impact of financial assistance may be the most direct. In the short term, financial assistance will increase the scale of the local economy. This will have a proportional impact on trade flows. This is also reflected in the simulation results. When the company’s available funds increased 100% in 20 periods, the trade flow produced a linear change. The simulation result of such trade flow also conforms to the form of gravity model.
It can be seen in Figure 4, with the deepening the Silk Road Economic Belt cooperation, that the international financial cooperation institutions will bring more funds to local companies, and China’s exports to the four regions increased proportionally. From (26), the authors know that the welfare of all regions will also increase linearly. If the authors want to interpret from the demand side, the change is because financial support reduces the financial pressure of local countries for infrastructure investment, which increases the consumption power of local countries. In the long run, the three aspects of assistance will form a synergy, and the trade prosperity and welfare growth in all regions will be achieved.

Figure 4.
Financial assistance simulation results.
4.4. Robustness of Simulation
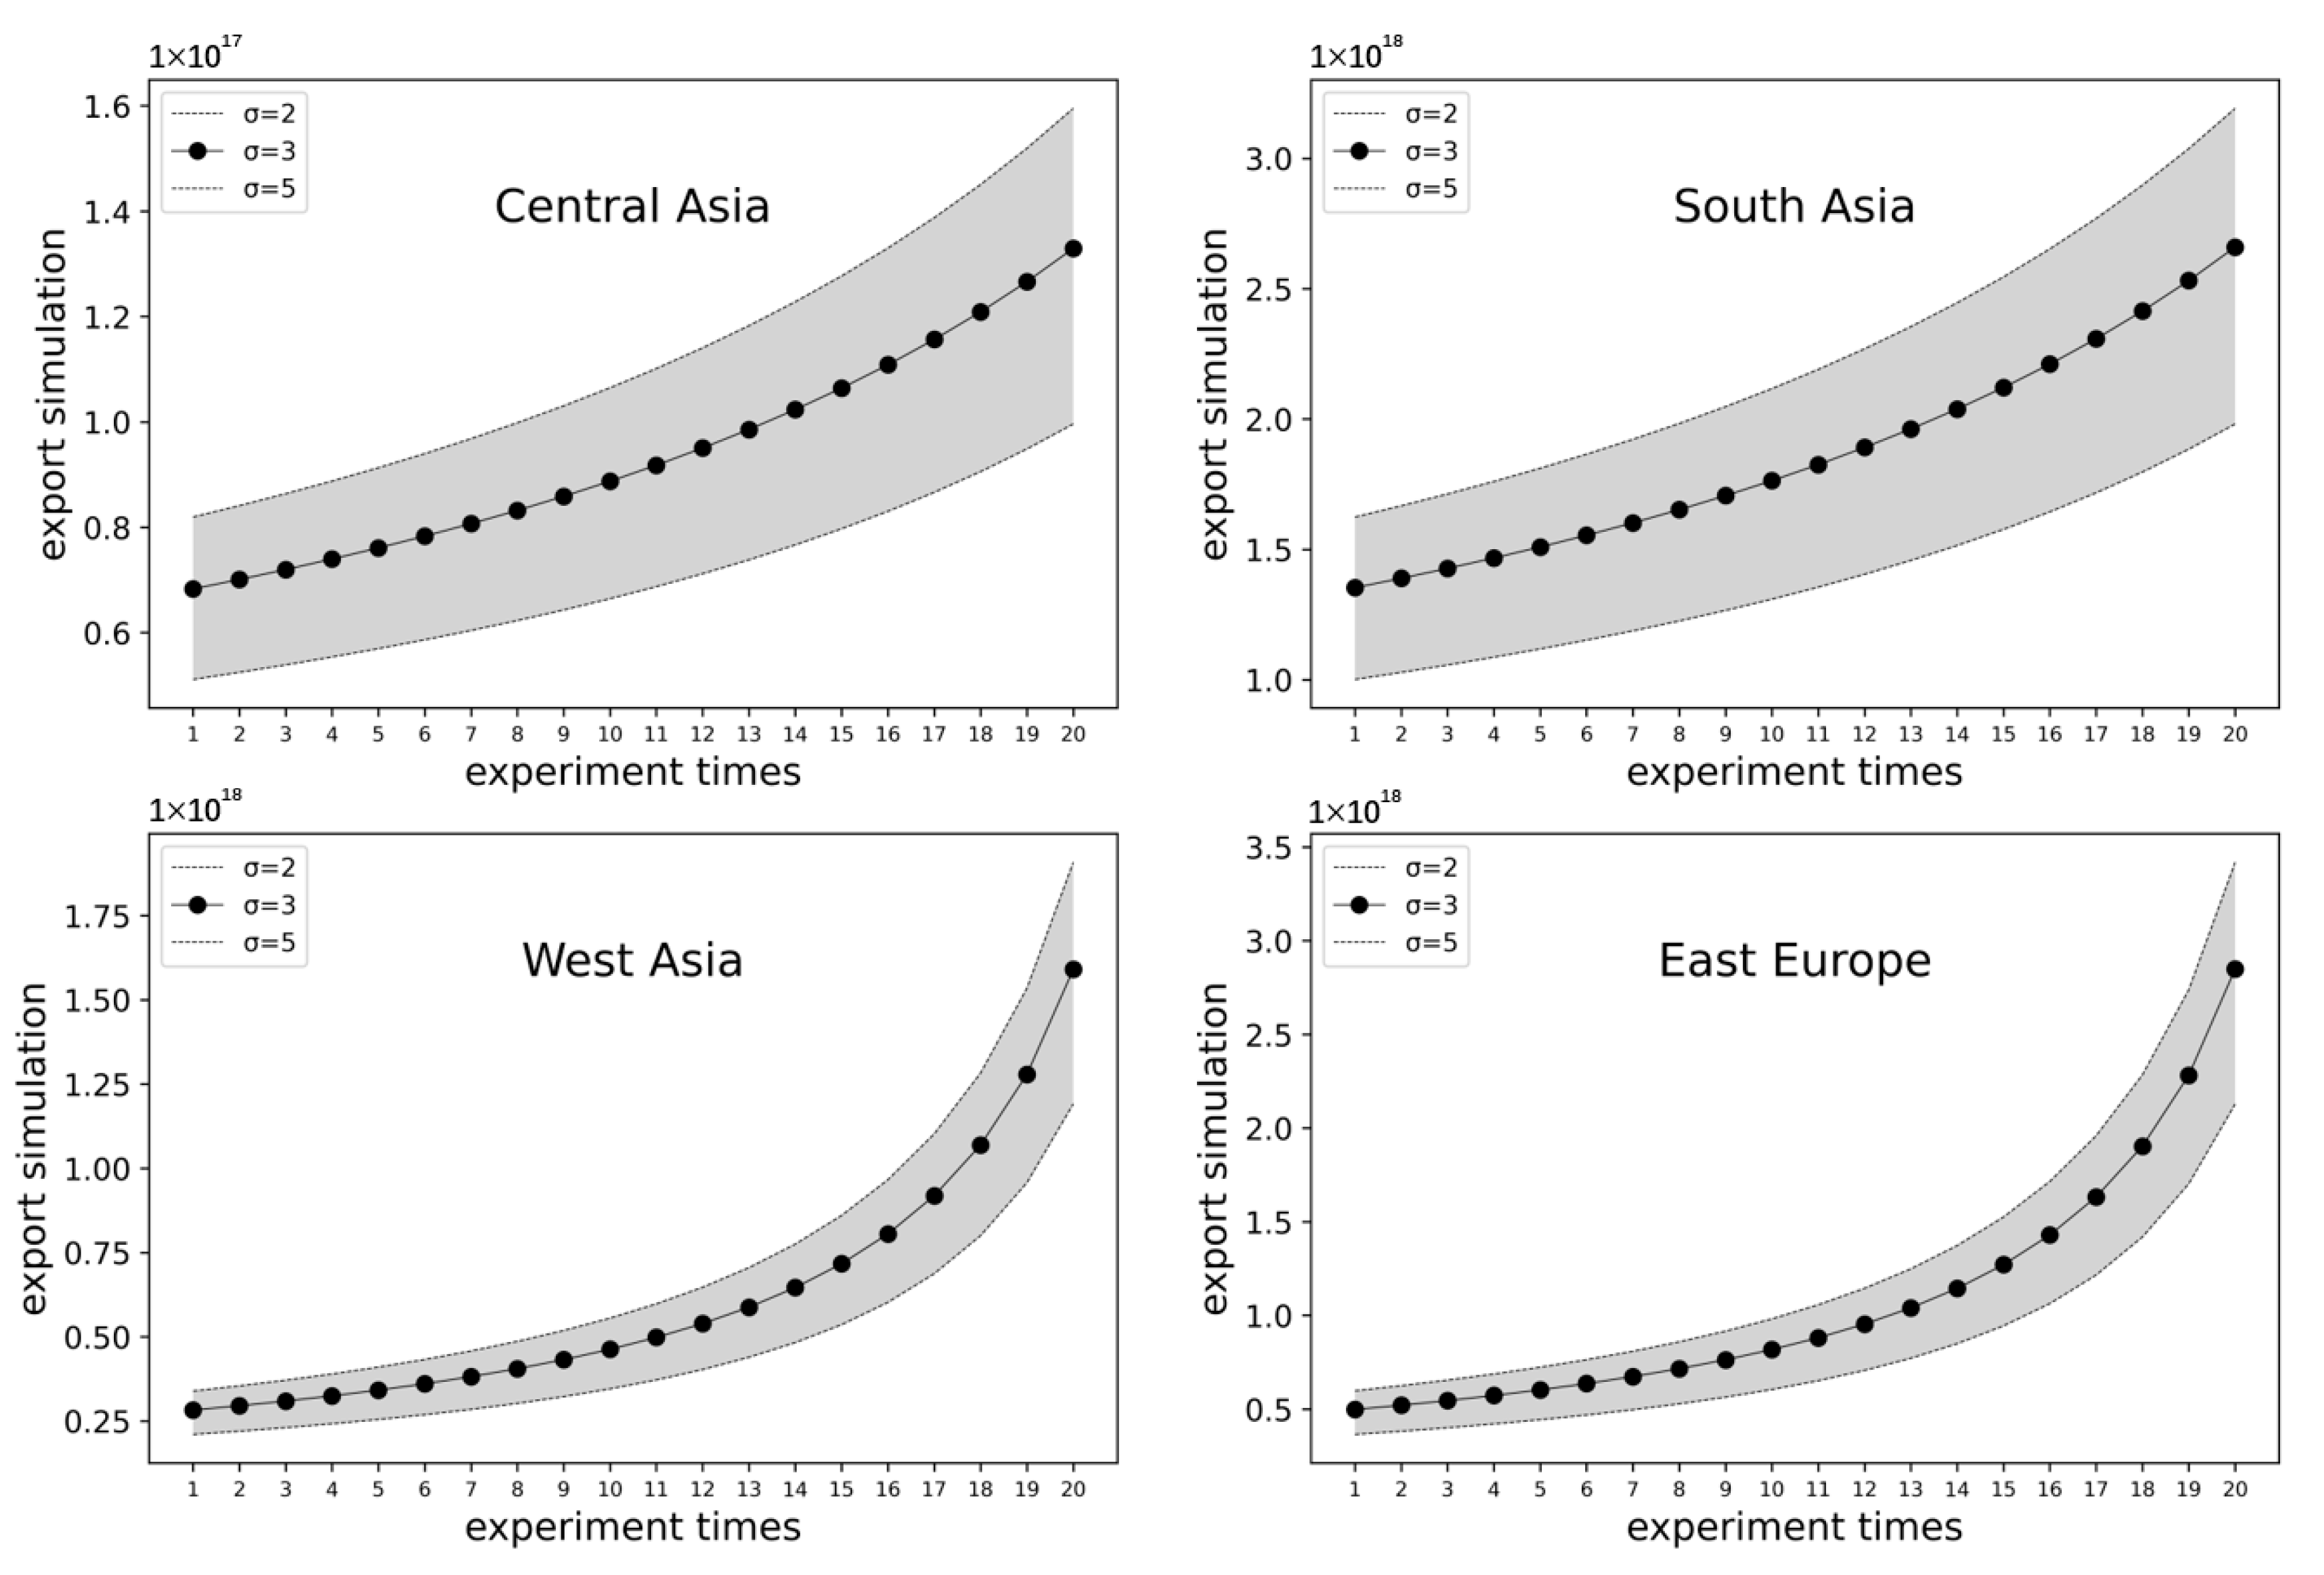
In addition to proper parameter numerical calibration, another key issue of numerical simulation is the sensitivity of parameter selection. In this part, the authors analyze the robustness of the vital elasticity parameter . It turns out that the special value of has nothing to do with the main propositions derived from numerical simulations. When the value is 2, 3, 5, the dynamic performance of trade flow in trade liberalization is consistent (trade costs also fell by 100% in 20 periods).
According to Figure 5, the trade flows of the four regions are still positively correlated with the process of trade liberalization, and this correlation does not change with changes in the elasticity value. Furthermore, the long-term trade liberalization effect in West Asia and Eastern Europe is still better. The curved surface of trade flows in these two regions bends upward to a greater degree. This is consistent with the results reported in Figure 2. Based on static quantity consistency and dynamic change consistency, the authors believe the calibrated model is robust.
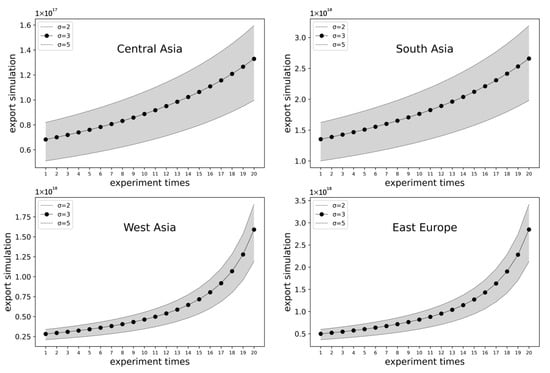
Figure 5.
Elasticity of substitution and simulation results.
4.5. Discussion
The size of the regional economy largely dictates the size of trade, as predicted by the gravity model. But as the distance decreases, this “natural” ordering may be broken (Figure 2 illustrates this). According to Equation (21), it can be seen that the effect of trade liberalization is not so obvious in regions that are already close to the host country (China), such as Central Asia and South Asia (). However, the effect of trade liberalization in Eastern Europe and West Asia, which are farther from the host country (China), will be more effective in the long run, and some regions may even reverse the regions that previously had the advantage of trade scale due to their own technological advantages (Figure 2). Unlike traditional trade effects analysis (Shi et al. [1]; Luo et al. [5]; Du and Zhang [6]; Macho-Stadler and Xue [7]; Baldwin and Jaimovich [8]), Figure 3 reports a special form of regional cooperation, where technical assistance will lead to a slight decline in trade with partners in this region, but more countries will participate in the cooperation (more Southern countries) because their national welfare has gone up. Therefore, technical assistance is an important policy for sustainable trade cooperation and is being increasingly used in South-South and North-South cooperation. Figure 4 also expands the traditional trade analysis to consider the short-term impact of financial aid on residents’ purchasing power. This policy can have a direct positive impact on both regional trade and national welfare. The numerical simulation results in this paper are supported by two facts: (1) Figure 1 shows that the model in this paper can simulate the historical regional trade changes well, and the mathematical structure of the model is reasonable. (2) Figure 5 shows that the conclusions of this paper are robust with respect to sensitive parameter selection, and the obtained results do not depend on particular parameter values.
Compared with existing RTA effect studies (Shi et al. [1]; Luo et al. [5]; Du and Zhang [6]; Macho-Stadler and Xue [7]; Baldwin and Jaimovich [8]), the biggest innovation of this paper is to highlight the sustainability of trade cooperation. The three types of policies with different conduction paths (see Equations (25)–(30)) can finally make all parties spontaneously cooperate for a long time in the form of affecting national welfare. The cooperation framework is therefore sustainable in the long term. The sustainability of such regional economic and trade cooperation is also an important part of sustainable development in the international perspective. If the authors further divide this model into polluting industries and clean industries or divide traditional production methods and green production methods within the industry, a new set of production functions will be generated, which will allow traditional sustainable development research to be performed. It is foreseeable that the new policy mix can also support green industry development or improve environmental indicators, but only if these policies should have a “green” bias, such as green technical cooperation and green financial support, and possible green tariff reduction.
5. Conclusions
Based on the differences in the economic characteristics of the regions, a regional equilibrium gravity model with multilateral resistance variable was constructed in this paper. Through the numerical simulation of the model after parameter calibration, the authors find: (1) Trade liberalization can greatly increase China’s exports to the four major regions, and the welfare of all regions will also increase (See Simulation 1). Specifically, the growth rate of China’s trade with West Asia and Eastern Europe was significantly higher than the growth rate of trade with other regions. However, in terms of quantity, South Asia and Eastern Europe will remain China’s main export destinations. (2) Technological cooperation and assistance can continuously improve local production technology, which, in turn, leads to a slight decline in China’s exports to the four major regions, but in the long run, the welfare of all regions has improved (See Simulation 2). When local production technology improves, local consumers will consume more domestic products, which will slightly reduce China’s exports to the local area. (3) With the deepening of Silk Road Economic Belt cooperation, international financial cooperation institutions will bring more funds to local enterprises. China’s exports to the four regions will increase proportionally, and the welfare of all regions will increase at the same time (See Simulation 3). This change is because financial support has reduced the financial pressure of local countries on infrastructure investment and increased the consumption capacity of local countries.
These results show that China is expected to strengthen economic and trade ties with countries in the Silk Road Economic Belt by reducing transaction costs and providing other international assistance (technological and financial) during the construction of the Silk Road Economic Belt. With any type of cooperation, the welfare of the entire region will increase, but there may be fluctuations in regional trade. The simulation parameters were all based on the calibration of actual data. It was confirmed that the simulation results have some explanatory power after comparing the results to actual data on trade. Considering the effect of spatial factors on cooperation, the authors find the policy effects of the construction of the Silk Road Economic Belt are different for all four regions. South Asia has the unique advantage of economic factors; both production technology and economies of scale are sufficient to support the constant development of the Silk Road Economic Belt hypothesis. At the same time, compared to Central Asia and West Asia, East Europe also has distinct advantages. Thus, regarding the level of cooperation unrelated to spatial factors, such as the field of scientific and technological research, culture, and education industries, etc., China should strengthen its cooperation with South Asia and East Europe. As for the level of cooperation related to space factors, China should strengthen cooperation with West Asia and East Europe.
Moreover, this paper has implications for sustainable development. Among the 17 Sustainable Development Goals (SDGs) proposed by the United Nations, this study involves at least (1) no poverty; (3) good health and wellbeing; (8) decent work and economic growth; (9) industry innovation and infrastructure; (16) peace, justice, and strong institutions; and (17) partnerships for the goals. First, trade cooperation has welfare effects and income effects, which means the improvement in SDG (1), (3), and (8). (Financial assistance can also stimulate the short-term economic and income growth). Second, technical assistance measures (such as infrastructure construction cooperation in the BRI) can help countries achieve SDG (9): industry innovation and infrastructure. Finally, long-term economic and trade cooperation is conducive to regional peace and the formation of strong multilateral institutions, which is related to SDG (16) and (17). Additionally, further discussion in this paper can involve SDG (7), affordable and clean energy, and SDG (12), responsible consumption and production.
This paper has made two main contributions to the existing literature on BRI and sustainable regional economic cooperation effect. First, it introduces related variables of trade costs, technological assistance, and financial assistance into a multilateral model. This is different from the current overview analysis of various measures (Huang [9]; Ramasamy and Yeung [10]). Second, the authors conduct a simulation analysis of the multilateral impact of BRI on the Silk Road Economic Belt, which has distinguished the trade effects and welfare effects of the three policy measures, and expands the trade and investment perspective of understanding the Belt and Road Initiative (Shi et al. [1]; Lin et al. [3]; Mahadevan and Nugroho [4]; Luo et al. [5]; Du and Zhang [6]).
In summary, with the continuous improvement of the global multilateral and bilateral trading system, the continuous decline of tariff and non-tariff trade costs between countries is a long-term trend. However, as a new form of regional cooperation, the BRI includes the objectives of assisting local infrastructure construction and technological progress in addition to trade cooperation. The analysis in this paper shows that these measures will also improve regional welfare. Due to the differences in the level of development of countries in this vast region, when analyzing the cooperation between countries, it is necessary to consider the combination of the above three policies in different forms. In the next stage of research, a more specific analysis can be made on the combined effects of different policies, which may rely on a more complex mathematical analysis framework.
Author Contributions
Conceptualization: J.W. and S.W.; methodology: J.W. and H.W.; software: J.W.; validation: J.W. and Y.S.; formal analysis: J.W.; investigation: S.W.; data curation: S.W. and H.W.; writing—original draft preparation: J.W.; writing—review and editing: S.W. and H.W.; visualization: H.W. and Y.S.; funding acquisition: J.W. and S.W. All authors have read and agreed to the published version of the manuscript.
Funding
This research was funded by the Humanities and Social Science Fund of Ministry of Education of China, grant number 20XJC790007; China Postdoctoral Science Foundation, grant number 2021M692013; Soft Science Research Program Funded by Shaanxi Provincial Science and Technology Department, grant number 2021KRM199; Scientific Research Program Funded by Shaanxi Provincial Education Department, grant number 19JK0701; Research Fund of Xi’an International Studies University, grant number 19XWD14.
Institutional Review Board Statement
Not applicable.
Informed Consent Statement
Not applicable.
Data Availability Statement
The data presented in this study are available on request from the corresponding author.
Acknowledgments
The authors would like to thank the anonymous reviewers for their constructive comments and valuable suggestions on this article.
Conflicts of Interest
The authors declare no conflict of interest.
References
- Shi, J.; Hu, X.; Li, Y.; Feng, T. Does the belt and road initiative reshape China’s outward foreign direct investment in ASEAN? Shifting motives of state-owned and private-owned enterprises. Singap. Econ. Rev. 2021, 66, 161–183. [Google Scholar]
- Viner, J. The Customs Union Issue; Oxford University Press: Oxford, UK, 2014. [Google Scholar]
- Lin, G.; Pei, J.; Zhang, J. Strategic competition in the Asian mega-regionalism and optimal choices. World Econ. 2018, 41, 2102–2128. [Google Scholar] [CrossRef]
- Mahadevan, R.; Nugroho, A. Can the Regional Comprehensive Economic Partnership minimise the harm from the United States–China trade war? World Econ. 2019, 42, 3148–3167. [Google Scholar] [CrossRef]
- Luo, C.; Chai, Q.; Chen, H. “Going global” and FDI inflows in China:“One Belt & One Road” initiative as a quasi-natural experiment. World Econ. 2019, 42, 1654–1672. [Google Scholar]
- Du, J.; Zhang, Y. Does one belt one road initiative promote Chinese overseas direct investment? China Econ. Rev. 2018, 47, 189–205. [Google Scholar] [CrossRef]
- Macho-Stadler, I.; Xue, L. Winners and losers from the gradual formation of trading blocs. Economica 2007, 74, 664–681. [Google Scholar] [CrossRef] [Green Version]
- Baldwin, R.; Jaimovich, D. Are free trade agreements contagious? J. Int. Econ. 2012, 88, 1–16. [Google Scholar] [CrossRef] [Green Version]
- Huang, Y. Understanding China’s Belt & Road initiative: Motivation, framework and assessment. China Econ. Rev. 2016, 40, 314–321. [Google Scholar]
- Ramasamy, B.; Yeung, M.C. China’s one belt one road initiative: The impact of trade facilitation versus physical infrastructure on exports. World Econ. 2019, 42, 1673–1694. [Google Scholar] [CrossRef]
- Tong, Y.-S. China’s outbound investment in Asean economies in three periods: Changing patterns and trends. Singap. Econ. Rev. 2021, 66, 105–142. [Google Scholar] [CrossRef]
- Tinbergen, J. Shaping the World Economy: Suggestions for an International Economic Policy; Twentieth Century Fund: New York, NY, USA, 1962. [Google Scholar]
- Hamilton, C.B.; Winters, L.A. Opening up international trade with Eastern Europe. Econ. Policy 1992, 7, 77–116. [Google Scholar] [CrossRef]
- Hassan, M.K. Is SAARC a viable economic block? Evidence from gravity model. J. Asian Econ. 2001, 12, 263–290. [Google Scholar] [CrossRef]
- Baier, S.L.; Bergstrand, J.H. Do free trade agreements actually increase members’ international trade? J. Int. Econ. 2007, 71, 72–95. [Google Scholar] [CrossRef] [Green Version]
- Baier, S.L.; Yotov, Y.V.; Zylkin, T. On the widely differing effects of free trade agreements: Lessons from twenty years of trade integration. J. Int. Econ. 2019, 116, 206–226. [Google Scholar] [CrossRef] [Green Version]
- Besedes, T.; Kohl, T.; Lake, J. Phase out tariffs, phase in trade? J. Int. Econ. 2020, 127, 103385. [Google Scholar] [CrossRef]
- Anderson, J.E.; Van Wincoop, E. Gravity with gravitas: A solution to the border puzzle. Am. Econ. Rev. 2003, 93, 170–192. [Google Scholar] [CrossRef] [Green Version]
- Anderson, J.E.; Borchert, I.; Mattoo, A.; Yotov, Y.V. Dark costs, missing data: Shedding some light on services trade. Eur. Econ. Rev. 2018, 105, 193–214. [Google Scholar] [CrossRef] [Green Version]
- Jacks, D.S.; Novy, D. Market potential and global growth over the long twentieth century. J. Int. Econ. 2018, 114, 221–237. [Google Scholar] [CrossRef]
- Chaney, T. Distorted gravity: The intensive and extensive margins of international trade. Am. Econ. Rev. 2008, 98, 1707–1721. [Google Scholar] [CrossRef] [Green Version]
- Arkolakis, C. Market penetration costs and the new consumers margin in international trade. J. Political Econ. 2010, 118, 1151–1199. [Google Scholar] [CrossRef] [Green Version]
- Donaldson, D. Railroads of the Raj: Estimating the impact of transportation infrastructure. Am. Econ. Rev. 2018, 108, 899–934. [Google Scholar] [CrossRef] [Green Version]
- Melitz, M.J.; Ottaviano, G.I. Market size, trade, and productivity. Rev. Econ. Stud. 2008, 75, 295–316. [Google Scholar] [CrossRef] [Green Version]
- Mayer, T.; Melitz, M.J.; Ottaviano, G.I. Market size, competition, and the product mix of exporters. Am. Econ. Rev. 2014, 104, 495–536. [Google Scholar] [CrossRef] [Green Version]
- Bahmani-Oskooee, M.; Bolhassani, M. Exchange rate uncertainty and trade between US and Canada: Is there evidence of third-country effect? Int. Trade J. 2014, 28, 23–44. [Google Scholar] [CrossRef]
- Cushman, D.O. Has exchange risk depressed international trade? The impact of third-country exchange risk. J. Int. Money Financ. 1986, 5, 361–379. [Google Scholar] [CrossRef]
- Krugman, P. Increasing returns and economic geography. J. Political Econ. 1991, 99, 483–499. [Google Scholar] [CrossRef]
- Feng, Z. Strategic transportarteries connecting transport arteries China to eurasia: Details of the area, route delineation and function of the new silk road economic belt. Sci. Front. 2014, 4, 79–85. [Google Scholar]
- Huang, W.; Gong, X. Empirical analysis on impact of international logistics performance of Silk-Road Economic Belt on China’s export of machinery and electronic products. J. Int. Trade 2014, 10, 56–66. [Google Scholar]
- Melitz, M.J. The impact of trade on intra-industry reallocations and aggregate industry productivity. Econometrica 2003, 71, 1695–1725. [Google Scholar] [CrossRef] [Green Version]
- Desmet, K.; Rossi-Hansberg, E. Spatial development. Am. Econ. Rev. 2014, 104, 1211–1243. [Google Scholar] [CrossRef]

Publisher’s Note: MDPI stays neutral with regard to jurisdictional claims in published maps and institutional affiliations. |
© 2022 by the authors. Licensee MDPI, Basel, Switzerland. This article is an open access article distributed under the terms and conditions of the Creative Commons Attribution (CC BY) license (https://creativecommons.org/licenses/by/4.0/).