Abstract
In the last decades of the 20th century, the patterns of urban shrinkage defined a worldwide phenomenon. They are visible in all developed regions, especially in Central and Eastern Europe, on the background of the economic growth trajectories and social health improvements. Despite this fact, the public discourse in a post-socialist country such as Romania is only focused on urban decline and its demographic dynamics sliding, when in fact urban shrinkage is more advanced, even to the point of becoming a selective phenomenon in developed countries such as The Netherlands. Our focus on urban shrinkage was driven by the fact that Romania can develop a policy framing regarding urban shrinkage, using example practices from a developed country such as The Netherlands. Moreover, it can learn how to deal with urban shrinkage effects by establishing certain differences which can cope with veritable lessons from both sides. This paper firstly investigates the urban shrinkage phenomenon observed in three cities in Romania and in three cities in The Netherlands. Secondly, it presents an analysis of demographic statistical data using the shift-and-share method to emphasize the persistence of urban shrinkage in the age structure of the total population of shrinking cities from both regions. Thirdly, it offers some lessons from both countries, finally presenting a mutual learning framework that can be applied to other regions in Europe.
1. Introduction
Urban shrinkage is a worldwide phenomenon, being a selective process with different shapes and structural intensities for each country [1]. Urban shrinkage is becoming a challenge not only in developed countries such as the USA, Germany, Japan, and China, but also in Central and Eastern European countries affected by the post-socialist transition such as Romania [2]. A ‘shrinking city’ can be defined as an urban area—a city, part of a city, an entire metropolitan area, or a town—that has experienced population loss, economic downturn, employment decline, and social problems as symptoms of a structural crisis [3]. Only in recent years has urban shrinkage triggered the attention of policymakers and planners who have associated shrinking cities with a set of unique challenges requiring alternative policy and planning strategies, imposing a new orientation from traditionally urban growth to supervising urban decline [4]. At present, the urban shrinkage phenomenon involves policy framing based on the concepts of learning and mutuality, embracing a real meaning in city-to-city partnerships. Municipal partnerships are identified as two main building blocks: (1) the existence of sufficient professional similarity between partners to establish a basis of genuine dialogue and trust; and (2) the existence of sufficient differences between two partners who have something to share [5,6,7,8].
In the literature, the urban shrinkage and shrinking city terms include two important variables: population loss and economic decline [9,10,11]. Population loss is the core indicator of urban shrinkage, involving demographic and socioeconomic processes and effects [12], while economic transformation is a symptom of urban shrinkage, encompassing new strategies and policies [13].
Indeed, when cities shrink, they share common elements in what can be characterized as a ‘shrinkage identity’ [12]. Shrinking cities are considered a young, crucial issue related to human sustainable development [14]. The phenomenon of shrinking cities is understood rather as a neutral process of urban development, which needs specific policies and strategies, mainly oriented to improving quality of life and preventing subsequent population loss [15].
The term ‘urban shrinkage’ is used to stress the fact that this phenomenon is a multidimensional process with multidimensional effects. Urban shrinkage involves economic, demographic, geographic, social, and physical dimensions that not only continue to evolve as a result of new global and local realities but also influence theories and research proffering diagnosis, prognosis, and remedies [12].
At present, urban shrinkage is defined as population loss and economic transformation with symptoms of a structural crisis, becoming a common phenomenon throughout the world [13]. Regarding this definition, the association between economic and demographic changes according to Bartholomae et al. (2016) includes the identification of four categories of urban development: shrinking cities (characterized by economic and demographic decline), smartly growing cities (characterized by economic growth and demographic decline), population magnets (characterized by economic stagnation and demographic growth), and growing cities (characterized by economic and demographic growth) [16]. Meanwhile, Hospers (2014) underlined the fact that urban shrinkage can be understood as a local manifestation of the interplay of one or more economic, spatial, demographic, and political forces. The demographic force determined by population decline affects not only the ‘hardware’ of cities (the visible, tangible, and countable (hence ‘hard’) aspects of a city), but also their ‘software’ (the norms and values of the local people and the ways in which they act and interact) and ‘mindware’ (the image of a city, being a crucial element of the urban fabric) [11].
Nevertheless, urban shrinkage has been seen as ‘the other facet of urbanization’, becoming a deductive path in countries which face urban and economic decline [17]. Additionally, urban decline can be a result of shrinkage and can cause not only a long-term economic recession, but also socioeconomic problems affecting the physical and spatial expansion of shrinking cities [18]. Although the appearance of shrinkage is fairy universal, the determinants of urban shrinkage are less obvious; it has a significant prevalence and persistence with different patterns from country to country [17].
All over the world, there are evident profound population losses reported in numerous old industrial locations throughout Europe and North America, but also in Japan, Australia, Russia, and other regions [1]. In the US, at least 35% of all US cities larger than 10,000 inhabitants shrunk between 1980 and 2010 [8]. In the European Union (EU), 20% of European cities experienced shrinkage between 1990 and 2010, whereas 883 cities have faced recent shrinkage [19]. In the current EU, 57% of cities and 54% of urban regions have faced population losses in recent years [20].
In The Netherlands, although the population is growing, the growing rate is fluctuating considerably; it has been declining since the 1960s, from 14% in 1960 to 4% in 2011 [21]. In The Netherlands, demographic and economic decline is more likely to occur in peripheral regions with a monofunctional economic structure such as the Achterhoek region, where the growth trajectory has stagnated since the year 1970, starting from 14.1% in 1970 and declining to 2.6% in 2020. This was due to a combination of a stronger aging process and a negative migration balance, meaning that young people who cannot find jobs (or education) move to areas where there are more opportunities [22].
In contrast to the relative growth of the population, for example, in The Netherlands, between 2019 and 2050, the overall urban population is projected to decrease in nine EU member states: Bulgaria (−1.4%), Portugal (−1.6%), Hungary (−1.7%), Lithuania (−2.7%), Italy (−3.1%), Romania (−8.6%), Poland (−10.3%), Greece (−16.7%), and Latvia (−17.7%) [23].
Romania is in the top tier of countries with the highest number of declining cities (small touristic towns, industrial towns, agricultural towns) and is predicted to lose about a quarter of its current population by 2050 [24].
Eastern Europe is one of the key laboratories for shrinking cities, while Romania is a particular case study. Romania is being confronted with a systemic crisis generated by a powerful disturbance of the structures inherited from the totalitarian period [25]. Hence, we can admit that the peculiarities of urban shrinkage in Romania are linked to demographic decline and out-migration in terms of a post-communist transformation including social, economic, demographic, and politic aspects. In the core region of Romania, the Transylvania region, according to the National Institute of Statistics, population numbers started to decline drastically between 1992 and 2011 due to low birth and fertility rates, a progressive aging process, and out-migration of the young population in search of better job offers [26].
With this research, we analyzed the urban shrinkage phenomenon in the shrinking cities of Doetinchem, Zutphen, and Winterswijk from the Dutch region of the Achterhoek, and in the shrinking cities of Turda, Petroșani, and Sighișoara from the Romanian region of Transylvania. By choosing these cities, we address the fact that the shrinking process is common not only to peripheral cities, but also to other categories of cities (see Table 1) [27,28].

Table 1.
Analysis of shrinking cities in Romania and The Netherlands.
We chose to analyze these shrinking cities in order to examine the existence of a pattern of shrinking process in a developed country such as The Netherlands and in a post-socialist country such as Romania, which is facing a major population loss and the lowest life expectancy of all EU countries [29].
The aim was to observe and analyze the urban shrinkage phenomenon in Dutch cities and Romanian cities based on demographic and economic aspects. Although there are clear differences regarding the development and spread of the urban shrinkage phenomenon in the cases of The Netherlands and Romania, we explored the experiences of Dutch society where the shrinkage phenomenon was identified much earlier, and policies were formulated in an incipient stage. We aim to draw the attention of policymakers in order to apply proper policies and strategies of urban shrinkage based on the lessons learnt from the case of The Netherlands. We also identify some causes and effects of urban shrinkage that are vital to analyze the shrinkage phenomenon in both countries.
In the future, the analysis of shrinking cities will provide certain demographic tendencies (i.e., population decline, less newborns, aging process, depopulation) and will expose a possible policy framing based on mutual learning.
2. Materials and Methods
Method and Data
Shrinking cities located in demographically shrinking regions represent a challenge which can be analyzed in isolation. However, looking at the correlation with a larger whole helps to establish a valuable interconnection between urban areas and regions.
We applied shift-and-share analysis (SSA) to reveal relative changes regarding the redistribution and redefinition of shrinking cities in the peripheral Dutch region of the Achterhoek and in the Romanian central region of Transylvania. This analysis was based on statistical data collected for the period 1998–2013 for the shrinking cities (Doetinchem, Zutphen, and Winterswijk) from the Dutch region of the Achterhoek and the census of the period 1992–2011 for the shrinking cities (Turda, Sighișoara, and Petroșani) from the Romanian region of Transylvania. The demographic data for the Romanian shrinking cities were collected from the National Institute of Statistics (INS), while for the Dutch shrinking cities, statistical data were collected from the Central Statistical Office (CBS) in The Netherlands. The chosen timeline of 1998–2013 for the Dutch cities is the most relevant for our analysis, where we can conclude that the total population evolution of the shrinking cities stabilized and then slowly decreased (as we mention in Section 3 at the end of the period). Meanwhile, for Romanian cities, the chosen timeline of 1992–2011 was based on a census which shows an undoubtful demographic declining trend in the total population evolution in the shrinking cities.
By using this analysis, we can observe ‘the flow’ (meaning the fluctuation of ups and downs) of urban shrinkage at the local and regional levels, so we can generate suitable policies for the case of Romania learning from the Dutch experience with respect to the shrinkage phenomenon. Taking into consideration the demographic trajectories of the total population evolution in the shrinking cities, we observed the existence of some common causes and effects of the shrinking process in the analyzed cities (as shown in Table 1).
Shift-and-share analysis is used by policymakers and researchers alike to decompose a trend change with a variable into within and between effects, intensive and extensive margins, or other comparable effects [30].
Shift-and-share analysis or ‘components of change analysis’ may be defined as a standardization method in which the difference between the value of a composed variable in a region and its norm variables in another region is decomposed into a few components that relate to differences in the variable in both regions. The most relevant norm in the analysis is the nation of which the regions are parts [30], but in our analysis, we considered the most relevant norm to be the regional level of which the urban areas are parts. In conclusion, this compositional aspect of the major differences between both regions is due to the repositioning of Romania to a free market after the post-socialist period.
As a method of evaluating input growth in the economic field, shift-and-share analysis has been most used as a means of organizing data, in order to generate employment projections within regions and to ascertain reasons for differential employment growth between regions [31,32]. Additionally, shift-and-share analysis is one of the most popular tools used in many areas, including in the analysis of regional economic growth and development [33,34,35,36,37,38,39,40], industrial development and manufacturing [41,42], employment and occupation growth [43,44,45,46,47,48], export performance [49,50], and industrial productivity [51,52,53].
With a slight reorientation, we used shift-and-share analysis in the demographic field to decompose a specific demographic change at the local level, and demographic changes at the regional level. We considered that ‘age cohorts’ represented by specific groups of inhabitants play a major role in this demographic change; in particular, the local mix of these groups can explain the local effect. Since shift-and-share is a decomposition technique widely used in regional studies [54], regarding our analysis, we compared the demographic dynamics of ‘age cohorts’ (i.e., young age cohort, working age cohort, and old adult age cohort) between three geographical units, namely, urban settlements, from the two regions. In the Romania case, we decomposed the shrinking cities in correlation with the total urban area of the Transylvania region as a larger whole.
Shift-and-share analysis consists of two measures, ‘share’ and ‘shift’. The share component or ‘mix effect’ measures a change at the local level influencing the change in the mix of indicators at the regional level [35]. The ‘shift’ or ‘local effect’ component separates an indicator and measures the change at the local level compared to the reference area.
The focus on age cohorts represents a local compositional aspect (‘shift’ or ‘local effect’) and ‘a selective one’ to indicate the shrinking process in urban areas. Additionally, in urban areas, other specific factors are identified which can be recognized as specific ‘local effects’ responsible for demographic dynamics. The ‘share effect’ is represented by demographic change in the total number of the population. By using shift-and-share analysis, we decomposed a comparative study regarding shrinking cities reported in shrinking regions to observe a peculiar model of urban shrinkage ongoing in the demographic change of age cohorts.
As we noted before, shift-and-share analysis measures relative changes; in our case, we focused on investigating the relative position of shrinking cities within the framework of shrinking regions. In the first instance, we explore two groups of spatial units: the local group of shrinking cities and the regional group of shrinking regions. Taking into consideration the geographic and economic aspects, there are certain differences between a developed country such as The Netherlands and a post-socialist country such as Romania. By using SSA, we can encompass some similarities in the demographic changes of the population age structure visible in shrinking cities related to shrinking regions as a larger whole.
3. Demographic and Economic Trajectories of Shrinking Cities
The phenomenon of urban shrinkage interacts side by side with the phenomenon of urban growth in a developed country such as The Netherlands. It is not surprising that, in Romania, urban areas have been facing a shrinkage phenomenon on the background of a declining scenario since the 1990s. This fact is mainly due to the general transition from communism to a post-communist society, and to the repositioning of the country in the European context. This general transition had a major impact on economic, social, and demographic factors as well as on the spatial structure of Romania.
In The Netherlands, urban areas are generally in a stage of growth and development, while in some cities, at the same time, the demographic structures are radically deteriorating due to the aging population, the low fertility rate, and the increase in the number of immigrants from other countries. Consequently, in Romania and The Netherlands, in the coming decades, the overall picture of urban planning will change substantially.
First, in order to analyze the meaning of the phenomenon of urban shrinkage, we mainly study the shrinking cities of Doetinchem, Zutphen, and Winterswijk in The Netherlands and the shrinking cities of Turda, Sighișoara, and Petroșani in Romania to observe how this phenomenon has different spatial implications at the demographic and economic levels (see Figure 1 and Figure 2). Additionally, considering the demographic changes that were identified in the SSA analysis, it is necessary to recommend some policies gathered from The Netherlands case for the Romania case.
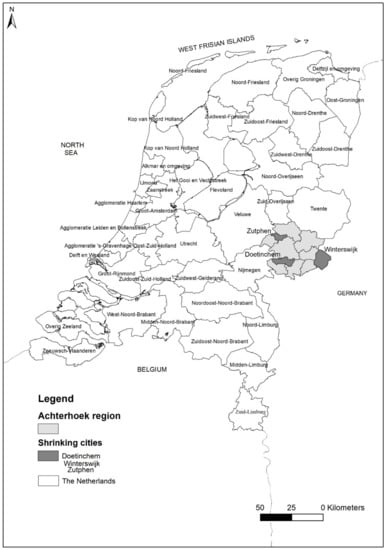
Figure 1.
Geographical position of the Achterhoek region (The Netherlands).
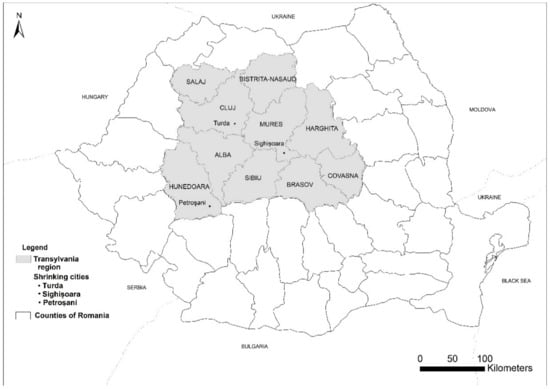
Figure 2.
Geographical position of the Transylvania region (Romania).
The Achterhoek region is situated in the eastern part of The Netherlands. It is a rural region, with many villages, hamlets, and a few small towns: Doetinchem, Winterswijk, and Zutphen. In recent years, the number of inhabitants has stopped growing, while the regional economy (driven by small, manufacturing industries and agriculture) has been performing below the national average [55]. The Transylvania region is situated in the central part of Romania, including 10 counties with urban areas (cities, towns) and rural areas (villages), where Turda is located in Cluj County, Petroșani is located in Hunedoara County, and Sighișoara is located in Sibiu County.
In this study, the term urban shrinkage is used to indicate a decreasing population number and economic transformation reflected in the GDP (economic growth). The analysis of shrinking cities is linked to the definition of urban shrinkage, which focuses on important aspects such as population loss and economic downturn. The time frame for this study is 15–20 years: for shrinking cities in The Netherlands, the analyzed period is 1998–2013, while the period of 1992–2011 was chosen for shrinking cities in Romania based on census data.
The Achterhoek region has been showing symptoms of urban shrinkage since the 1960s, and the Transylvania region began showing the presence of this late phenomenon in the territory at the end of the 20th century with various spatial consequences. In this sense, an increasing number of peripheral regions are facing this phenomenon, while the central regions have retained their status of urban growth and development. The shrinking cities of these two regions are currently facing changes in demographic decline, low fertility rates, high life expectancy, and the high number of older adults in recent years [21,56].
The analysis of shrinking cities implies demographic criteria such as demographic evolution of age groups to observe the changes in the demographic dynamics which are evident on a national scale, but on the local scale, we can see the resemblance of demographic tendencies (low birth and fertility rates, out-migration, increasing number of older adults).
On the other hand, in The Netherlands, the total population of the analyzed shrinking cities, according to the CBS, amounted to 122,882 inhabitants in 2013, and in the Achterhoek region, there was a total population of 400,727 inhabitants [22]. In the shrinking cities of the Achterhoek region, the average population growth ratio oscillated from 11% in 1998 to −2% in 2013.
However, the statistical data show that, in the shrinking cities, during the last few years, the total population has started to decrease slowly, and the CBS forecast reports that in 2040, the total population of the Achterhoek region will total 362,301 (−9.75%) (see Figure 3). If we look at the local scale of the shrinking cities from the Achterhoek region, we record a slight increase in the age groups for the analyzed period (1998–2013), which showed a slight decreasing trend at the end of the period (Figure 3, Figure 4 and Figure 5). The age structure of the total population showed the selectivity of the urban shrinkage process in the period 1998–2013, determining a slight increase in young people (0–14 years), with 7.80% in Zutphen city and 0.19% in Doetinchem city; an increase of 5.65% for the working age people (15–59 years) in Zutphen city and 4.63% in Doetichem city; and a major increase of 38.54% for the older adult group (65–85 years and above) in Doetinchem city and 30.96% in Zutphen city (Figure 3 and Figure 4) [57,58]. On the background of the declining total population, the shrinking process was less visible at the beginning of the period 1998–2006, and in the age population structure of the central city of Doetichem and the touristic city of Zutphen, and more evident at the end of the period starting with the year 2013.
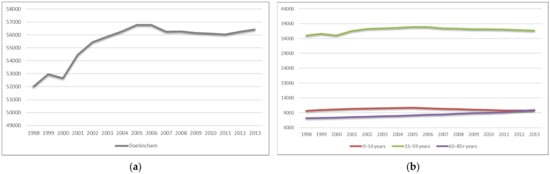
Figure 3.
(a) Total population evolution in Doetinchem city (The Netherlands); (b) age cohorts’ evolution in Doetinchem city (The Netherlands).
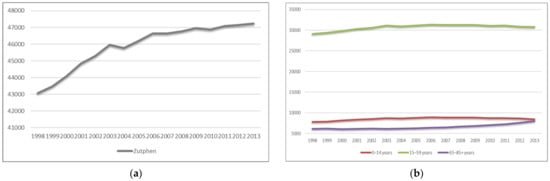
Figure 4.
(a) Total population evolution in Zutphen city (The Netherlands); (b) age cohorts’ evolution in Zutphen city (The Netherlands).
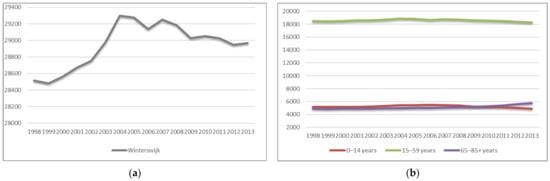
Figure 5.
(a) Total population evolution in Winterswijk city (The Netherlands); (b) age cohorts’ evolution in Winterswijk city (The Netherlands).
In the peripheral shrinking city Winterswijk, the urban shrinkage process showed evident symptoms of a declining population regarding the young age group (0–14 years) with −4.56% and the working age group (15–64 years) with −1.13%, and a slight increase in the older adult group (65–85 years and above) with 18.31% (Figure 5) [59].
In the shrinking cities analyzed, we found demographic trajectories characterized by low birth and fertility rates by a decreasing number of young people (0–14 years) at the end of the period 1993–2013, a progressive out-migration by a decreasing number of working age people (15–64 years) at the end of the period 1993–2013, and an inevitable aging phenomenon in the older adult age group (65–85 years and above) during the period 1993–2013.
In Romania, the total population of the analyzed shrinking cities, according to the INS, amounted to 149,760 inhabitants in 2011, and for the region, there was a total population of 41,404.73 inhabitants [60]. In the shrinking cities of the Transylvania region, the average population growth ratio oscillated from 1.82% in 1992 to 1.30% in 2011.
The demographic tendencies in the shrinking cities in the Transylvania region in the period 1992–2011 showed a steady increase in the number of older adults (65–85 years and above) with 61.44% in the shrinking city Petroșani, followed by Turda with 58.62% and Sighișoara with 40.48%, on the background of a declining total population (see Figure 6, Figure 7 and Figure 8). On the opposite side, the demographic decline was characterized by a major change in the age structure of the total population, with a longstanding trend of low birth and fertility rates reflected in the decreasing number of young people (0–14 years), with the steepest decline of −47.44% in the shrinking city Sighișoara, followed by Petroșani with −45.99% and Turda with −41.84% [61].
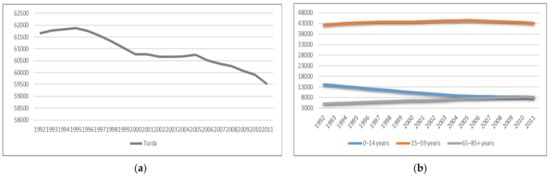
Figure 6.
(a) Total population evolution in Turda city (Romania); (b) age cohorts’ evolution in Turda city (Romania).
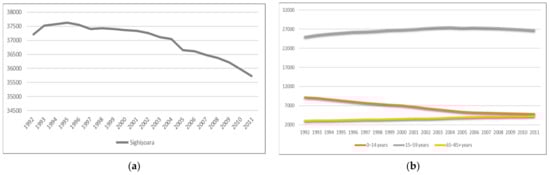
Figure 7.
(a) Total population evolution in Sighișoara city (Romania); (b) age cohorts’ evolution in Sighișoara city (Romania).
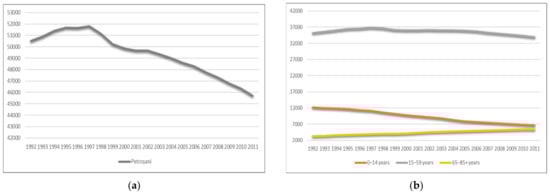
Figure 8.
(a) Total population evolution in Petroșani city (Romania); (b) age cohorts’ evolution in Petroșani city (Romania).
In the shrinking city Petroșani, the number of working age people (15–64 years) registered a decrease of −3.52%, while a slight increase was registered in Sighișoara with 6.65% and Turda with 1.92% (see Figure 6, Figure 7 and Figure 8). The drop in birth and fertility rates after the 1990s influenced the demographic trajectory of the young population (0–14 years) in the shrinking cities Sighișoara and Turda, and the increases in the median age (i.e., in urban areas in Hunedoara County including Petroșani city, the median age for men was 72 years, and for women 78 years, registered in 2018) [62] caused a rapid increase in the number of older adults in all three Romanian shrinking cities.
On the background of population decline since the 1990s and the profound post-socialist transformations, the age structure of the population in the Romanian shrinking cities has suffered major demographic changes linked to demographic transition and development disparities of urban areas.
Indeed, as we can observe (see Figure 6, Figure 7 and Figure 8), in the shrinking cities in the Transylvania region, the phenomenon of urban shrinkage started earlier than in the developed Dutch cities. The INS notes that, by 2060, the total population will decrease by as much as −30.5% [63].
The social and economic transformations oscillating in economic growth and demographic transition in the post-socialist period generated a powerful drive for the subsequent modification of the population’s demographic behavior in Central and Eastern European countries [64,65]. According to Eurostat, the GDP measures the value of the total final output of goods and services produced by an economy within a certain timeline. This includes goods and services that have markets (or which could have markets) and products which are produced by general government and non-profit institutions. However, it is a limited measure of economic welfare [66], although in our case, we can establish an overview regarding the economic situation of the countries analyzed in relation to the shrinkage phenomenon.
On a general basis, the GDP per capita in the time frame 1992–2011 increased in the developed regions of Romania [67], in particular as a result of Romania joining the European Union in 2007. However, on a local basis, in the Romanian shrinking cities, the economy contracted due to the consequences of the economic post-transition after 1989 in those cities (closing of large factories, privatization, disappearance of some industrial branches), thus leading to a downtrend in the local GDP contribution. In this order, the GDP per capita decreased in the timeline 1995–2007, followed, in some cases, by an ascending trend due to the share of foreign investments resulting from Romania joining the EU (until 2009), while afterwards, the GDP shrank again until the end of the case study period of 1995–2011. The last trend is particularly important, since it reflects the causality relationship between ‘economic change’ and ‘demographic change’, underlining that the demographic deterioration was followed by economic deterioration. We can observe the GDP annual per capita in million lei at the regional county level in Romania (Turda is included in Cluj County, Petroșani is included in Hunedoara County, and Sighișoara is included in Mureș County) (see Figure 9) [68].
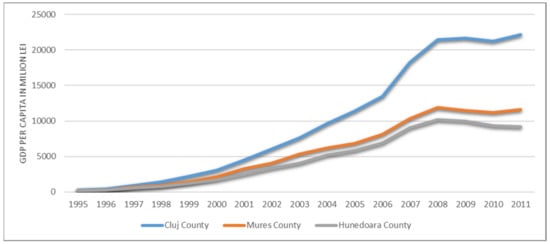
Figure 9.
The GDP per capita at the regional county level in 1995–2011 (Romania).
The Netherlands ranked number one on the annual DHL Global Connectedness Index in 2005, indicating the highest level of integration into the world economy. This integration renders the Dutch economy sensitive to developments elsewhere in the world. For example, in 2005, the income per capita increased by 4 to 6% due to the additional trade that resulted from the open internal market in the European Union [69]. However, in the last five years, apart from mid-2009 until early 2011, the GDP volume has decreased in certain regions due to the decreasing populations, especially in shrinking cities (see Figure 10). The GDP per capita showed an upward trend with cyclical fluctuations strongly correlated with the business cycle of the United Kingdom and the United States [70].
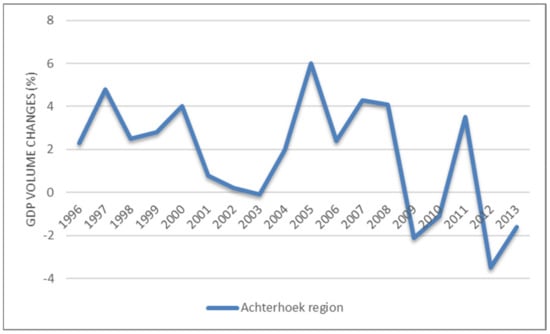
Figure 10.
The GDP volume changes (%) in the Achterhoek region (The Netherlands).
At the same time, in our analysis, the scale of urban shrinkage is not limited to urban agglomerations, metropolitan areas, or big cities. It begins to expand to a vast number of small cities located in peripheral regions as in The Netherlands or central regions as described in Romania.
The shrinking cities are redefining their position in demographically shrinking regions emphasized by an evident loss of population and inner GDP fluctuations. Since the population is lower in the shrinking cities, correlated with an increasing volume of GDP per capita at the regional level, it did not express a real economic situation at the local level. Additionally, the smaller populations induced a lack in goods and services and determined a limited measure for economic welfare and a negative trajectory of the GDP volume at the end of the period 2010–2013, with almost a −4% year-over-year decline (see Figure 10) [71].
4. Results
While using shift-and-share analysis, we examined demographic changes which occurred in the ‘age cohorts’ of the shrinking cities in the Achterhoek region and the Transylvania region. In these urban areas, we found symptoms of a certain phenomenon of urban shrinkage characterized by a decreasing number of inhabitants in general and a decreasing number of certain groups (i.e., dejuvenation) [72]. Hence, we determined that the shrinking cities in Romania had a higher percent rate change in demographic shifts than the shrinking cities in The Netherlands. Although a decreasing population appeared in the shrinking cities of both regions, the demographic dynamics of the ‘age cohorts’ demonstrated an increased rate in the older age cohort, especially in the Transylvania region. Some demographic changes in the ‘age cohorts’ were much more visible at the regional level, while fewer were visible at the local level, where we noticed a long-term trend of a decreasing number of young people and a higher number of older adults.
In the analyzed shrinking cities in the Achterhoek region, the demographic changes from the period 1998–2013 clearly showed an ongoing urban shrinkage phenomenon manifested at the local level. The urban shrinkage phenomenon materialized in demographic changes observed in the age structure of the total population of the shrinking cities. The increasing number of older adults (65–85 years and above) was evident in all sectors of the SSA analysis, with 21,098 at the local level and 22,586 at the regional level compared to the young and working age cohorts. Meanwhile, at the local and regional levels, demographic dynamics are relevant which can establish an overview regarding the long-term demographic tendencies of the analyzed age cohorts. Consequently, the share of young people is decreasing, with −5415, due to the smaller number of newborns, as is the number of working aged people, with −15682, due to the out-migration of young and educated people for job offers in other developed countries. The demographic changes in the age structure of the total population suggest a shrinking population by an upward shift in the ‘age cohorts’, determining a sharp increase in the number of older adults due to the noticeable aging process, and declining numbers of young and working aged people (see Table 2 and Figure 11). The urban shrinkage process of the population in the shrinking cities of the Achterhoek region is more visible at the local level, where the shrinking process started to manifest noticeable peculiarities for these specific age cohorts on the background of a declining total number of inhabitants.
Table 2.
Shift-and-share analysis in shrinking cities from the Achterhoek region, The Netherlands.
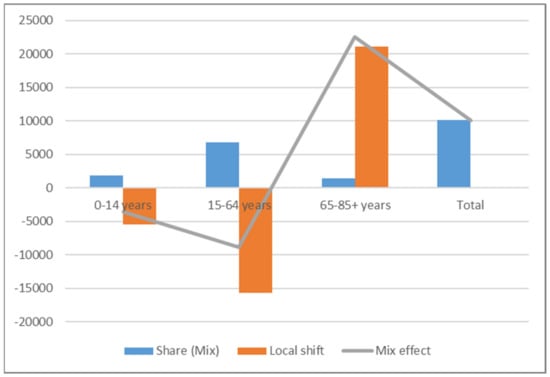
Figure 11.
SSA analysis of shrinking cities from the Achterhoek region (The Netherlands).
The demographic tendencies in the Dutch shrinking cities such as the low birth rates, out-migration of young people, and increasing number of older adults can also be identified in the shrinking cities in the Transylvania region. The urban shrinkage phenomenon noticed in the shrinking cities of Transylvania has become an issue, with spatial, demographic, and economic implications starting to manifest in 1992. However, the attention of Romanian policymakers regarding the shrinkage phenomenon in Romanian cities was only triggered in 2010, as a result of the research by Nadolut et al. [73]. After 2010, in Romania, studies about the shrinkage phenomenon did not appear until the year 2012 [24] and more recently [2,25,74]. Considering the fact that the shrinkage phenomenon has been present in Romanian urban areas since 1992, we analyzed Romanian shrinking cities choosing statistical data for the period 1992–2011, while we chose the period 1998–2013 for The Netherlands case.
In the analyzed shrinking cities in the Transylvania region from the period 1992–2011, we witness a drastic decline in young people (0–14 years) with −57,472, and an increasing number of older adults with 73,880 (see Table 3; Figure 12). This is because, in Romania, the population policy changes after 1990 brought an immediate decrease in fertility. The recorded low fertility after 1990 is not a strange phenomenon but a predictable trend, disturbed by the pro-natalist policies enforced between the 1960s and 1990s. Romania had the strictest abortion laws, limiting legal access to abortion to a few well-defined situations for all women and obstructing the access to contraceptive methods [75]. Consequently, the increasing number of older adults is a result of an upward shift in the age structure of the population. This is emphasized by the fact that the lower number of young people will determine a progressive aging phenomenon in the near future. The Romanian urban population entered a dramatic declining trajectory after 1994 due to the falling birth rates, emigration, deindustrialization, and ‘back to the village’ movement during the late 1990s, but also due to suburbanization, emigration, and the still very low birth rates following the year 2000 [2].
Table 3.
Shift-and-share analysis of shrinking cities in the Transylvania region, Romania.
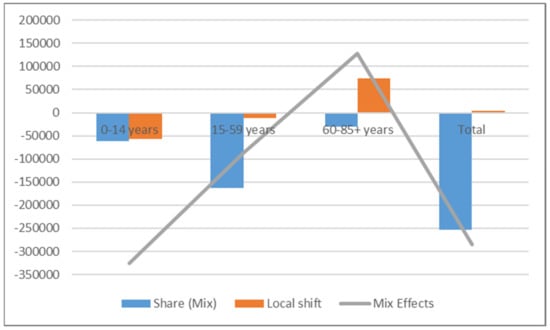
Figure 12.
SSA analysis of shrinking cities in the Transylvania region (Romania).
At the regional level, an irreversible decreasing trend in all age cohorts is evident, especially the higher declining numbers of working aged people, with −162663, because of an accelerated process of out-migration in EU countries (see Table 3; Figure 12). Ghețău (2012) stated that ‘soon after 1990 Romania witnessed a decline caused, on the one hand by a negative natural increase from one year to another and on the other hand by the increase of external migration. The decline intensified further when Romania joined the EU on 1 January 2007’ [76]. The gradual increase in the older adult group with 111.97%, compared to 20% at the regional scale, is due to immigration from the countryside to urban areas due to the improved health services provided in the cities.
As a comparative discussion to our SSA analysis, we noticed that the shrinking cities in the Achterhoek region just started to manifest peculiarities of a shrinking population due to changes in the age groups and total number of inhabitants towards the end of the analyzed period (2013). Meanwhile, the shrinking cities in the Transylvania region have been experiencing a long-term significative loss of population visible in all age cohorts of the population since 1992. The demographic age structure of the population has changed drastically, emphasizing an accelerated social-demographic process of aging which will further diminish the younger and working age cohorts in each shrinking city in the Transylvania region.
The symptoms and causes of urban shrinkage are similar in the shrinking cities from both regions, although the intensity of the urban shrinkage process is distinct depending on the starting period and the spatial configuration of each shrinking city. The SSA analysis clearly showed that the shrinkage phenomenon started earlier in urban areas of the Transylvania region and manifested with a larger intensity.
5. Discussion
In Eastern European countries such as Romania, the transition to a capitalist economy in the post-communist period had a drastic impact, reflected in a major reduction in the birth and fertility rates as a reaction to economic changes and strong deindustrialization due to increasing competition in a situation where traditional industries in these countries were losing their competitive status in the new economic reality [77]. In many of these countries, the resizing of the inflated public administration caused heavy job losses in these regions. The declining investments and job offers caused the working age people to leave these areas to find jobs elsewhere in Western European countries. Indeed, since almost the entire country of Romania was in the same position, hardly any regions could really gain from these migratory movements, especially labor movements. The loss of people was also not compensated by immigration, as has been the case in many Western European countries such as in The Netherlands [78]. This demographic development led to a reduction in profitability and tax income, resulting in a loss of offered services. This transition phase affected the former communist countries where the economy of these countries needed to reinvent itself to find a suitable place in the free market of Central and Western Europe.
The aforementioned issues attracted our attention because of the specific methodology of shift-and-share analysis used in the demographic field to draw on the background of economic changes and prominent population loss demographic changes to show an evident widespread phenomenon of urban shrinkage in both countries. Especially in Romania, the process of transition and repositioning is a particular one with different spatial implications and regional disparities. In these circumstances, a segment of the policy response is growth oriented at the regional level in the Transylvania region, as it is presented in the Regional Operation Program (ROP), including two important aims: increasing the social and economic importance of cities, and applying the principle of polycentric development [79]. On the other hand, structural reforms and policies referring to demographic changes are sliding as mentioned by Ghețau, V: we need ‘proper measures to stop the declining process of total population in Romania’ [80]. It is certain that the growth strategies (i.e., economic development, skill and infrastructure improvements, population stabilization) [81] barely interfere with the issue of urban shrinkage, as Bernt et al. [82] mentioned regarding the concern of dealing with the consequences of shrinkage as a separate strategy, not necessarily based on growth. These growth strategies have more affinity with policies developed in The Netherlands and in the Achterhoek region.
In the Achterhoek region, as in the shrinking regions in Western Europe, we found policy responses accepting the population decline and managing the consequences of this issue, combined with a modest attempt to promote some forms of ‘growth’ [82]. Even if this was the first traditional policy response, it was focused on economic growth, in order to promote the growth of the population [4]. The growth doctrine questioned the intensity of the shrinkage phenomenon considering an issue or an opportunity for reinvention [4]. The policies in most post-socialist regions can be described as trivializing shrinkage (‘doing nothing’) and countering shrinkage (‘fostering urban growth’) [11], while the policy response in the Achterhoek region is more oriented towards accepting shrinkage (‘mitigating the negative effects of shrinkage’) and utilizing shrinkage (‘taking advantage of urban shrinkage’) [11]. However, we need to focus not only on the traditional policies of growth—well established in The Netherlands and gaining increasing importance in the Romanian public discourse—but also on appealing to radical strategies that are more effective for the urban shrinkage phenomenon such as particular initiatives and civic engagement [11].
Romania can learn from The Netherlands not only to apply the growth policy with success but also to consider the implication of urban shrinkage in its policy making, as shown by our analysis. Since shrinkage in Transylvania is a deeper matter and an ongoing process, it implies a reorientation from growth-oriented policies towards a mix of traditional growth policies and coping strategies which will emphasize the awareness of the urban shrinkage phenomenon. Informal methods of mutual assistance in the communities are present in Romanian society and in many parts of the Transylvania region; even if these are not always public, they raise major support for social and cultural engagement of the citizens. In this line of thought, we are aware that the more suitable policies for urban shrinkage which Romania can learn from The Netherlands are the strategies based on private initiatives. Additionally, the demographic tendencies mentioned in our research need, in Romania, a formal policy of growth based on The Netherlands’ experience to increase the birth and fertility rate, to boost more foreign investments in order to offer jobs, and to rethink the aging population process not as an issue but as a possibility to improve public and private services such as health services and health assistance at home [83].
5.1. Policies and Strategies Learned from The Netherlands
The current policies in Romania are largely or predominantly geared towards a paradigm of growth.
This approach in Romania is inappropriate in shrinking cities because of the declining population and economic downturn. Policymakers and city planners need to rethink their approach; they have acknowledged the fact that the population in these cities is declining, but they need to learn how to manage shrinking cities or regions. Therefore, they need to learn from The Netherlands how to implement some appropriate policies focused on anticipating and dealing with demographic decline in order to combat shrinkage or manage shrinkage in the shrinking cities or regions, such as [84]
- Housing policy;
- Policies on retail trade;
- Labor market policies;
- Business location policies;
- Spatial-economic policies.
The housing policies are based on the strategy of reinvention and redevelopment, referring to reducing and transforming the existing housing stock [84]. In shrinking regions, municipalities try to attract new or ‘part-time’ residents by relaxing the regulations governing the use of houses. This means, for example, that empty houses may be used as second homes, or that an agricultural building may be used as a residential or commercial property [84].
The labor market policies are focused on promoting labor participation and productivity by stimulating innovation, rather than on increasing the size of the potential labor force by attracting new residents. Since the shrinking cities or regions are affected by population loss, it is recommended to focus on how to do more with fewer people, rather than on how to attract new residents, in particular in the 20 to 65 age group (the potential labor force). On behalf of this strategy, The Netherlands municipalities are stimulating business and knowledge institutes to develop joint education programs so that the competences of the available labor force better match current and future labor requirements (i.e., educational programs in the healthcare and welfare sectors, the increase in the retirement age) [84]. In this respect, the focus is to stimulate those economic sectors that match the competences of the current potential labor force or that may benefit from the projected demographic changes [84].
The policies on retail trade are focused on moderating ambitious retail trade plans, encouraging a greater focus on redevelopment and demolition, encouraging regional coordination, and anticipating future demographic developments in time. The business location policies are based on redeveloping the business locations in the shrinking regions by coordinating construction, demolition, and redevelopment plans for residential, shopping, and business locations, not only preventing intraregional competition for the same residents and businesses, but also preventing unprofitable spatial investments and empty buildings (i.e., an active development company is collaborating with local authorities to attract new businesses to the region). Cross-border business locations are also being built, and attempts are being made to improve cooperation between business locations through joint estate management or by encouraging companies to make use of each other’s waste products [84]. In shrinking cities, policymakers are trying to develop patterns of new economic sectors such as tourism and recreation in order to strength their economic structure and to match the competences of the current population (i.e., Zeeland). Additionally, the smaller population in shrinking cities can lead to a reduced demand for business locations. In order to embrace the suitable policies for managing shrinkage under the condition of demographic decline in shrinking cities, policymakers attempt to match supply or demand to the new situation. The spatial-economic policies are based on public–private cooperation and on achieving regional cooperation by extending partnerships and involving not just government organizations, but also public organizations and the business community. The local government officials need to make collaborative efforts based on regional coalitions and to encourage the relevant parties to abandon practices focused on growth [85].
5.2. Mutual Learning and Informal Policies
Urban shrinkage, considered a multidimensional phenomenon [19,85,86], is not only analyzed at the global scale but also at the local scale, developing a body of know-how on city-to-city cooperation [4,87,88,89,90].
Mutual learning is understood as learning by both involved parties [3]. In The Netherlands, all strategies and policies regarding urban shrinkage are linked not only to the strength of local governance but also to knowledge exchange and mutual learning in local governance through municipal partnerships [6,7,8,91,92]. Most municipalities in The Netherlands are engaged in city-to-city partnerships, with some municipalities also developing policies based on supporting civil society initiatives [3]. However, at present, governance and planning approaches have moved towards the involvement of civil society—that is, those people living and working in an area who hold shared patterns of beliefs [55,93,94,95,96]. Therefore, the strategies required for tackling the shrinking process involve many actors and need a dialogue between individuals and institutions with public responsibilities, and ‘users of the city’ to successfully govern and plan for shrinkage. We can assume that the sustainable future of these areas can be guaranteed only if civil society is involved [97].
The Netherlands works in partnership with civil society organizations (CSOs) by engaging in strategic dialogue on goals and results, exchanging knowledge and using each other’s networks. The Netherlands supports 10,372 civil society organizations in more than 60 countries. In 2018/2019, 7377 initiatives were taken to inform and mobilize people and to engage in dialogue with authorities. This helped influence 1481 laws, policies, and standards to ensure they foster more inclusive and sustainable development [98].
A viable partnership is provided by Eurodite, a Dutch company which in 2014 founded an office in Bucharest supporting European cities by unlocking the power of communities, culture, heritage, and societal challenges as ‘software’ for sustainable area transitions [99].
On the basis of city-to-city partnerships, we explored the differences between the two regions to share the local shrinking process with its intensity and effects which affect most of the total population.
In the Romanian case, the shrinking cities are not included in policies and strategies as an important and distinct matter because this phenomenon is mainly related to the overall population decline that started after 1990 [2].
In Romania, after the 1990s, political and economic conditions changed dramatically, and urban development faced a globalized and de-centralized economic shift. At present, the national public policies, especially the legislation, have an important impact in any field in Romania. As the city cooperation works for The Netherlands as a strategy for local governance, in Romania, the mutual aid units sustain the local governance. The mutual aid units are a category of non-profit organizations which operate based on the general legislation represented by Government Ordinance No. 26/2000 regarding the associations and foundations with the subsequent changes and completions, and of special normative acts depending on whether they are intended for the employees (Law No. 122/1996 regarding the juridical organization of the mutual aid units for the employees and of their unions) or for the seniors (Law No. 540/2002 regarding the mutual aid units for the pensioners) [100].
The purpose of these forms of organizations is to support and assist their members by granting loans at low interest rates; in addition, the mutual aid units for the seniors provide related social, cultural, and touristic activities [100].
The involvement of researchers regarding the shrinking process and the civil cohesion, especially from the people who are living in the shrinking areas, guarantee a position of debate to consider shrinking cities as an ordinary process. An important civil initiative in Romania is the ‘Shrinking Cities in Romania’ exhibition from 2016, which discussed the shrinkage of Romanian cities as a widespread phenomenon. Shrinking Cities in Romania is a pioneering initiative to raise awareness about an acute and pervasive, yet too little discussed matter, which is presented in an attractive and interactive formulation, aiming to create a positive perspective on a negative phenomenon. Shrinkage can be a vector for modernization and innovation, re-use, alternative resources, artistic creation, and reevaluation of interpersonal relationships [74].
Citizens in the shrinking region of the Achterhoek have a long tradition of self-organization and volunteering. Probably more than in other (shrinking) regions, governmental planning efforts and those of citizens have become increasingly intertwined and led to major changes in the institutional setting. These changes did not go unheeded: the Dutch national government recently declared the performance of citizen initiatives in the Achterhoek a prototype for innovative local governance in The Netherlands [55]. Additionally, in the Achterhoek region, the citizens are actively engaged in solving problems within their community, regionally referred to as ‘naoberschap’ or neighbor help tradition [89].
In the Achterhoek region, municipalities established new networks in which they tried to mitigate the effects of demographic decline together with public and private partners (e.g., housing cooperatives, educational institutions, regional businesses, and interest groups).
Additionally, municipalities experiment with outsourcing some of their tasks to local communities which actively make and implement plans to maintain livability via informal decision making [101].
These types of informal policies can also be adopted in Romania, at the regional level, to develop and implement plans to maintain the livability of shrinking cities by increasing the civic engagement and involving public and private partners.
6. Conclusions
On behalf of our analysis, we conclude that shrinking cities from both regions in The Netherlands and Romania are facing, in a distinct way, the urban shrinkage phenomenon, developing comparable patterns on the regional, and especially the local, scale. According to Găman et al. [102], the main common causes of shrinking cities in Romania seem to be the declining birth rate and population aging, and migration to wealthier metropolitan areas caused by high unemployment rates due to deindustrialization, or to the suburbs, all of which can be summarized as four major factors: deindustrialization, globalization, suburbanization, and population deficit. Meanwhile, in The Netherlands, structural economic factors related to globalization and economic restructuring are stressed in the explanation of why some cities and regions shrink and others grow [103]. Other factors are socio-demographic, socio-spatial, and political factors, although these are usually assigned a secondary role: ‘The causes of this urban decline are complex, but in many ways, they can be understood as socio-spatial manifestations of the forces of globalization. In most cases urban shrinkage is the effect of economic decline’ [104]. Although the causes are similar, the intensity of this process is different from city to city, establishing an imbalance between gradual urban growth and managing urban decline. In Romanian cities, a solid cause–effect relationship is evident, shown by deindustrialization impacting and accelerating the urban shrinkage [105].
Urban shrinkage not only affects the economy and demographic dynamics of a city but also reshapes the urban land use. The reshaping is more visible in demographic changes occurring in the age structure of the total population, characterized by an upward trend in the total population evolution (less young and skilled people) and an increasing number of older adults. The decreasing number of inhabitants is followed by a declining number of services and goods, increasing social-economic issues and sabotaging the social security.
The results of our research clearly show that the scale and intensity of the process of urban shrinkage require measures to be adopted to mitigate its unfavorable after-effects. This emphasizes that further urban population losses are predicted, which, in the situation of uncontrolled shrinkage and the accelerating aging process, could cause a series of urban disparities [106]. However, as revealed by our analysis regarding urban shrinkage, policies and strategies are undoubtful necessary to manage the challenges of the shrinking process. The issue of urban shrinkage requires strategies at the local level in Romanian shrinking cities to counteract its negative effects and to accept the shrinking process, noticing positive implications for its citizens. In addition, shrinking cities should [106]:
- Implement long-term specific policies that recognize the shrinking process as an irreversible issue and an ongoing process and treat it as a challenge or an opportunity for reinvention [106];
- Engage all private and public actors, i.e., the national government, local authorities and communities, enterprises, schools, the business community, and NGOs, to come up with common plans for dealing with urban shrinkage and demographic changes on the background of demographic decline;
- Engage residents in local initiatives similar to the local tradition of ‘naoberschap’ (neighbor help), being a part of the solution to declining services in shrinking regions [101].
In order to limit the negative influence of urban shrinkage and the poor demand for local services in Romania, it is imperative to mutually learn and apply the best practices regarding urban shrinkage identified in case of The Netherlands.
Author Contributions
All authors, R.Ț., Ș.D., A.M.C., F.P. and C.E.T., contributed equally to the research presented in this paper and to the preparation of the final manuscript. All authors have read and agreed to the published version of the manuscript.
Funding
This research received no external funding.
Institutional Review Board Statement
Not applicable.
Informed Consent Statement
Not applicable.
Data Availability Statement
Not applicable.
Conflicts of Interest
The authors declare no conflict of interest.
References
- Oswalt, P.; Rieniets, T. Atlas of Shrinking Cities; Hatje Crantz Publishers: Ostfildern, Germany, 2006; p. 160. [Google Scholar]
- Eva, M.; Cehan, A.; Lazăr, A. Patterns of Urban Shrinkage: A Systematic Analysis of Romanian Cities (1992–2020). Sustainability 2021, 13, 7514. [Google Scholar] [CrossRef]
- Reckien, D.; Martinez-Fernandez, C. Why Do Cities Shrink? Eur. Plan. Stud. 2011, 19, 1375–1397. [Google Scholar] [CrossRef]
- Hollander, J.B.; Pallagst, K.; Schwarz, T.; Popper, F.J. Planning shrinking cities. Prog. Plan. 2009, 72, 223–232. [Google Scholar]
- Van Ewijk, E. Mutual Learning in Dutch-Moroccan and Dutch-Turkish municipal partnerships. Tijdschr. Econ. Soc. Geogr. 2012, 103, 101–109. [Google Scholar] [CrossRef]
- Johnson, H.; Wilson, G. North-South/South-North Partnerships ‘Closing the Mutuality Gap’. Public Adm. Dev. 2006, 26, 71–80. [Google Scholar] [CrossRef]
- Johnson, H.; Wilson, G. Learning for Development: Development Matters; Zed Books: London, UK, 2009. [Google Scholar]
- Johnson, H.; Wilson, G. Learning and Mutuality in Municipal Partnerships and Beyond: A Focus on Northern Partners. Habitat Int. 2009, 33, 210–217. [Google Scholar] [CrossRef]
- Pallagst, K. Shrinking cities in the United States of America: Three cases, three planning stories. Future Shrinking Cities 2009, 1, 81–88. [Google Scholar]
- Hartt, M. The Prevalence of Prosperous Shrinking Cities. Ann. Am. Assoc. Geogr. 2019, 109, 1651–1670. [Google Scholar] [CrossRef]
- Hospers, G.-J. Policy Responses to Urban Shrinkage:From Growth Thinking to Civic Engagement. Eur. Plan. Stud. 2014, 22, 1507–1523. [Google Scholar] [CrossRef]
- Martinez-Fernandez, C.; Audirac, I.; Fol, S.; Cunningham-Sabote, S. Shrinking Cities: Urban Challenges of Globalization. Int. J. Urban Reg. Res. 2012, 36, 213–225. [Google Scholar] [CrossRef]
- Ma, Z.; Li, C.; Zhang, J. Understanding Urban Shrinkage from a Regional Perspective: Case Study of Northeast China. J. Urban Plan. Dev. 2020, 146, 05020025. [Google Scholar] [CrossRef]
- Wang, Y.; Lin, M.; Gao, J.; Zhou, Z. Fading Attraction of the Shrinking City: An Empirical Study. Sustainability 2021, 13, 11550. [Google Scholar] [CrossRef]
- Egorova, M. Shrinking Cities in The Netherlands. Master’s Thesis, School of Architecture and Humanities, University Milan, Milan, Italy, 2014. [Google Scholar]
- Bartholomae, F.; Nam, C.W.; Schoenberg, A. Urban shrinkage and resurgence in Germany. Urban Stud. 2016, 4, 2701–2718. [Google Scholar] [CrossRef]
- Haase, A.; Rink, D.; Grossmann, K.; Bernt, M.; Mykhnenko, V. Conceptualizing Urban Shrinkage. Environ. Plan. A 2014, 46, 1519–1534. [Google Scholar] [CrossRef]
- Lee, J.; Newman, G.; Lee, C. Predicting Detached Housing Vacancy: A Multilevel Analysis. Sustainability 2022, 14, 922. [Google Scholar] [CrossRef]
- Wolff, M.; Wiechmann, T. Urban growth and decline: Europe’s shrinking cities in a comparative perspective 1990–2010. Eur. Urban Reg. Stud. 2017, 25, 122–139. [Google Scholar] [CrossRef]
- Wiechmann, T.; Pallagst, K. Urban shrinkage in Germany and the USA: A comparison of transformation patterns and local strategies. Int. J. Urban Reg. Res. 2012, 36, 261–280. [Google Scholar] [CrossRef]
- OECD. Demographic Change in The Netherlands: Strategies for Resilient Labour Markets. Highlights. Available online: https://www.oecd.org/cfe/leed/Demo_change_netherlands_highlights.pdf (accessed on 15 February 2022).
- CBS. Population Dynamics; Birth, Death, and Migration per Region. 2021. Available online: https://opendata.cbs.nl/#/CBS/en/dataset/37259eng/table?ts=1647474706782 (accessed on 15 February 2022).
- Eurostat-European Statistics. Population Projections: Urban Growth, Rural Decline. Available online: https://ec.europa.eu/eurostat/web/products-eurostat-news/-/ddn-20210520-1 (accessed on 16 February 2022).
- Constatinescu, P.I. Shrinking Cities in Romania: Former Mining Cities in Valea Jiului. Built Environ. 2012, 38, 214–228. [Google Scholar] [CrossRef]
- Bănică, A.; Istrate, M.; Muntele, I. Challenges for the Resilience Capacity of Romanian Shrinking Cities. Sustainability 2017, 9, 2289. [Google Scholar] [CrossRef]
- INS–Institutul Național de Statistică/National Institute of Statistics. Social Trends. Available online: https://insse.ro/cms/sites/default/files/field/publicatii/social_trends.pdf (accessed on 16 February 2022).
- Rieniets, T. Shrinking Cities: Causes and Effects of Urban Population Losses in the Twentieth Century. Nat. Cult. 2009, 4, 231–254. [Google Scholar] [CrossRef]
- Döringer, S.; Uchiyama, Y.; Penker, M.; Kohsaka, R. A meta-analysis of shrinking cities in Europe and Japan. Towards an integrative research agenda. Eur. Plan. Stud. 2019, 28, 1693–1712. [Google Scholar] [CrossRef]
- Țăruș, R.; Dezsi, Ș.; Pop, F. Ageing Urban Population Prognostic between 2020 and 2050 in Transylvania Region (Romania). Sustainability 2021, 13, 9940. [Google Scholar] [CrossRef]
- Scarffe, C. Measuring Canada’s export performance in the United States using an unbiased shift-share. Growth Chang. 2021, 52, 1593–1607. [Google Scholar] [CrossRef]
- Oosterhaven, J.; Loon, J.V. Sectoral structure and regional wage differentials: A shift and share analysis on 40 Dutch Regions for 1973. Tijdschr. Econ. Soc. Geogr. 1979, 70, 3–16. [Google Scholar] [CrossRef]
- Casler, S.D. A Theoretical Context for Shift and Share Analysis. Reg. Stud. 1989, 23, 43–48. [Google Scholar] [CrossRef]
- Di Berardino, C.; Mauro, G.; Quaglione, D.; Sarra, A. Structural change and the sustainability of regional convergence: Evidence from the Italian regions. Environ. Plan. C Politics Space 2016, 35, 289–311. [Google Scholar] [CrossRef]
- Li, Q.; Kovacs, J.F.; Choi, G.H. High-technology employment growth in China: Geographic disparities in economic structure and sectoral performance. Economic Change and Restructuring. Econ. Change Restruct. 2021, 54, 1025–1064. [Google Scholar] [CrossRef]
- Foth, M.N. Long-Term Change Around SkyTrain Stations in Vancouver, Canada: A demographic Shift-Share Analysis. Geogr. Bull. 2010, 51, 37–52. [Google Scholar]
- Oguz, S.; Knight, J. Regional economic indicators: With a focus on sub-regional gross valued added using shift-share analysis. Econ. Labour Relat. Rev. 2010, 4, 64–105. [Google Scholar] [CrossRef]
- Hassan, M.K.H.; Rashid, Z.A.; Hamid, K. East coast economic region from the perspective of shift-and-share analysis. Int. J. Bus. Soc. 2011, 12, 79–88. [Google Scholar]
- Herath, J.; Gebremedhin, T.G.; Maumbe, B.M. A dynamic shift-share analysis of economic growth in West Virginia. J. Rural Dev. 2011, 6, 155–169. [Google Scholar]
- Chilian, M.-N. Evolution of regional and sub-regional disparities in Romania: A sectoral shift-share analysis. Rom. J. Econ. Forecast. 2012, 15, 187–204. [Google Scholar]
- Goschin, Z. Regional growth in Romania after its accession to EU: A shift-share analysis approach. Procedia Econ. Fin. 2014, 15, 169–175. [Google Scholar] [CrossRef]
- Kleynhans, E.; Sekhobela, M.J. Shift-share analysis of production in the manufacturing industry of South Africa’s southern district municipality. J. Financ. Econ. 2011, 4, 9–30. [Google Scholar] [CrossRef][Green Version]
- Mondal, W.I. An analysis of the industrial development potential of Malaysia: A shift-share approach. J. Bus. Econ. 2011, 7, 41–46. [Google Scholar] [CrossRef]
- Gabe, T.M. Growth of creative occupations in U.S. metropolitan areas: A shift-share analysis. Growth Chang. 2006, 37, 396–415. [Google Scholar] [CrossRef]
- Cörvers, F.; Meriküll, J. Occupational structures across 25 EU countries: The importance of industry structure and technology in old and new EU countries. Econ. Chang. Restruct. 2007, 40, 327–359. [Google Scholar] [CrossRef]
- Fotopoulos, G.; Kallioras, D.; Petrakos, G. Spatial variations of Greek manufacturing employment growth: The effects of specialization and international trade. J. Reg. Sci. 2010, 89, 109–133. [Google Scholar] [CrossRef]
- Kowalewski, J. Specialization and employment development in Germany: An analysis at the regional level. Pap. Reg. Sci. 2011, 90, 789–811. [Google Scholar] [CrossRef]
- Elburz, Z.; Gezici, F. Regional Development Policies and Industrial Employment Change in Turkey: A Shift Share Analysis (1992–2008); ERSA: Vienna, Austria, 2012; pp. 1–16. [Google Scholar]
- Herath, J.; Schaeffer, P.; Gebremedhin, T. Employment change in LDs of West Virginia: A dynamic spatial shift-share analysis. J. Rural Dev. 2013, 1, 99–105. [Google Scholar]
- Chiang, S. Shift-share analysis and international trade. Ann. Reg. Sci. 2012, 49, 571–588. [Google Scholar] [CrossRef]
- Cheptea, A.; Fontagné, L.; Zignago, S. European export performance. Rev. World Econ. 2014, 150, 25–58. [Google Scholar] [CrossRef]
- Le Gallo, J.; Kamarianakis, Y. The evolution of regional productivity disparities in the European Union from 1975 to 2002: A combination of shift–share and spatial econometrics. Reg. Stud. 2011, 45, 123–139. [Google Scholar] [CrossRef]
- Tiffin, A. European Productivity, Innovation and Competitiveness: The Case of Italy; IMF: Washington, DC, USA, 2014; p. 14. Available online: https://www.imf.org/external/pubs/ft/wp/2014/wp1479.pdf (accessed on 16 February 2022).
- Molnar, M.; Chalaux, T. Recent Trends in Productivity in China: Shift-Share Analysis of Labour Growth and the Evolution of the Productivity Gap; OECD Economics Department Working Paper No. 1221; OECD Publishing: Paris, France, 2015. [Google Scholar]
- Artige, L.; Van Neuss, L.A. New Shift-Share Method. Growth Chang. 2014, 45, 667–683. [Google Scholar] [CrossRef]
- Meijer, M.; van der Krabben, E. Informal institutional change in De Achterhoek region: From citizen initiatives to participatory governance. Eur. Plan. Stud. 2018, 26, 745–767. [Google Scholar] [CrossRef]
- Eurostat-European Statistics. Demographic Change in Europe—Country Factsheets: Romania. Available online: https://ec.europa.eu/eurostat/documents/10186/10994376/RO-EN.pdf (accessed on 16 February 2022).
- CBS—Central Bureau of Statistics. Population Dynamics; Birth, Death and Migration per Region (Doetinchem). Available online: https://opendata.cbs.nl/statline/#/CBS/en/dataset/37259eng/table?dl=68009 (accessed on 16 February 2022).
- CBS Statline—Central Bureau of Statistics. Zutphen Population. Available online: https://opendata.cbs.nl/statline/#/CBS/en/dataset/37259eng/table?dl=68007 (accessed on 16 February 2022).
- CBS Statline—Central Bureau of Statistics. Winterswijk Population. Available online: https://opendata.cbs.nl/statline/#/CBS/en/dataset/37259eng/table?dl=68008 (accessed on 16 February 2022).
- RPL 2011-Recensământul Populației și Locuințelor. Volumul I: Populația Stabilă (Rezidentă)-Structura Demografică/Population and Housing Census 2011. Volume I: Stable Population (Resident)-Demographic Structure. Available online: https://www.recensamantromania.ro/rpl-2011/rezultate-2011/ (accessed on 22 February 2022).
- INS-Tempo Online. Total Population Evolution. Available online: http://statistici.insse.ro:8077/tempo-online/#/pages/tables/insse-table (accessed on 16 February 2022).
- INS-Institutul Național de Statistică/National Institute of Statistics. Anuar Statistic al Județului Hunedoara/Hunedoara County Yearbook 2019. Available online: https://hunedoara.insse.ro/wp-content/uploads/2020/04/ANUAR_2019-1.pdf (accessed on 16 February 2022).
- INS-Institutul Național de Statistică/National Institute of Statistics. Proiectarea Populaţiei României, în Profil Teritorial, la Orizontul Anului 2060. Available online: https://insse.ro/cms/sites/default/files/field/publicatii/proiectarea_populatiei_romaniei_in_profil_teritorial_la_orizontul_2060.pdf (accessed on 22 February 2022).
- Sobotka, T. Re-emerging Diversity: Rapid Fertility Changes in Central and Eastern Europe after The Collapse of the Communist Regime. Population 2003, 58, 451–486. [Google Scholar] [CrossRef]
- Jemna, D.-V. Causality relationship between economic development and fertility in Romania on regional level. Procedia Econ. 2013, 20, 334–341. [Google Scholar] [CrossRef]
- Eurostat–European Statistics. Real GDP per Capita. Available online: https://ec.europa.eu/eurostat/databrowser/view/sdg_08_10/default/table?lang=en (accessed on 22 February 2022).
- Istrate, M. Economic growth and regional inequality in Romania. An. Univ. Din Oradea 2014, 26, 201–209. [Google Scholar]
- INS—National Institute of Statistics. Gross Domestic Product in the Fourth Quarter of 2011. Available online: https://insse.ro/cms/files/statistici/comunicate/pib/a11/pib_trimIVr2011.pdf (accessed on 22 February 2022).
- Van Steen, P.J.M.; Pellenbarg, P.H. Economic Decline and Social Security Benefits in The Netherlands. Tijdschr. Econ. Soc. Geogr. 2014, 105, 121–124. [Google Scholar] [CrossRef]
- Van den Berg, G.J.; Lindeboom, M.; Portrait, F. Economic Conditions Early in Life, and Individual Mortality. Am. Econ. Rev. 2006, 96, 290–302. [Google Scholar] [CrossRef]
- CBS-Central Bureau of Statistics. Economic Growth, GDP and Value Added by Region; National Accounts. Available online: https://opendata.cbs.nl/#/CBS/en/dataset/84361ENG/table?ts=1648290546603 (accessed on 16 February 2022).
- Stam, R. Strategy for Shrinkage: The Development of a Strategy to Accommodate and Stabilise Shrinkage in Delfzijl. Master’s Thesis, Delft University of Technology, Faculty of Architecture, Department of Urbanism, Delft, The Netherlands, 2011. [Google Scholar]
- Nadolu, B.; Dincă, M.; Luches, D. Urban Shrinkage in Timișoara, Romania; Shrink Smart: Timișoara, Romania, 2010. [Google Scholar]
- Constantinescu, P.I. Shrinking Cities in Romania; DOM Publishers: Berlin, Germany; Editura MNAC: București, Romania, 2019. [Google Scholar]
- Bradățan, C.; Firebaugh, G. History, Population Policies, and Fertility Decline in Eastern Europe. J. Fam. Hist 2007, 32, 179–192. [Google Scholar] [CrossRef]
- Ghețău, V. Drama Noastră Demografică: Populația României la Recensământul Din Octombrie 2011/Our Demographic Drama: Population of Romania at the Census of 2011; Compania: Bucharest, Romania, 2012. [Google Scholar]
- World Bank Group Romania Partnership—Country Program Snapshot. Available online: https://www.worldbank.org/content/dam/Worldbank/document/eca/Romania-Snapshot.pdf (accessed on 13 April 2022).
- Focus Migration. Available online: https://www.migrationinstitute.org/publications/netherlands-migration-profile-1/@@download/file (accessed on 13 April 2022).
- Benedek, J.; Varvari, Ş.; Litan, C.M. Urban Growth Pole Policy and Regional Development: Old Wine in New Bottles? In Regional and Local Development in Times of Polarisation; Palgrave Macmillan: Singapore, 2019; pp. 173–195. [Google Scholar] [CrossRef]
- Ghețău, V. Declinul Demografic si Viitorul Populatiei României/Demographi Decline and the Future of Romanian Population. Available online: https://apapr.ro/wp-content/uploads/2018/04/INCE_2007_Declinul_demografic_si_viitorul_populatiei_Romaniei.pdf (accessed on 13 April 2022).
- Martinez-Fernandez, C.; Kubo, N.; Noya, A.; Weyman, T. Demographic Change and Local Development: Shrinkage, Regeneration and Social Dynamics. OECD Report Local Economic and Employment Development (LEED) Programme 2012. Available online: https://www.oecdilibrary.org/docserver/9789264180468en.pdf?expires=1649934556&id=id&accname=guest&checksum=CC076B0E9F6AE93047BA5724CAFC5250 (accessed on 22 February 2022).
- Bernt, M.; Cocks, M.; Couch, C.; Grossmann, K.; Haase, A.; Rink, D. Policy Response, Governance and Future Directions. Shrink Smart Research Brief No. 2. 2012. Available online: https://www.intern.ufz.de/data/ResearchBrief2_17486.pdf (accessed on 22 February 2022).
- Dutch Policy. Available online: https://www.government.nl/topics/development-cooperation/the-development-policy-of-the-netherlands (accessed on 13 April 2022).
- Verwest, F.; van Dam, F. From combating to managing. Demographic decline in The Netherlands. In Policy Strategies for Current and Future Shrinking Cities; PBL: Den Hag, The Netherlands, 2012. [Google Scholar]
- Pallagst, K. Shrinking cities-a challenge for planning cultures. TPR Town Plan. Rev. 2010, 81, 1–6. [Google Scholar]
- Wiechmann, T.; Bontje, M. Responding to tough times: Policy and planning strategies in shrinking cities. Eur. Plan. Stud. 2015, 23, 1–11. [Google Scholar] [CrossRef]
- Hewitt, W.E. Cities Working Together to Improve Urban Services in Developing Areas: The Toronto-São Paulo Example. Stud. Comp. Int. Dev. 1999, 34, 27–44. [Google Scholar] [CrossRef]
- Tjandradewi, B.I.; Marcotullio, P.J.; Kidok, T. Evaluating City-to-city Co-operation: A Case Study of the Penang and Yokohama Experience. Habitat Int. 2006, 30, 357–376. [Google Scholar] [CrossRef]
- Bontenbal, M.C. Strengthening urban governance in the South through city-to-city cooperation: Towards an analytical framework. Habitat Int. 2009, 33, 181–189. [Google Scholar] [CrossRef]
- Van Lindert, P. Transnational Linking of Local Governments: The Consolidation of the Utrecht-León Municipal Partnership. Habitat Int. 2009, 33, 173–180. [Google Scholar] [CrossRef]
- Devers-Kanoglu, U. Municipal Partnerships a Learning–Investigating a Largely Unexplored Relationship. Habitat Int. 2009, 33, 202–209. [Google Scholar] [CrossRef]
- Van Ewijk, E.; Baud, I.S.A. Partnerships between Dutch Municipalities and Municipalities in Countries of Migration to The Netherlands: Knowledge Exchange and Mutuality. Habitat Int. 2009, 33, 218–226. [Google Scholar] [CrossRef]
- Boonstra, B.; Boelens, L. Self-organization in urban development: Towards a new perspective on spatial planning. Urban Res. Pract. 2011, 4, 99–122. [Google Scholar] [CrossRef]
- Healey, P. Transforming Governance: Challenges of Institutional Adaptation and a New Politics of Space. Eur. Plan. Stud. 2006, 14, 299–320. [Google Scholar] [CrossRef]
- Hospers, G.-J. Coping with shrinkage in Europe’s cities and towns. Urban Des. Int. 2012, 18, 78–89. [Google Scholar] [CrossRef]
- Ročak, M.; Hospers, G.-J.; Reverda, N. Civic action and urban shrinkage: Exploring the link. J. Urban Regen. Renew. 2016, 9, 406–418. [Google Scholar]
- Ročak, M.; Hospers, G.-J.; Reverda, N. Searching for social sustainability: The case of the Shrinking City of Heerlen, The Netherlands. Sustainability 2016, 8, 382. [Google Scholar] [CrossRef]
- Ministry of Financial Affair. Strengthening Civil Society. Available online: https://www.dutchdevelopmentresults.nl/2019/theme/civil-society (accessed on 2 March 2022).
- Eurodite. Eurodite Projects. Available online: https://eurodite.eu/projects/ (accessed on 2 March 2022).
- Cace, C.; Cace, S.; Cojocaru, Ș.; Sfetcu, L. Social Economy in Romania-Challenges and perspectives. Transylv. Rev. Adm. Sci. 2013, 40, 5–21. [Google Scholar]
- Meijer, M.; Ernste, H. Broadening the Scope of Spatial Planning: Making a Case for Informality in The Netherlands. J. Plan Educ. Res. 2019, 2019, 0739456X1982621. [Google Scholar] [CrossRef]
- Găman, M.S.; Bica, S.; Bădescu, S.; Branea, A.-M. Sustainability Analysis of Romanian Shrinking Cities. In Proceedings of the International Multidisciplinary Scientific Conference on Social Sciences and Art, SGEM2014, Albena, Bulgaria, 2–7 September 2014. [Google Scholar]
- Hoekveld, J.J.; Bontje, M. Intra-Regional Differentiation of Population Development in Southern-Limburg, The Netherlands. Tijdschr. Econ. Soc. Geogr. 2015, 107, 282–297. [Google Scholar] [CrossRef]
- Pallagst, K.; Martinez-Fernandez, C.; Wiechmann, T. Introduction. In Shrinking Cities: International Perspectives and Policy Implication; Pallagst, K., Wiechmann, T., Martinez-Fernandez, C., Eds.; Routledge: New York, NY, USA, 2014; pp. 3–13. [Google Scholar]
- Popescu, C. Deindustrialization and Urban Shrinkage in Romania. What Lessons for the Spatial Policy? Transylv. Rev. Adm. Sci. 2014, 10, 181–202. [Google Scholar]
- Jaroszewska, E.; Stryjakiewicz, T. Drivers, Scale, and Geography of Urban Shrinkage in Poland and Policy Responses. J. Urban Plan. Dev. 2020, 146, 05020021. [Google Scholar] [CrossRef]


Publisher’s Note: MDPI stays neutral with regard to jurisdictional claims in published maps and institutional affiliations. |
© 2022 by the authors. Licensee MDPI, Basel, Switzerland. This article is an open access article distributed under the terms and conditions of the Creative Commons Attribution (CC BY) license (https://creativecommons.org/licenses/by/4.0/).