Article

Taguchi Loss Function in Intuitionistic Fuzzy Sets along with Personal Perceptions for the Sustainable Supplier Selection Problem

Computer Engineering Department, Engineering Faculty, Igdir University, Igdir 76000, Turkey
Sustainability 2022, 14(10), 6178; https://doi.org/10.3390/su14106178
Submission received: 15 April 2022 / Revised: 11 May 2022 / Accepted: 17 May 2022 / Published: 19 May 2022
(This article belongs to the Section Sustainable Management)

Abstract

:
Sustainability, a new interdisciplinary paradigm, can be defined as a standard in terms of economic, environmental and social awareness of a company. In many applications, theoretical sustainability models considering the importance of three aspects equally differed from models used in practice. A sustainable supplier selection problem generally contains many conflicting information and the imprecise decision makers’ knowledge, and decision makers can judge suppliers based on their first impression. Hence, in this study, a sustainable supplier selection problem of a plastic packaging company in Turkey is taken into account under an expert-based model and a theorical-based model for three scenarios which consider personal perceptions of decision makers. First, an intuitionistic fuzzy set-based method is applied to the problem using two different distance measurement approaches, namely, fuzzy normalized Euclidean distance and the Taguchi loss function, for which an alternative method is proposed. Then, suppliers are ranked and the validity of the results is also checked using the Pearson product–moment correlation coefficient. The results indicate that (i) the personal perception of decision makers has an inevitable impact on results, (ii) the proposed approach can capture the associated uncertainties embedded in decision makers and fuzzy environment, and (iii) there is a disparity between the theory and the reality of sustainability.

1. Introduction

Over the last two decades, sustainability has become a critical factor in financial interests and market reputation for many organizations [1]. Sustainability also leads to economic, environmental and social awareness, which improves the operations of any company [2]. These three factors are equally taken into account to maintain sustainability in theory whereas, in reality, development in environmental, economic and social factors cannot be managed in the same manner. Based on the literature, it is clearly seen that real-world applications do not emphasize the three pillars equally. Generally, in most research, the economic factors are emphasized more than others and the weight of the economic factors is more significant than the weight of the environmental and social factors [3,4,5]. This fact should not be overlooked and it is necessary to examine how the situation will be when these three factors are kept in equal importance in applications.
In addition, the supplier selection process is one of the operations which can support the success of a company, managing expectations of both the suppliers and the company. Integrating sustainability into the supplier selection process is a challenging and essential issue to engage suppliers in their organizational structures [6]. Sustainable supplier selection (SSS) is an integration of several factors (social, economic and environmental aspects) into the process of supplier selection, and the SSS problem can be categorized as a multi-criteria decision-making (MCDM) problem due to its nature, which adheres to social, economic and environmental aspects. Owing to emphasizing the importance of working with the right suppliers, many MCDM approaches have been applied to supplier selection problems within the context of sustainability [7]. In the literature, MCDM approaches can be found either in an individual form or integrated with another approach to solve sustainable supplier selection problems in a variety of fields, such as the automotive industry or the food industry (detailed in Section 2).
The decision-making process has an uncertain nature which can consist of a lack of information and decision makers’ subjective judgments and, because of this, fuzzy set theory introduced by Zadeh has been preferred to solve various sustainable supplier selection problems formed as MCDM problems. The fuzzy set theory is used to deal with the uncertainty [8]. In the literature, there have been several extensions of fuzzy numbers proposed to improve the fuzzy structure and to extend the specific research fields. In this work, intuitionistic fuzzy set, which focuses not only on a degree of membership but also a degree of non-membership, is used for selecting the best sustainable supplier of a plastic packaging company in Tekirdag, Turkey. The proposed overall method using intuitionistic fuzzy sets investigate two distance measurement approaches: (i) the intuitionistic fuzzy normalized Euclidean distance and (ii) Taguchi loss function proposed as an alternative measurement.
Taguchi loss function is also known as “Quality Loss Function” defined by Taguchi in order to measure the total loss of a product from raw materials to the end product in a manufacturing process environment [9]. In general, Taguchi loss function is used in the assessment of quality activities for organizations. The Taguchi loss function, which is used to compute the total resources wasted, is thought of as an alternative way and can be used in intuitionistic fuzzy sets because of its features which pertain to both a degree of membership and a degree of non-membership. It is suggested to use the Taguchi loss function in calculating the scores according to the distance of the results found from the best in intuitionistic fuzzy sets. Currently, there are limited studies that integrate Taguchi loss functions into a multi-criteria decision-making approach to improve them, such as an integration of Taguchi loss functions and analytical hierarchy process (AHP) [10,11]; an integration of Taguchi loss function, TOPSIS and AHP [12]; an integration of Taguchi loss function, best–worst method (BWM) and VIKOR technique [13]. To the best of the author’s knowledge, this is one of the first studies applying Taguchi loss function to intuitionistic fuzzy sets in multi-criteria decision-making problems.
In addition, MCDM processes depend on expert evaluations, and many expert evaluations are associated with their perceptions rather than the facts. This situation may cause undesirable ambiguity and, in the literature, there are few studies which concern the validity of the decisions of decision makers. Based on the literature, personal perception is involved in investigating the behavior patterns of consumers, buyers and suppliers. Most studies have also been based on surveys of respondents with a certain level of experience, which may not be conducive to discovering the behavioral mechanism of potential buyers. In terms of the supplier selection process, the influence of personal perception is essential to choosing appropriate suppliers. The experience of experts has also had a significant impact on the evaluation of vendors. Understanding the reasons behind their behaviors lies at the heart of responses to suppliers. The interaction between buyers and suppliers also has a direct effect on business relationships [14]. Most studies in the sustainable supplier selection have focused on only criteria determined by decision makers without considering their personal perceptions. Therefore, in this study, three scenarios are created and, in one of them, these behavior patterns have been investigated in order to understand the perceptions of decision makers and, in turn, in order to process their negative consequences.
In this study, an expert-based model and a theorical-based model are proposed using intuitionistic fuzzy sets along with two different distance measurement approaches: the intuitionistic fuzzy normalized Euclidean distance and Taguchi loss function. In order to evaluate the personal perception of decision makers, three different scenarios are also formed for these models and are applied to a sustainable supplier selection problem of a plastic packaging company as a real-world problem. The main objectives of this study can be listed as follows:
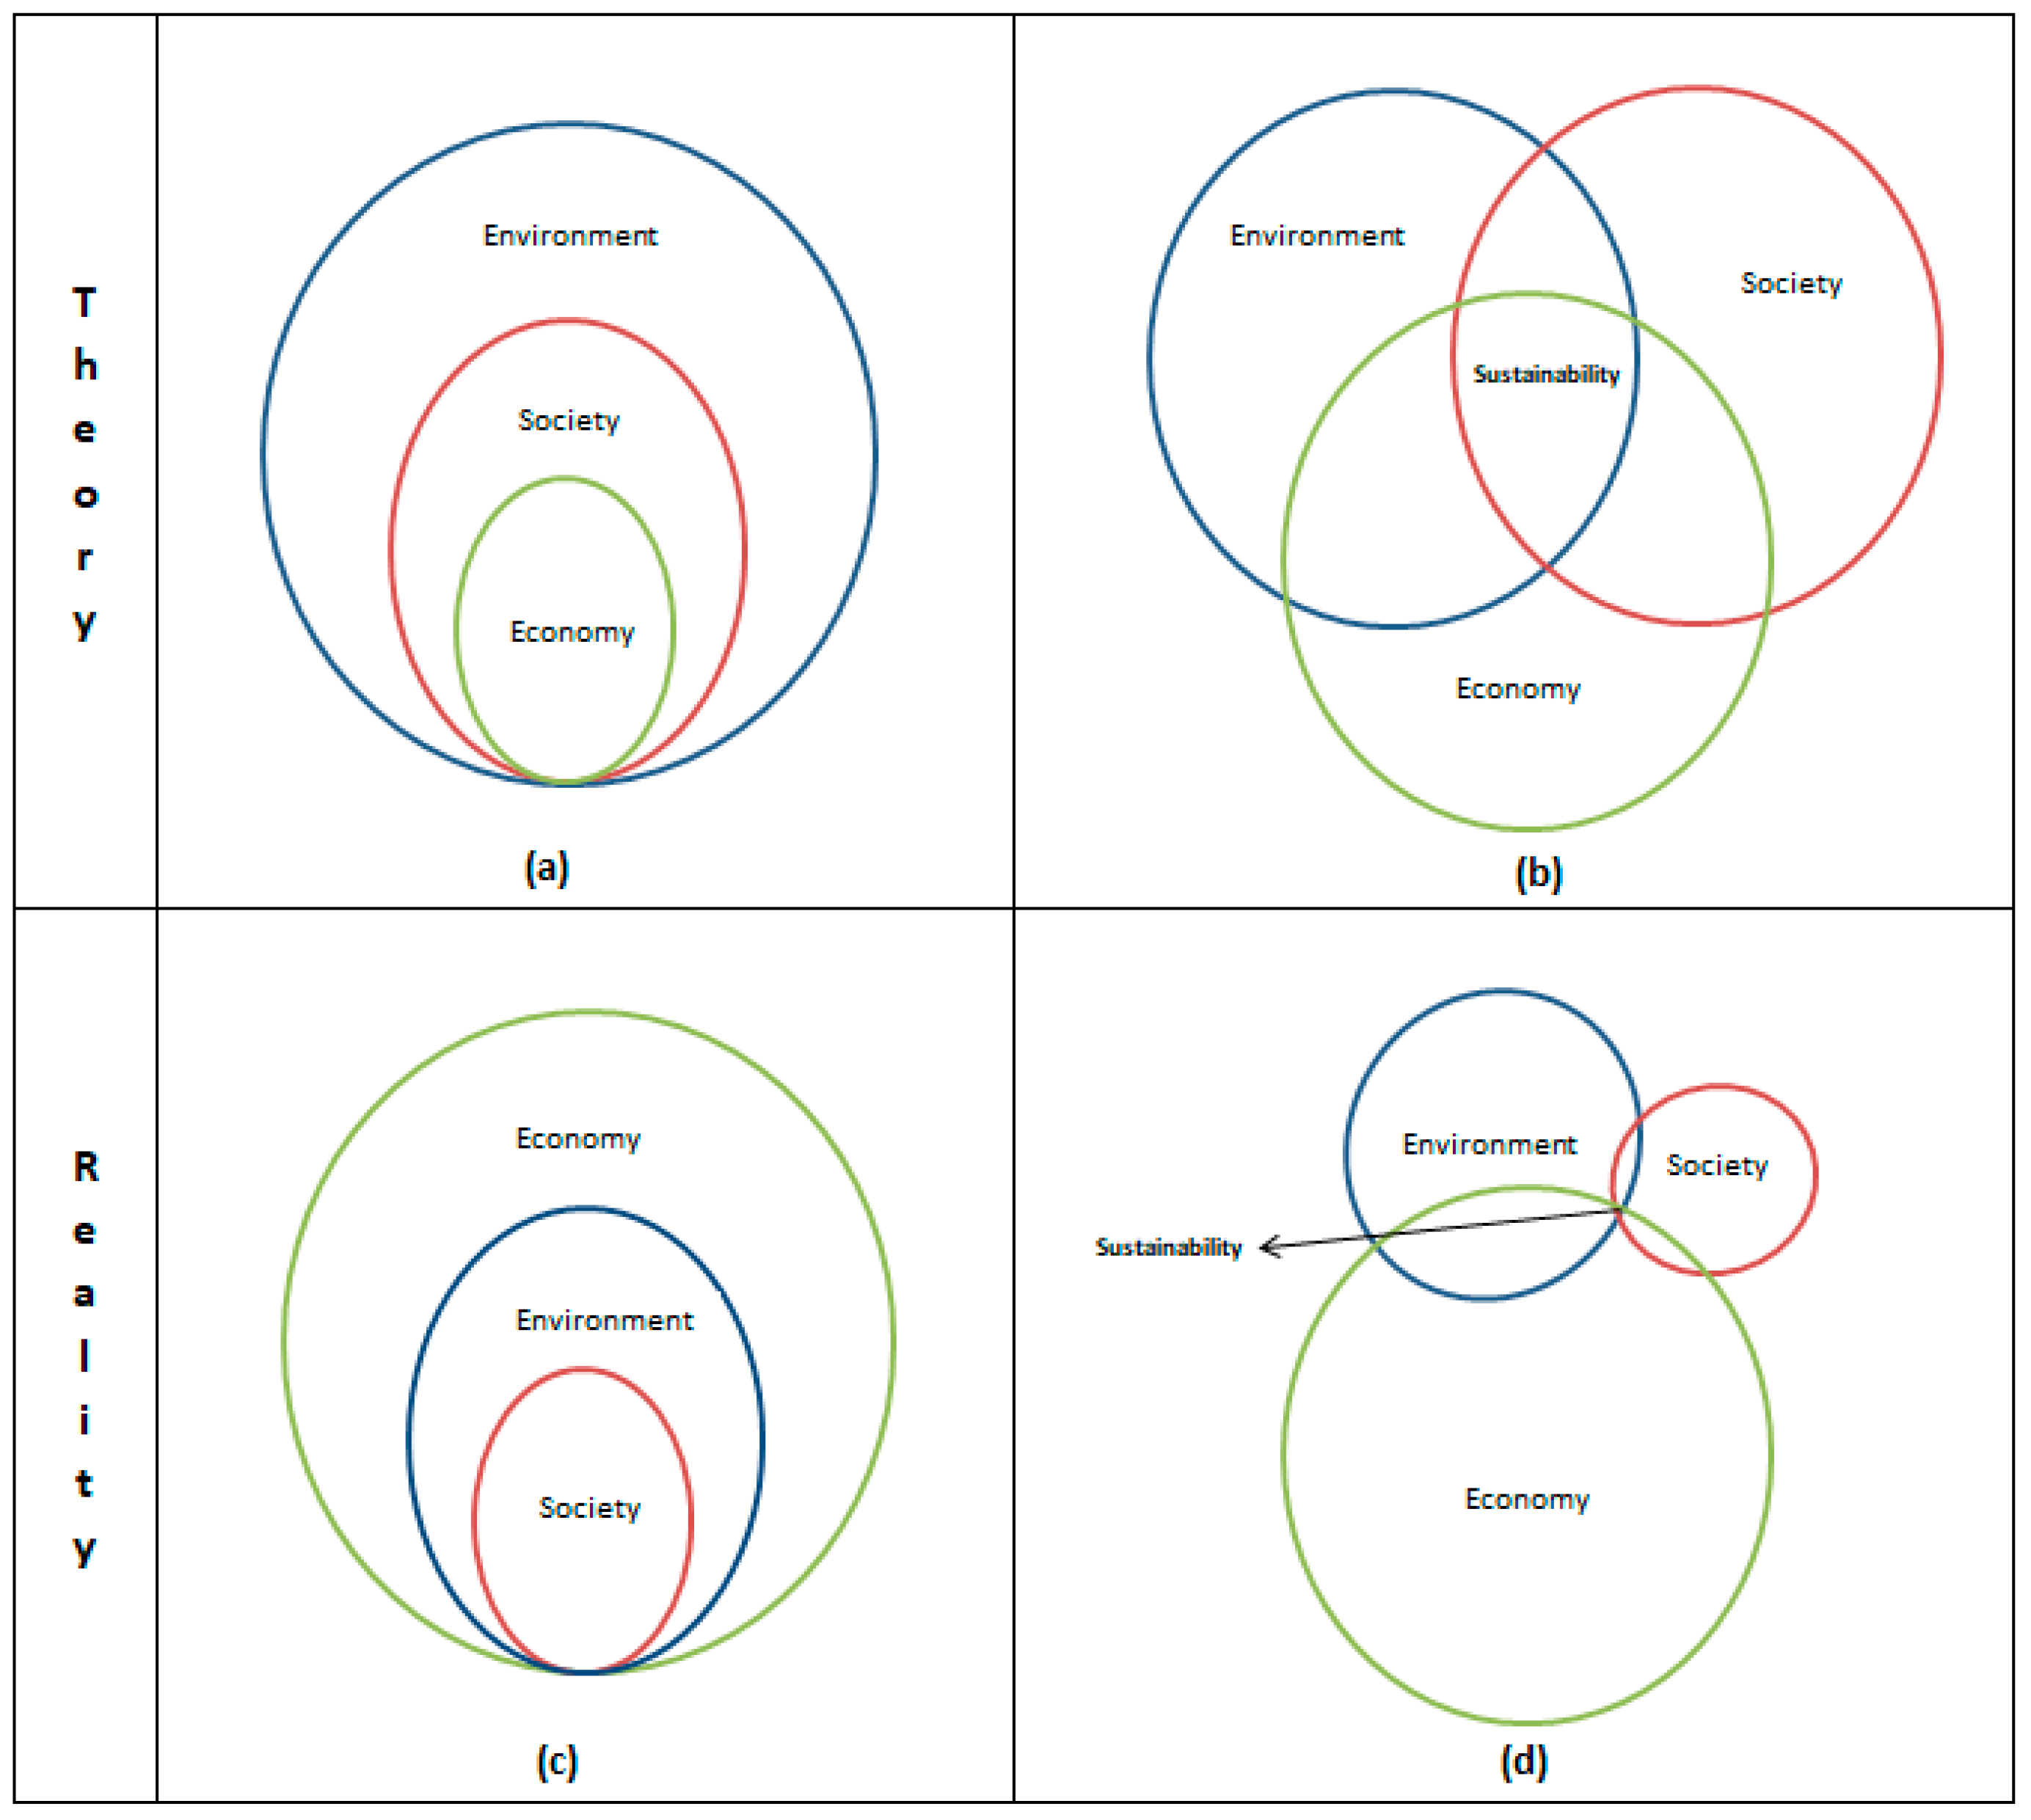
  • Compare theory and reality of sustainability.
  • Investigate personal perceptions of decision makers to tackle negative effects on evaluations of suppliers using eight criteria related to personal perception.
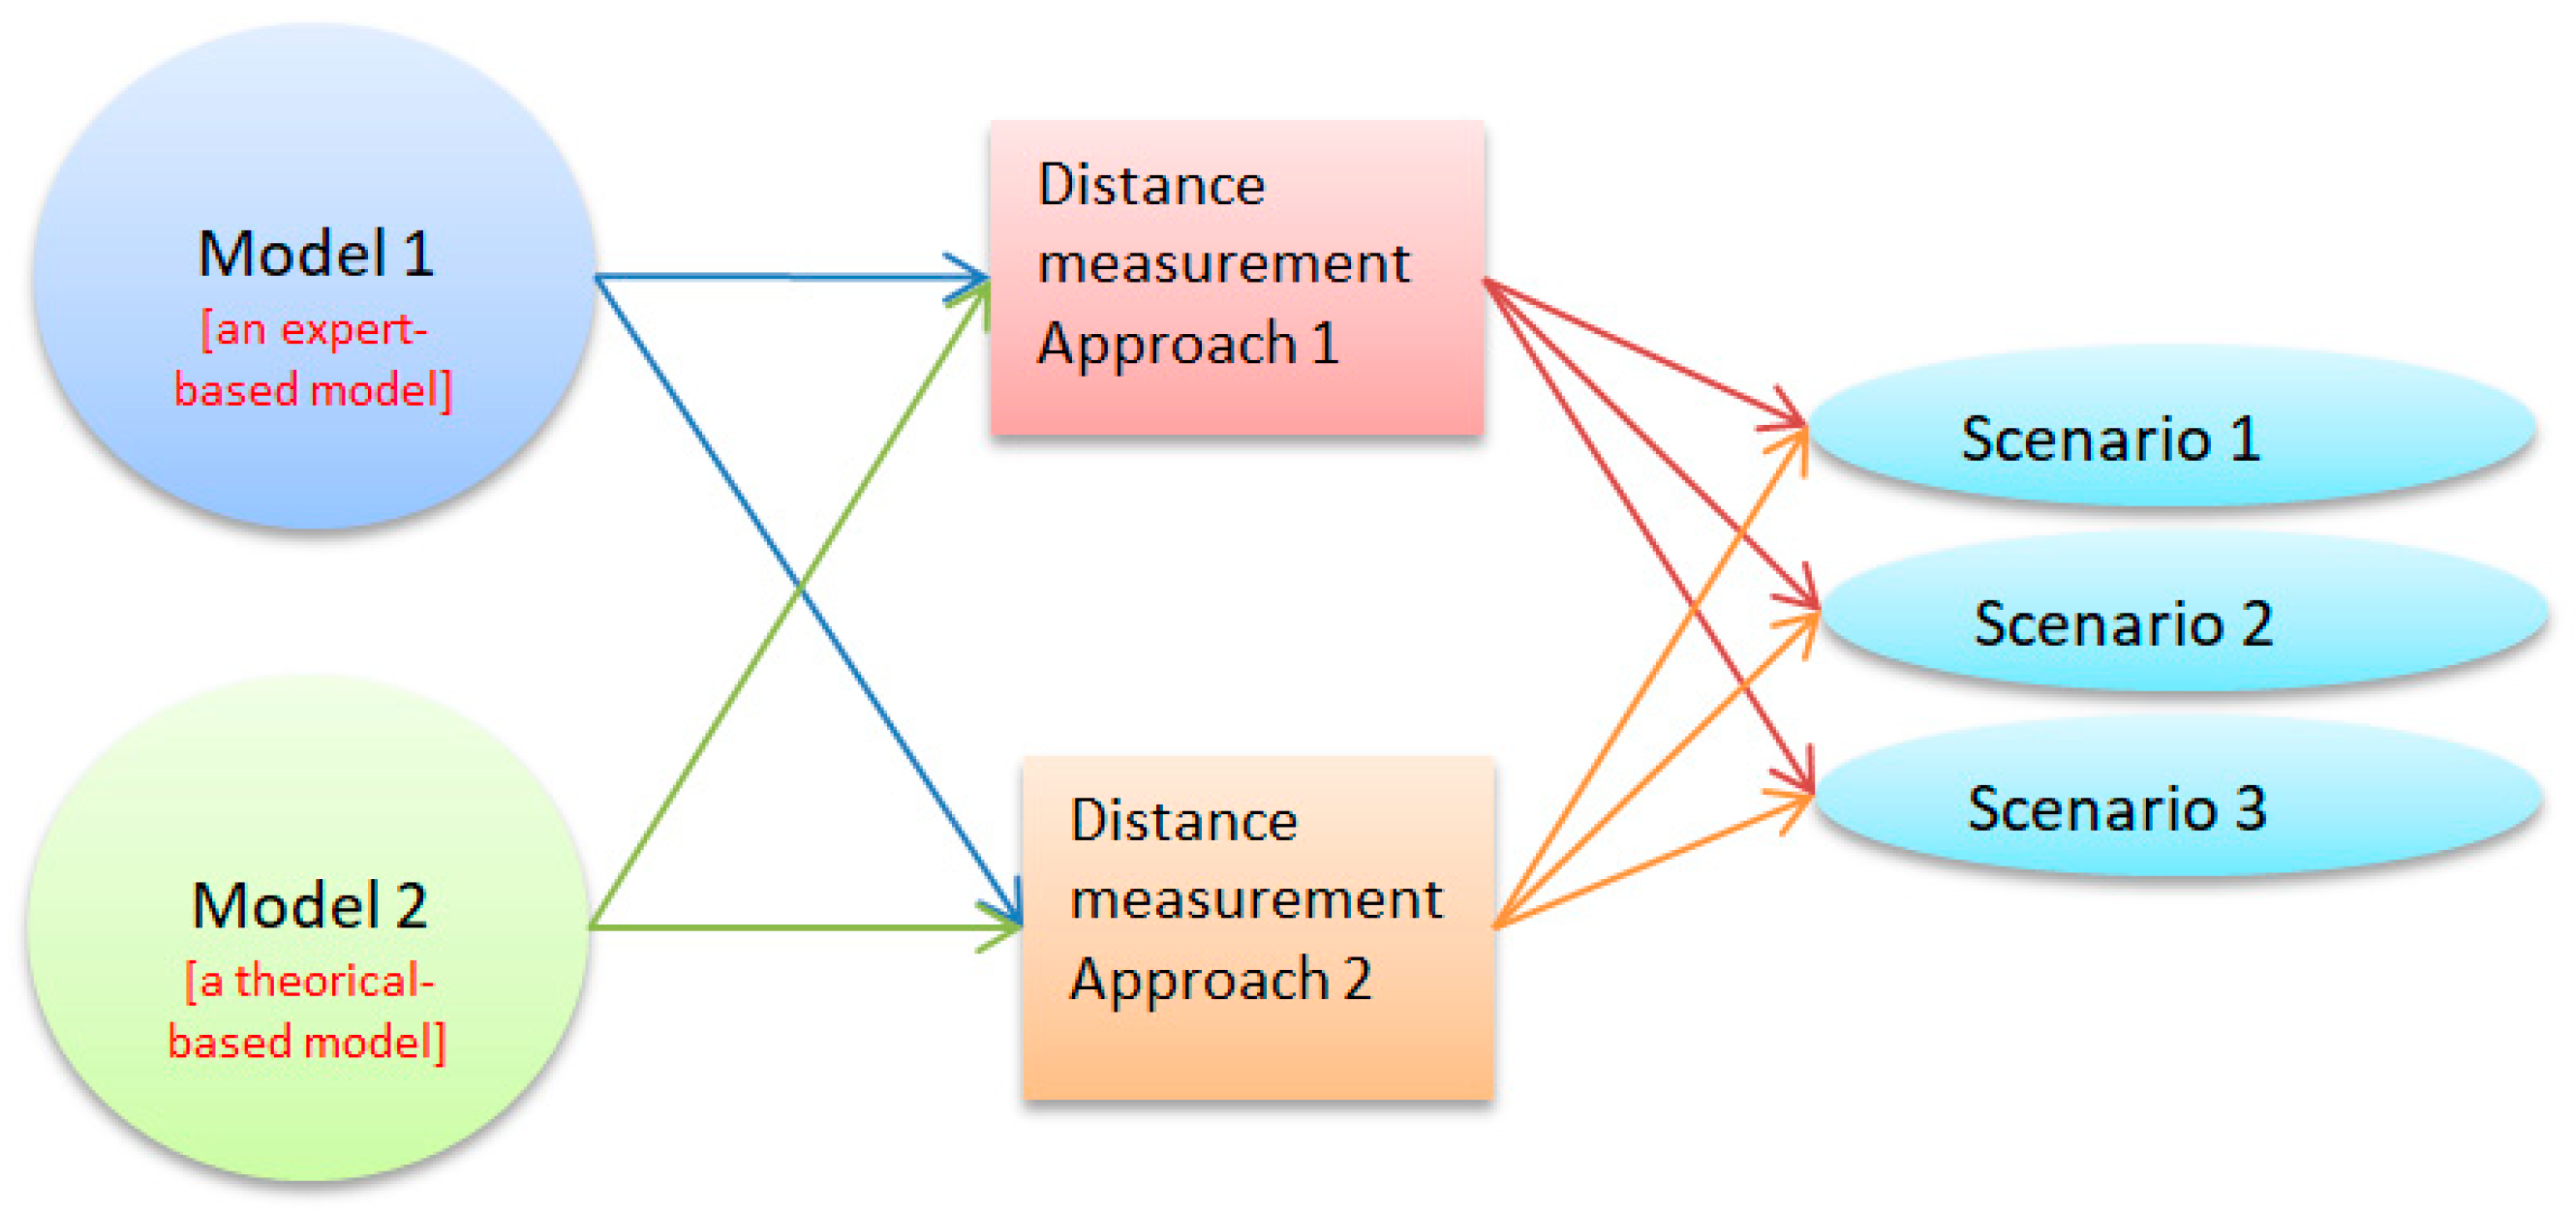
  • Find the best sustainable supplier considering six main criteria and seventeen sub-criteria determined by three decision makers.
  • Provide an alternative way to calculate the distance between ideal positive and negative of intuitionistic fuzzy sets using the Taguchi loss function.
  • Validate the proposed distance measurement approach, comparing Taguchi loss function with the intuitionistic fuzzy normalised Euclidean distance.
In this study, for two models, three different scenarios are generated to examine the importance of the decisions of experts on the evaluation of suppliers under two different approaches, as seen in Figure 1. The difference of each scenario is how to determine the weights of the decision makers. In the first scenario, the weights of the decision makers are defined using linguistic evaluation while, in the second scenario, eight criteria which affect personal perceptions are selected, and the perceptions of the decision makers are evaluated based on these criteria. The weights of the decision makers are determined using the rank of their perceptions. In the third scenario, it is assumed that the weight of all decision makers is equal. In this way, this research examines the specific contribution of the effects of the personal perception of the decision makers on their decisions. It also provides the Taguchi loss function as a new alternative distance measurement method in the literature. In addition, the problem is formed as general and reusable, in order to make it applicable for other multi-criteria decision-making problems.
The rest of the paper is structured as follows. In Section 2, a relevant literature review about sustainable supplier selection and personal perception is given. Section 3 introduces basic concepts of intuitionistic fuzzy sets, Taguchi loss function, the problem explanation, and the proposed solution approach, along with each multi-criteria decision-making component. Section 4 gives the application of the proposed approach and the results achieved. Section 5 provides discussion of the results. Finally, Section 6 concludes the study along with some potential future research directions.

2. Background

This section introduces the literature review for sustainable supplier selection and personal perception, and provides an overview of related studies in the scientific literature.

2.1. Applications on Sustainable Supplier Selection

Supply chain management (SCM) is related to effective management of the broad range of activities during the flow of materials from the raw materials to the end product [6]. The increasing awareness of sustainability has made companies integrate sustainability into supply chain management in order to retain competitive advantages. Sustainable SCM helps to reduce environmental impact while improving the continuity of a supply. In addition, sustainable SCM protects the company against reputational damage in the long term. Due to several benefits that sustainable SCM provides, the number of companies that changed their policies in order to support sustainable supplier selection has been increased [15]. There are many studies on sustainable supplier selection, and many solution techniques have been proposed in the literature that deal with any issues that arise from sustainable supplier selection. Table 1 summarizes the works found in literature applied to many fields such as the textile industry and dairy production. In addition, Table 1 shows that different MCDM methods have been applied to sustainable supplier selection problems. The basis of MCDM methods is based on selection of criteria and examination of alternatives in terms of those criteria. Based on the literature, there are a number of criteria used to solve sustainable supplier selection problems as shown in Table 2. In this study, contemplating economic, environmental, and social aspects of sustainability, six main criteria and seventeen sub-criteria are selected to examine vendors.

2.2. Applications on Personal Perception

Perceiving and understanding suppliers is one of the essential tasks for companies to achieve success in the supply chain processes. During the evaluation of vendors, decision makers might even, if unwillingly, investigate each supplier for their external appearance and similarities to the company. Their judgement is also turned to consideration of the perceptual inputs such as auditory and visual. In order to provide an unbiased evaluation of suppliers, the personal perceptions of decision makers need to be investigated. In the literature, there are some studies on personal perception in many areas, as seen in Table 3, and a few of them are related to the buyer–supplier relationship. However, there is no work on the evaluation of suppliers considering the personal perception of experts. For this reason, in this study, three decision makers are evaluated using eight different criteria related to personal perception and the weight of each decision maker is assigned based on this evaluation.

3. Material and Methods

The background for the techniques used as a part of the proposed approach is given in this section. The definition of criteria used in this study is detailed and the problem statement is given in this section.

3.1. Intuitionistic Fuzzy Sets

Definition 1.
An ordinary fuzzy set, ST introduced by Zadeh [8] can be expressed using a membership function μ S T : s → [0, 1] as follows:
S T = { ( s ,   μ S T ( s ) )   |   s     X   }
where 0   μ S T ( s )     1 in the universe of discourse X.
Definition 2.
An intuitionistic fuzzy set (IFS) ST in the universe of discourse X can be expressed using a membership function  μ S T : s → [0, 1] and a non-membership function ϑ S T : s → [0, 1] as follows [35]:
( I F S ) S T = { ( s ,   μ S T ( s ) ,   ϑ S T ( s ) )   |   s   X   }
where 0   μ S T ( s )     1 and 0 ϑ S T ( s ) 1 providing the condition of
0 μ S T ( s ) + ϑ S T ( s ) 1
Definition 3.
The degree of non-determinacy of an intuitionistic fuzzy called as hesitation degree π S T   is shown as follows [35]:
π S T ( s ) = 1 μ S T ( s )   ϑ S T ( s )
To sum up, an intuitionistic fuzzy set can be specified as: ( IFS ) ST = ( μ ST ( s ) , ϑ ST ( s ) ,   π ST ( s ) ) . The algebraic operations used in this study are multiplication and exponential arithmetic [34]. In order to provide a clear explanation, let us define two intuitionistic fuzzy sets; ( IFS ) S = ( μ S ( s ) , ϑ S ( s ) ,   π S ( s ) ) and ( IFS ) T = ( μ T ( s ) , ϑ T ( s ) ,   π T ( s ) ) in the universe of discourse X;
S T = { ( μ S ( s )   × μ T ( s ) ) , ( ϑ S ( s ) +   ϑ T ( s ) ( ϑ S ( s ) × ϑ T ( s ) ) , ( 1 ( μ S ( s ) × μ T ( s ) ) ( ϑ S ( s ) +   ϑ T ( s ) ( ϑ S ( s ) × ϑ T ( s ) ) }
S T = { ( μ S ( s ) + μ T ( s ) μ S ( s ) × μ T ( s ) ) , ( ϑ S ( s ) × ϑ T ( s ) ) }
α × S = { ( 1 ( 1 μ S ( s ) ) α ) ,     ( ϑ S ( s ) ) α ,   ( 1 ( μ S ( s ) ) α ( ϑ S ( s ) ) α   }
S α = { ( μ S ( s ) ) α ,   ( 1 ( 1 ϑ S ( s ) ) α ) ,   ( 1 ( μ S ( s ) ) α ( ϑ S ( s ) ) α   }
where α > 0 .
In this study, the distance between two intuitionistic fuzzy sets is calculated using a normalized Euclidean distance [36] and Taguchi loss function proposed as an alternative approach. An aggregated intuitionistic fuzzy decision matrix is obtained using the intuitionistic fuzzy arithmetic weighted averaging (IFWAA) operator [36]. The IFWAA operator is shown in the following:
I I F W A w ( T 1 , T 2 , T 3 , , T n ) = j = 1 n w j   T j = ( 1 j = 1 n ( 1 μ T ( s ) ) w j ,   j = 1 n ( ϑ T   ) w j   ,   j = 1 n ( 1 μ T ( s ) ) w j j = 1 n ( ϑ T   ) w j   )
where w j is defined as the weight of an intuitionistic fuzzy set T j .
Taguchi loss function introduced by Taguchi is a measurement of the loss while providing a certain level of quality in between supplying raw materials and delivering products to the customers. A quadratic function is used to minimize the variation from the target [9]. According to Balan and Sharma [37], there are three types: “normal is better”, “lower is better”, and “larger is better”. In this study, based on the problem taken into account, the formulation for “larger is better” is applied. The formula of loss function is shown in the following [38]:
L ( m ) = K × m 2      
where L(m) represents the loss generated by any process for the characteristic measurement m while K indicates a loss coefficient.
K = 100 %   ÷ U 2
where U demonstrated the upper specification limit for each characteristic measurement m in 100%. Equations (9) and (10) explain the measurement of distance from the one found as defined as m to the best, optimal or desirable one as U. Thus, in Equation (9), based on the loss coefficient, the score of the result found is computed.

3.2. Definition of Criteria

In this study, two different groups of criteria are considered. The first group criteria are defined to examine the personal perception of decision makers and the second group is selected to evaluate suppliers. Firstly, the definitions of eight criteria related to the personal perception are explained as follows:
Clarity (P1) is about clear and precise information provided. It is also about how a piece of information is presented [39]. For supplier evaluation, it is about how a supply provides relevant information to the company and how importance the clarity of this information is to any decision maker in the company.
Completeness (P2) is referring to the user having all significant information for its business. The information given is detailed enough to make a decision [39].
Consistency (P3) is the quality of always responding, providing or performing in a similar way. The information provided also needs to match other information [39].
Credibility (P4) is related to the quality of being trusted and believed. For credibility, suppliers seem like a real person to decision makers [39].
Empathy (P5) is a feeling of understanding and compassion for others’ thoughts, the ability to sense others’ emotions and to understand the reasons behind their thoughts [39]. For a supplier selection process, this can have an effect on the decision of decision makers.
Likability (P6) can be defined as the qualities of someone that make you feel good about this person. The buyer’s assessment of a supplier is that the supplier is friendly and pleasant in interactions. Likability has a negative impact on fairness in evaluating suppliers [32,39].
Similarity (P7) is that people tend to feel close to those who are similar to themselves. The buyer’s belief about the supplier can be associated with common interests and values with the buyer. Similarity has a negative impact on fairness during evaluation of suppliers [14,32].
Willingness to use (P8) is a feeling that people perceive aspects of a good or service to be the best and want to have it. According to Salminen et al. [39], this can be defined as the keenness of the user if the provider provides any aspect that the user admires. This criterion also has a negative effect on providing fair evaluation of suppliers.
These eight criteria are only used in the second scenario to examine the level of personal perception for decision makers as its first step. In the second step, for each scenario, the weights of decision makers of that scenario are allocated. Then, the sustainable supplier selection problem is formed determining six main criteria and seventeen sub-criteria which consist of economic, environmental and social aspects of sustainability. This process is consulted by three decision makers for three scenarios. The economic criteria consist of four main criteria, namely, Quality (M1), Delivery (M2), Service Performance (M3) and Cost (M4) and their corresponding eight sub-criteria, while the environmental criteria have one main criterion: Environmental Sustainability (M5) and its four sub-criteria. In addition, there is one main criterion, namely, Social Sustainability (M6) and its five sub-criteria, which are defined in terms of social aspects. Each criterion and its corresponding sub-criterion used in this work are shown in Table 4.
Quality (M1) refers to meeting customer expectations by providing either a product or service [40]. This criterion comprises ‘Quality control rejection rate’ (C1) and ‘Customer rejection rate’ (C2) to evaluate the quality of suppliers.
Delivery (M2) consists of issues about the lead time, fill rate, on-time performance, and transportation. The performance for delivery is measured with regard to the capability of the vendor to meet the agreed schedule [41]. In this work, ‘Delivery lead time’ (C3) and ‘Delivery flexibility’ (C4) are considered as corresponding sub-criteria of Delivery.
Service Performance (M3) is the performance of suppliers that includes customization of products for buyers, the minimum size for an order, quick response to any change, and meeting expectations for communication [41]. Under this criterion, two sub-criteria, namely ‘Reliability’ (C5) and ‘Empathy’ (C6) are involved in this study.
Cost (M4) is related to the monetary valuation of all efforts during supplying materials and delivering end products to customers [41]. For the supplier side, in this study, ‘Product price’ (C7) and ‘Logistic cost’ (C8) are taken into account.
Environmental sustainability (M5) describes a supplier’s potential to reduce pollution, to produce green items and to decrease the negative influence of its operations to the environment [21]. From this point of view, the criteria chosen for this study are ‘Environmental efficiency’ (C9), ‘Green image’ (C10), ‘Pollution reduction’ (C11) and ‘Green competencies’ (C12).
Social sustainability (M6) is a perspective looked at sustainability in terms of social aspects to provide a certain level of protection for employees and other people around a supplier [21]. ‘Having OHSAS 18001 certification’ (C13), ‘Rate of health and safety incidents’ (C14), ‘Employee rights’ (C15), ‘Forced child labour’ (C16) and ‘Staff training’ (C17) are chosen to consider for sustainable supplier evaluation.

3.3. Problem Statement

Over the last two decades, there has been an increase in using plastics in various forms in our daily lives. The most common form of plastics is packaging; therefore, manufacturers have placed an emphasis on the plastic packaging industry in many fields, such as food products and personal care items. At the same time, the quantity of plastic waste has risen, and the plastics have a high carbon footprint as a non-renewable resource. In addition, for sustainability, the plastic packaging industry is a significant concern, and it needs to reduce the number of plastics used for packaging in two ways, either by downsizing or recycling them [42]. Hence, in this study, a plastic packaging manufacturing company in Tekirdag, Turkey is considered, in order to evaluate its suppliers regarding sustainability. In this manner, working with the right suppliers providing the best performance is believed to increase the recycling quality. This study also puts pressure on vendors of the company to provide evidence that show their environmental concerns. In this study, an MCDM intuitionistic fuzzy approach is introduced for ranking three suppliers considering several criteria selected for a sustainable supplier selection problem. In this section, details of the overall approach are explained, starting with the specifics of the membership functions and giving steps used for the proposed approach for each model. For the expert-based model, all steps are explained as follows:
Step 1. The weight of each decision maker is found for each scenario as shown in the following:
  • For the first scenario, the linguistic terms and their corresponding intuitionistic fuzzy numbers shown in Table 5 are used to compute their weights. The following formula is applied to calculate decision makers’ weights [21]:
    w i = ( μ i + π i × μ i ( μ i + ϑ i ) i = 1 n ( μ i + π i l × μ i ( μ i + ϑ i ) ) )
    where n is the number of decision makers while the sum of w i is equal to 1.
  • For the second scenario, in order to assign the weight of each decision maker, eight criteria related to the personal perception are used. The linguistic terms and their corresponding intuitionistic fuzzy numbers shown in Table 5 are used to calculate their weights. It is assumed that the importance of each criterion is equal and Equation (11) is applied to calculate the decision makers ‘weights for each criterion to achieve the mean score for each decision maker. These scores are averaged and are assigned as the weights of the decision makers.
  • For the third scenario, it is assumed that the weights of all decision makers are equal to each other, and the sum of their weight is equal to 1.
Step 2. The importance of six main criteria and seventeen sub-criteria are determined by three decision makers using linguistic terms and the corresponding intuitionistic fuzzy numbers as shown in Table 5.
Step 3. The global score for each sub-criterion is calculated by multiplying its main criterion. For instance, if the importance of ‘Quality control rejection rate’ (C1) is defined as ‘Very Important’ and its main criterion ‘Quality’ (M1) is assigned as ‘Important’, new ( C 1 G ) is calculated as:
M 1 C 1 = ( 1 , 0 , 0 ) ( 0.75 , 0.2 , 0.05 ) = ( 0.75 , 0.2 , 0.05 )
Step 4. The performance of each supplier in terms of each criterion has been assigned in the same way, explained in Step 2 using the scale used in the work of Mondal and Pramanik [43].
Step 5. The aggregate intuitionistic fuzzy decision matrix is generated by multiplying importance of each criterion by the performance of each supplier.
Step 6. The aggregate weighted intuitionistic fuzzy super decision matrix is obtained using IFWAA operator.
Step 7. A positive-ideal solution is found considering maximum μ i and minimum π i in all μ i and π i whereas a negative-ideal solution is calculated finding minimum μ i and maximum π i in all μ i and π i where i represents the number of criteria [44]. They are computed for each cell value in the aggregate weighted intuitionistic fuzzy decision matrix.
Step 8. In this study, the distance measurement is calculated using two approaches: fuzzy normalised Euclidean distance and Taguchi loss function. The intuitionistic fuzzy normalised Euclidean distance is computed directly while Equations (9) and (10) are applied for Taguchi loss function calculation.
Step 9. Suppliers are ranked based on the distances measured.
For the theorical-based model, all steps are considered in the same manner except Step 2. In Step 2, the importance of six main criteria and seventeen sub-criteria is defined as ‘Very Important’ to keep them equal.

3.4. Notations

Some key notations that are used in the remainder of this paper are introduced in Table 6.

4. Preliminary Experiments and Results

4.1. Application of the Method Proposed

Steps for the expert-based model are explained in the following:
Step 1. For each scenario, the weights of decision makers are found as follows:
  • For the first scenario, the linguistic evaluation of decision makers is performed assigning ‘Very important’ (VI) for the first decision maker (DM1), ‘Important’ (I) for the second decision maker (DM2) and ‘Medium’ (M) for the third decision maker (DM3). Equation (7) is used to calculate their weights, and they are found to be 0.38, 0.35 and 0.27, respectively.
  • For the second scenario, decision makers are examined in terms of eight criteria, as shown in Table 7. Decision makers’ weights are calculated using Equation (7) for each decision maker, and the mean value is taken as a weight for each decision maker. It is found that the weight of DM1 is 0.32, the weight of DM2 is 0.40, and the weight of DM3 is 0.29.
  • For the third scenario, their weights are defined equally as 0.33, 0.33 and 0.33 in the same sequence.
Step 2. The importance of 6 main criteria and 17 sub-criteria are defined in terms of three decision makers as seen in Table 8.
Step 3. The global score for each sub-criterion is calculated and the global score for each criterion is shown in Table 9.
Step 4. The performance of each supplier in terms of each criterion is assigned by decision makers, as shown in Table 10. The global scores are also calculated, and Table 11 indicates C1 and M1 multiplication as an example of global score for C1.
Step 5. The importance of each criterion is multiplied by the performance of each supplier, and is shown in the following as an example of global score of C1 for DM1:
C 1 G ( i ) C 1 G ( p m ) = ( 0.75 , 0.2 , 0.05 ) ( 0.71 , 0.19 , 0.10 ) = ( 0.53 , 0.35 , 0.11 )
where C 1 G ( i ) represents importance of global score C1 while C 1 G ( p m ) demonstrates the performance of S1 for the global score C1.
Step 6. The aggregate weighted intuitionistic fuzzy numbers are calculated by IFWAA operator, and these numbers are multiplied by the weight of the decision makers.
Step 7. Negative-ideal solutions and positive-ideal solutions are computed and indicated in Table 12.
Step 8. Fuzzy normalised Euclidean distance and Taguchi loss function are applied to measure the distance, as shown in Table 12.
Step 9. The rank of suppliers is computed and demonstrated in Table 12. For the theorical-based model, in Step 2, the importance of criteria is defined as in the same equality and the problem is solved in the same manner. The results for this model are shown in Table 12.

4.2. Results and Comparative Analysis

The results of the expert-based and the theorical-based models are summarised in Table 12. The results from intuitionistic fuzzy sets using fuzzy normalized Euclidean distance and Taguchi loss function as two different distance measurement approaches for three different scenarios are also demonstrated in Table 12. It is seen in the theorical-based model, which takes the weights of the criteria equally, that the first supplier takes the first place in the ranking for three scenarios while the third supplier (S3) reaches the first place in the expert-based model. The results indicate that the value judgment of experts places more emphasis on cost-oriented criteria rather than social or environmental criteria. It is also clearly seen that the rank order of suppliers is quite different in these two models, and this leads us to conclude that the power of criteria, and the scope of applications outside the theory, should be explained to decision makers.
In addition, for the expert-based model, the approach using Taguchi loss function provides the same ranking as fuzzy normalized Euclidean distance achieved for three scenarios while the ranking of alternatives is slightly different in each scenario. For the first scenario, where linguistic evaluation is used to assign the weight of each decision maker, the third supplier is the best alternative with scores of 0.2986 and 0.1628 for two distance measurement approaches, respectively. Based on the results of the second scenario, where the weights of the decision makers are calculated using eight criteria related to personal perception, the third supplier is still found as the best performing supplier while the second and the third ranks swap places with each other. The third supplier is also the best among the three alternatives for the last scenario, where the weights of the decision makers are assigned equally. The worst supplier is found to be the second supplier for the first scenario and the first supplier for the second and the third scenarios. For all scenarios, the values of closeness coefficients for S1 and S2 are very close, while the difference between S3 and others has risen for each scenario. For the theorical-based model, the approach using Taguchi loss function provides the same ranking as fuzzy normalized Euclidean distance achieved for three scenarios with the same order of suppliers. This leads to achieving the result that the weight of the decision maker has an influence on the evaluation process that we should not ignore. This study also shows changes in the rank of suppliers related to the weight of the decision makers. Thus, there is evidence that the personal perception of decision makers should not be ignored during decision-making processes.
To investigate the validity of results obtained by two approaches, the Pearson product–moment correlation coefficient [45] is used. The correlation between results achieved by two different approaches is measured, applying linear correlation between two sets of values, and it is found in between zero and one, where 0 depicts no correlation and 1 depicts perfect correlation. For this study, the value is found as 0.958, where a value above 0.5 is interpreted as a strong correlation. Accordingly, the ranking order of alternatives based on the proposed Taguchi loss function is compared with the results of the fuzzy normalised Euclidean distance, and it is evident that the proposed approach generates approximately the same results as the results of the other approach, as seen in Table 12.
In this work, for the expert-based model, the significance of personal perception in the decision-making process is revealed and, by associating decision makers with their knowledge and experience in the field in order to define the importance of decision-makers’ weight, this study has also shown that it is helpful to measure decision-makers’ perceptions. In this way, the ability to reflect uncertainty and hesitancy in human thoughts is covered. The experts’ actual rankings are taken for vendors and—based on their opinion—supplier 3 (S3) is the best, and the other two are not much different from each other. For the theorical-based model, when the criteria are kept equally important, it is seen that the effect of personal perception decreases. Hence, the proposed approach, which considers personal perception of decision makers, is capable to dealing with MCDM problems along with an additional flexibility.

5. Discussion

Environmental, economic and social factors are defined as three pillars of sustainable development. If any one of them is ignored, treated as less important than the others, or missing as a pillar from the paradigm, the development will not happen properly. Development on environmental, economic and social factors needs to be well-balanced for companies [3]. According to the literature, though, theoretical models are well-structured, while real-world applications do not emphasize the three pillars equally, as seen in Figure 2. Figure 2 demonstrates 3-nested-dependencies models and 3-overlapping-circle models for the theoretical side versus the empirical side. It is clearly seen that the economical aspects of the 3-nested-dependencies model are considered the most important and influential in real life, whereas in theory, environmental aspects must be considered the most essential. Any environmental damage has a direct impact on social and economic aspects. For instance, bees improve the shelf life of many fruits and vegetables, the quality of many food crops and bee-pollinated plants so any reduction in global bee populations has direct impact on economic aspects of many productions [4]. In addition, the 3-overlapping-circle model is formed using the importance of each aspect equally but in the reality, economic features stand out more than environmental and social factors as seen in Figure 2. On account of this, it is obvious that there is a dilemma between the conceptual sustainability and real-world applications. Based on the results of this study, it is clearly seen that decision makers give more attention on cost-oriented criteria. It is clear that the approach of decision makers cannot be transformed into a theoretical form at once, but with this study, the aim is to increase the awareness of experts providing the comparison of actual situations as well as the theory.
In addition, sustainability has been given more attention by large organizations, although the Small and Medium Enterprises (SMEs) comprise of 99% of total businesses [46]. Developments related to sustainability in supply chains of SMEs need to be monitored and explored, giving them more attention. In this study, a plastic packaging company as an SME in taken into account, and through this study, their impressions of sustainability were measured.
Moreover, this paper analyzed the expert-based model and the theorical-based model to investigate theory and reality of sustainability. In the literature, there are few studies which have focused on the intrinsic uncertainty in dynamic input events. In the work of Xiao [47], a cost-aware, fault-tolerant and reliable (CaFtR) strategy is proposed to handle the difficulties in complex decision-making systems. Distance measures or similarity measures are essential for both decision-making and pattern recognition problems. Thus, distance measurement approaches have been taken attention from the divergence perspective. The Jensen–Shannon divergence introduced by Joshi and Kumar [48] has been used to deal with discrimination of two probability distributions [45,49]. The quality of information provided by systems is also investigated in order to rationalize human decision-making and promote interpretability [50]. In this study, rather than the information provided, the personal perception of decision makers who provide the information is investigated.

6. Conclusions

In a global world, the success of any company is determined by many aspects, and sustainability becomes one of the most important among these aspects. Sustainability provides an increase in awareness of economic, environmental and social aspects. For a supplier selection process, sustainability has been considered and having a sustainable organizational structure has become one of the desired features for a supplier. Hence, selecting the best supplier from a sustainability perspective has turned into a vital issue for many companies. This study applies intuitionistic fuzzy sets using two different distance measurement approaches, (i) fuzzy normalized Euclidean distance and (ii) Taguchi loss function, along with personal perception factors, in order to solve real-world problems in the plastic packaging industry as a priority in this industry.
In this work, all criteria are selected based on a comprehensive literature review and taking decision makers’ opinions. From the theoretical view, Taguchi loss function as an alternative distance measurement operator proposed provides a feasible way of tackling this sustainable supplier selection problem. In addition, engaging personal perception into determining the weights of decision makers is a valuable way to deal with the possibility of unfair bias in evaluating suppliers. Moreover, the three factors for sustainability need to be well-balanced for companies and, based on the literature, it is clearly seen that economical aspects are considered as the most important factor. Changing this approach of companies is quite difficult but this study provides information about how it could be when the three factors are treated equally. There is a growing body of work on the design and development of a smart supply chain management. As a future study, a genetic algorithm, either iterative-based or population-based, could be applied to solve the sustainable supplier selection problem by considering the personal perception of decision makers and generate an autonomous supply selection. Because of the lack of research on sustainable supplier selection under consideration of personal perception, this study could be tested on various MCDM problems.

Funding

This research received no external funding.

Institutional Review Board Statement

Not applicable.

Informed Consent Statement

Not applicable.

Data Availability Statement

Not applicable.

Conflicts of Interest

The authors declare no conflict of interest.

References

  1. Jamwal, A.; Agrawal, R.; Sharma, M.; Kumar, V.; Kumar, S. Developing a sustainability framework for industry 4.0. In Proceedings of the 28th CIRP Conference on Life Cycle Engineering, Jaipur, India, 10–12 March 2021; Volume 98, pp. 430–435. Available online: https://www.sciencedirect.com/science/article/pii/S2212827121001591 (accessed on 10 December 2021).
  2. Satyro, W.C.; de Mesquita Spinola, M.; de Almeida, C.M.B.; Giannetti, B.F.; Sacomano, J.B.; Contador, J.C.; Contador, J.L. Sustainable industries: Production planning and control as an ally to implement strategy. J. Clean. Prod. 2021, 281, 124781. [Google Scholar] [CrossRef]
  3. Dawe, N.K.; Ryan, K.L. The faulty three-legged-stool model of sustainable development. Conserv. Biol. 2003, 17, 1458–1460. [Google Scholar] [CrossRef]
  4. Patel, V.; Pauli, N.; Biggs, E.; Barbour, L.; Boruff, B.J. Why bees are critical for achieving sustainable development. Ambio 2020, 50, 49–59. [Google Scholar] [CrossRef] [Green Version]
  5. Dushenko, M.; Thærie Bjorbæk, C.; Steger-Jensen, K. Application of a sustainability model for assessing the relocation of a container terminal: A case study of kristiansand port. Sustainability 2019, 11, 87. [Google Scholar] [CrossRef] [Green Version]
  6. Turk, S.; Miller, S.; Ozcan, E.; John, R. A simulated annealing approach to supplier selection aware inventory planning. In Proceedings of the 2015 IEEE Congress on Evolutionary Computation (CEC), Sendai, Japan, 25–28 May 2015; pp. 1799–1806. [Google Scholar] [CrossRef] [Green Version]
  7. Schramm, V.B.; Cabral, L.P.B.; Schramm, F. Approaches for supporting sustainable supplier selection—A literature review. J. Clean. Prod. 2020, 273, 123089. [Google Scholar] [CrossRef]
  8. Zadeh, L. Fuzzy sets. Inf. Control 1965, 8, 338–353. [Google Scholar] [CrossRef] [Green Version]
  9. Taguchi, G. System of Experimental Design: Engineering Methods to Optimize Quality and Minimize Costs, 1st ed.; UNIPUB/Kraus International Publications: Dearborn, MI, USA, 1987. [Google Scholar]
  10. Liao, C.-N.; Kao, H.-P. Supplier selection model using taguchi loss function, analytical hierarchy process and multichoice goal programming. Comput. Ind. Eng. 2010, 58, 571–577. [Google Scholar] [CrossRef]
  11. Sivakumar, R.; Kannan, D.; Murugesan, P. Green vendor evaluation and selection using ahp and taguchi loss functions in production outsourcing in mining industry. Resour. Policy 2015, 46, 64–75. [Google Scholar] [CrossRef]
  12. Kumar, R.; Padhi, S.S.; Sarkar, A. Supplier selection of an indian heavy locomotive manufacturer: An integrated approach using taguchi loss function, topsis, and ahp. IIMB Manag. Rev. 2019, 31, 78–90. [Google Scholar] [CrossRef]
  13. Shojaei, P.; Seyed Haeri, S.A.; Mohammadi, S. Airports evaluation and ranking model using taguchi loss function, best-worst method and vikor technique. J. Air Transp. Manag. 2018, 68, 4–13. [Google Scholar] [CrossRef]
  14. Blessley, M.; Mir, S.; Zacharia, Z.; Aloysius, J. Breaching relational obligations in a buyer-supplier relationship: Feelings of violation, fairness perceptions and supplier switching. Ind. Mark. Manag. 2018, 74, 215–226. [Google Scholar] [CrossRef]
  15. Roy, S.A.; Ali, S.M.; Kabir, G.; Enayet, R.; Suhi, S.A.; Haque, T.; & Hasan, R. A framework for sustainable supplier selection with transportation criteria. Int. J. Sustain. Eng. 2020, 13, 77–92. [Google Scholar] [CrossRef]
  16. Hsu, C.-W.; Hu, A.H. Applying hazardous substance management to supplier selection using analytic network process. J. Clean. Prod. 2009, 17, 255–264. [Google Scholar] [CrossRef]
  17. Amindoust, A.; Ahmed, S.; Saghafinia, A.; Bahreininejad, A. Sustainable supplier selection: A ranking model based on fuzzy inference system. Appl. Soft Comput. 2012, 12, 1668–1677. [Google Scholar] [CrossRef]
  18. Ahmadi, H.B.; Petrudi, S.H.H.; Wang, X. Integrating sustainability into supplier selection with analytical hierarchy process and improved grey relational analysis: A case of telecom industry. Int. J. Adv. Manuf. Technol. 2017, 90, 2413–2427. [Google Scholar] [CrossRef]
  19. Shalke, P.N.; Paydar, M.M.; Hajiaghaei-Keshteli, M. Sustainable supplier selection and order allocation through quantity discounts. Int. J. Manag. Sci. Eng. Manag. 2018, 13, 20–32. [Google Scholar]
  20. Abdel-Basset, M.; Mohamed, M.; Smarandache, F. A hybrid neutrosophic group anp-topsis framework for supplier selection problems. Symmetry 2018, 10, 226. [Google Scholar] [CrossRef] [Green Version]
  21. Memari, A.; Dargi, A.; Akbari Jokar, M.R.; Ahmad, R.; Abdul Rahim, A.R. Sustainable supplier selection: A multi-criteria intuitionistic fuzzy topsis method. J. Manuf. Syst. 2019, 50, 9–24. [Google Scholar] [CrossRef]
  22. Ecer, F.; Pamucar, D. Sustainable supplier selection: A novel integrated fuzzy best worst method (f-bwm) and fuzzy cocoso with bonferroni (cocoso’b) multi-criteria model. J. Clean. Prod. 2020, 266, 121981. [Google Scholar] [CrossRef]
  23. Chen, Z.; Ming, X.; Zhou, T.; Chang, Y. Sustainable supplier selection for smart supply chain considering internal and external uncertainty: An integrated rough-fuzzy approach. Appl. Soft Comput. 2020, 87, 106004. [Google Scholar] [CrossRef]
  24. Tayyab, M.; Sarkar, B. An interactive fuzzy programming approach for a sustainable supplier selection under textile supply chain management. Comput. Ind. Eng. 2021, 155, 107164. [Google Scholar] [CrossRef]
  25. Alavi, B.; Tavana, M.; Mina, H. A dynamic decision support system for sustainable supplier selection in circular economy. Sustain. Prod. Consum. 2021, 27, 905–920. [Google Scholar] [CrossRef]
  26. Joshi, R.; Kumar, S. A dissimilarity measure based on Jensen Shannon divergence measure. Int. J. Gen. Syst. 2019, 48, 280–301. [Google Scholar] [CrossRef]
  27. Hendiani, S.; Liao, H.; Ren, R.; Lev, B. A likelihood-based multi-criteria sustainable supplier selection approach with complex preference information. Inf. Sci. 2020, 536, 135–155. [Google Scholar] [CrossRef]
  28. Byrd, K.; Her, E.; Fan, A.; Almanza, B.; Liu, Y.; Leitch, S. Restaurants and COVID-19: What are consumers’ risk perceptions about restaurant food and its packaging during the pandemic? Int. J. Hosp. Manag. 2021, 94, 102821. [Google Scholar] [CrossRef]
  29. Truong, V.A.; Lang, B.; Conroy, D.M. Are trust and consumption values important for buyers of organic food? A comparison of regular buyers, occasional buyers, and non-buyers. Appetite 2021, 161, 105123. [Google Scholar] [CrossRef]
  30. Wang, X.-W.; Cao, Y.-M.; Zhang, N. The influences of incentive policy perceptions and consumer social attributes on battery electric vehicle purchase intentions. Energy Policy 2021, 151, 112163. [Google Scholar] [CrossRef]
  31. Long, Z.; Axsen, J.; Miller, I.; Kormos, C. What does tesla mean to car buyers? exploring the role of automotive brand in perceptions of battery electric vehicles. Transp. Res. Part A Policy Pract. 2019, 129, 185–204. [Google Scholar] [CrossRef]
  32. Nagel, D.M.; Giunipero, L.; Jung, H.; Salas, J.; Hochstein, B. Purchaser perceptions of early phase supplier relationships: The role of similarity and likeability. J. Bus. Res. 2021, 128, 174–186. [Google Scholar] [CrossRef]
  33. Aminoff, A.; Tanskanen, K. Exploration of congruence in perceptions of buyer–supplier attraction: A dyadic multiple case study. J. Purch. Supply Manag. 2013, 19, 165–184. [Google Scholar] [CrossRef]
  34. Oosterhuis, M.; Molleman, E.; van der Vaart, T. Differences in buyers’ and suppliers’ perceptions of supply chain attributes. Int. J. Prod. Econ. 2013, 142, 158–171. [Google Scholar] [CrossRef]
  35. Atanassov, K.T. Intuitionistic fuzzy sets. Fuzzy Sets Syst. 1986, 20, 87–96. [Google Scholar] [CrossRef]
  36. Szmidt, E.; Kacprzyk, J. Distances between intuitionistic fuzzy sets. Fuzzy Sets Syst. 2000, 114, 505–518. [Google Scholar] [CrossRef]
  37. Balan, S.; Sharma, S. An integrative supplier selection model using taguchi loss function, topsis and multi criteria goal programming. J. Intell. Manuf. 2013, 24, 1123–1130. [Google Scholar] [CrossRef]
  38. Kethley, R. Using taguchi loss functions to develop a single objective function in a multi-criteria context: A scheduling example. Int. J. Inf. Manag. Sci. 2008, 19, 589. [Google Scholar]
  39. Salminen, J.; Santos, J.M.; Kwak, H.; An, J.; Gyo Jung, S.; Jansen, B.J. Persona perception scale: Development and exploratory validation of an instrument for evaluating individuals’ perceptions of personas. Int. J. Hum. Comput. Stud. 2020, 141, 102437. [Google Scholar] [CrossRef]
  40. Abdolshah, M. A review of quality criteria supporting supplier selection. J. Qual. Reliab. Eng. 2013, 2013, 621073. [Google Scholar] [CrossRef] [Green Version]
  41. Taherdoost, H.; Brard, A. Analyzing the process of supplier selection criteria and methods. Procedia Manuf. 2019, 32, 1024–1034. [Google Scholar] [CrossRef]
  42. Karanth, R.; Karanth, Y.; Naranje, V.; Sankaram, M. Chapter five—Sustainable manufacturing of plastic packaging material: An innovative approach. In Sustainable Manufacturing and Design Woodhead Publishing Reviews: Mechanical Engineering Series; Kumar, K., Zindani, D., Davim, J.P., Eds.; Woodhead Publishing: Cambridge, UK, 2021; pp. 83–99. [Google Scholar]
  43. Mondal, K.; Pramanik, S. Intuitionistic fuzzy multicriteria group decision making approach to quality clay-brick selection problems based on grey relational analysis. J. Appl. Quant. Methods 2014, 9, 35–51. Available online: link.gale.com/apps/doc/A383330215/AONE?u=anon~f0a09bc3&sid=googleScholar&xid=aae5e425 (accessed on 1 May 2022).
  44. Türk, S.; Koç, A.; Şahin, G. Multi-criteria of PV solar site selection problem using GIS-intuitionistic fuzzy based approach in Erzurum province/Turkey. Sci. Rep. 2021, 11, 5034. [Google Scholar] [CrossRef]
  45. Pearson, K. Mathematical Contributions to the Theory of Evolution. III. Regression, Heredity, and Panmixia. Philos. Trans. R. Soc. Lond. Ser. A 1896, 187, 253–318. [Google Scholar] [CrossRef] [Green Version]
  46. Carter, C.; Easton, P. Sustainable supply chain management: Evolution and future directions. Int. J. Phys. Distrib. Logist. Manag. 2011, 41, 46–62. [Google Scholar] [CrossRef]
  47. Xiao, F. CaFtR: A Fuzzy Complex Event Processing Method. Int. J. Fuzzy Syst. 2022, 24, 1098–1111. [Google Scholar] [CrossRef]
  48. Joshi, R.; Kumar, S. A dissimilarity Jensen-Shannon divergence measure for intuitionistic fuzzy sets. Int. J. Intell. Syst. 2018, 33, 2216–2235. [Google Scholar] [CrossRef]
  49. Xiao, F. A Distance Measure for Intuitionistic Fuzzy Sets and Its Application to Pattern Classification Problems. IEEE Trans. Syst. Man Cybern. Syst. 2019, 51, 3980–3992. [Google Scholar] [CrossRef]
  50. Xie, D.; Xiao, F.; Pedrycz, W. Information Quality for Intuitionistic Fuzzy Values with Its Application in Decision Making. Eng. Appl. Artif. Intell. 2022, 109, 104568. [Google Scholar] [CrossRef]
Figure 1. Hierarchical structure of the study proposed.
Sustainability 14 06178 g001
Figure 2. 3-nested-dependencies model and 3-overlapping-circle model where (a,b) represent theoretical models while (c,d) depict reality models based on studies in literature in, respectively [5].
Sustainability 14 06178 g002
Table 1. Literature review for sustainable supplier selection.
SectorsMethods
Electronics industry [16]Analytic Network Process (ANP)
Construction industry [17]Fuzzy inference system
Telecommunication industry [18]Combination of Grey Relational Analysis and AHP
Food packaging industry [19]Multi-objective mathematical programming model along with TOPSIS
Dairy product manufacturer [20]Integration of two methods: ANP and TOP-SIS
Auto side parts manufacturer [21]Interval Type-2 Fuzzy set
Home appliance manufacturer [22]Combined method of fuzzy best–worst method and fuzzy CoCoOn with Bonferroni
Vehicle transmission industry [23]Integration of rough-fuzzy and TOP-SIS-DEMATEL
Textile industry [24]Fuzzy multi-period multi-objective method
Petrochemical industry [25]Fuzzy best–worst method with the fuzzy inference system
Producing transport vehicles [26]Intuitionistic fuzzy dissimilarity measure
Table 2. Criteria used in sustainable supplier selection problems.
AuthorsEnviromental CriteriaSocial CriteriaEconomic Criteria
[18]
Green cooperate image;
Eco-design;
Environmental management system;
End-of-pipe.
Work safety and labour health;
Training education and community influence;
Contractual stakeholders’ influence.
Cost;
Quality;
Service.
[19]
Greenhouse gas;
Pollution;
Environmental management system.
Occupational health and safety management system;
Training education and community influence;
Worker safety and health.
Cost;
Quality;
Delivery;
Loyalty;
Technical capability.
[17]
Environmental competencies;
Environmental management system.
The rights of stakeholders;
Worker safety and health.
Cost;
Quality;
Delivery;
Service.
[16]
Green design capability;
Green material inventory records.
NONE
Quality;
Delivery;
Service.
[20]
Defilement production;
Resource exhaustion;
Eco-design and environmental administration.
NONE
Quality;
Flexibility;
Technology capability.
[25]
Attention to air pollution;
Recycling materials;
Respecting regulations and standards;
Managing returned products.
Human rights;
Information disclosure;
Occupational health and safety management system;
Attention to the child labour problem;
Social commitment.
Cost;
Quality;
Delivery;
Flexibility;
Technology capability.
[27]
Control on pollution;
Environmental management and policies;
Green involvement;
Environmental competencies;
Energy conservation.
Employee rights;
Stakeholder rights;
Disclosure of information;
Health and safety;
Forced child labor;
Staff training;
Adherence to law and policy;
Influence on local community.
Cost;
Quality;
Delivery reliability;
Supply capacity;
Flexibility;
Service;
Relationship conditions.
[22]
Pollution control;
Environmental policies;
Environmental competencies;
Green management;
Environmental cost
Staff training;
Health and safety;
Information disclosure;
The rights of stakeholders;
The rights of employees
Delivery;
Transportation cost;
Service;
Cost;
Quality.
[21]
Green image;
Green competencies;
Environmental efficiency;
Pollution reduction.
Employment practices;
Health and safety.
Cost;
Quality;
Service.
Table 3. The studies related to personal perception in different fields.
SectorsAuthorsMethodology
Food safety[28] Survey to find out the risk perceptions of consumers during the COVID-19 pandemic.
Organic food[29] Interviews to analyze credibility effect on organic food consumption.
Battery-electric vehicle[30] Questionnaire to generate purchase intentions model under different hypotheses.
Battery-electric vehicle[31] Survey to assess consumer awareness of a particular car brand.
Buyer–supplier relationships[32]Survey to explore the role of similarity and likeability on buyer–supplier relationships.
Buyer–supplier interactions[14]Interviews to analyze supply chain professionals’ behaviors under different scenarios.
Buyer–supplier attraction[33] Interviews to explore how congruence in perceptions of attraction affects relationship success.
Supply chain attributes[34]Survey to explore dyadic buyer–supplier relationships and how attributes differ based on relations.
Table 4. Criteria and their symbol used in this study.
CriteriaSymbolSub-CriteriaSymbol
QualityM1Quality control rejection rate;
Customer rejection rate.
C1
C2
DeliveryM2Delivery lead time;
Delivery flexibility.
C3
C4
Service PerformanceM3Reliability;
Empathy.
C5
C6
CostM4Product price;
Logistic cost.
C7
C8
Environmental sustainabilityM5Environmental efficiency;
Green image;
Pollution reduction;
Green competencies.
C9
C10
C11
C12
Social sustainabilityM6Having OHSAS 18001 certification;
Rate of health and safety incidents;
Employee rights;
Forced child labour;
Staff training.
C13
C14
C15
C16
C17
Table 5. Linguistic variable to define importance of criteria [43].
Linguistic VariablesIFNs (μ, ϑ, π)
Very important (VI)(1, 0, 0)
Important (I)(0.75, 0.20, 0.05)
Medium (M)(0.50, 0.40, 0.10)
Unimportant (U)(0.25, 0.60, 0.15)
Very unimportant (VU)(0.10, 0.80, 0.10)
Table 6. Key notations used in this paper.
NotationMeaning
PiThe ith criterion to evaluate personal perception of decision makers where i = {1,…,8}.
MjThe jth main criterion to evaluate suppliers where j = {1,…,6}.
CkThe kth sub-criterion to evaluate suppliers where k = {1,…,16}.
w l The weight of the lth alternatives where where l = {1,2,3}.
DMmThe mth decision maker
C k G The global score of the kth sub-criterion where k = {1,…,17}.
C k G ( i ) Importance of the kth sub-criterion where k = {1,…,17}.
C k G ( p m ) Performance of alternative m for the kth sub-criterion.
SnThe nth alternative (supplier).
S n Scenario x The nth supplier for Scenario x.
Table 7. Importance of criteria assigned by decision makers for personal perception.
CriterionDM1DM2DM3CriterionDM1DM2DM3
P1VIIMP5MMVI
P2VIIMP6VIIVI
P3IIIP7VIMM
P4VIVIVIP8IIVI
Table 8. Importance of criteria assigned by decision makers for evaluating suppliers.
CriterionDM1DM2DM3CriterionDM1DM2DM3CriterionDM1DM2DM3
M1VIVIMC3MMMC11MVII
M2VIMMC4MMMC12MMM
M3MVIMC5VIMMC13MVIU
M4VIMUC6MMMC14MVIVI
M5MVIMC7VIMUC15MMVI
M6MMMC8VIMUC16MMVI
C1MVIIC9MVIMC17MMVI
C2MVIIC10MMM----
Table 9. Global score of importance for each criterion calculated.
Importance of CriteriaDM1DM2DM3
μϑπμϑπμϑπ
C1G0.500.400.101.000.000.000.380.520.11
C2G0.500.400.101.000.000.000.380.520.11
C3G0.500.400.100.250.640.110.250.640.11
C4G0.500.400.100.250.640.110.250.640.11
C5G0.500.400.100.500.400.100.250.640.11
C6G0.250.640.110.500.400.100.250.640.11
C7G1.000.000.000.250.640.110.060.840.10
C8G1.000.000.000.250.640.110.060.840.10
C9G0.250.640.111.000.000.000.250.640.11
C10G0.250.640.110.500.400.100.250.640.11
C11G0.250.640.111.000.000.000.380.520.11
C12G0.250.640.110.500.400.100.250.640.11
C13G0.750.200.050.500.400.100.130.760.12
C14G0.250.640.110.500.400.100.500.400.10
C15G0.250.640.110.250.640.110.500.400.10
C16G0.250.640.110.250.640.110.500.400.10
C17G0.250.640.110.250.640.110.500.400.10
Table 10. Supplier performance assignment using linguistic terms by three decision makers where S1, S2 and S3 represent the first supplier, the second supplier and the third supplier, respectively.
CriteriaDM1DM2DM3
S1S2S3S1S2S3S1S2S3
M1VHMHMHVHMHMHVHHVH
M2HHMHHMHVHHHMH
M3VHMHVHMHMHHHHH
M4MHMHVHMHMHVHHHH
M5MHHHMHHHHHH
M6HHHHHHMHHH
C1HVHMHMHVHVHVHVHMH
C2VHMHMHVHVHVHVHMHMH
C3MHHVHMHHVHHHH
C4MHHVHMHHVHHHH
C5VHVHMHMHVHHHHH
C6MHMHMHMHMHHHHH
C7VHMHVHMHMHVHHHH
C8VHMHVHMHMHVHHHH
C9MHHHMHHHHHML
C10HHHHHHMHHH
C11HHHMHHHMHHM
C12HHHHHHMHHM
C13VHHHVHHMHVHHH
C14HHHHHHHMHH
C15HHHHHHHHH
C16HHHHHHHHH
C17HHHHHHHHH
Table 11. Global score of each supplier for criterion C1 in terms of three decision makers.
Decision MakerS1S2
DM1(0.64, 0.24, 0.13)(0.55, 0.33, 0.12)
DM2(0.55, 0.33, 0.12)(0.55, 0.33, 0.12)
DM3(0.72, 0.19, 0.09)(0.64, 0.24, 0.13)
Table 12. The rank of alternatives along with their scores found using 3 different scenarios and 2 different distance measurement methods.
The Expert-Based Model
Euclidean DistanceTaguchi Loss Function
SuppliersPos. IdealNeg. IdealCloseness CoefficentRankPos. İdealNeg. IdealCloseness CoefficentRank
S1Scenario10.730.290.2872246.508.680.15732
S2Scenario10.740.290.2849345.978.570.15723
S3Scenario10.720.310.2986148.240.380.16281
S1Scenario20.730.290.2864346.408.630.15683
S2Scenario20.730.300.2876246.378.740.15862
S3Scenario20.720.310.2992148.329.420.16321
S1Scenario30.740.290.2792345.338.200.15323
S2Scenario30.740.290.2803245.258.300.15502
S3Scenario30.730.300.2906147.048.890.15891
The Theorical-Based Model
Euclidean DistanceTaguchi Loss Function
SuppliersPos. IdealNeg. IdealCloseness CoefficentRankPos. İdealNeg. IdealCloseness CoefficentRank
S1Scenario10.350.670.662188.045.70.3421
S2Scenario10.450.580.568280.234.10.2982
S3Scenario10.490.530.518375.728.10.2713
S1Scenario20.340.670.665188.4046.00.3421
S2Scenario20.450.580.563279.9033. 40.2952
S3Scenario20.490.510.502374.2026. 20.2613
S1Scenario30.340.680.666188.446.240.3441
S2Scenario30.450.580.564279.933.730.2972
S3Scenario30.510.520.505374. 426.660.2643
Publisher’s Note: MDPI stays neutral with regard to jurisdictional claims in published maps and institutional affiliations.

