Article

Influence of Miscanthus Rhizome Pyrolysis Operating Conditions on Products Properties

Institute of Environmental Technology, Centre of Energy and Environmental Technologies, VSB—Technical University of Ostrava, 17. listopadu 15/2172, Poruba, 708 00 Ostrava, Czech Republic
*
Author to whom correspondence should be addressed.
Sustainability 2022, 14(10), 6193; https://doi.org/10.3390/su14106193
Submission received: 4 April 2022 / Revised: 12 May 2022 / Accepted: 17 May 2022 / Published: 19 May 2022
(This article belongs to the Section Environmental Sustainability and Applications)

Abstract

:
Waste from the Miscanthus production cycle may be a promising source of material for the pyrolysis and biochar production. The biochar can be used to enrich the soil on which the crop grows, thus increasing productivity. A sample of Miscanthus rhizomes was used as a raw material in a series of experiments in order to find the most suitable conditions for the preparation of biochar. Miscanthus biochar was prepared in a laboratory unit using four different temperatures (i.e., 400, 500, 600 and 700 °C). All pyrolysis products were subsequently evaluated in terms of their quality and product yields were determined. For a temperature of 600 °C and a residence time of 2 h, the appropriate properties of biochar were achieved and the process was still economical. The biochar contained a minimal number of polycyclic aromatic hydrocarbons and a high percentage of carbon. Surface area was measured to be 217 m2/g. The aqueous extract of biochar was alkaline.

1. Introduction

Nowadays, biomass is one of the most promising renewable alternatives to fossil fuels. Due to many reasons, rapidly increasing utilization of lignocellulose feedstock for producing renewable energy and chemicals can be seen [1,2]. It currently represents the world’s fourth largest energy source after coal, oil and natural gas [3,4]. Miscanthus giganteus is a fast-growing and high-yielding grass originally from East Asia, the result of a cross between M. sinensis and M. sacchariflorus. It grows up to a height of 4 m and can be cultivated for approx. 10 years in the same place. Its adaptability to different environments makes this novel crop suitable for production in European and North American climatic conditions [5]. This rhizomatous grass with the C4 synthetic pathway has been reported as a high potential biomass [6]. Miscanthus is able to translocate minerals to its rhizomes in the winter, which makes it interesting [7]. Thus, Miscanthus is typically harvested during winter or early spring [8]. As the use of Miscanthus in different branches is growing continuously, so is the production of waste from processing it. Hand in hand with this, an important question about the possibilities of its further use arises.
Thermochemical methods offer a way of its processing. Pyrolysis can be highlighted among all the other techniques as a form of thermal decomposition without the presence of oxygen [9]. Biochar as one of the products is a carbon-rich porous material with a high specific surface area and special physicochemical properties. Biochar has been widely used in various applications reducing greenhouse gas emissions, improving soil fertility and crop yield, and remediating contaminated or degraded soils [10,11]. Biochar has been proposed to promote plant growth and improve plant productivity in saline-alkali soils [12].
The effect of biochar on soil fertility and its stability depends on the interactions of soil and climatic conditions with biochar physicochemical properties, mainly on feedstock and pyrolysis conditions. For example, Mimmo et al. reported that thermal and biological stability of biochar is affected by pyrolysis temperature in a nonlinear manner. Increased resistance to biodegradation has been confirmed for biochar produced at temperatures above 360 °C [13]. Biochar is widely used as an additive in agriculture [14,15,16,17]. Biochar is characterized by significant surface area, porosity, high water retention capacity, and environmental persistence. It is also considered as a suitable material for soil amendment. Application of biochar into soil does not usually have a toxic effect. However, possible negative effects should be considered in order to prevent their occurrence. Contaminants can be distinguished as either by products of pyrolysis, formed during biochar production, or components of the feedstock (polycyclic aromatic hydrocarbons, polychlorinated dibenzo-p-dioxins and furans, volatile organic compounds, heavy metals) [18]. Biochar can also be used as bio stimulant for the remediation of hydrocarbon contamination [19].
A major problem with the presence of contaminants in biochar is their availability to organisms and thus their potential toxic effect. Polycyclic aromatic hydrocarbons are the most frequently occurring contaminants in biochar. PAHs are formed during pyrolysis and have carcinogenous, mutagenous, and teratogenous properties. The content of PAHs depends on the organic matter in biochar, the residence time, the heating rate and the pyrolysis temperature [20]. The mass of polychlorinated dibenzo-p-dioxins and furans (PCDD/Fs) in biochar is generally low, and they form in biochar during the pyrolysis of a chlorine-containing material [21]. The other contaminants are heavy metals present in the feedstock, which remain in biochar after pyrolysis, often more concentrated [18]. Biochar may induce a positive effect on the reproduction of microorganisms by providing both protection and a carbon source. However, biochar could have negative impacts on soil microorganisms [22]. The greatest toxic effect in this matter was observed in biochar produced at 300 °C. With increasing temperature, its toxicity decreased [23]. The effect of biochar on the plants is strictly determined by the kind of biomass and pyrolysis conditions. Electrical conductivity and pH play a considerable role as well [18].
The total amount of contaminants in biochar does not correspond to the number of contaminants causing toxic effects. Therefore, it is very important to determine the amount of contaminants with these harmful properties [24,25]. Miscanthus can be classified as a biomass tolerant to heavy metals. This makes it interesting for use in phytoremediation of areas previously contaminated by heavy metals and where energy production is possible [26]. Plants generally transfer metals from the soil through the roots to the shoots, but Miscanthus protects its photosynthetic system by regulating and limiting this transfer. It does not transfer metals to aboveground parts, but accumulates them mostly in rhizomes [27,28].
This study is focused on the possibilities of using waste from the Miscanthus production cycle (Miscanthus rhizomes) as an alternative source for material with a higher utility value, especially biochar. It follows the demand of EU Bioeconomy Strategy encouraging the production of renewable biological resources and processing to vital products and bio-energy. From that perspective, Miscanthus, a popular perennial non-food crop resistant to pests with a high lignocellulose content, looks like excellent feedstock for producing fibre-based materials. Its physiological characteristics and extensive root system allow the plant to adapt to various soils and environmental conditions. Moreover, this adaptation can be promoted with the use of its biochar. Unlike in previous studies, in which the authors deal with the production of biochar from the aboveground parts of Miscanthus, i.e., stems and leaves, the aim of this study is the processing of Miscanthus rhizomes and search for a suitable pyrolysis condition for Miscanthus rhizomes biochar production. Due to the long period of availability of Miscanthus rhizomes to produce aboveground biomass (10 years or even more), pyrolysis and processing of Miscanthus rhizomes has not been addressed so far. Besides, in contaminated postmining soils, repeated utilization of Miscanthus in the form of biochar will bring additional positive outcomes, including improving soil quality, in line with the “zero waste” approach. In addition, gaseous and liquid products were evaluated and dependencies were given.

2. Materials and Methods

2.1. Feedstock

For the series of experiments, Miscanthus rhizomes were used in order to find the suitable conditions for biochar preparation. Miscanthus was produced by S WHG Ltd. (Valasske Mezirici, Czech Republic in a local field. The sample was air-dried and adjusted to the required size with the use of knife grinder LMN 180 (Testchem Sp. z o.o. Pszów, Poland). The fraction rate of 3–5 mm was used.
Proximate and ultimate analysis of biochar was performed according to the standard procedure of the American Society for Testing and Materials. Thermogravimetric analysis was performed on a TGA 701 analyzer (LECO, US, St. Joseph, MI, USA) in an inert helium atmosphere at a heating rate of 5 °C/min in a temperature range from ambient temperature to 800 °C in accordance with ASTM D1762-84. Elemental analysis was performed on a CHSN 628 elemental analyser (LECO, US) according to ASTM D5373, and higher heating value was determined on an AC 600 calorimeter (LECO, US), and the standard ASTM E711 was used. The Miscanthus rhizomes were also subjected to chemical analysis based on standard operating procedure SOP 87 for the purpose of lignin, cellulose and hemicellulose determination.

2.2. Experimental Setup

The Miscanthus biochar was prepared in a laboratory unit [29] at different temperatures. Four different temperatures (i.e., 400, 500, 600 and 700 °C) were selected for experiments with a residence time of 2 h (marked 600/2). Based on the initial results of experiments with selected temperatures, for a temperature of 600 °C, two other residence times were chosen (15 min and 1 h; marked 600/0.25 and 600/1). The heating rate of 5 °C/min was used the same for all experiments. The pyrolysis experiments were performed using the fixed bed reactor. The reactor was externally heated by an electrical furnace, in which the temperature was measured by a thermocouple placed inside the oven. The laboratory unit was supplemented by a cooler and a flask for condensate collecting. A retort with an appropriate quantity of sample (100 g) was connected with other parts of apparatus and the whole system was inertized using nitrogen before starting the experiment. A gasometer Spektrum P 0.1 (Spektrum s.r.o., Skutec, Czech Republic) was placed at the end of the apparatus. The pyrolysis gas was captured into Teglar bags and subsequently analyzed as mentioned below.

2.3. Gas Characterization

For each experiment, three gas samples were gradually taken. Sample 1 was taken up to 350 °C, sample 2 was taken from 350 °C to a final temperature (400, 500, 600 or 700 °C) and the last sample 3 was taken throughout the residence time on the final temperature. All samples were analyzed by gas chromatography and the quantity of H2, CO, CO2, CH4, and light hydrocarbons were determined by gas chromatograph YL 6100 (Young In Chromass, Anyang, Korea) with FID and TCD detectors and micropacked ShinCarbon column (2 m × 0.53 mm). Conditions for GC are given in Table 1. Higher heating value was calculated for each sample based on its gas composition.

2.4. Condensate Characterization

To identify all compounds and their percentages in the condensate, samples were prepared by mixing a 10 mL sample of condensate with 10 mL of dichlormethane. Dichlormethane phase was separated in a separatory funnel and the remaining phase was further mixed with 10 mL of diethyl ether. The ether phase was separated. The solvents from the dichloromethane and ether phases were evaporated by the sample concentrator with block heater (SBHCNC/1, SBH200D/3). After evaporation, a film was formed which was dissolved in 5 mL of acetone and evaluated by a gas chromatograph Agilent 7890b (Agilent, Santa Clara, CA, USA) with a mass spectrometer using a column HP-5 for non-polar substances and a column WAX for polar substances. MS—single quad, scan 20–650 m/z, MS source 230 °C, MS Quad 150 °C were used. The water content in condensates was determined by the Karl-Fischer method on TitroLine 7500 KF (Xylem Analytics, Weilheim, Germany).

2.5. Biochar Characterization

Proximate and ultimate analyses were performed with the use of TGA 701, CHSN 628 and AC 600 analyzers. Biochar was evaluated in terms of its sorption properties using 3Flex commercial apparatus (Micromeritics, Norcross, GA, USA). The analysis of surface area follows the methodologies presented in ASTM D6556-10. Physisorption measurement of nitrogen at 77 K allows evaluation of textural properties of porous materials such as specific surface area, micropore volume, mesopore and macropore surface or pore size distribution from ~0.35 to ~200 nm. Prior to measurement, each sample was dried and degassed in a vacuum (~0.06 mbar) at 350 °C for 48–120 h. Samples prepared at less than 350 °C were dried at lower temperatures in order to prevent their oxidation. For pH and EC determination, samples of raw Miscanthus rhizomes and biochars were prepared by adjusting their size using a mortar first and then they were mixed with de-ionized water, in a ratio of 1:20. These samples were blended on a shaker for 90 min.
All biochars were subjected to soil toxicity assessment. Toxicants may be divided into two categories. The first category is toxic substances present in the used feedstock (i.e., heavy metals) and the second category is formed by products which are created during pyrolysis process (i.e., polycyclic aromatic hydrocarbons). The amount of heavy metals in biochar was determined by the S-METAXHB1 method for As, Cd Cr, Co, Cu Pb, Hg, Mo, Ni, Zn and for Se determination, the S-METAXHB2 method was used.
PAHs were extracted from 1 g biochar samples using 24 h Soxhlet extraction with 150 mL toluene as a solvent. Extracts were stabilized by adding a small amount of iso-octane and further were concentrated to 1 mL on vacuum vaporizer. These samples were analyzed on GC-MS with SIMs analysis for 12 basic PAHs.
The total and available content of Ca, K, Mg, S (sulphates), F (phosphates) and N (ammonium and nitrates) in biochar samples were determined as well. The total content of components was measured according to the ČSN EN ISO 11885 and ČSN EN 13657 standards. The amount of available content was determined in an aqueous extract according to the Flame Atomic Absorption Spectroscopy method in a ratio of 1:10. The aqueous extract was prepared based on the method Merlich III.
The morphology structure of the biochar was studied with the use of Scanning Electron Microscopy (SEM: Tescan Vega, TESCAN ORSAY HOLDING, a.s., Brno, Czech Republic) with Tungsten cathode and energy-dispersive X-ray spectroscopy (EDS: EDAX, Pleasanton, CA, USA). Micrographs were obtained using secondary electrons (SE) and backscattered electrons (BSE) mode with an acceleration voltage of 30 KeV. Samples were gold sputtered before imaging to ensure adequate electron conductivity.

3. Results and Discussion

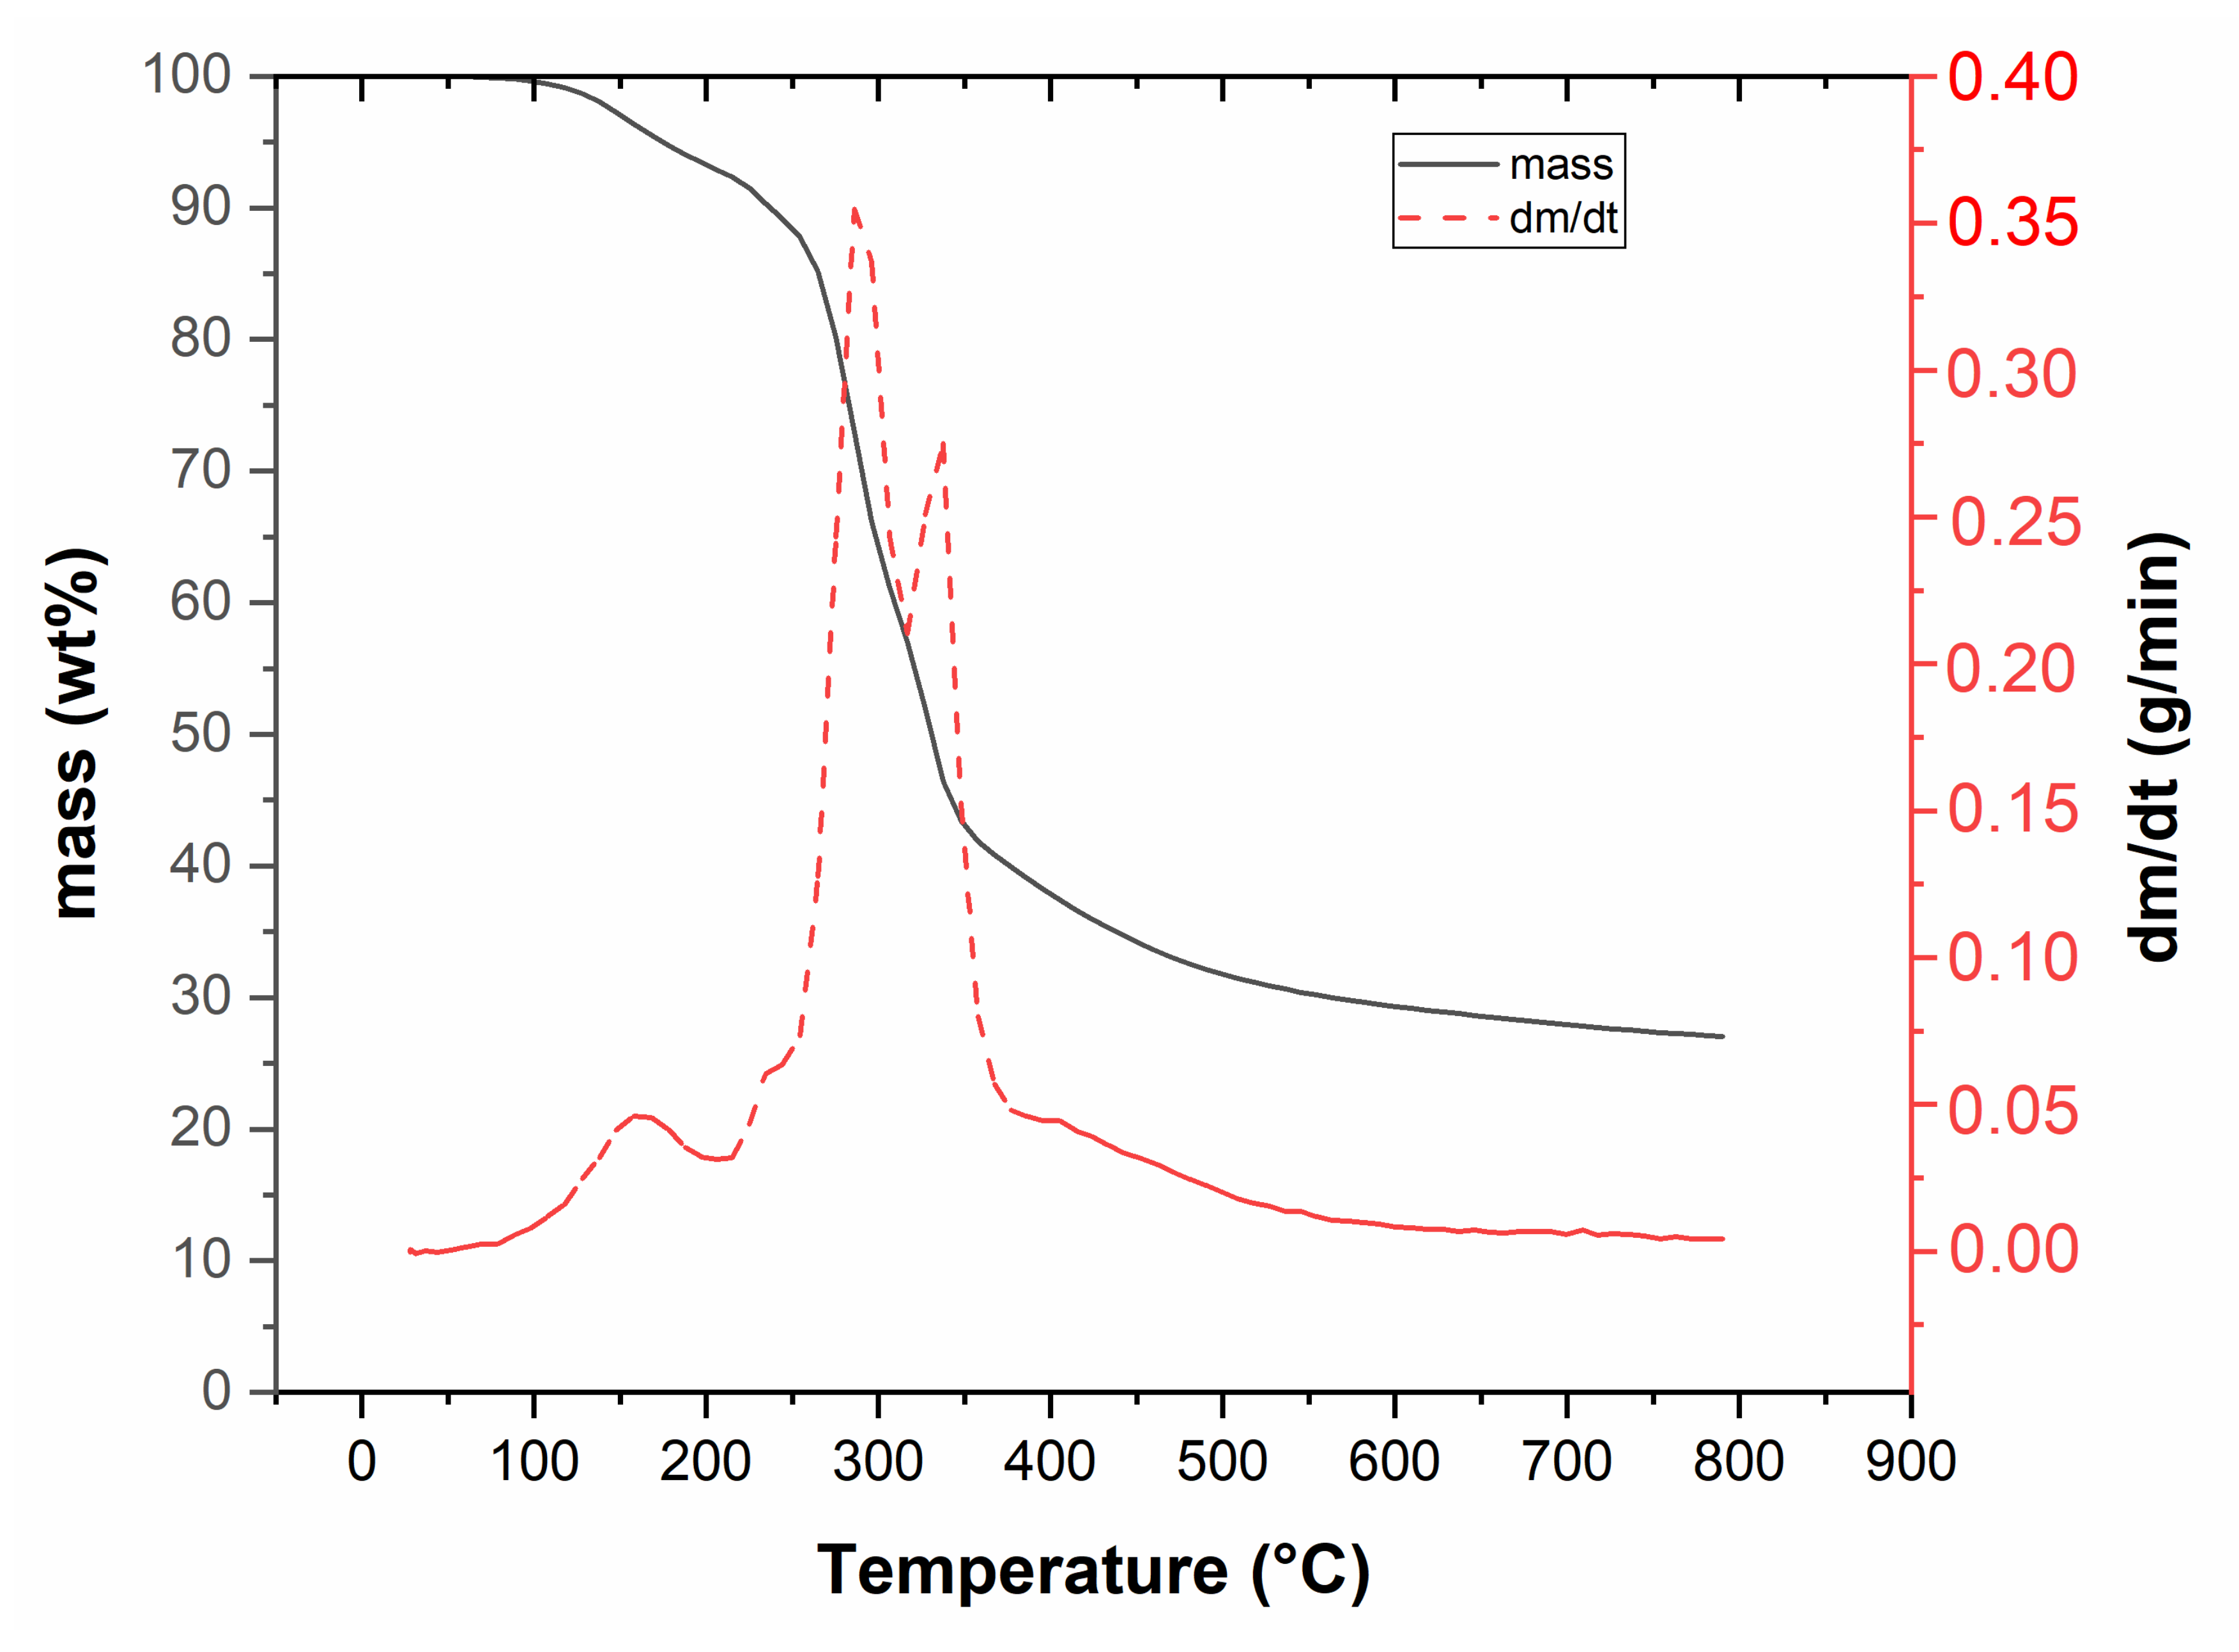
3.1. Feedstock Characterization

The behaviour of Miscanthus during pyrolysis was strongly related to its composition. The ash content was 3.42 wt.%, which corresponds to ash content 3.52 wt.% reported by Lakshman et al. [30]. The basic components of biomass have several different chemical and physical properties, which affect the pyrolysis process and thus biochar production [31]. The material with HHV 19.8 MJ/kg had a moisture of 8.53 wt.%; this parameter is very important factor as it affects its thermal degradation. For the pyrolysis experiment, a water content of feedstock below 10 wt.% is recommended. Moisture then contributed to the water content in the condensate [30].
Thermal degradation of raw Miscanthus rhizomes can be seen in Figure 1. The first peak is connected with water evaporation and it is followed by thermal degradation, which started at 250 °C and ended at around 400 °C, with a 70 wt.% mass loss. This loss was mainly caused by cellulose and hemicellulose decomposition; at approximately 300 °C it was linked to the decomposition of hemicelluloses (second peak), and between 350 and 400 °C due to the decomposition of cellulose (third peak). Lignin reacted in the temperature range from 200 to 800 °C [32], and its decomposition was evident by a gradual decrease in mass, especially at higher temperatures as already reported [33,34].
The lignocellulosic structure of a plant is also important because it forms a significant portion of dried biomass [35]. From the chemical composition it can be seen that the used Miscanthus rhizomes consisted mainly of lignin (approx. 65 wt.%), which is not unusual. The higher amount of lignin means slower decomposition and lower water mass in the condensate, as published by Lakshman et al. [30]. Product balance depends on the type of equipment, the temperature in the reactor, the heating rate, and residence time in the heating zone. The yields of biochar decreased with rising temperature, which is in contrast with Budai et al. [33]. The increasing pyrolysis temperature affected the decomposition and content of volatiles, as well as the content of organic substances present in the biomass. Increasing residence time led to a decrease in biochar yield. A significant biochar decrease occurred at a temperature from 400 to 500 °C. The effect of temperature on the yields of biochar, gas and condensate is shown in Figure 2. The temperature effect is shown on the left, the residence time effect on the right. From the product balance it can be seen that with rising temperature the yield of generated gas increased.

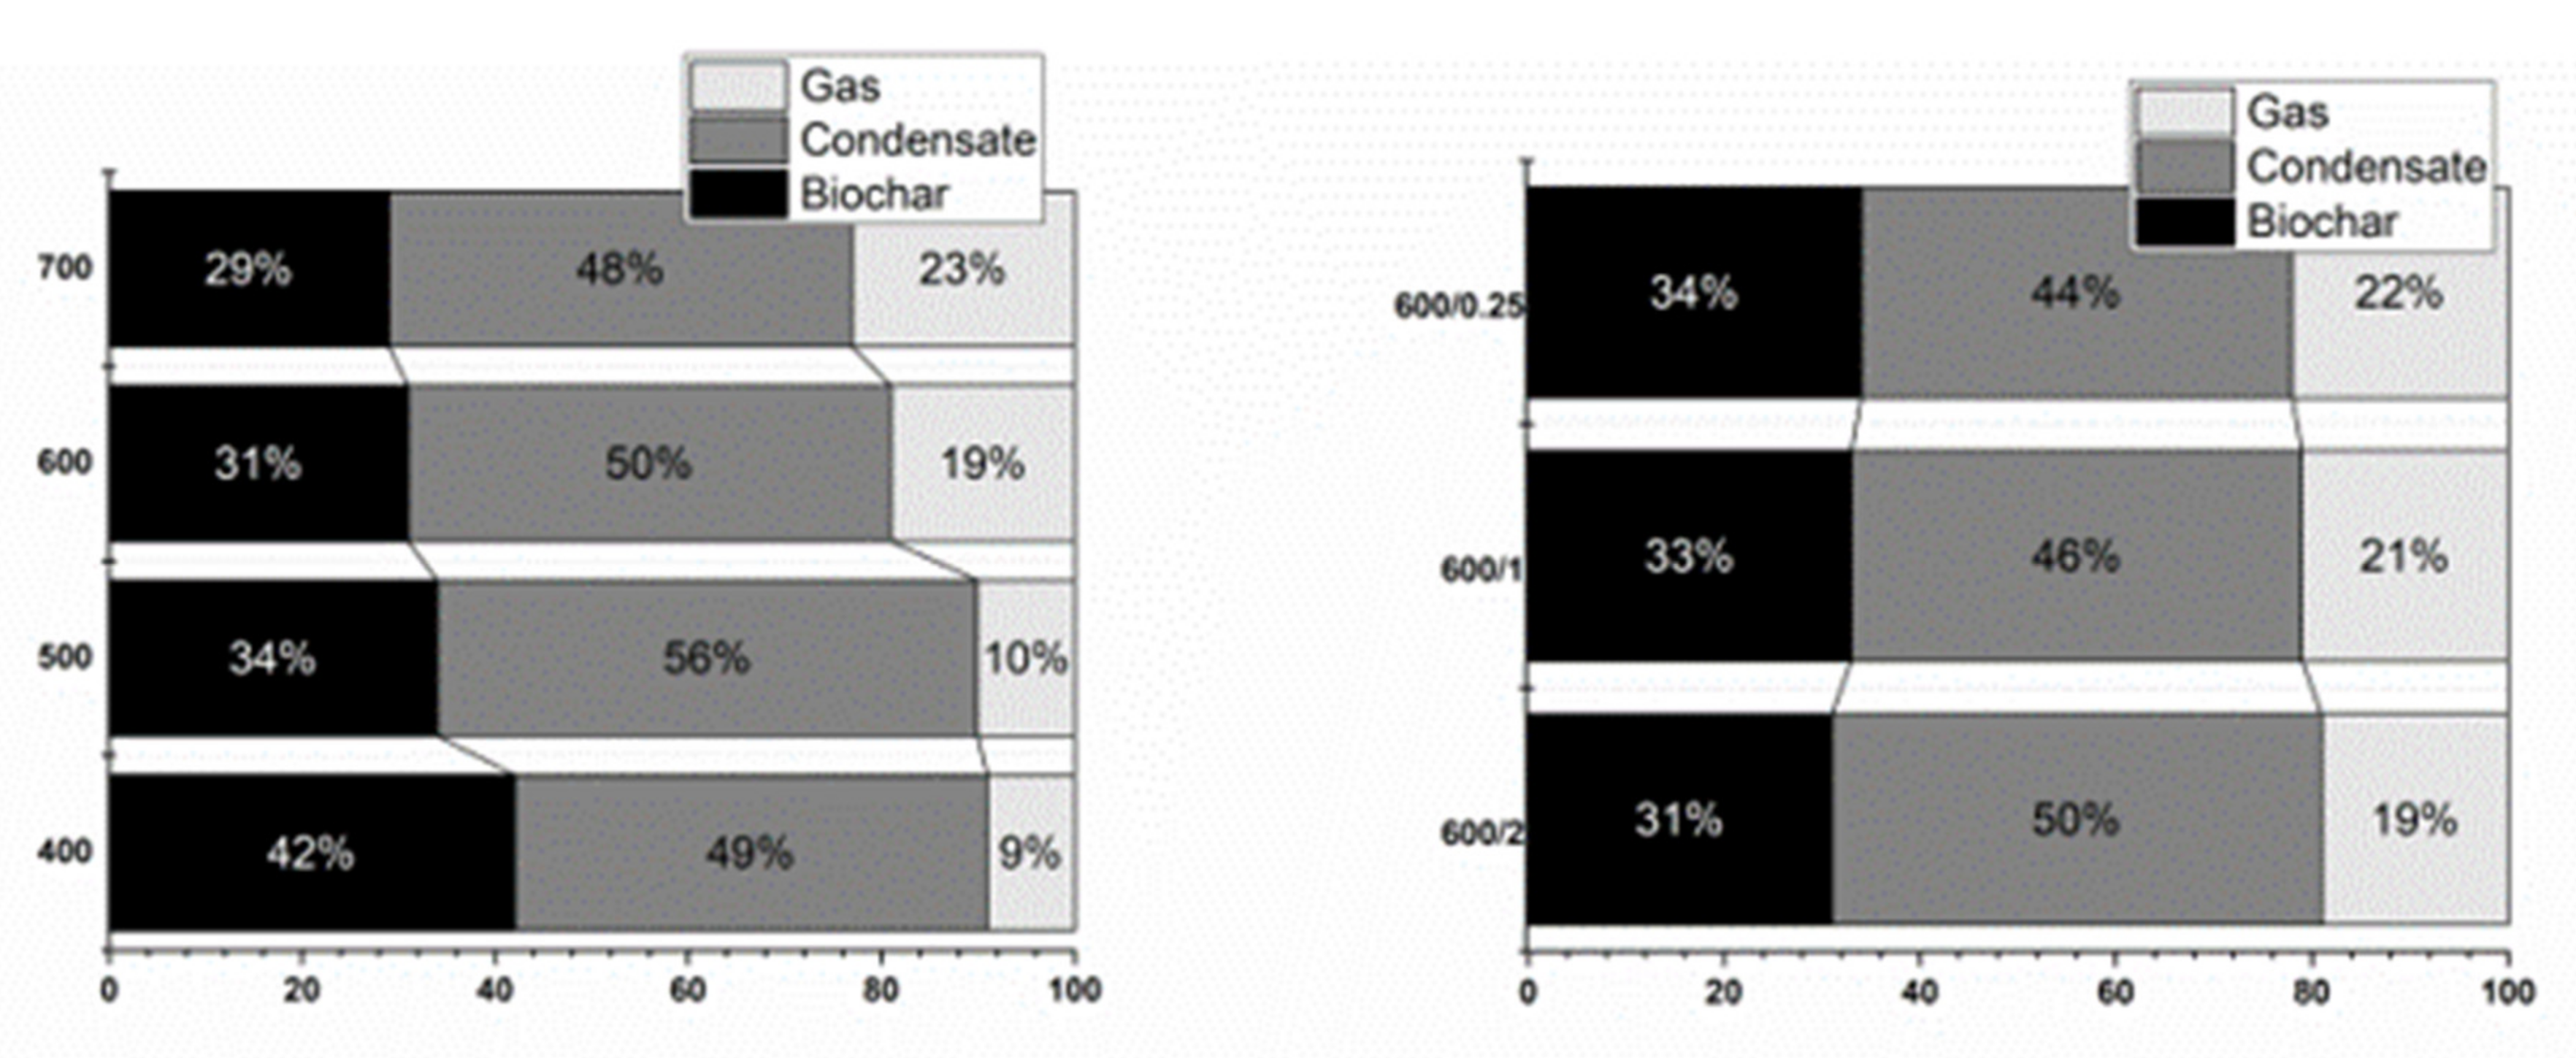
3.2. Gas Characterization

Three gas samples were taken for each experiment. The average quantity of H2, CO, CO2, CH4, and light hydrocarbons is shown in Table 2. Higher heating value was calculated for each gas sample. Higher heating value (HHV) was chosen as a parameter for evaluating the quality of the pyrolysis gas created during the pyrolysis process. During the experiment, three samples were taken at different temperatures (see Section 2). HHVs of these samples are shown in Figure 3. It is clear from the results that the composition of Sample 1 was always the same, as all materials were heated to 350 °C at the same heating rate. The dominant component was CO2, which was about 70% in the gas. The rest was mainly CO. For Sample 2, a change is already noticeable, where HHV of the gas increased with increasing final temperature. At 400 °C, the gas still had 63% CO2, 35% CO and a small amount of light hydrocarbons. At 700 °C, the CO2 content decreased to 45 vol.%, CO decreased to 25 vol.%, but there already were 20 vol.% CH4 and about 5% light hydrocarbons. These hydrocarbons, including methane, significantly increased HHV. This can also be observed in the last Sample 3, where HHV increased up to values of 25 MJ/kg. In Sample 3, the proportions of hydrocarbons as well as hydrogen were already increasing, while the CO2 content decreased significantly. The breaking temperature was between 500 and 600 °C, where at 500 °C CO2 content was still 40 vol.%, while at 600 °C CO2 content ranged from 20 to 28 vol.% (depending on residence time). The amount of hydrogen in Sample 3 at 700 °C was up to 40 vol.%, while at temperature of 400 °C it was barely 1 vol.%.

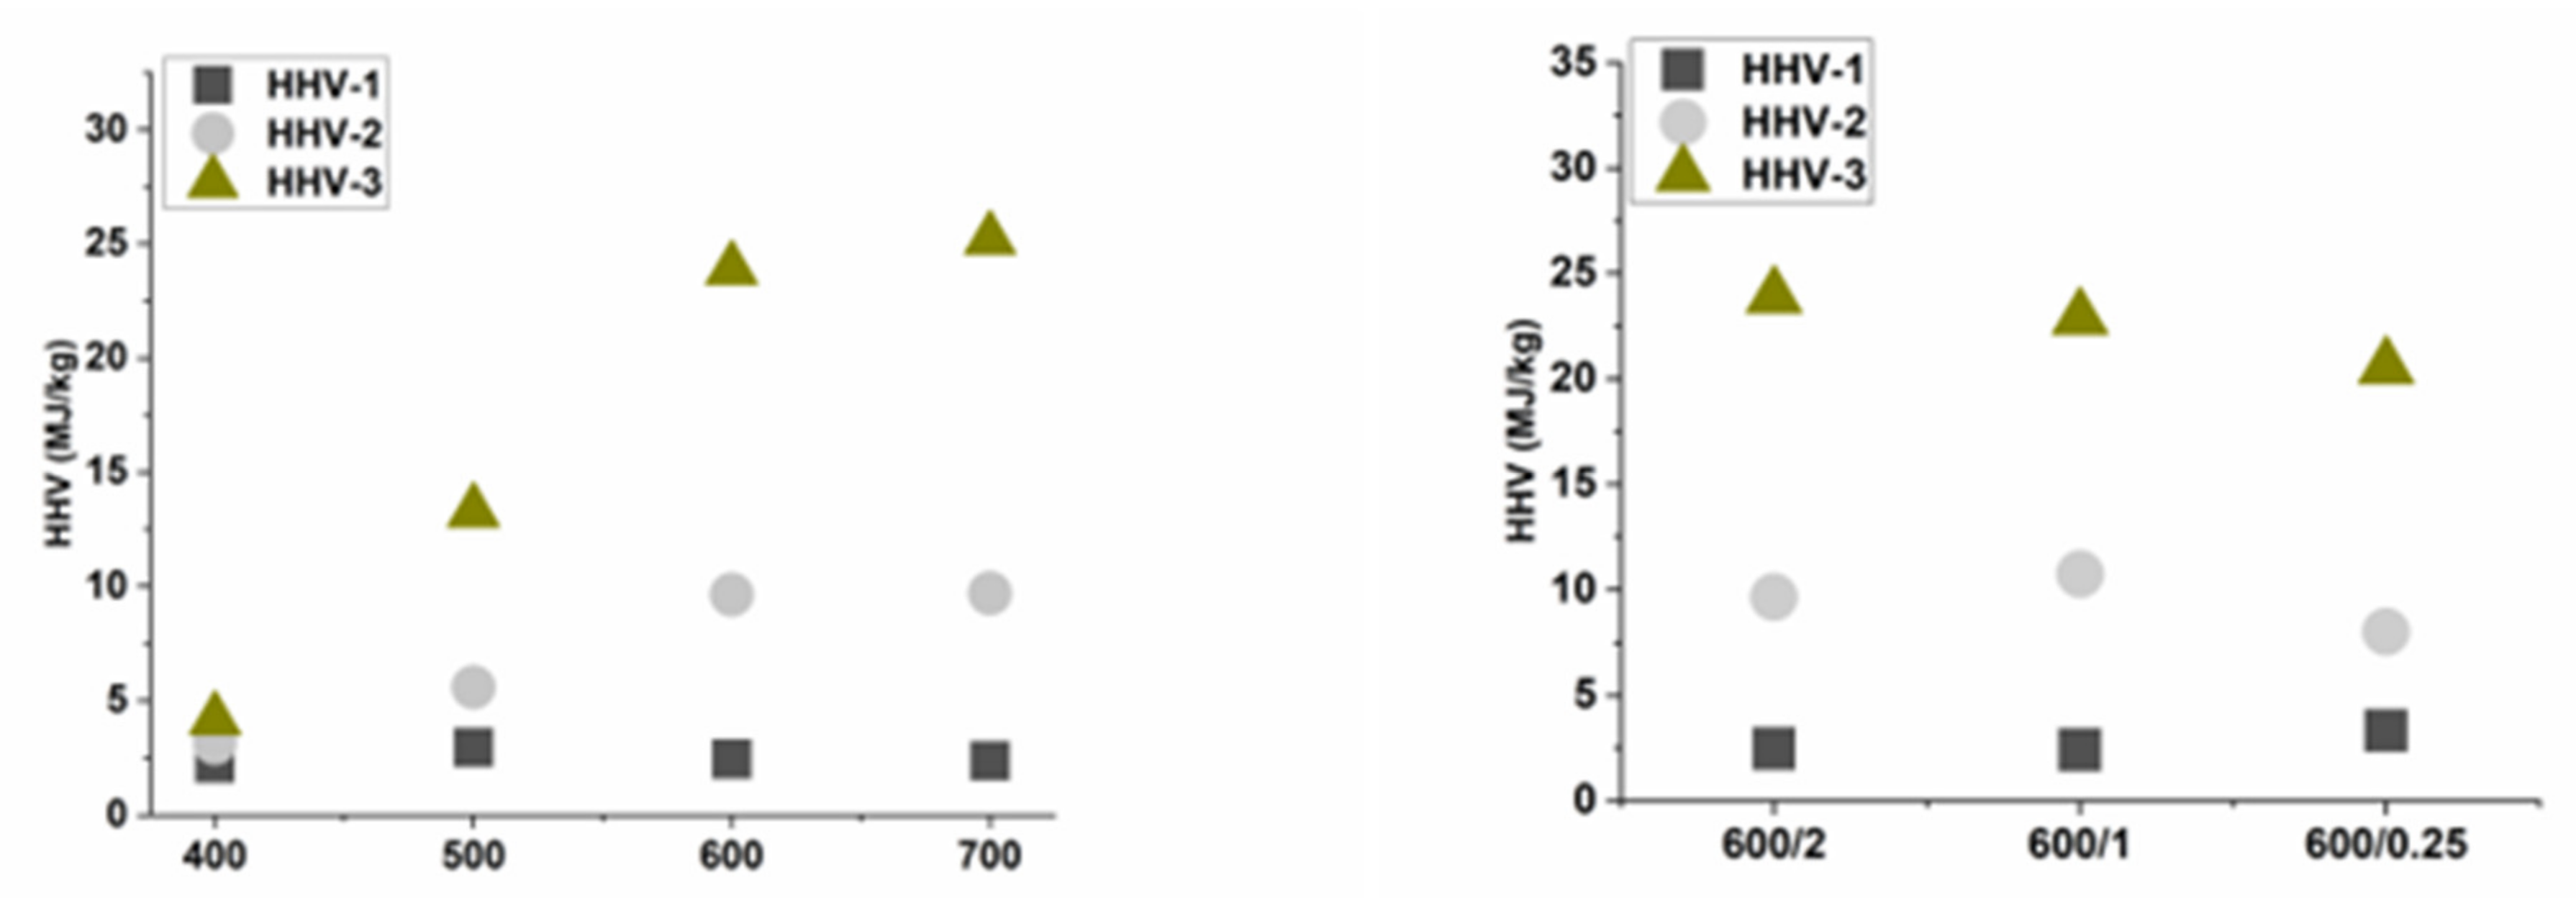
3.3. Condensate Characterization

The amount of resulting condensate ranged from 44 to 56 wt.%. In general, it is well known that maximum yields of condensate from biomass are obtained at reaction temperatures around 500 °C [36]. All condensates contained a huge amount of water, and the water content in the condensate was measured in the range from 27.7 to 29.8 wt.%. The water content was roughly the same within the measurement error. Determination of water content in the condensate was limited by the considerable inhomogeneity of pyrolysis oil, where part of the substances insoluble in water adhered to the walls of the containers, and even thorough shaking did not form a homogeneous solution, which was necessary for a correct determination. These results inform that the temperature of biochar preparation did not have a significant effect on the amount of water in the condensate. Higher heating value of condensate was insignificant, due to the high amount of water negligible (0.15 MJ/kg).
The results from GC-MS are shown in Table 3. Two samples were prepared for each experiment. The first sample contained water-soluble compounds and the second sample contained water-insoluble compounds. Water soluble compounds contained a huge amount of Acetic acid, 1-hydroxyl-2 Propanone and Phenol and the water-insoluble compounds contained 1-(acetyloxy)-2-Propanone, 2-methoxy-Phenol and Phenol. These results showed a similar tendency compared to Bergs et al. [34] focused on stem/leaf Miscanthus mixture pyrolysis. The temperature did not significantly affect the composition of the condensate. The reason is that the majority of condensate was formed until the temperature of 400 °C, as shown in the TGA curve (Figure 1).

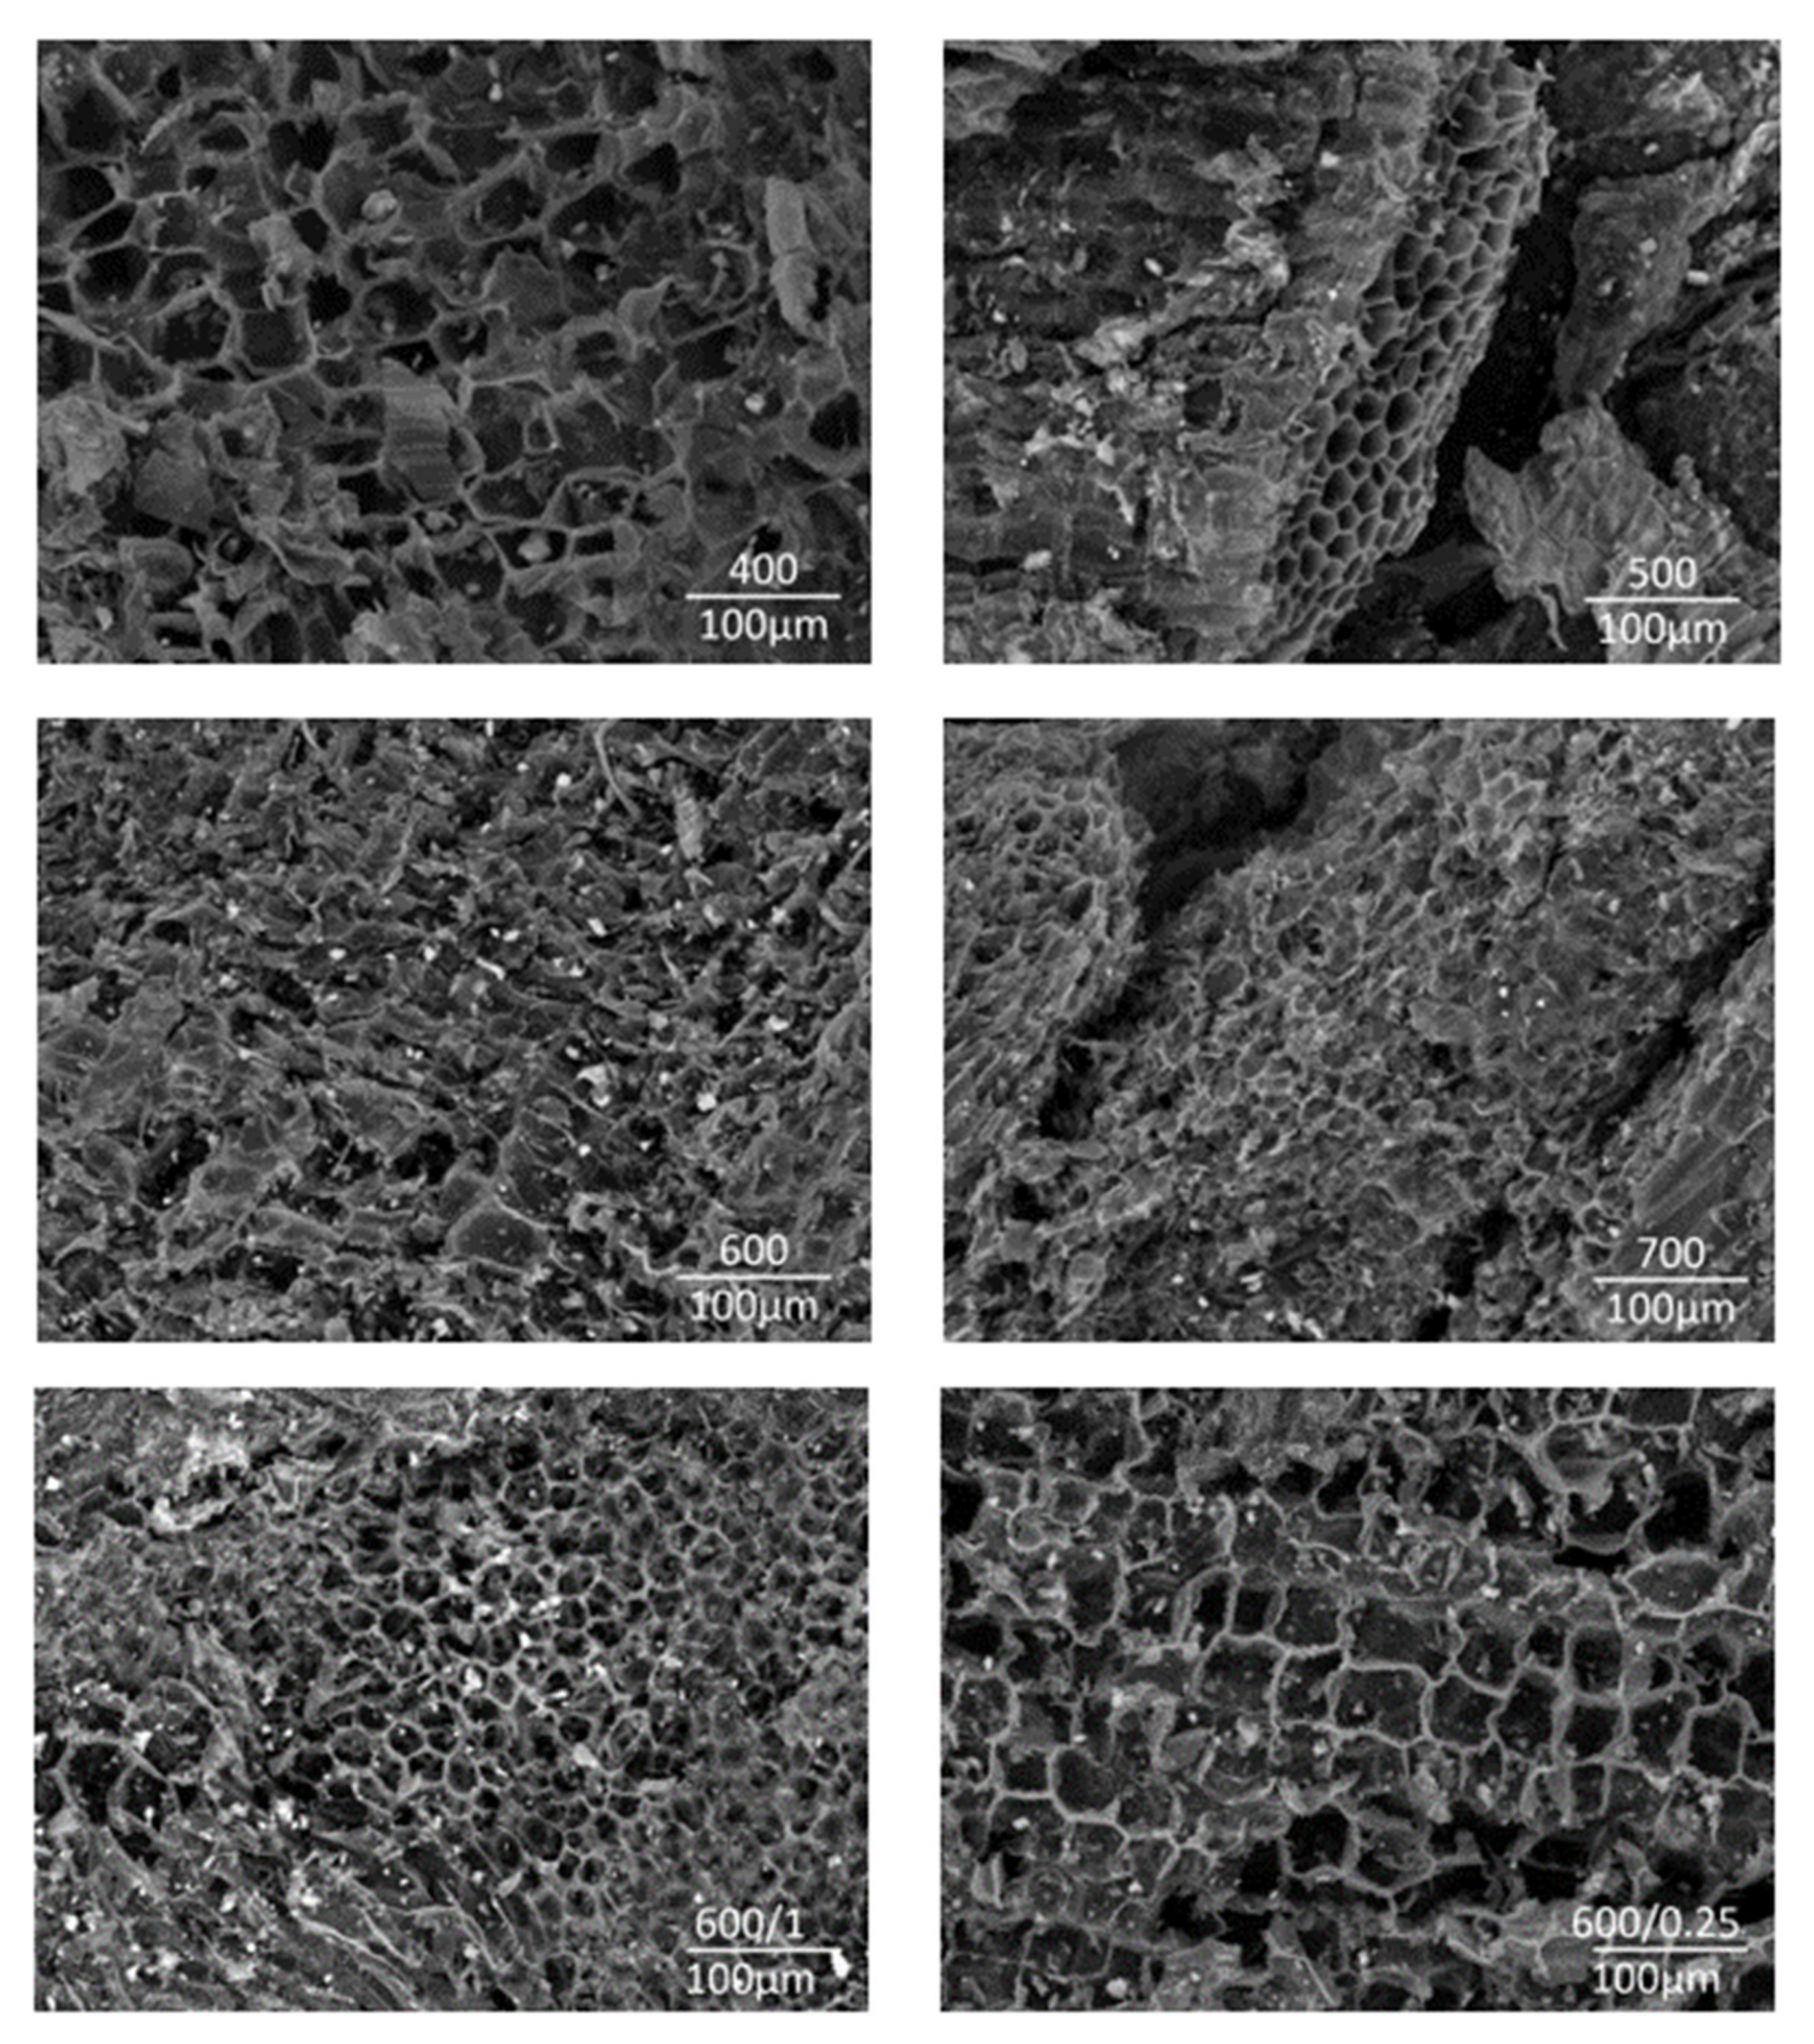
3.4. Biochar Characterization

Thermogravimetric, elemental and calorific analyses were performed for raw Miscanthus rhizomes and all biochar samples. The results are presented in Table 4. The volatile and moisture content decreased with increasing temperature. Temperature had positive effect on HHV. The amount of carbon was higher for biochar compared to raw Miscanthus and its amount increased with rising temperature.
Proximate analysis confirms that moisture (W) and volatile matter (VM) decreased with the increase in the pyrolysis temperature, while the amount of the fixed carbon (FC) significantly increased with increasing temperature, which corresponds to Huang et al. [37]. As the pyrolysis temperature increased, the amount of hydrogen and oxygen atoms were released through dehydration and decarboxylation reactions. The HHV increased with the reaction temperature, and the yield of ash increased as well.
Pyrolysis is primarily characterized by degradation of hemicellulose. Dehydration and decarboxylation are the main reactions in this degradation.
The purpose of the pyrolysis of biomass is to maximize energy and yields while reducing O/C and H/C ratio. The biochar yield during pyrolysis decreased with increasing temperature. While the O and H content significantly decreased with increasing pyrolysis temperature, the opposite happened to C and N content. The effect of temperature can be clearly described by the Van Krevelen diagram (see Figure 4). The O/C and H/C ratio decreased with increasing pyrolysis temperature. Nevertheless, according to the analysis of the effect of residence time on biochar characteristics, fuel characteristics did not significantly change. This finding implies that biochar characteristics were mainly influenced by the pyrolysis temperature rather than residence time, which corresponds to Huang et al. [37]. The Van Krevelen diagram shows the effect of the process parameters except pyrolysis temperature on the chemical reactions during the biochar preparation, as reported by Schimmelpfennig et al. [38].

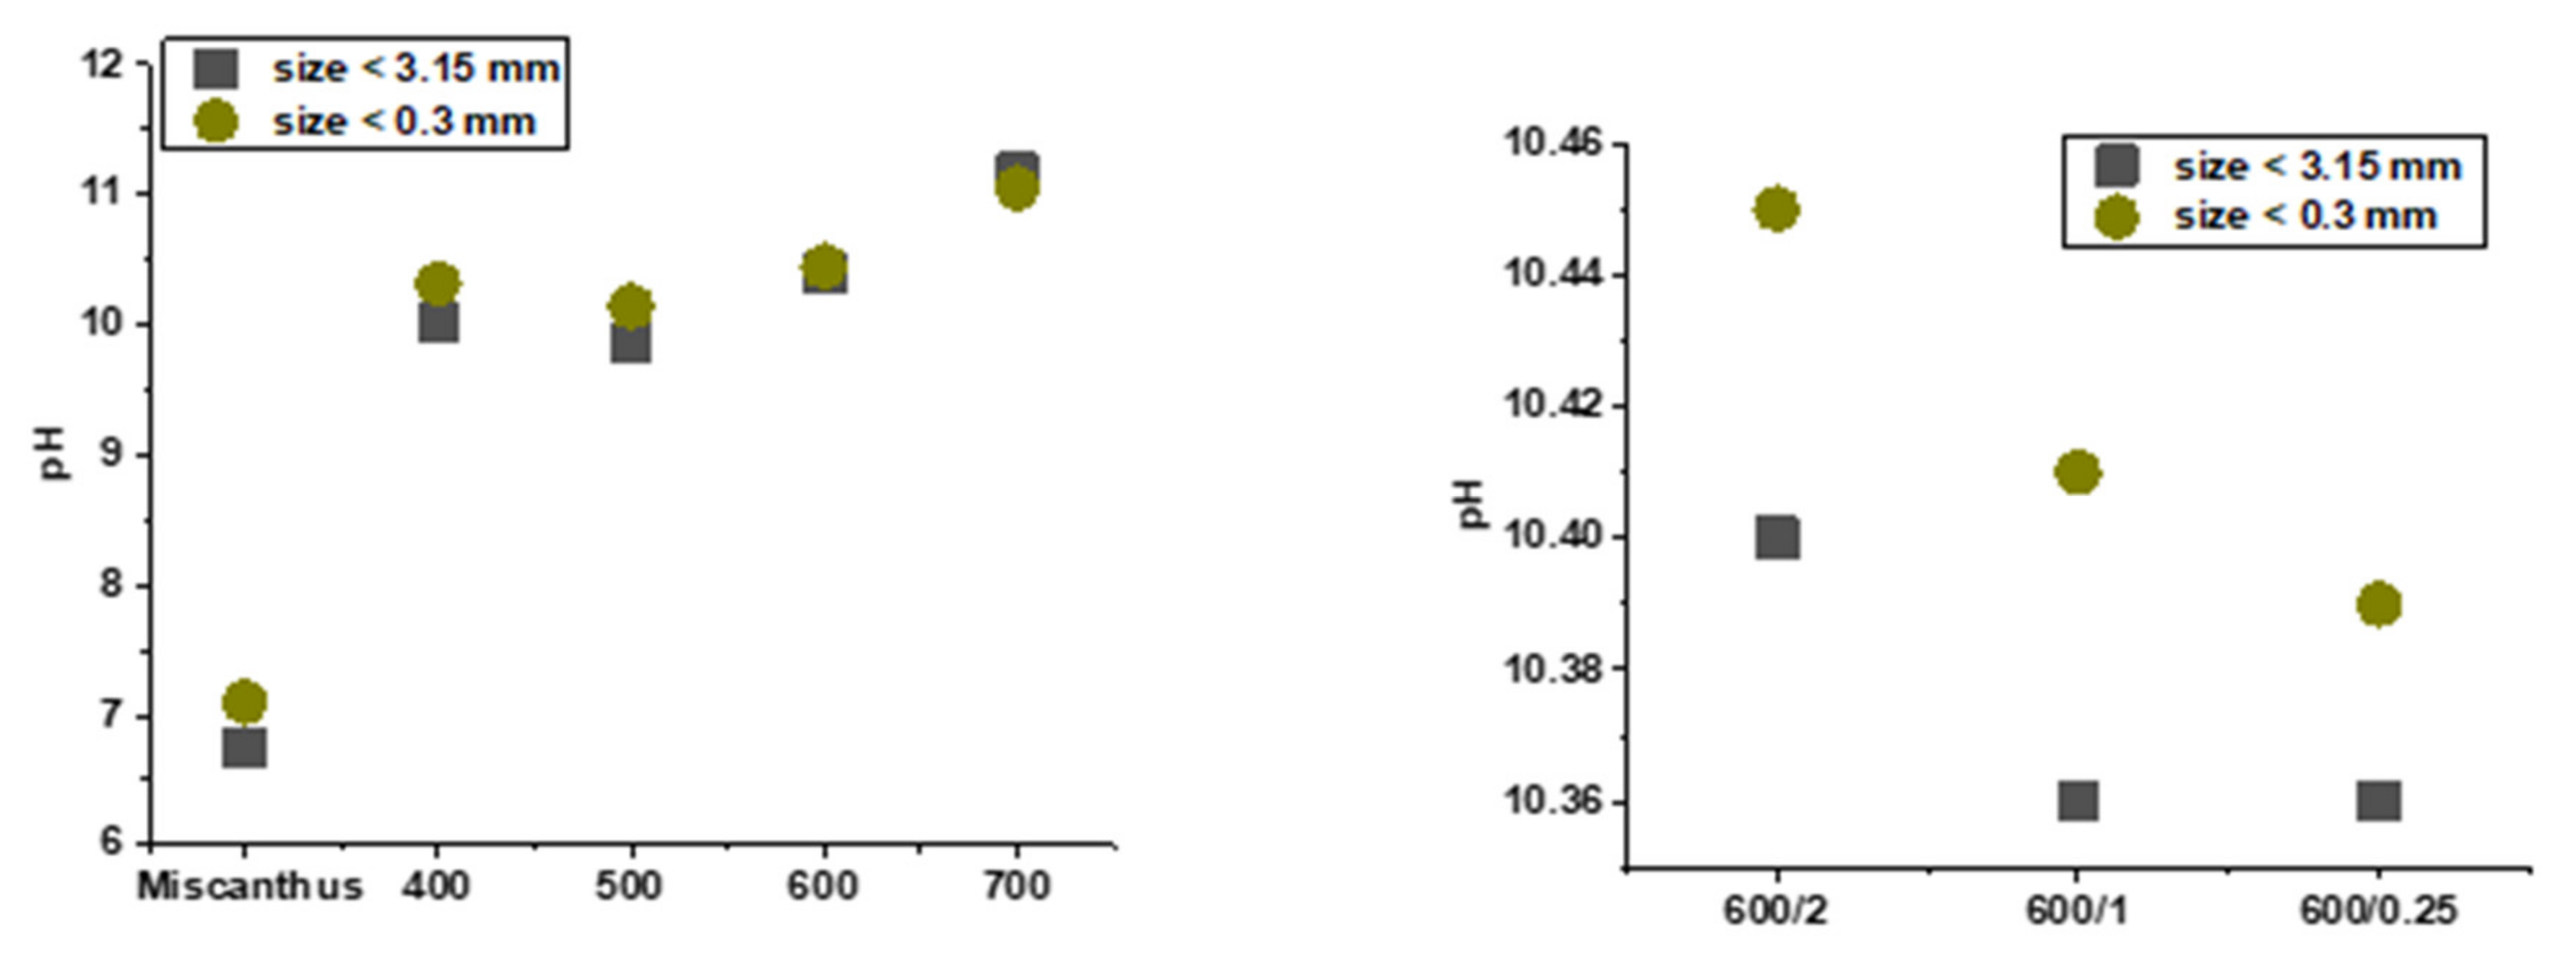
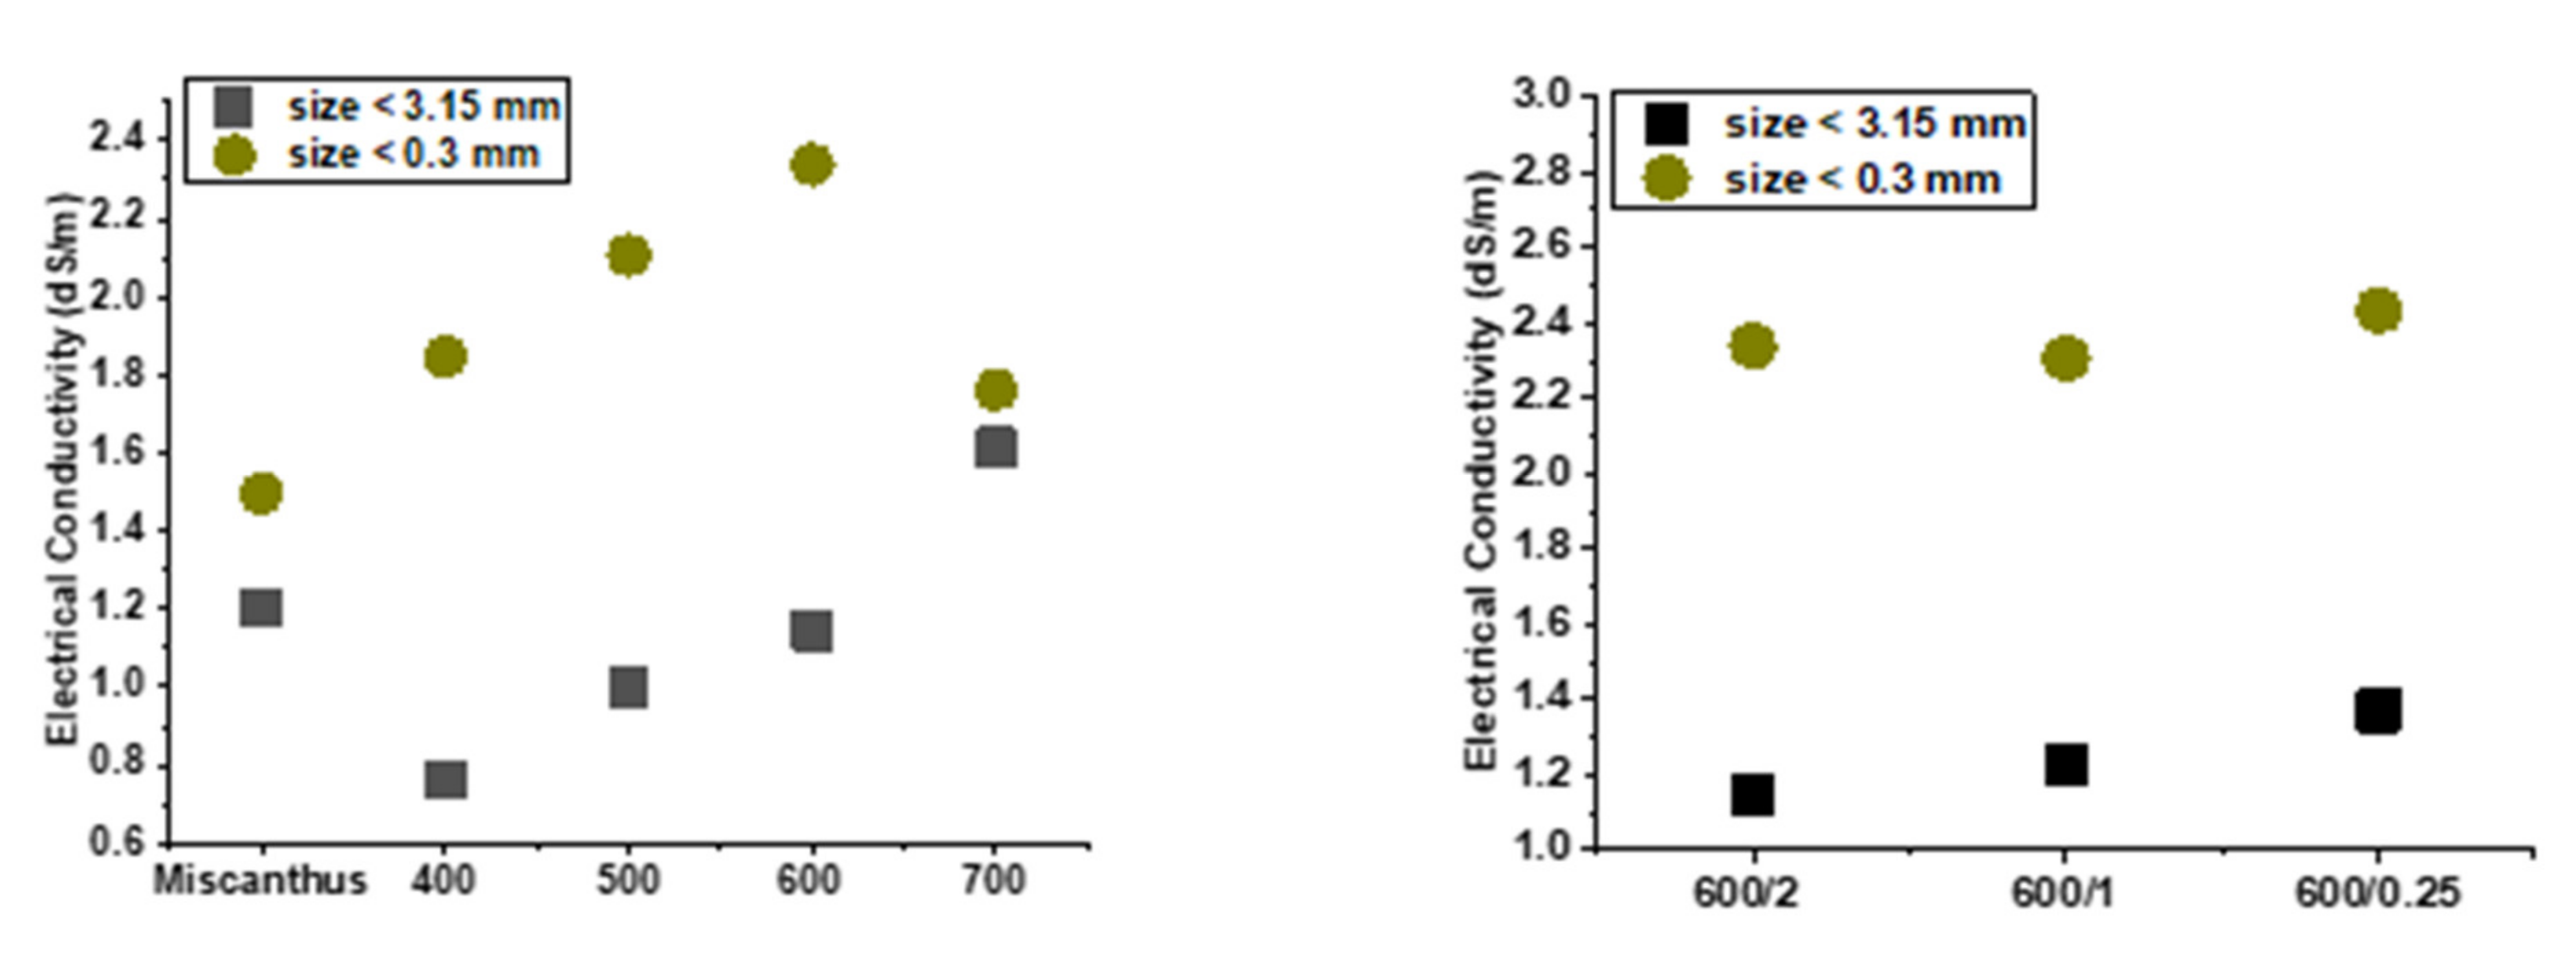
3.5. pH and Electrical Conductivity (EC)

pH and electrical conductivity are important properties of the soil. EC and pH were determined for raw Miscanthus rhizomes and all biochars using two grain sizes (<3.15 mm; <300 µm). Pyrolysis temperature affected both pH and EC. The aqueous extract of biochar was alkaline. As the temperature increased, the pH rose, which is in agreement with Skopas et al. [39]. pH values of the biochars increased from slightly alkaline to highly alkaline as carbonization temperature increased (Figure 5). As the temperature of pyrolysis rose, the EC of biochars increased (Figure 6). This phenomenon is due to the fact that during pyrolysis, the bonds of higher molecules were broken up and simpler inorganic compounds were formed, thus increasing electrical conductivity.

3.6. Surface Area

Macropores are relevant to vital soil functions. The presence of the larger amount of macropores, mesopores, and micropores in biochar may improve physical properties of soil [40]. Specific surface area was measured for raw Miscanthus rhizomes and all biochars. The results are presented in Table 5. The porosity of solid residues depends mainly on the final temperature. The results show that the pyrolysis temperature predominantly affected the specific surface area, porosity, and pore size distribution of biochar. Specific surface area increased with increasing temperature. The higher pyrolysis temperature resulted in a higher specific surface area, but the area of mesopores was lower. The higher pyrolysis temperature caused biochar yields to decrease whilst their quality in terms of sorption properties were improved [40]. The temperature of 700 °C led to the formation of large quantities of micropores. As temperature increased, the porosity grew too. Only for an experiment at 600/0.25 was the value lower, which was due to the fact that the pyrolysis time of this experiment was shorter than for the experiment at 500 °C.

3.7. PAHs and Heavy Metals

Polycyclic aromatic hydrocarbons are the most frequently occurring contaminants in biochar, because they are created during the pyrolysis process. The results of this special analysis are shown in Table 6. The quantity of PAHs was strongly influenced by the chemical composition of the feedstock and the pyrolysis conditions. This is in agreement with Quilliam et al., and Dutta et al. [41,42]. Among various pyrolysis conditions, the temperature played a critical role in determining the quantity and type of compounds released from biochar. During pyrolysis, the main components of biomass, lignin and cellulose undergo dehydrogenation, dealkylation, and aromatization. At a temperature of about 500 °C, carbonization and aromatization occurred to form biochar and PAHs. The biochar prepared at lower temperatures contained mainly low molecular weight PAHs (LMW-PAH). Naphthalene was the main PAH detected in biochar around 500 °C. Then at higher pyrolysis temperatures, above 500 °C, the PAHs were formed into longer aromatic structures as mentioned by Odinga et al. [43]. However, in a temperature range from 600 to 700 °C PAH concentration with four aromatic rings was increased. The number of PAHs did not show a linear dependence on the temperature. All biochars prepared at the different temperatures met the soil toxicity assessment based on International Biochar Initiative Guidelines [44]. Lignin, cellulose and hemicellulose affected the number of PAHs formed during pyrolysis. The feedstock rich in lignin yielded biochar with lower PAHs as confirmed by Cho at al. [45]. Lignin promotes Miscanthus rhizomes to be a promising raw material for the production of biochar.
All biochars must comply with the soil toxicity assessment according to the IBI, which defines the standards for heavy metals in biochar [44]. The amount of heavy metals in the input sample was determined. The results are shown in Table 7. Miscanthus rhizomes were grown in uncontaminated soil. The input sample was not contaminated with any heavy metals, so rhizomes met all the criteria.

3.8. Concentration of Ca, K, Mg, S, N and P

Biochar has a significant effect on plant quality in terms of nutrient content. All nutrients were determined in the form of ions. The amount of available content of S was determined as SO42−, available content of N as NH3+ and available content of P as PO43−. The content of these nutrients (Ca, Mg and K) in biochar was significantly affected by the selected pyrolysis temperature and residence time at the final temperature. With increasing temperature and residence time, the concentration of the above-mentioned components increased. The concentrations of Ca, K, Mg, S, N and P are presented in Table 8. The plant macro nutrients in Miscanthus biochar were lower. The results show that most of the nutrients contained in biochar were extracted.
The results of morphology structure analysis are shown in Figure 7. The effect of the preparation temperature can be seen. As the preparation temperature and atmosphere changed, the surface structures of the biochar had different morphologies. The biochar prepared at 400 and 500 °C showed a macrostructure in the form of honey combs. The biochar prepared at 600 and 700 °C showed a rod-shaped structure with considerable cracks and small floccules on the surface. The corners of rod shapes remained relatively sharp and the edges were well defined, which is typical for graphene materials as defined by Yan [31].
The pyrolysis temperature affected the number of considerable cracks and flakes, which led to the gradual destruction of the surface structure as reported by Tian et al. [46]. The surface structure was also affected by the residence time of Miscanthus in the pyrolysis unit. As the residence time increased, the number of flakes on the surface also increased. It can be mentioned that destroying carbon structures at higher temperatures led to an increase in porosity, i.e., a porous structure was formed. The residence time for the experiments 600/0.25 and 600/1 was insufficient to break carbonaceous structures.

4. Conclusions

A series of experiments was performed in order to find the suitable conditions for the preparation of biochar. In this study, the effect of pyrolysis conditions on the properties of biochar produced by Miscanthus rhizome pyrolysis was studied. In addition to the type of plant itself, the temperature in the pyrolysis zone of the reactor and residence time in the reaction space had a great influence on both the quality and quantity of biochar. The resulting products were evaluated from several perspectives. However, the basic parameter was the content of polycyclic aromatic hydrocarbons. At 700 °C, PAH content was slightly less, while other parameters were comparable—i.e., carbon content, biogenic element content as well as specific surface area. Conversely, 500 °C led to the formation of biochar with a high PAH content. A temperature of 600 °C was chosen as a compromise between the achieved properties of biochar and its yield with respect to the economics of the process. Changes in residence time resulted in negligible differences in PAH concentrations, but a significant effect on the specific surface area was observed. Insufficient residence time caused an inefficiently developed porous structure. Chemical properties of biochar, especially pH and nutrient content, but also physical properties such as pore size, pore volume and specific surface area, played a key role in determining biochar quality and thus its effect on soil microorganisms that in turn affect plant growth. In line with the “zero waste” approach, the produced biochar was reused at the field and the results of its application together with phytotoxicity tests will be the subject of further study.

Author Contributions

Formal analysis, K.K. and B.G.; investigation, K.K. and B.G.; methodology, P.L.; supervision, P.L.; validation, P.L.; writing—original draft, K.K. and B.G. All authors have read and agreed to the published version of the manuscript.

Funding

This work was supported by the Czech Ministry of Industry and Trade by MiscanValue—Cornet project No. CZ.01.1.02/0.0/0.0/19_263/0018837, and by using Large Research Infrastructure ENREGAT supported by the Ministry of Education, Youth and Sports of the Czech Republic under project No. LM2018098.

Institutional Review Board Statement

Not applicable.

Informed Consent Statement

Not applicable.

Data Availability Statement

Not applicable.

Conflicts of Interest

The authors declare no conflict of interest.

References

  1. Ghalibaf, M.; Ullah, S.; Alén, R. Fast pyrolysis of hot-water-extracted and soda-AQ-delignified okra (Abelmoschus esculentus) and miscanthus (miscanthus x giganteus) stalks by Py-GC/MS. Biomass-Bioenergy 2018, 118, 172–179. [Google Scholar] [CrossRef]
  2. Saxena, R.C.; Adhikari, D.K.; Goyal, H.B. Biomass-based energy fuel through biochemical routes: A review. Renew. Sustain. Energy Rev. 2009, 13, 167–178. [Google Scholar] [CrossRef]
  3. Wafiq, A.; Reichel, D.; Hanafy, M. Pressure influence on pyrolysis product properties of raw and torrefied Miscanthus: Role of particle structure. Fuel 2016, 179, 156–167. [Google Scholar] [CrossRef]
  4. Wilk, M.; Magdziarz, A. Hydrothermal carbonization, torrefaction and slow pyrolysis of Miscanthus giganteus. Energy 2017, 140, 1292–1304. [Google Scholar] [CrossRef]
  5. Lewandowski, I.; Clifton-Brown, J.; Trindade, L.M.; Van Der Linden, G.C.; Schwarz, K.-U.; Müller-Sämann, K.; Anisimov, A.; Chen, C.-L.; Dolstra, O.; Donnison, I.S.; et al. Progress on Optimizing Miscanthus Biomass Production for the European Bioeconomy: Results of the EU FP7 Project OPTIMISC. Front. Plant Sci. 2016, 7, 1–23. [Google Scholar] [CrossRef] [Green Version]
  6. Parveen, I.; Threadgill, M.D.; Hauck, B.; Donnison, I.; Winters, A. Isolation, identification and quantitation of hydroxycinnamic acid conjugates, potential platform chemicals, in the leaves and stems of Miscanthus×giganteus using LC–ESI-MSn. Phytochemistry 2011, 72, 2376–2384. [Google Scholar] [CrossRef] [Green Version]
  7. Tew, T.L.; Cobill, R.M. Genetic Improvement of Sugarcane as an Energy Crop. In Genetic Improvement of Bioenergy Crops; Vermerris, W., Ed.; Springer: New York, NY, USA, 2008. [Google Scholar] [CrossRef]
  8. Da Costa, R.M.F.; Lee, S.J.; Allison, G.G.; Hazen, S.P.; Winters, A.; Bosch, M. Genotype, development and tissue-derived variation of cell-wall properties in the lignocellulosic energy crop Miscanthus. Ann. Bot. 2014, 114, 1265–1277. [Google Scholar] [CrossRef] [Green Version]
  9. Nowicki, L.; Siuta, D.; Markowski, M. Pyrolysis of Rapeseed Oil Press Cake and Steam Gasification of Solid Residues. Energies 2020, 13, 4472. [Google Scholar] [CrossRef]
  10. Lehmann, J.; Joseph, S. Biochar for Environmental Management: Science and Technology, 2nd ed.; Earthscan Routlegde: New York, NY, USA, 2015. [Google Scholar]
  11. Kim, J.; Hyun, S. Sorption of ionic and nonionic organic solutes onto giant Miscanthus-derived biochar from methanol-water mixtures. Sci. Total Environ. 2018, 615, 805–813. [Google Scholar] [CrossRef] [PubMed]
  12. He, K.; He, G.; Wang, C.; Zhang, H.; Xu, Y.; Wang, S.; Kong, Y.; Zhou, G.; Hu, R. Biochar amendment ameliorates soil properties and promotes Miscanthus growth in a coastal saline-alkali soil. Appl. Soil Ecol. 2019, 155, 103674. [Google Scholar] [CrossRef]
  13. Mimmo, T.; Panzacchi, P.; Baratieri, M.; Davies, C.A.; Tonon, G. Effect of pyrolysis temperature on miscanthus (Miscanthus × giganteus) biochar physical, chemical and functional properties. Biomass-Bioenergy 2014, 62, 149–157. [Google Scholar] [CrossRef]
  14. Cheng, J.; Lee, X.; Tang, Y.; Zhang, Q. Long-term effects of biochar amendment on rhizosphere and bulk soil microbial communities in a karst region, southwest China. Appl. Soil Ecol. 2019, 140, 126–134. [Google Scholar] [CrossRef]
  15. Novak, J.M.; Ippolito, J.A.; Ducey, T.F.; Watts, D.W.; Spokas, K.; Trippe, K.M.; Sigua, G.C.; Johnson, M.G. Remediation of an acidic mine spoil: Miscanthus biochar and lime amendment affects metal availability, plant growth, and soil enzyme activity. Chemosphere 2018, 205, 709–718. [Google Scholar] [CrossRef] [PubMed]
  16. Khan, W.-U.D.; Ramzani, P.M.A.; Anjum, S.; Abbas, F.; Iqbal, M.; Yasar, A.; Ihsan, M.Z.; Anwar, M.N.; Baqar, M.; Tauqeer, H.M.; et al. Potential of miscanthus biochar to improve sandy soil health, in situ nickel immobilization in soil and nutritional quality of spinach. Chemosphere 2017, 185, 1144–1156. [Google Scholar] [CrossRef]
  17. Mete, F.Z.; Mia, S.; Dijkstra, F.A.; Abuyusuf, M.; Hossain, A.S.M.I. Synergistic Effects of Biochar and NPK Fertilizer on Soybean Yield in an Alkaline Soil. Pedosphere 2015, 25, 713–719. [Google Scholar] [CrossRef]
  18. Godlewska, P.; Ok, Y.S.; Oleszczuk, P. The dark side of black gold: Ecotoxicological aspects of biochar and biochar-amended soils. J. Hazard. Mater. 2021, 403, 123833. [Google Scholar] [CrossRef]
  19. Assil, Z.; Esegbue, O.; Mašek, O.; Gutierrez, T.; Free, A. Specific enrichment of hydrocarbonclastic bacteria from diesel-amended soil on biochar particles. Sci. Total Environ. 2020, 762, 143084. [Google Scholar] [CrossRef]
  20. Wang, C.; Lv, H.; Yang, W.; Li, T.; Fang, T.; Lv, G.; Han, Q.; Dong, L.; Jiang, T.; Jiang, B.; et al. SVCT-2 determines the sensitivity to ascorbate-induced cell death in cholangiocarcinoma cell lines and patient derived xenografts. Cancer Lett. 2017, 398, 1–11. [Google Scholar] [CrossRef]
  21. Hilber, I.; Bastos, A.C.; Loureiro, S.; Soja, G.; Marsz, A.; Cornelissen, G.; Bucheli, T.D. The different faces of biochar: Contamination risk versus remediation tool. J. Environ. Eng. Landsc. Manag. 2017, 25, 86–104. [Google Scholar] [CrossRef] [Green Version]
  22. Palansooriya, K.N.; Wong, J.T.F.; Hashimoto, Y.; Huang, L.; Rinklebe, J.; Chang, S.X.; Bolan, N.; Wang, H.; Ok, Y.S. Response of microbial communities to biochar-amended soils: A critical review. Biochar 2019, 1, 3–22. [Google Scholar] [CrossRef] [Green Version]
  23. Lyu, H.; He, H.; Tang, J.; Hecker, M.; Liu, Q.; Jones, P.D.; Codling, G.; Giesy, J.P. Effect of pyrolysis temperature on potential toxicity of biochar if applied to the environment. Environ. Pollut. 2016, 218, 1–7. [Google Scholar] [CrossRef] [PubMed]
  24. Wang, C.; Wang, Y.; Herath, H.M.S.K. Polycyclic aromatic hydrocarbons (PAHs) in biochar—Their formation, occurrence and analysis: A review. Org. Geochem. 2017, 114, 1–11. [Google Scholar] [CrossRef]
  25. Cipullo, S.; Snapir, B.; Tardif, S.; Campo, P.; Prpich, G.; Coulon, F. Insights into mixed contaminants interactions and its implication for heavy metals and metalloids mobility, bioavailability and risk assessment. Sci. Total Environ. 2018, 645, 662–673. [Google Scholar] [CrossRef] [Green Version]
  26. Zadel, U.; Nesme, J.; Michalke, B.; Vestergaard, G.; Płaza, G.A.; Schröder, P.; Radl, V.; Schloter, M. Changes induced by heavy metals in the plant-associated microbiome of Miscanthus x giganteus. Sci. Total Environ. 2020, 711, 134433. [Google Scholar] [CrossRef]
  27. Arduini, I.; Masoni, A.; Mariotti, M.; Ercoli, L. Low cadmium application increase miscanthus growth and cadmium translocation. Environ. Exp. Bot. 2004, 52, 89–100. [Google Scholar] [CrossRef]
  28. Nsanganwimana, F.; Pourrut, B.; Mench, M.; Douay, F. Suitability of Miscanthus species for managing inorganic and organic contaminated land and restoring ecosystem services. A review. J. Environ. Manag. 2014, 143, 123–134. [Google Scholar] [CrossRef]
  29. Grycova, B.; Pryszcz, A.; Lestinsky, P.; Chamradova, K. Preparation and characterization of sorbents from food waste. Green Process. Synth. 2017, 6, 287–293. [Google Scholar] [CrossRef]
  30. Lakshman, V.; Brassard, P.; Hamelin, L.; Raghavan, V.; Godbout, S. Pyrolysis of Miscanthus: Developing the mass balance of a biorefinery through experimental tests in an auger reactor. Bioresour. Technol. Rep. 2021, 14, 100687. [Google Scholar] [CrossRef]
  31. Yan, Y.; Meng, Y.; Zhao, H.; Lester, E.; Wu, T.; Pang, C.H. Miscanthus as a carbon precursor for graphene oxide: A possibility influenced by pyrolysis temperature. Bioresour. Technol. 2021, 331, 124934. [Google Scholar] [CrossRef]
  32. Yang, H.; Yan, R.; Chen, H.; Zheng, C.; Lee, A.D.H.; Liang, D.T. In-Depth Investigation of Biomass Pyrolysis Based on Three Major Components: Hemicellulose, Cellulose and Lignin. Energy Fuels 2006, 20, 388–393. [Google Scholar] [CrossRef]
  33. Budai, A.; Wang, L.; Grønli, M.G.; Strand, L.T.; Antal, M.J., Jr.; Abiven, S.; Dieguez-Alonso, A.; Anca-Couce, A.; Rasse, D.P. Surface Properties and Chemical Composition of Corncob and Miscanthus Biochars: Effects of Production Temperature and Method. J. Agric. Food Chem. 2014, 62, 3791–3799. [Google Scholar] [CrossRef]
  34. Bergs, M.; Völkering, G.; Kraska, T.; Pude, R.; Do, X.T.; Kusch, P.; Monakhova, Y.; Konow, C.; Schulze, M. Miscanthus x giganteus Stem Versus Leaf-Derived Lignins Differing in Monolignol Ratio and Linkage. Int. J. Mol. Sci. 2019, 20, 1200. [Google Scholar] [CrossRef] [Green Version]
  35. Yan, Y.; Meng, Y.; Tang, L.; Kostas, E.T.; Lester, E.H.; Wu, T.; Pang, C.H. Ignition and Kinetic Studies: The Influence of Lignin on Biomass Combustion. Energy Fuels 2019, 33, 6463–6472. [Google Scholar] [CrossRef]
  36. Kim, J.-Y.; Oh, S.; Hwang, H.; Moon, Y.-H.; Choi, J.W. Assessment of miscanthus biomass (Miscanthus sacchariflorus) for conversion and utilization of bio-oil by fluidized bed type fast pyrolysis. Energy 2014, 76, 284–291. [Google Scholar] [CrossRef]
  37. Huang, C.-W.; Li, Y.-H.; Xiao, K.-L.; Lasek, J. Cofiring characteristics of coal blended with torrefied Miscanthus biochar optimized with three Taguchi indexes. Energy 2019, 172, 566–579. [Google Scholar] [CrossRef]
  38. Schimmelpfennig, S.; Glaser, B. One Step Forward toward Characterization: Some Important Material Properties to Distinguish Biochars. J. Environ. Qual. 2012, 41, 1001–1013. [Google Scholar] [CrossRef] [Green Version]
  39. Spokas, K.A.; Cantrell, K.B.; Novak, J.M.; Archer, D.W.; Ippolito, J.A.; Collins, H.P.; Boateng, A.A.; Lima, I.M.; Lamb, M.C.; McAloon, A.J.; et al. Biochar: A Synthesis of Its Agronomic Impact beyond Carbon Sequestration. J. Environ. Qual. 2012, 41, 973–989. [Google Scholar] [CrossRef]
  40. Yang, C.; Liu, J.; Lu, S. Pyrolysis temperature affects pore characteristics of rice straw and canola stalk biochars and biochar-amended soils. Geoderma 2021, 397, 115097. [Google Scholar] [CrossRef]
  41. Quilliam, R.S.; Rangecroft, S.; Emmett, B.A.; DeLuca, T.H.; Jones, D.L. Is biochar a source or sink for polycyclic aromatic hydrocarbon (PAH) compounds in agricultural soils? GCB Bioenergy 2013, 5, 96–103. [Google Scholar] [CrossRef]
  42. Dutta, T.; Kwon, E.; Bhattacharya, S.S.; Jeon, B.H.; Deep, A.; Uchimiya, M.; Kim, K.-H. Polycyclic aromatic hydrocarbons and volatile organic compounds in biochar and biochar-amended soil: A review. GCB Bioenergy 2017, 9, 990–1004. [Google Scholar] [CrossRef]
  43. Odinga, E.S.; Gudda, F.O.; Waigi, M.G.; Wang, J.; Gao, Y. Occurrence, formation and environmental fate of polycyclic aromatic hydrocarbons in biochars. Fundam. Res. 2021, 1, 296–305. [Google Scholar] [CrossRef]
  44. IBI. International Biochar Initiative. International Biochar Initiative. Copyright © 2018. Available online: https://biochar-international.org (accessed on 17 February 2022).
  45. Cho, D.-W.; Cho, S.-H.; Song, H.; Kwon, E.E. Carbon dioxide assisted sustainability enhancement of pyrolysis of waste biomass: A case study with spent coffee ground. Bioresour. Technol. 2015, 189, 1–6. [Google Scholar] [CrossRef] [PubMed]
  46. Tian, H.; Hu, Q.; Wang, J.; Chen, D.; Yang, Y.; Bridgwater, A.V. Kinetic study on the CO2 gasification of biochar derived from Miscanthus at different processing conditions. Energy 2021, 217, 119341. [Google Scholar] [CrossRef]
Figure 1. Thermogravimetric curve of Miscanthus rhizomes.
Sustainability 14 06193 g001
Figure 2. Product balance.
Sustainability 14 06193 g002
Figure 3. Higher heating value (HHV) for gaseous samples: Sample 1—gas created in temperature range 20–350 °C, Sample 2—gas created between 350 °C and final temperature, Sample 3—gas created at final temperature during residence time.
Sustainability 14 06193 g003
Figure 4. Van Krevelen diagram.
Sustainability 14 06193 g004
Figure 5. pH of raw Miscanthus rhizomes and biochars.
Sustainability 14 06193 g005
Figure 6. EC of raw Miscanthus rhizomes and biochars.
Sustainability 14 06193 g006
Figure 7. SEM images of biochar prepared at 400, 500, 600/2, 700, 600/0.1, 600/0.25.
Sustainability 14 06193 g007
Table 1. Conditions for GC.
Oven (°C)60Run Time (min)34.5
Value (°C)70
Injector
Temperature (°C)200
Pressure (psi)50
DetectorFID TCD
Temperature (°C)250Temperature (°C)200
Air (mL/min)350Ref. (mL/min)20
H2 (mL/min)40Make up (ml/min)25
Make up (mL/min)5
Table 2. Gas characterization.
400500600700600/1600/0.25
H2 (vol.%)1.81 ± 0.081.13 ± 0.054.52 ± 0.124.92 ± 0.162.21 ± 0.101.93 ± 0.04
CO (vol.%)27.66 ± 0.1831.39 ± 0.1123.22 ± 0.1325.00 ± 0.2026.27 ± 0.2129.64 ± 0.19
CO2 (vol.%)68.13 ± 0.7759.88 ± 0.8557.98 ± 0.7456.49 ± 0.8956.78 ± 0.7056.70 ± 0.81
CH4 (vol.%)1.99 ± 0.015.82 ± 0.0111.62 ± 0.0111.09 ± 0.1612.01 ± 0.019.57 ± 0.01
C2H4 (vol.%)0.15 ± 0.010.51 ± 0.020.53 ± 0.020.49 ± 0.030.52 ± 0.010.43 ± 0.02
C2H6 (vol.%)0.17 ± 0.010.89 ± 0.071.48 ± 0.081.38 ± 0.141.56 ± 0.081.23 ± 0.11
C3H6 (vol.%)0.04 ± 0.010.15 ± 0.010.24 ± 0.010.26 ± 0.010.24 ± 0.010.18 ± 0.01
C3H8 (vol.%)0.05 ± 0.010.24 ± 0.010.41 ± 0.020.37 ± 0.010.40 ± 0.010.32 ± 0.01
Table 3. Water-insoluble compounds and water-soluble compounds in condensate sample at pyrolysis of 600 °C and residence time of 2 h.
Condensate Compounds in Dichlormethane ExtractPeak Area/Total Area of All PeaksCondensate Compounds in Diethyleether ExtractPeak Area/Total Area of All Peaks
2-Propanone, 1-(acetyloxy)-10.58Acetic acid28.23
Phenol, 2-methoxy-9.322-Propanone, 1-hydroxy-11.74
Phenol8.80Phenol4.94
3-Furaldehyde6.752-Furanmethanol4.57
Furfural5.86Hydroquinone4.44
Benzofuran, 2,3-dihydro-5.73Propanoic acid3.80
1-Hydroxy-2-butanone5.101-Hydroxy-2-butanone3.61
Phenol, 4-ethyl-4.862-Propanone, 1-(acetyloxy)-3.21
Butyrolactone4.48Phenol, 2-methoxy-2.82
2-Furanmethanol3.89Furfural2.65
Phenol, 2,6-dimethoxy-3.822,3-Butanedione2.63
Propanoic acid, 2-methyl-, anhydride3.12Benzofuran, 2,3-dihydro-2.05
Phenol, 4-ethyl-2-methoxy-3.081,2-Cyclopentanedione1.96
2-Methoxy-4-vinylphenol2.84Phenol, 4-ethyl-1.68
Propanoic acid2.68Phenol, 2,6-dimethoxy-1.35
1,2-Cyclopentanedione, 3-methyl-2.331,2-Cyclopentanedione, 3-methyl-1.33
Table 4. Proximate and ultimate analysis.
Raw MiscanthusBiochar 400Biochar 500Biochar 600Biochar 700Biochar 600/1Biochar 600/0.25
Proximate analysis (wt.%)
W8.53 ± 0.082.05 ± 0.021.84 ± 0.011.55 ± 0.011.53 ± 0.031.74 ± 0.001.85 ± 0.04
VM d76.00 ± 1.0522.82 ± 0.3115.78 ± 0.249.92 ± 0.087.30 ± 0.0711.07 ± 0.4613.13 ± 0.42
FC d20.58 ± 0.3267.33 ± 0.2874.04 ± 0.4277.82 ± 0.1378.71 ± 0.0476.79 ± 0.7376.50 ± 0.38
A d3.42 ± 0.019.86 ± 0.0110.17 ± 0.2112.26 ± 0.0413.98 ± 0.1412.14 ± 0.2710.38 ± 0.84
Ultimate analysis (wt.%)
C d55.33 ± 0.2974.73 ± 0.2280.63 ± 0.3281.42 ± 0.4281.30 ± 0.0680.90 ± 0.2780.98 ± 0.47
H d12.51 ± 0.214.41 ± 0.084.18 ± 0.052.61 ± 0.041.59 ± 0.012.84 ± 0.112.87 ± 0.03
O d27.53 ± 0.238.58 ± 0.072.22 ± 0.041.32 ± 0.031.08 ± 0.011.68 ± 0.103.23 ± 0.02
N d0.87 ± 0.101.57 ± 0.011.69 ± 0.011.58 ± 0.001.48 ± 0.011.59 ± 0.001.58 ± 0.02
S d0.34 ± 0.000.85 ± 0.001.11 ± 0.000.81 ± 0.010.57 ± 0.000.85 ± 0.010.96 ± 0.02
Atomic ratio
H/C2.71 ± 0.020.71 ± 0.010.62 ± 0.010.39 ± 0.010.24 ± 0.010.42 ± 0.010.43 ± 0.01
O/C0.38 ± 0.000.09 ± 0.000.02 ± 0.000.01 ± 0.000.01 ± 0.000.02 ± 0.000.03 ± 0.00
Higher heating value (MJ/kg)
HHV d19.84 ± 0.0130.00 ± 0.0331.17 ± 0.0230.37 ± 0.0729.32 ± 0.0330.70 ± 0.0431.18 ± 0.10
A ash, W moisture content, VM volatile matter, FC fixed carbon, HHV higher heating value. d in dry matter.
Table 5. Adsorption analysis for raw Miscanthus rhizomes and biochars.
SampleSBET
(m2/g)
Smeso
(m2/g)
Vmicro
(mm3liq/g)
Vnet
(mm3liq/g)
Miscanthus0.7 ± 0.01ndndnd
4005 ± 0.01ndndnd
50047 ± 0.08ndndnd
600217 ± 6.2122 ± 0.08106 ± 4.03132 ± 2.87
700273 ± 4.2418 ± 0.06123 ± 1.89146 ± 1.04
600/1193 ± 0.2819 ± 0.4587 ± 1.14113 ± 3.40
600/0.2516 ± 0.026 ± 0.014 ± 0.0110 ± 0.01
Table 6. Effect of temperature on PAH mass.
Criteria (IBI)
mg/kg Dry wt
400500600700600/1600/0.25
PAHs6–3006.80 ± 0.0217.40 ± 0.685.60 ± 0.134.10 ± 0.115.80 ± 0.085.00 ± 0.07
Table 7. Heavy metals in feedstock.
Criteria (IBI)
mg/kg Dry wt
Miscanthus
As13–100<0.5 ± 0.00
Cd1.4–39<0.4 ± 0.00
Cr93–12009.57 ± 0.14
Co34–1001.26 ± 0.28
Cu143–600010.6 ± 0.71
Pb121–3002.7 ± 0.08
Hg1–17<0.2 ± 0.00
Mo5–750.44 ± 0.02
Ni47–4207.5 ± 0.93
Se2–200<2.0 ± 0.00
Zn416–7400102 ± 0.08
Table 8. Concentration of Ca, Mg, K, S, N and P in biochars 600/2.
600/2
Total Ca (mg/kg)1910 ± 98.07
Available Ca (mg/kg)1204 ± 37.44
Total Mg (mg/kg)1190 ± 36.98
Available Mg (mg/kg)272 ± 10.26
Total K (mg/kg)25,400 ± 109.03
Available K (mg/kg)7069 ± 13.91
Total S (mg/kg)8100 ± 61.23
Available SO42− (mg/kg)2558 ± 79.54
Total N (mg/kg)15,800 ± 102.01
Available NH3+ (mg/kg)<2 ± 0.00
Total P (mg/kg)2870 ± 75.08
Available PO43− (mg/kg)1983 ± 26.12
Publisher’s Note: MDPI stays neutral with regard to jurisdictional claims in published maps and institutional affiliations.

