Article

Implementation of Industry 4.0 Principles and Tools: Simulation and Case Study in a Manufacturing SME

Department of Industrial Engineering, University of Québec in Trois-Rivières, Trois-Rivières, QC G8Z 4M3, Canada
*
Authors to whom correspondence should be addressed.
Sustainability 2022, 14(10), 6336; https://doi.org/10.3390/su14106336
Submission received: 9 March 2022 / Revised: 16 May 2022 / Accepted: 18 May 2022 / Published: 23 May 2022

Abstract

:
Small and medium enterprises (SME) face various challenges in order to remain competitive in a global market. Industry 4.0 (I4.0) is increasingly presented as the new paradigm for improving productivity, ensuring economic growth, and guaranteeing the sustainability of manufacturing companies. However, SMEs are ill equipped and lack resources to undertake this digital shift. This paper presents the digital shift process of an SME in a personalized mass production context. Our work provides a better understanding of the interaction between Lean and I4.0. It contributes to the development of Lean 4.0 implementation strategies that are better adapted to manufacturing SMEs in a personalized mass production context. We also demonstrate the usefulness of simulation as a decision-making assistance tool when implementing I4.0. A practical case is documented to fill a gap in the scientific literature identified by several researchers.

1. Introduction

Small and medium enterprises (SMEs) face various challenges in setting themselves apart and remaining competitive in a global market. Raymond Chabot Grant Thornton [1] conducted a survey with 300 managers of companies with 10 to 499 employees to identify the challenges facing SME. The results show that the key challenges are labor recruiting and retention (60%), competitiveness (35%), digital shift (18%), and access to financing (12%). The labor shortage already plaguing the Quebec manufacturing sector for years worsened with the COVID-19 pandemic. Today, it is a constraint on recovery and economic growth in several manufacturing companies. In addition to juggling labor problems, SMEs must stand out in an increasingly competitive and globalized market. To increase their competitiveness, SMEs rely on greater productivity and often use the Lean [2] and Six sigma [3] improvement programs to succeed. SMEs must also meet growing demand for increasingly personalized products. They must move from mass production to personalized mass production. This situation requires SMEs to review their methods and production systems to make them more productive, flexible, and, above all, agile [4].
Today, the fourth industrial revolution, known as Industry 4.0 (I4.0), is increasingly presented as the new paradigm for improving productivity, ensuring economic growth, and guaranteeing the sustainability of manufacturing companies. I4.0 refers to the integration of information technologies (internet of things, cyber–physical systems, cloud computing, AI, etc.) and automation (robots, cobots, automated guided vehicles, etc.) in every sphere of a company, vertically and horizontally, to improve performance [5].
Several topics concerning the implementation of I4.0 have already been analyzed in the literature. These include studies on success factors [6,7], risks [7], opportunities [7], barriers [8,9], challenges [6,10], technological tools and their integration [6,11,12,13], design principles [6,11,12], 4.0 maturity or readiness assessment [6,11,12,14,15,16], and implementation strategy development [11,12,17,18]. The implementation of I4.0 concepts by small and medium-sized enterprises (SMEs), where the ideal balance between Industry 4.0 implementation costs and real benefits is unknown, is of paramount concern [19]. Indeed, SMEs are ill equipped and lack resources to undertake this digital shift [4]. According to Horvath and Szabo [20], multinational enterprises have higher driving forces and lower barriers to Industry 4.0 than SMEs. According to Cotrino et al. [17], the implementation of Industry 4.0 technologies in SMEs is poorly documented from a practical point of view, and the existing implementation strategies for Industry 4.0 do not focus on SMEs.
This article presents the approach of an SME during its digital shift in a personalized mass production context. The process is based on the implementation strategy proposed by Gamache [11,21]. This case is particular because the company used a simulation model to measure the impact of intelligent industry principles and tools on production line productivity. The simulation results allow the company to know potential productivity gains before implementation. These results also provide information on the sequence of steps to follow when implementing I4.0 in a personalized mass production context. The documentation of a practical case fills a gap in the literature identified by researchers [7,17,22]. Furthermore, the results of this study constitute important input for proposing I4.0 implementation strategies that are better adapted for SMEs that must develop their agility.
The case study presented in this article is the first in a series of three practical cases and stems from a wider research program on the development of I4.0 implementation strategies in a personalized mass production context adapted to SMEs.
The remainder of the paper is organized as follows. A brief review of the literature is provided in Section 2. The SME case study is explained in detail in Section 3. In Section 4, a discussion is presented. Finally, a conclusion is provided in Section 5.

2. Literature Review

2.1. Industry 4.0

Industry 4.0 (I4.0) is a concept rooted in a reflection initiated by the German government on the future of the manufacturing sector. The objective is to position the manufacturing sector to be as productive and flexible as possible. Software, equipment, and data connectivity, as well as processing big data and cybersecurity, are key factors in implementing I4.0. These factors make it possible to create intelligence in the manufacturing system that then becomes capable of greater adaptability in production and of more efficiently allocating resources [23].
I4.0 is based on several design, tool, and technological trend principles that guide enterprises in their digital shift [24]. De Paula Ferreira et al. [25] identified 17 design principles that describe the tenets of I4.0 and help companies to implement the concept. Table 1 presents these principles.
All of the I4.0 design principles are linked to a certain extent. Although the goal of this study is not to analyze all of the relationships and/or dependencies of these principles, it is important to highlight the key relations described in the articles analyzed. These relationships are [25]:
  • Interoperability enables vertical and horizontal integration [26,27];
  • Modularity enables flexibility, agility, and product personalization [24,28,29];
  • Vertical integration enables smart factories [30,31];
  • Smart manufacturing enables digital end-to-end engineering [32];
  • Virtualization of production systems depends on real-time capabilities [24,29];
  • Decentralization can be achieved through smart products [29,32,33].
Evidently, implementing I4.0 design principles obliges SMEs to use different technological tools. Bosman et al. [34] investigated the role of firm size, access to funds, and industry type on the decision to invest in and deploy various Industry 4.0 technologies. The findings suggest that manufacturers with fewer than 20 employees and/or less access to funds (sales of less than USD 10 million) prioritize digital factory floor technologies (e.g., technology directly impacting productivity, quality, and safety of manufacturing processes). Larger manufacturers with 20 or more employees and/or access to more funds (sales greater than or equal to USD 10 million) prioritize enterprise support operations technologies. Moeuf et al. [7] selected 12 experts to conduct a Delphi study supplemented by Régnier’s abacus. The experts noted that, a priori, all of the technological tools were accessible to SMEs, and they said that it is not necessary to exploit all of the technologies to implement Industry 4.0.
As presented in Figure 1, Gamache et al. [11] identified 24 technological tools related to I4.0 that they grouped into five categories. The technological tools are the methods that SMEs can use to implement the I4.0 concepts and design principles.

2.2. Implementation Strategies for I4.0 Principles and Tools

Obviously, SMEs that wish to undertake a digital shift cannot implement all of these principles and tools at once. Companies must make choices. There are some interesting studies in the literature concerning I4.0 implementation strategies.
Based on a systematic literature review, Wankhede and Vinodh [6] established a conceptual framework to guide automotive industry practitioners towards I4.0 implementation. However, the framework needs to be validated with industries to ensure its practical validity.
Cotrino et al. [17] proposed a six-step roadmap (Table 2) to facilitate decision making and access to Industry 4.0 technologies in the production areas of SMEs.
Their results show that implementing Industry 4.0 solutions according to this roadmap helps SMEs to select appropriate technologies. In addition, three examples are presented to optimize production and enhance the productivity and efficiency of a smart assembly line (SAL). The results demonstrate that SMEs can access several Industry 4.0 technologies with low-cost investments.
Amaral and Peças [16] proposed a framework for assessing companies with low maturity levels, such as most existing SMEs. The proposed holistic model considers all Industry 4.0 dimensions (six dimensions and 26 sub-dimensions) and is detailed enough in its initial levels to properly assess SMEs. Each sub-dimension is assessed on a scale of 0 to 5 based on its level of maturity. They suggested developing a roadmap for the introduction of I4.0 in companies.
Wamkhede and Vinodh [15] developed a conceptual model consisting of six criteria—Technology, Organization and Management, Process, Legislation, Product, and Employee—and 50 factors related to I4.0 readiness for the automotive component manufacturing industries. The Readiness Index was computed based on the fuzzy logic approach. The ranking score makes it easier for organization management to identify significantly weak readiness factors. The study’s findings revealed that the organization in the case study needed to develop strategies to improve its I4.0 readiness.
Liebrecht et al. [18] proposed a case-specific analysis and evaluation of available I4.0 methods to select those most suitable for an individual company. In the first phase of their methodology, a set of relevant methods was derived according to the company’s type of production (manual or automated, several small-volume products or a few high-volume products). There were also methods for universal application. This method served as a basis for the next phases of their methodology. The objective of phase 2 was to derive a subset of value-added introduction scenarios for the method selected in phase 1. All methods had to be assessed strategically and to be valued from an economic perspective. The methods were assessed based on the company’s specific characteristics, its strategic focus, and its (market) environment. In phase 3, by varying decision parameters, several beneficial scenarios were derived, and they contained a prioritized implementation sequence of all methods. These scenarios were put into a System Dynamics model to consider the influence of dynamic and time-dependent parameters. Based on the corporate strategy, a recommended Industry 4.0 roadmap was identified, showing financial and strategic potential, as well as implementation order and duration. Although this research is very interesting, it has several limitations, including that the toolbox is not linked with existing integrated production system toolboxes and lean management. This is necessary to support, in particular, small-sized companies in implementing integrated production systems, which combine lean management and Industry 4.0.
Gamache et al. [11] and Gamache [21] proposed an assessment model in the form of a questionnaire to assess the impact of 24 business practices on the digital performance of companies. The business practices represent the methods implemented by companies to improve their performance. Digital performance is defined as the assessment of the progress of a company’s digital shift according to I4.0-related business practices. Each business practice is assessed on a scale of 0 to 4 with regard to its level of digital maturity, where 0 = Nonexistent, 1 = Rudimentary, 2 = Disciplined, 3 = Integrated, and 4 = Foreseeable. Some twenty companies were assessed using this questionnaire to determine their digital performance. The business practices assessed were classified into four categories according to their impacts on the digital performance of companies (Table 3).
Table 4 shows the 24 business practices grouped into these categories [21].
A six-step strategy for guiding manufacturing SMEs in implementing their digital shift is proposed based on these results (Table 5).
Unlike Liebrecht et al. [18], Gamache [21] recommended implementing Lean and optimizing before deployment at the Implementation Step (Table 5). When analyzing the priority business practices in the Implementation Step, we note that they are related to the personalization and agility design principles presented previously in Table 1. The SME under study chose this strategy because it best corresponded to its personalized mass production context. As we indicated, these principles are linked both to each other and to the principles of flexibility and modularity. Here are the details of the link between these principles.
Modularity makes it possible to personalize the product by combining, modifying, or adding modules to a standard product structure [12,24,28,35]. The principle of modularity is based on the concept of standardization. By reducing makespan, modularity makes production systems more flexible and agile in order to respond to variable demand [21]. Modular and reconfigurable manufacturing systems [36] make it possible to quickly combine (plug and play) modules with compatible software interfaces and materials [29,37], and to which functionalities can be added or removed more quickly [27,28,38]. Modularity can be implemented in manufacturing system design as a dynamic production cell [39] and in the product design at the conceptual design stage [40].
The principle of personalizing a product requires the production system to be adapted to produce relatively small batches of goods personalized to the customer’s tastes.
A flexible production system is essential to make profitable the small-lot production imposed by mass personalization [41]. Flexibility refers to a production system capable of manufacturing small batches of a wide variety of products immediately and without implementation costs. Modular product design serves to make manufacturing systems more flexible and, consequently, offer a variety of products at a lower cost and in a timely manner [42]. The methods for improving manufacturing system flexibility include automation (robots), organizing into dynamic cells, balancing production lines, etc.
Agility is a company’s capacity to react quickly to various changes that cannot be foreseen. Agility allows companies to increase their resiliency capacity and to remain competitive when there are, for example, major market variations [43]. To be agile, manufacturing systems must be adaptable or reconfigurable. A system is reconfigurable when the structure of the system within a family of products can be changed quickly to adjust production capacities and functionalities to respond to changing market requirements [44,45]. This requires reactive and flexible manufacturing operations to produce individualized products in dynamic batch sizes, on a wide scale, and in a profitable manner [46,47]. Methods for improving a manufacturing system’s agility include automation (cobots), organizing into dynamic cells, employees with multiple skills, etc. Sharp et al. [48] compared mass, flexible, and agile production systems.
The following section presents the company under study, as well as the steps taken to undertake its digital shift.

3. Overview of a Manufacturing SME’s Approach

This section describes the steps taken by MS, a manufacturing PME that, over the years, became a leader in sheet metal transformation in Quebec that is able to serve local companies, as well as large world-class customers.
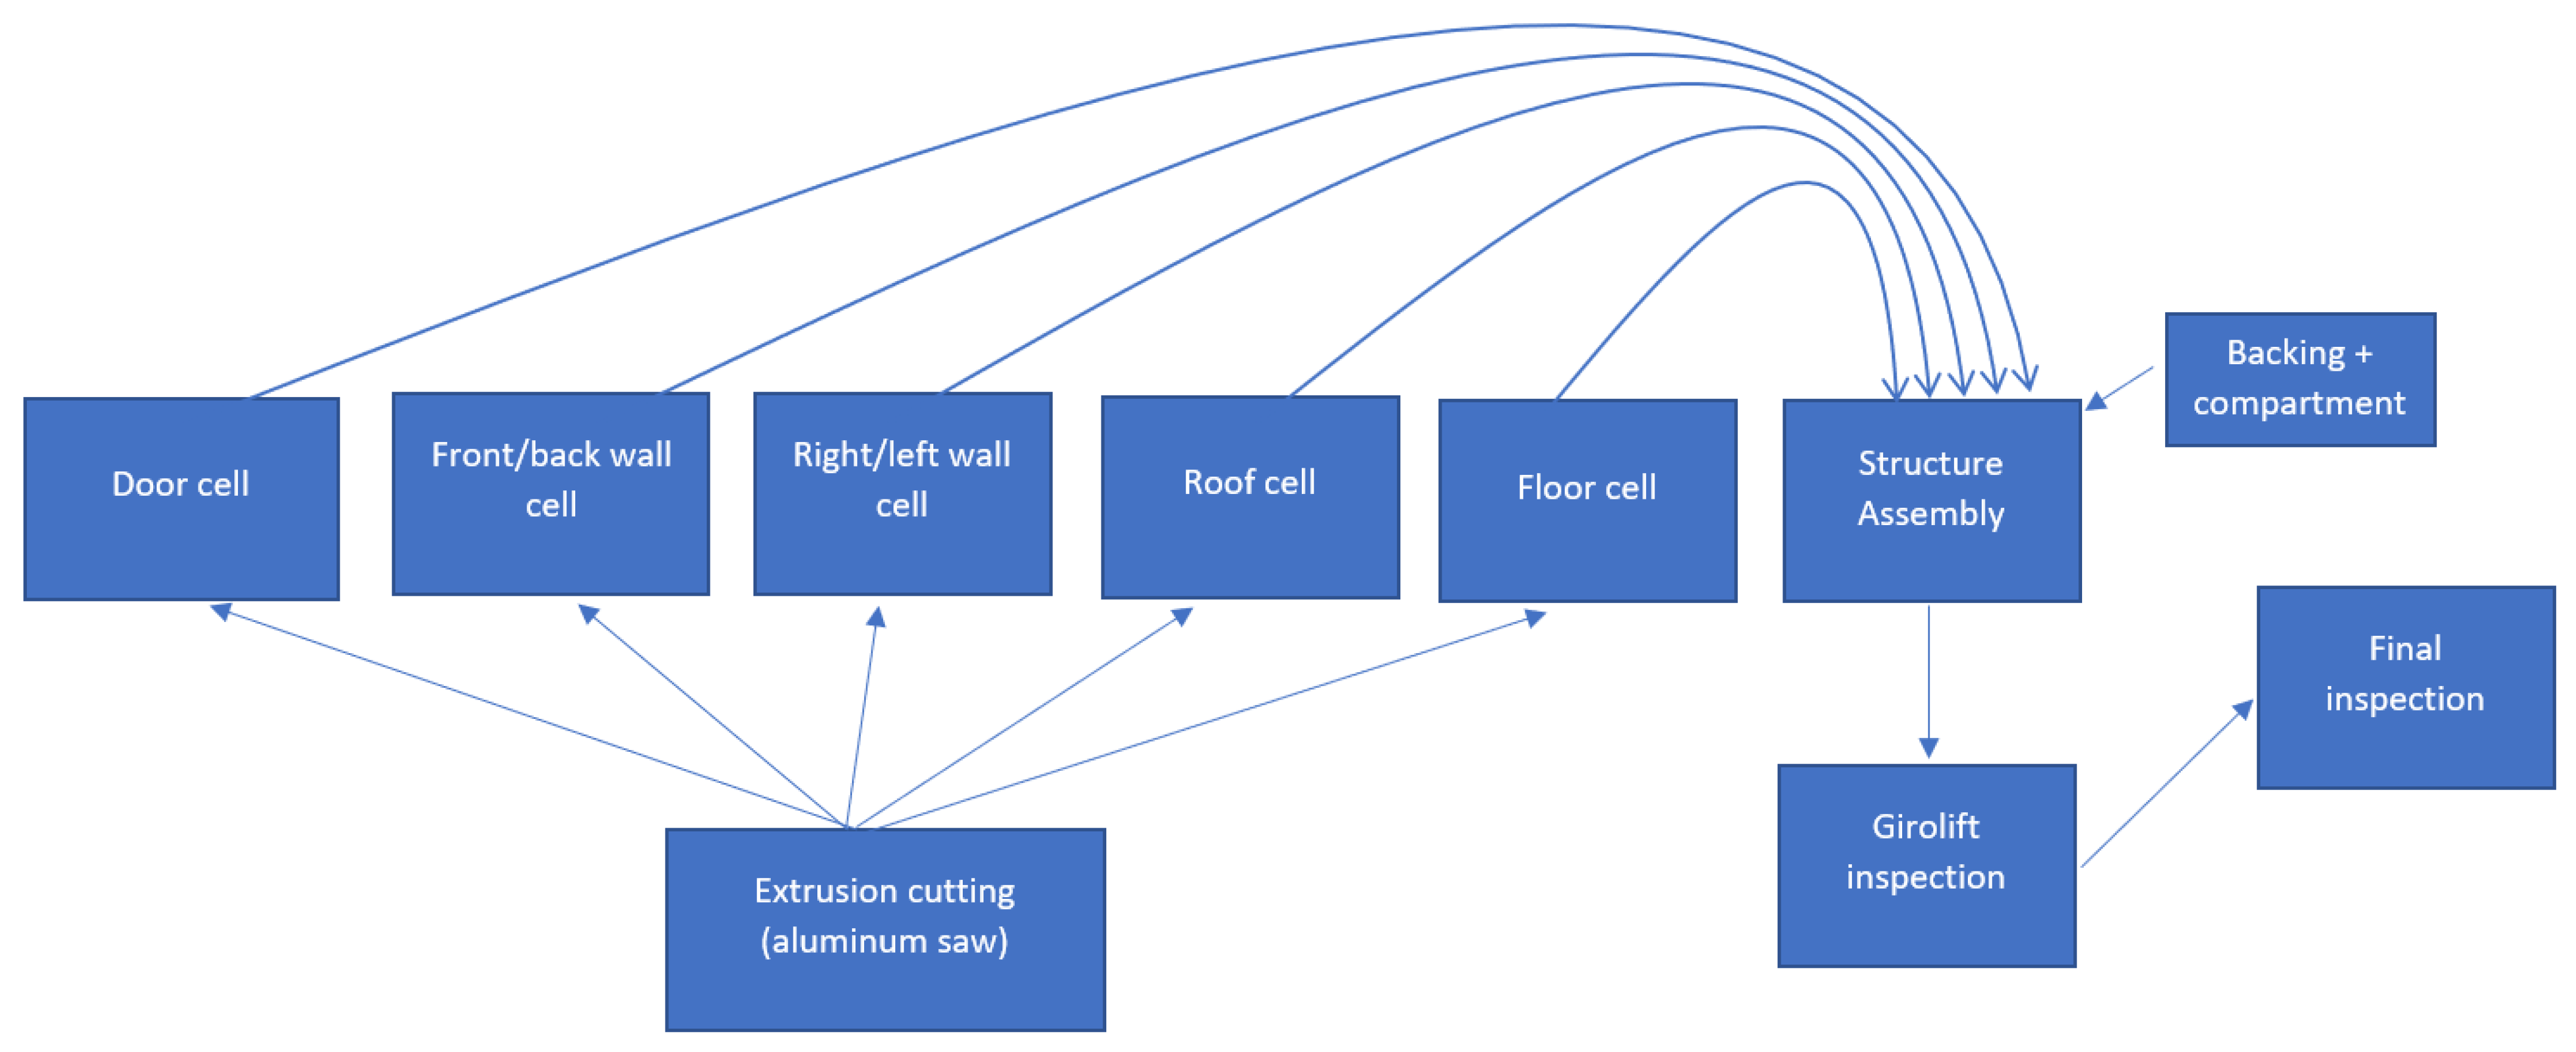
MS specializes in punching operations, laser cutting, folding, welding, mechanically welded assemblies, and tubes and extrusion. In this study, we focused on the production line for ambulance structures. Growing demand for this type of product is increasingly personalized, which involves increased set-up time, inefficient organization, and increased handling. The ambulance structure manufacturing and assembly line at MS is examined in this study. The current production rate is five structures per week, and the target is to increase capacity to at least seven structures per week. Figure 2 presents the operations map of this production line.
The line is composed of five cells in a series, which consists of manufacturing doors, front and back walls, right and left walls, the roof, and, finally, the floors of the ambulance structures. The other operations (backing and compartments, cutting extrusions) supply the line. The assembled structure proceeds to the inspection and sealing station (Girolift inspection). Lastly, the structure proceeds to the final inspection. If necessary, repairs can be made.

3.1. The I4.0 Implementation Strategy of MS

MS based its digital shift on the strategy proposed by Gamache [21]. MS already uses an ERP to balance and plan production and adheres to the Lean philosophy to carry out improvement projects.
The digital shift of MS began with developing the map of the production line value chain (preliminary step). The map serves to identify several areas of improvement to ensure process control. The following is a list of projects that resulted from the mapping that were prioritized and completed in the company in the planning and Lean implementation steps:
  • Standardizing working methods;
  • Developing skill matrices to ensure multidisciplinarity;
  • Reducing set-up times using the SMED method;
  • Implementing new gluing procedures to reduce drying time on the roof manufacturing cell (the bottleneck);
  • Implementing the 5S to standardize tools, reduce research and unnecessary personnel movement, and make information available;
  • Designing wheeled trucks to replace lift trucks to reduce travel between production line cells.
These Lean interventions performed in preparation for implementing I4.0 made it possible to increase production line capacity from five structures per week to six structures per week, which represents a 20% increase.
The step of implementing priority business practices for MS involved establishing the principle of mass personalization and encouraging MS to become more agile. This step therefore involves completing the following projects:
  • Developing the modular structure of the product;
  • Reorganizing the production line into dynamic cells and a mixed production line;
  • Automating the production line gradually, step by step (robots, cobots, etc.).
Obviously, completing these projects requires major investments, and they often involve their own share of problems in the field. To verify the impact of these changes on productivity in the production line, a discrete-event simulation model was developed. This model based on an experimental plan was used to establish the implementation strategy.

3.2. Experimental Plan

An experimental plan made it possible to conduct tests to measure the impacts of different factors on the performance of the production line, the productivity of which increased.

3.2.1. The Factors and Their Levels

Table 6 presents the factors and their levels selected based on the literature review and the context of the company. As mentioned in Bosman et al. [34], MS prioritized digital factory floor technologies (e.g., technology directly impacting productivity, quality, and safety of manufacturing processes). Level 1 corresponds to the current level, while Level 2 corresponds to the changes that will be made in the basic simulation model.
Organization (A). The current organization in the factory involves inter- and intra-cell handling on the production line. With the simulation model, a dynamic cell organization, where the cells operate in parallel, will be tested. The cell organization was modeled with all personnel movement and transportation time between the machines in a cell considered negligible. Furthermore, dynamic organization will make it possible to reconfigure machines on the production line based on the component being produced.
Modular design (B). Currently, each ambulance structure model has its own platform and its own components. Therefore, for the four ambulance structure models simulated, there are four different platforms, which require different production times. For each model, the number of components is different, and their assembly time is also different. The goal of modular design is to reduce the number of components to manage on an assembly line to a few modules that are assembled to create a finished product. The starting point for this design principle is to design a standard platform on which the modules (or options) can be assembled to form different products. In the simulation model, we modeled this situation using the model 616 platform for all of the models (616, 621, 619, and 633).
Robot (C). Integrating robotics into repetitive, dangerous, or bottleneck operations makes the entire production chain more productive. Among other things, quality is improved and variability is better controlled. Currently, manufacturing and assembly operations on the production line are all manual. No assistance is provided by a robot. In this experimental plan, the roof-welding operator, which is the bottleneck, is replaced by a robot. In the simulation model, 15 min was allocated to preparing the jigs and five minutes were allocated to unloading the robot. A 30% reduction in welding time was also considered based on experience in the field and with the assistance of the robot supplier. A production cell with a robot was built and the time was then validated.
Multi-disciplined and balanced line (D). Training employees to be multidisciplinary and management by bottlenecks facilitate natural balancing and, thereby, increase assembly line productivity. Indeed, employees can move around on the line and intervene where necessary to balance production times at the workstations on the production line. The simulation model imposed a limit of three outstanding units before an employee moves to the upstream or downstream station. Production time fell by 50% when two employees performed the same operation.
Cobot (E). Cobots are much more flexible and agile to use than robots because their programming is quick and simple. This can be useful when several different products must be manufactured, such as in a mass personalization production situation. A cobot that is able to perform any of the welding operations was added to bottlenecks based on availability. Welding time was cut by 10% and 15 min of preparation.

3.2.2. The Mathematical Model

The mathematical model representing the experiments is:
Yijklmno = µ + Ai + Bj + Ck + Dl + Em + AB + AC + AD + DE+ εo(ijklm)
where
  • Yijklmn: The measured response (structure makespan).
  • Ai: Level i of the “Organization” variable.
  • Bj: Level j of the “Modular Design” variable.
  • Ck: Level k of the “Robot” variable.
  • Dl: Level l of the “Line Balancing” variable.
  • Em: Level m of the “Cobot” variable.
  • AB: Interaction between factors A and B.
  • AC: Interaction between factors A and C.
  • AD: Interaction between factors A and D.
  • DE: Interaction between factors D and E.
  • εo(ijklmn): The experimental error.
This mathematical model is used to analyze the individual impact of each factor on makespan, but it also makes it possible to study the interactions between the factors. Four interactions (AB, AC, AD, and DE) were selected and will be studied.
A Taguchi L16 plan was selected because it has 15 degrees of freedom, making it possible to study up to 15 individual factors at two levels or a combination of individual factors at two levels and interactions. In our case, we have five factors at two levels and four interactions, which leaves six degrees of freedom for error. This experimental plan will be executed on a discrete-event simulation model.

3.3. Discrete-Event Simulation Model

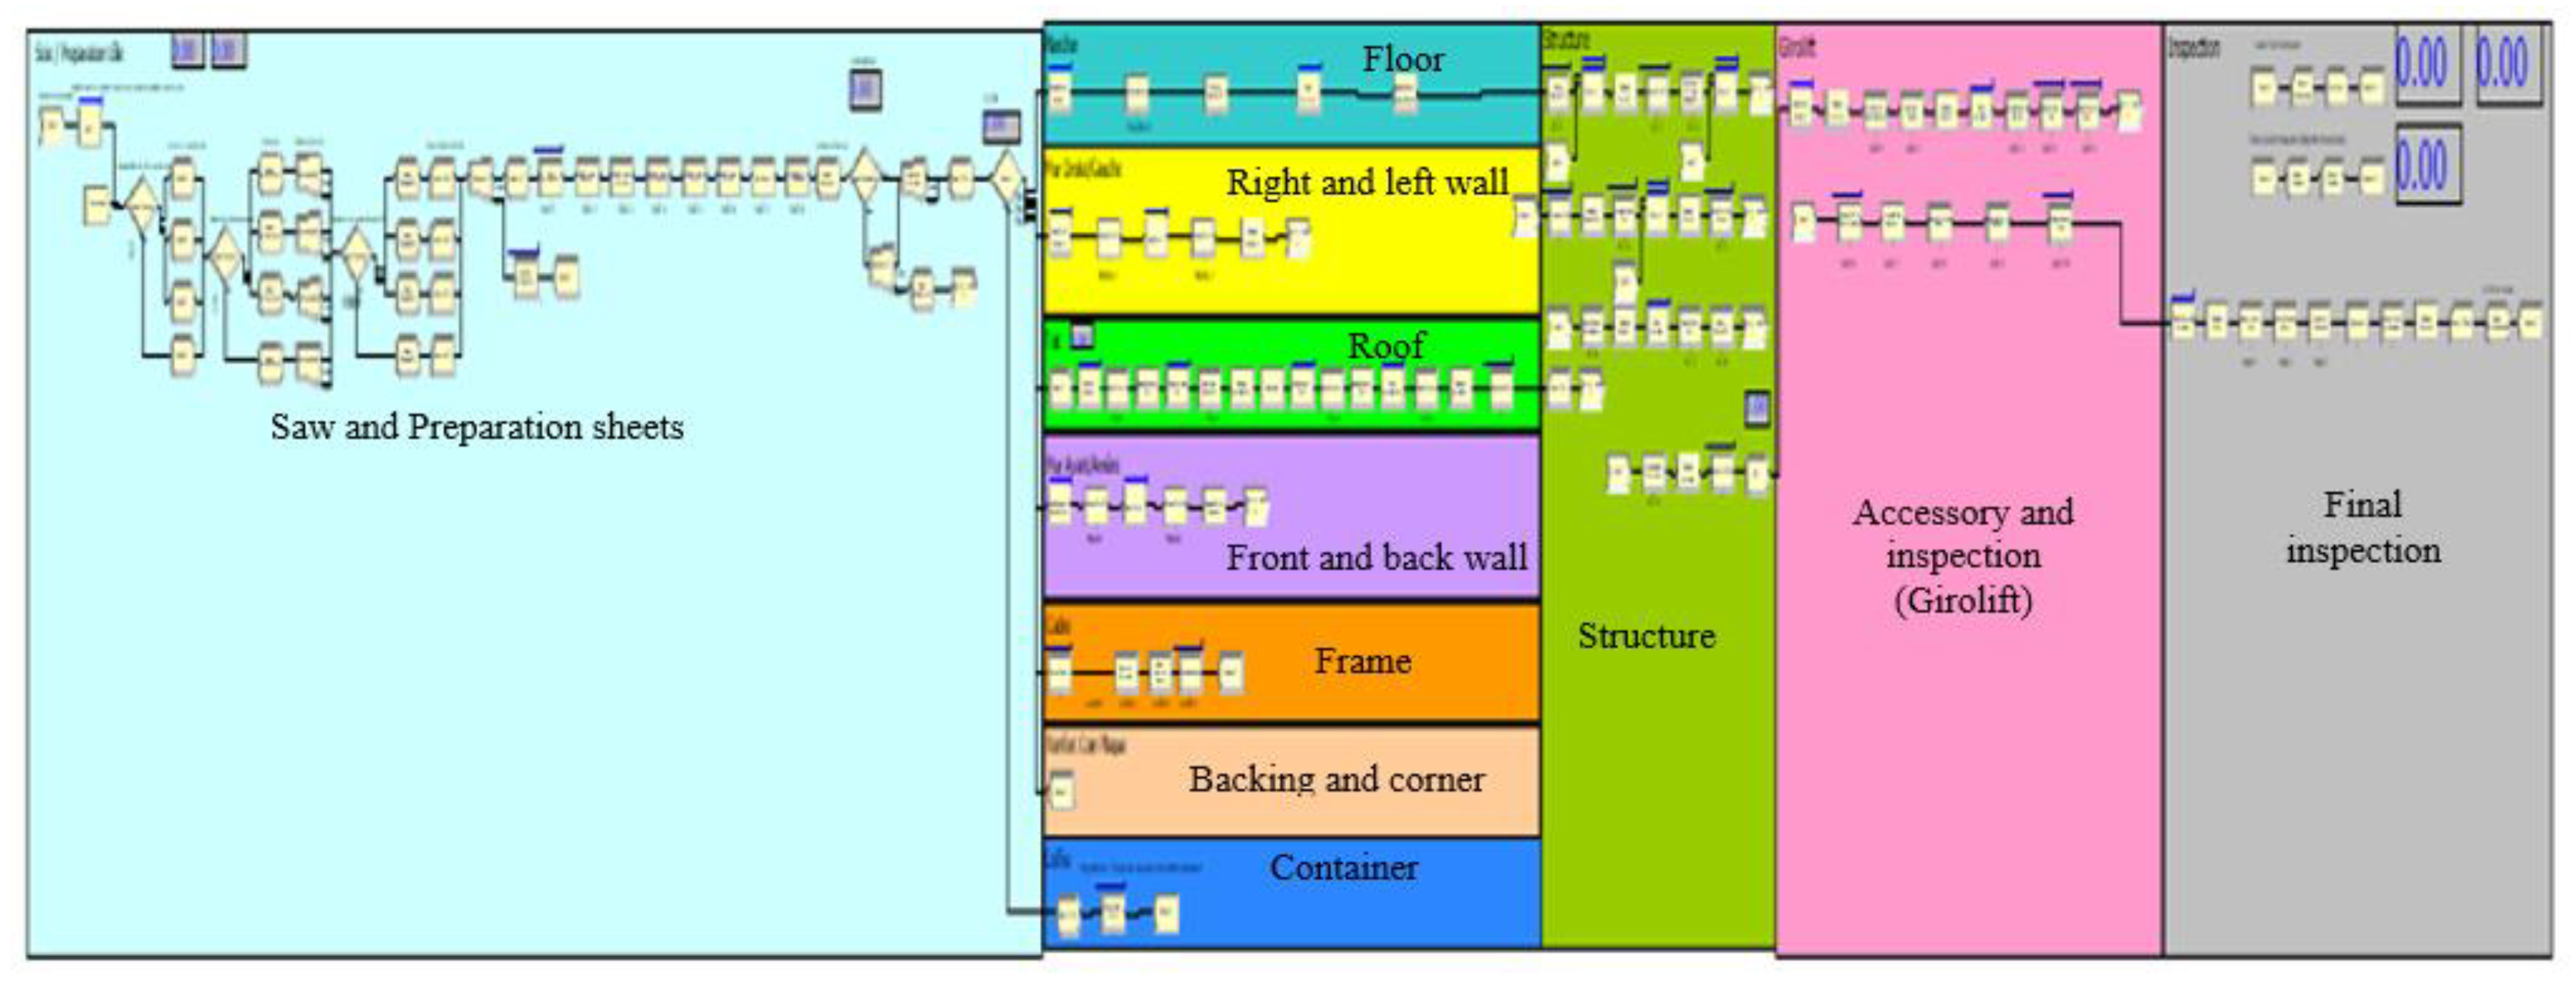
Simulation is one of the tools that can help companies with their digital shift. De Paula Ferreira et al. [25] showed in their literature review that the number of publications on the use of simulation in I4.0 has increased sharply over the last four years. Their study also shows that simulation allows companies to test different alternatives for implementing Industry 4.0 design principles. The simulation model was developed with the Arena software from Rockwell Automation. Figure 3 presents a screenshot of the basic simulation model and shows the modeling of each cell in the production line described in the map in Figure 2.
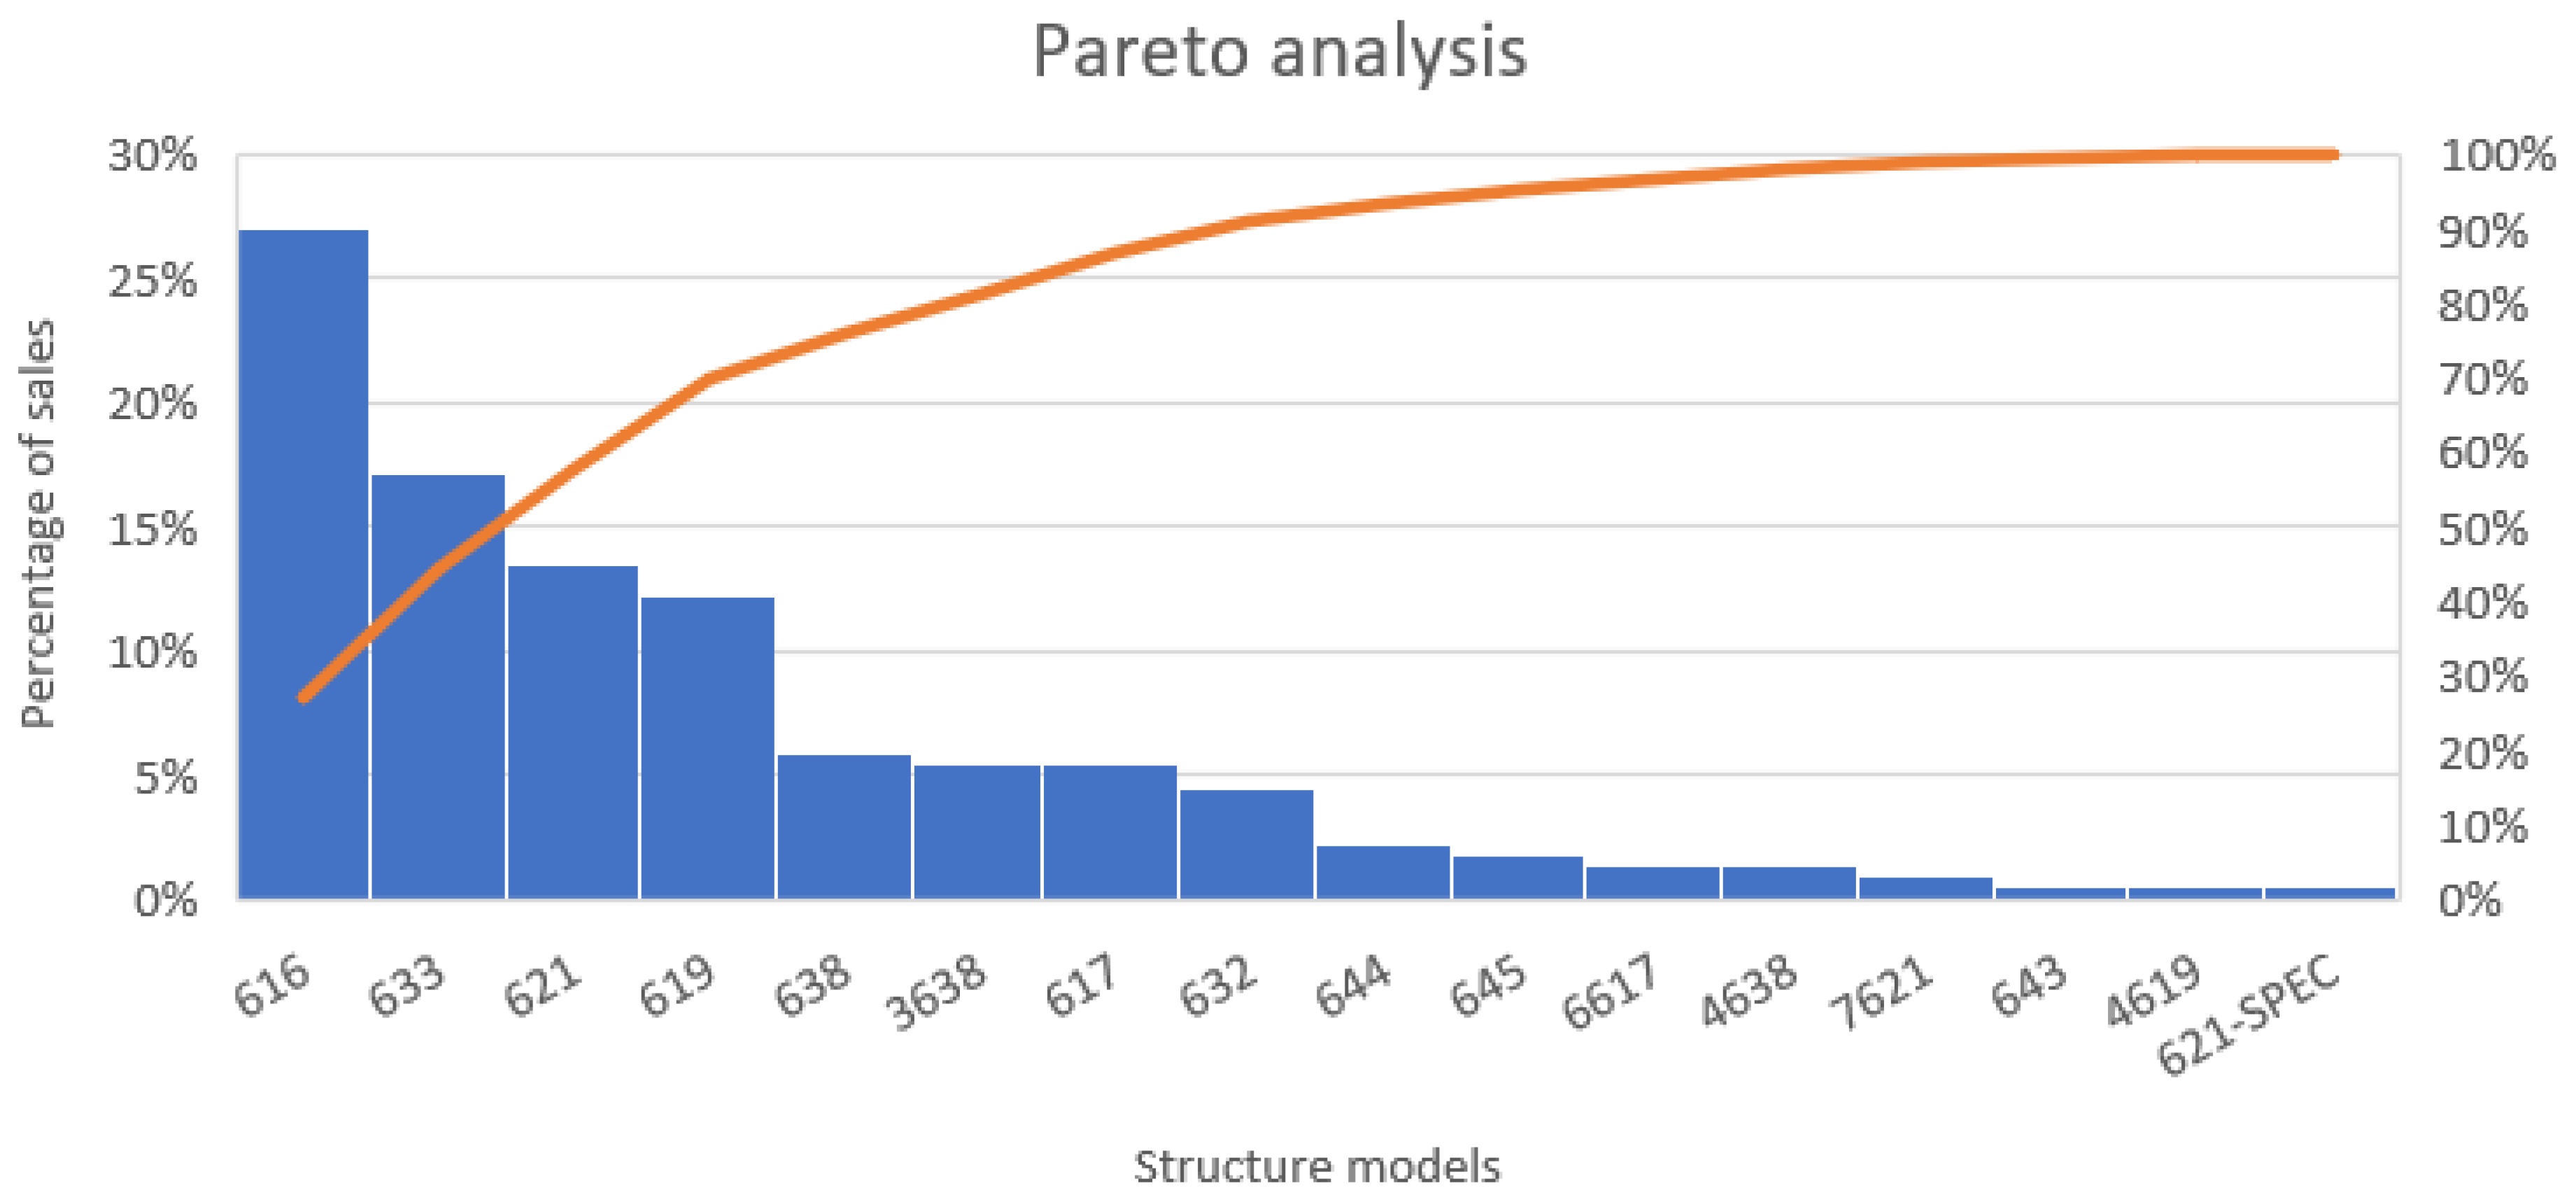
Figure 4 shows the Pareto analysis performed on the structure model sales. It is evident that models 616, 633, 621, and 619 account for 80% of sales.
The simulation model, therefore, begins by creating an order for one of these four models in the following proportions: 616 (39%), 633 (25%), 621 (19%), and 619 (17%). The order size varies between 2, 4, 6, and 8 units in the same proportion (25%).
Orders are put into production according to the following criterion: When there are three or fewer structures in the system after the extrusion and sheet cutting and preparation step, the model creates a new order to ensure continuous production.

3.3.1. Simulation Data

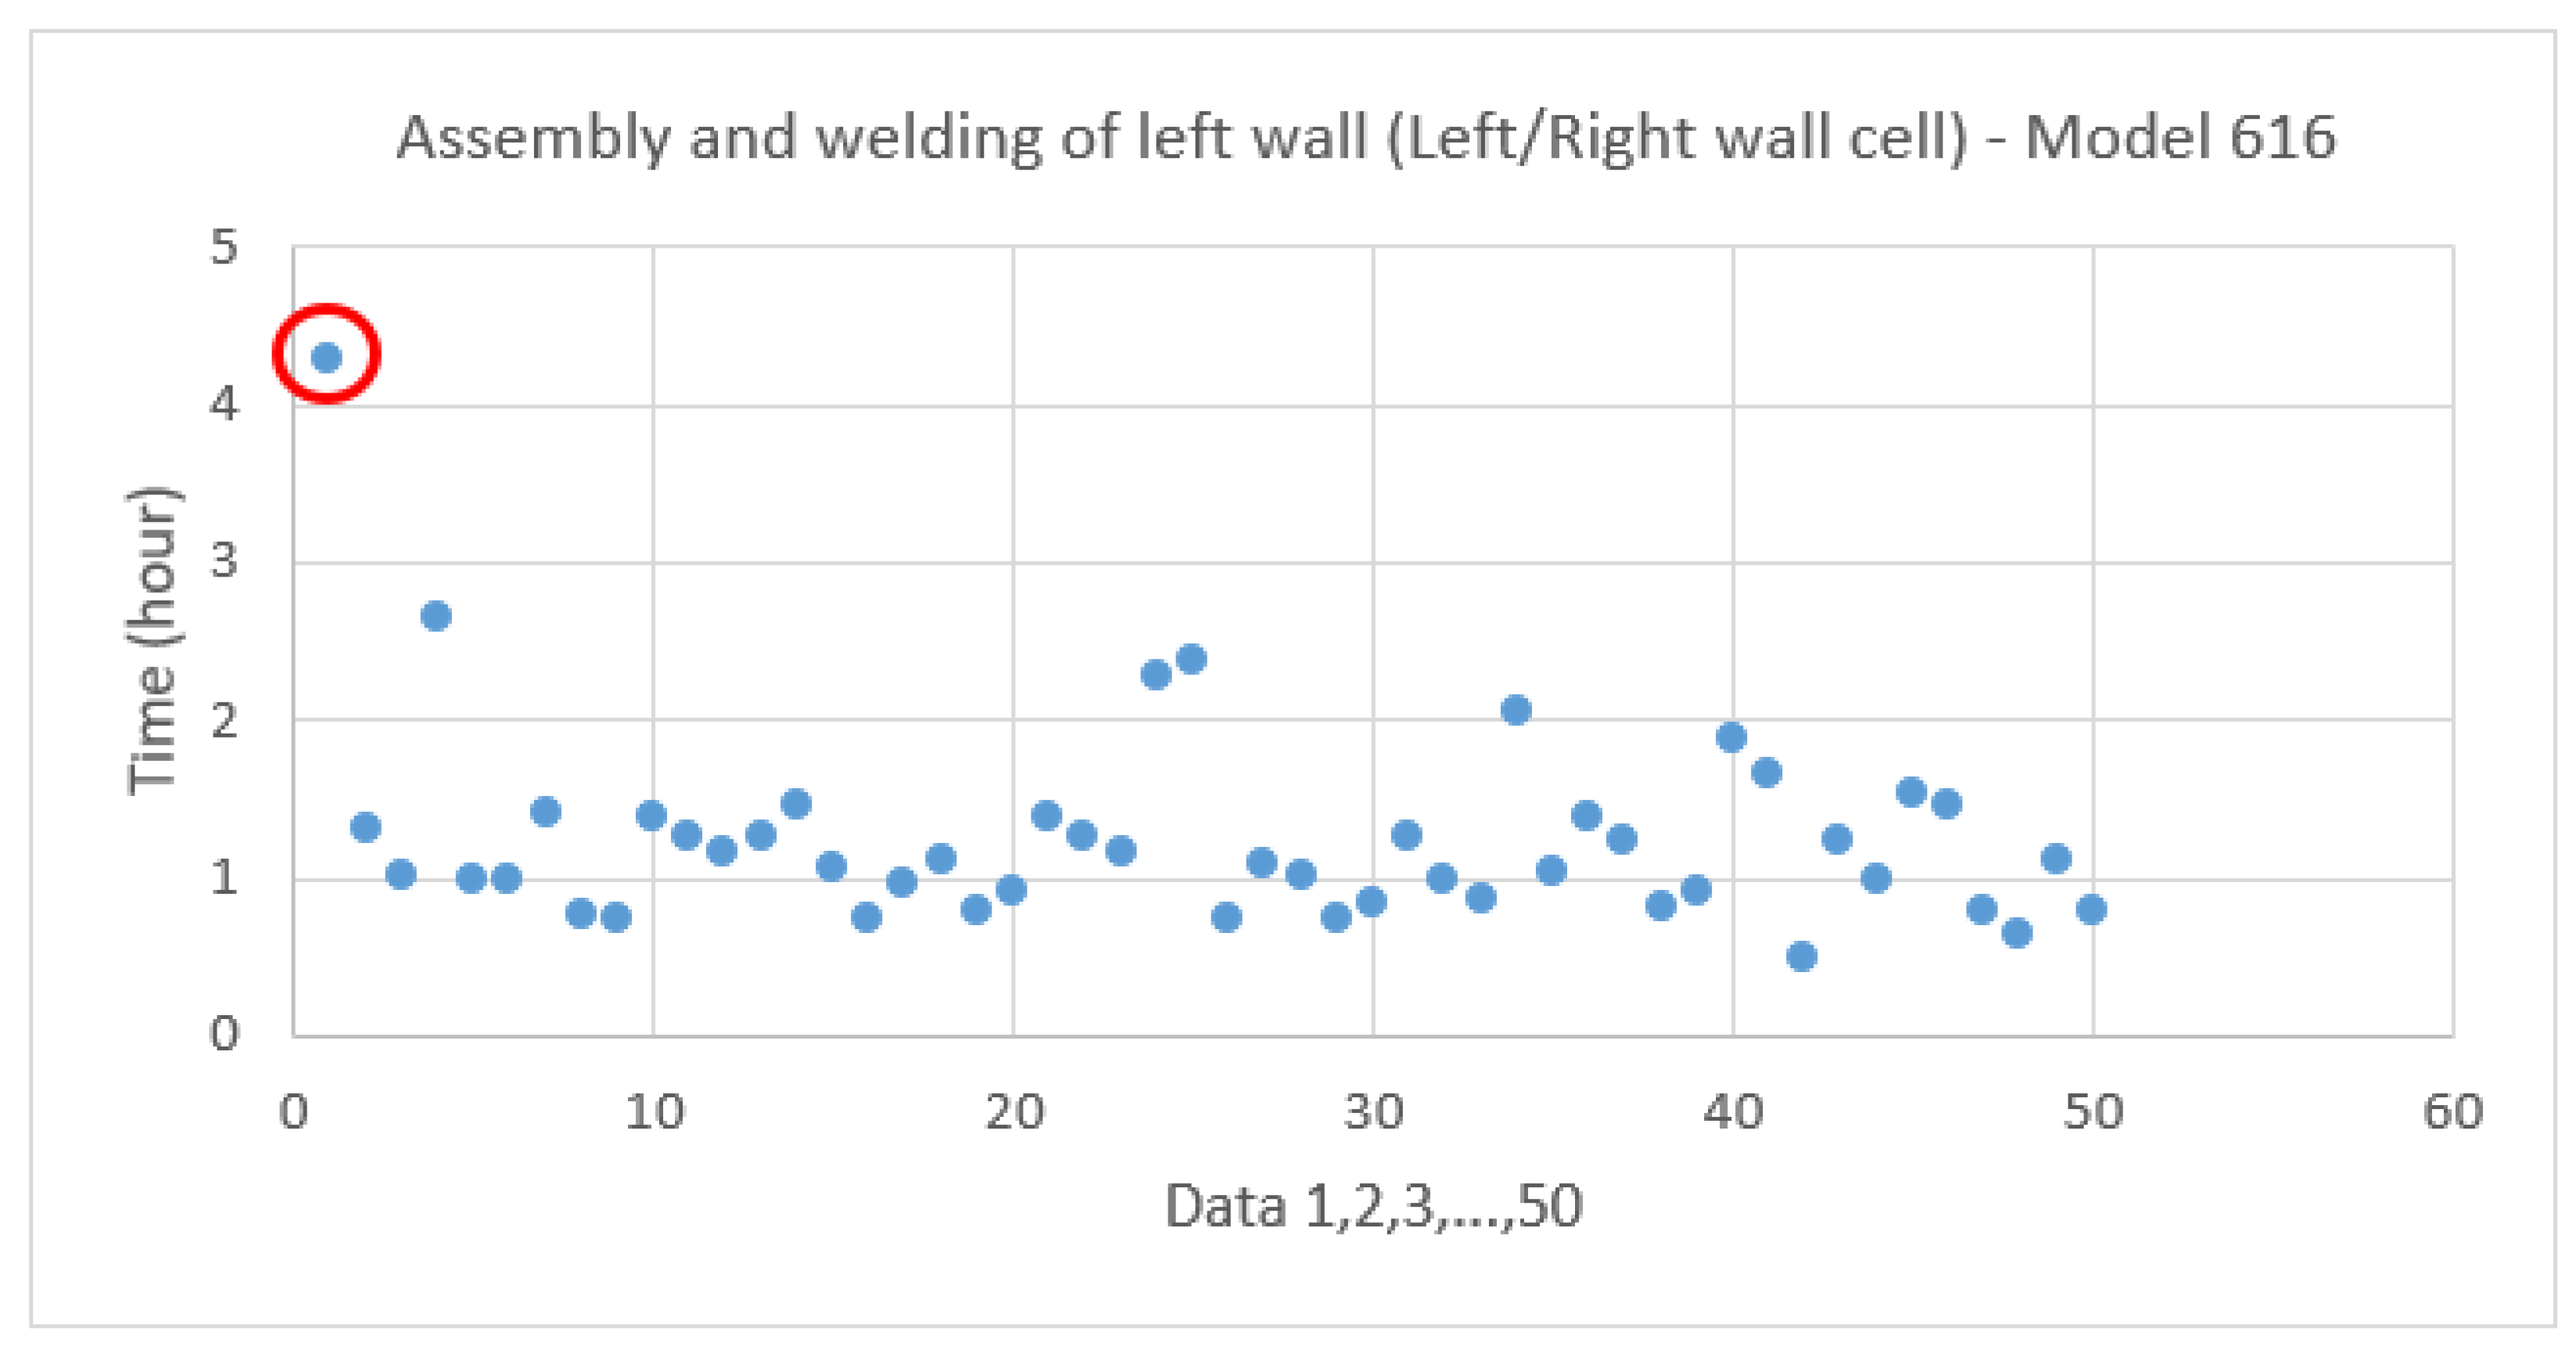
The production times to manufacture each structure are different. The data used to build the simulation model were taken from the MS ERP system. For each operation, a group of data were verified and analyzed to remove outlier data as needed. Figure 5 presents an example of a graph created from ERP system data for an assembly and welding operation of the left wall of a model 616 ambulance structure. This graph shows the variability of data and serves to identify outlier data (circled data).
Then, the data were entered in the INPUT ANALYZER of the ARENA software to determine the statistical distributions. For example, Table 7 presents the distributions used in the simulation model for the left/right wall cells.
Similar tables were created for all of the other cells in the production line.

3.3.2. Permanent Regime and Validation

Because this system functions on an infinite horizon, it is important to analyze the system in a permanent regime. Using the graphing method to visualize the structure makespan on the production line shows that makespan stabilizes after 2500 h. Therefore, a warm-up time of 2500 h was used. The simulation duration was set at 10,000 h.
In order to ensure that the results obtained by the basic simulation model indeed reflect the reality of the production line, several verifications and validations were performed to detect modeling and logical errors. However, the best way to validate the simulation model is to compare the observed performance indicator value with the simulated value. Thus, the makespan and number of structures produced in a given time (observed value) were compared with the values obtained by the simulation model (Table 8).
As the delta between the results observed at MS and those obtained with the simulation model was less than or equal to 5%, the model was deemed valid for conducting and testing the experiments.

3.4. Results Obtained with the Simulation Model

All of the experiments were conducted with the basic simulation model, which was modified according to the level of the factor. A total of 16 experiments were conducted, and each experiment was repeated 10 times (R1 to R10). Table 9 presents the makespan obtained with the simulation model for each experiment. Each line represents an experiment or a simulation; for experiment 1, all of the factors were in Level 1 (see Table 6 for the definition of the levels), which represents the current situation. For experiment 2, factors A, B, and E were Level 1, factors D and C were Level 2, and so on.
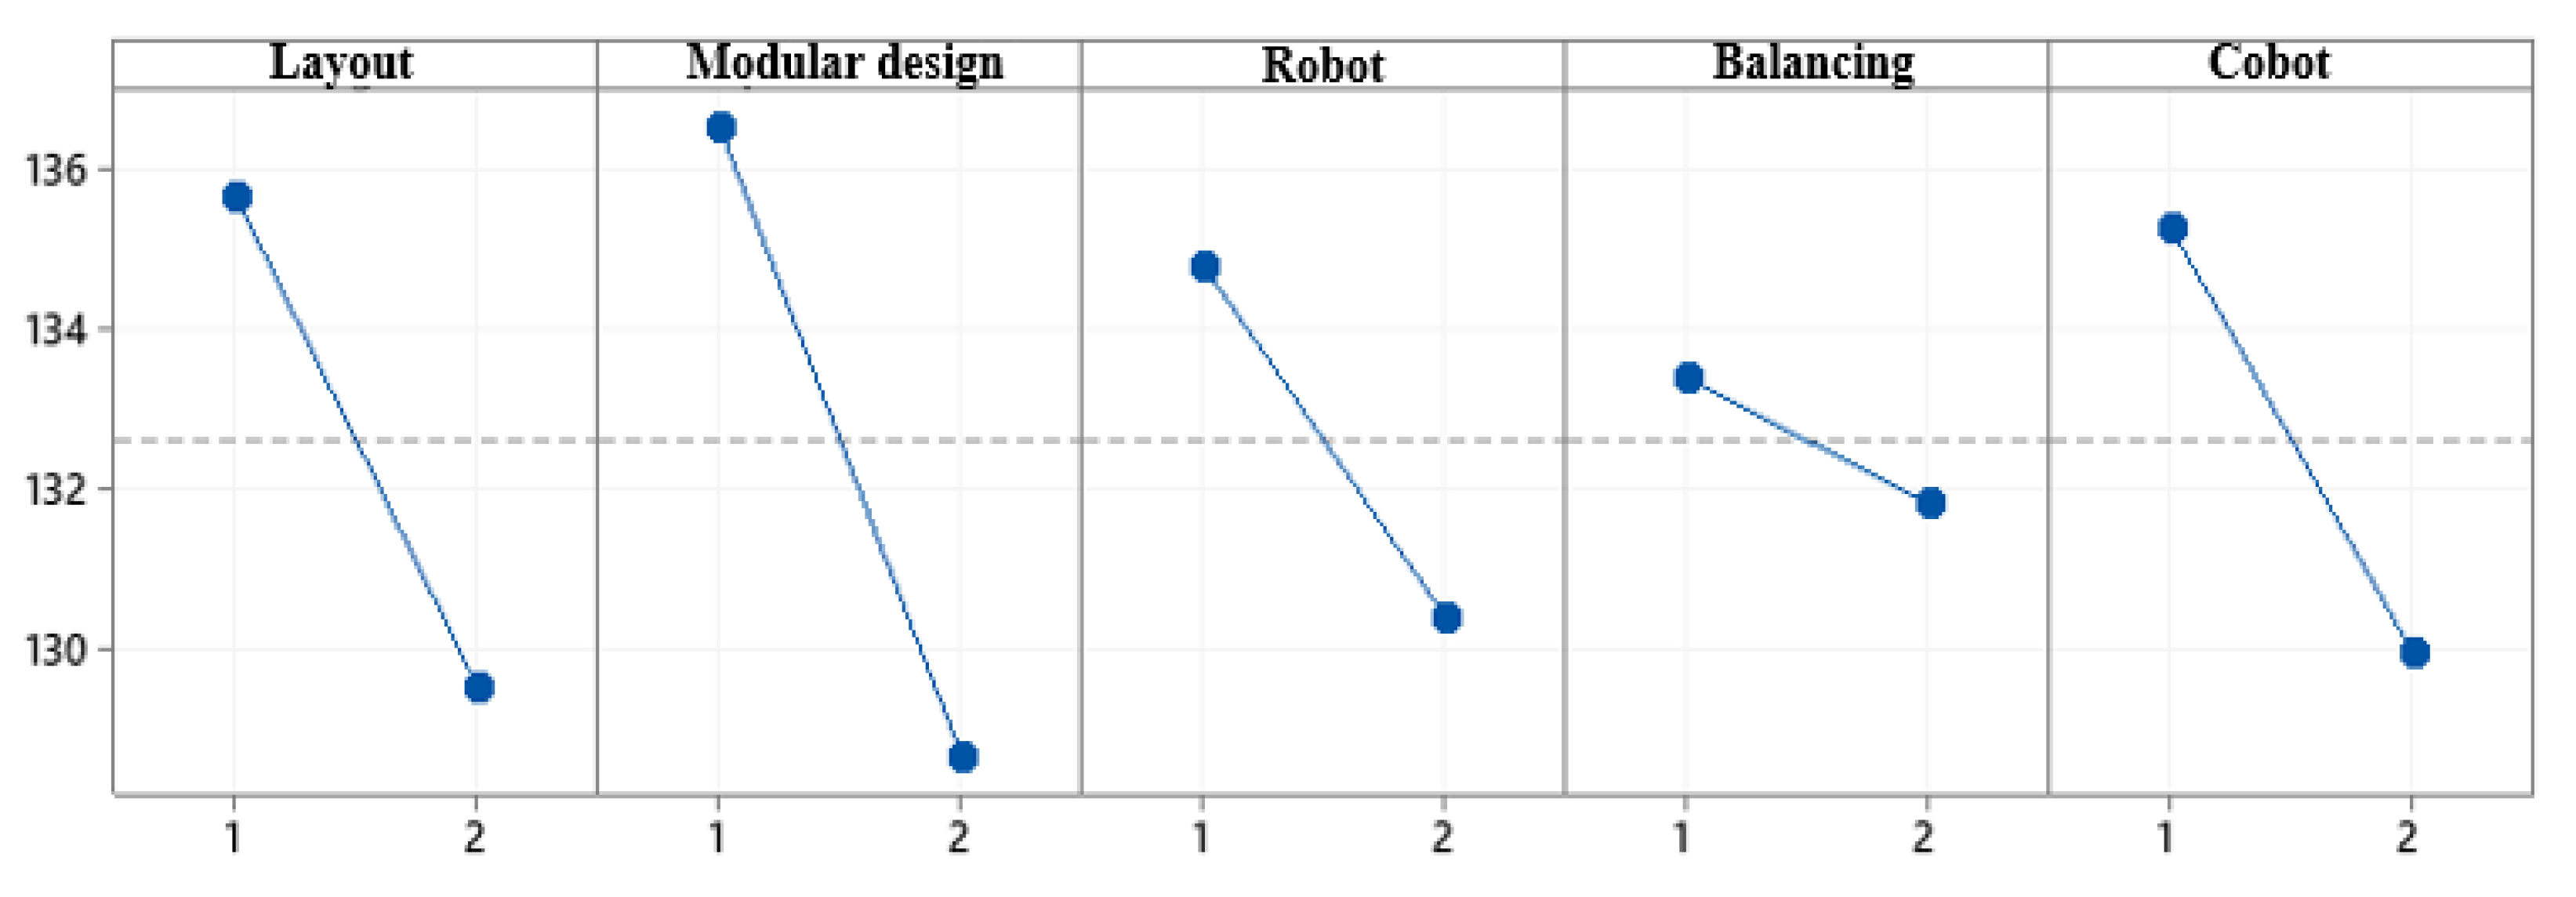
The results were analyzed using the Minitab statistical software. First, a graphic analysis was conducted using the data in Table 9. Figure 6 presents the effect of the factors on ambulance structure makespan, while Table 10 shows the average makespan for each factor level, as well as the delta and the ranking of each factor. The ranking serves to order the factors based on their impact on makespan.
Figure 6 shows that all factors contribute to reducing the ambulance structure makespan.
Table 10 shows that the modular design (B) of ambulance structures is the factor with the greatest impact on makespan (rank 1 and delta of 7.8 h). Modular design makes it possible to cut the makespan by 5.7% (136.4 h to 128.7 h). Establishing a dynamic cell organization (A) cuts makespan by 4.5% (135.6 h to 129.5 h). Using a cobot (E) shortens structure makespan by 3.9% (135.2 h to 129.9 h). Using a robot (C) cuts makespan from 134.8 h to 130.3 h, which represents a reduction of 3.3%. Lastly, the natural balancing of the production line (D) shortens the makespan by 1.1% (133.3 to 131.8 h). To verify if these differences are statistically significant, an analysis of variance was conducted. Table 11 presents the results of this analysis. Two factors can affect or explain the data in Table 11: one, the high number of replications, and two, the fact that Lean principles were implemented along the way, and are thus included in the production time used in the simulation. In conclusion, the implementation of Lean is an important prerequisite for implementing I4.0.
The only factor that is significant with a significance threshold of 5% is modular design (B). The Organization (A) factor is significant to a significance threshold of 10%. These two factors, therefore, have a real impact on ambulance structure makespan. We also note that the order of factors, from most significant to least significant, is the same as the one observed in the graphic analysis (Figure 6), namely, (1) modular design, (2) organization, (3) cobot use, (4) robot use, and, lastly, 5) line balancing.
Table 12 presents other data relevant to analyzing the results.
The Makespan column shows the average time obtained by the simulation for each experiment. Experiment 1 corresponds to the current state of the production line under study and serves to compare the results between the current line and the changes that could be made to it. If we compare the current situation to the best solution, experiment 15, we note a reduction in makespan of 28.61 h, i.e., an improvement of 19.34%. This represents an increase in weekly production of close to one structure per week, i.e., from 5.83 to 6.83.
The “typical delta” and “scope” columns, for their part, show the reduction in variability. Once again, if we compare the best solution (experiment 15) with the current situation (experiment 1), we note a considerable reduction of variability in the results. Indeed, the current makespan is approximately 147.96 h with a typical delta of 38.89 h, and, compared to experiment 15, not only is the makespan cut to 119.35 h, but the typical delta is reduced to 10.04 h. This represents a makespan decrease of 28.61 h (19.34%) and a reduction in the typical delta of 74.18%. With regard to the range, the difference between the largest (experiment 1) and the smallest value obtained (experiment 15) in Table 12 is close to 120 h. The range for the current situation (experiment 1) is 127.40 h compared to 27.14 h for the best solution (experiment 15). Therefore, we see a major improvement with regard to variability.

3.5. Next Steps for MS

Based on these results, MS is working to design modular products and reorganizing its production line into dynamic and mixed cells. Robots/cobots will be purchased and implemented on the production line. Lastly, MS has aquired software that links machines together using the Internet of Things. This will make it possible to track production in real time and obtain relevant information on the production of certain components and on the status of certain machines.

4. Discussion

Several observations can be made from this study.

4.1. Lean and I4.0

MS developed a map of the production line value chain to identify waste and the improvements necessary to ensure better process control. Indeed, before launching into process automation, MS reduced unnecessary personnel movement, reduced delays and waits, and standardized work methods. Lean tools (5S, poka-yoke, SMED, kaizen, kanban, etc.) were indispensable in this process. The implementation of Lean and continuous improvement at MS made it possible to increase production capacity by 20%. This is a considerable gain given that no material investment was made. The company allocated the time required to complete all of the improvement projects identified by the value chain map. Liebercht et al. [18] asserted that Lean management tools should be linked with I4.0 tools to support small-sized companies in particular in implementing integrated production systems that combine Lean management and Industry 4.0. Our results also confirm the relevance of integrating Lean management in the preliminary step (Table 5) of the strategy proposed by Gamache [21]. Cotrino et al. [17], for their part, suggested identifying bottlenecks in step 0 of their strategy (Table 2) without specifying Lean. MS constitutes a real case study of how SMEs benefit from Lean and 4.0, as asserted by Tissir et al. [22]. Other case studies are being developed and will soon complement the results of this research.

4.2. Simulation in the I4.0 Implementation Strategy

Although SMEs are ill equipped and lack resources to implement this technology [7,49], the experts in Moeuf et al. [7] are in favor (over 92% agreement) of SMEs using simulation as an improvement technology.
MS decided to test principles and tools on the simulation model before they were implemented. The results made it possible to (1) measure productivity gain, (2) identify the order of steps to implement in a situation, and, lastly, (3) to know the impact on makespan variability and, thereby, on product quality.
Our results show that using a cobot and a robot shortens structure makespan, respectively, by 3.9% and 3.3%. Individually, these factors seem to have little impact, but they contribute to the flexibility required by production lines in a personalized mass production context. Our results also show that establishing dynamic cell organization cuts makespan by 4.5%. Once again, this practice contributes to the flexibility required by a production line in a personalized mass production context. On its own, modular design makes it possible to cut makespan by 5.7%. However, when combined with other factors (cell organization, cobots, robots), makespan is shortened by 19.34%. This represents an increase in weekly production of almost one structure per week, i.e., a production increase of more than 15%.
Our results also show that the implementation steps of (1) Lean and continuous improvement, (2) agility and innovation, and (3) automation of processes contribute to the implementation of I4.0 to successfully respond to the challenges of mass personalization. Indeed, MS increased its production from five structures per week to six after implementing Lean and could manufacture up to 6.83 structures per week by implementing I4.0, according to our simulation results.
Often companies try to cut makespan without paying particular attention to variability. The greater the variability, the greater the losses (scrap, touch-ups, delivery delays, credits for clients, loss of clientele). Our results show that implementing modular product design, cell organization and mixed production on the production line, and automation of bottlenecks (Experiment 15 in Table 12) reduces makespan from where it currently is (Experiment 1 in Table 12). However, our study also shows that these changes reduce variability. Table 13 compares the results obtained with the simulation from experiments 1 (current situation) and 15 (4.0 business practices) in Table 12 model.
Our results, therefore, show a major reduction in variability, which results in better quality and better control of process time.
All of our results demonstrate that the simulation model is a fundamental tool in assessing the expected benefits of implementing 4.0 tools and strategies. We believe that this will help to reduce barriers when implementing Lean and I4.0 in SMEs, such as the lack of clarity regarding economic benefits and resistance to change [8]. As proposed by Moeuf et al. [7], simulation is a decision-making assistance tool that SMEs should use more often to better know the potential gains of implementing 4.0 technologies and to better choose the technologies to implement.

4.3. Practical Implications

The digital shift strategies found in the literature [12,16,17,18,21,35,50,51] often remain theoretical, and few have been tested and validated in a manufacturing SME. The goal of these strategies is to help companies reach digital maturity while increasing their productivity. Our study makes it possible to go further in developing digital shift strategies by establishing a sequence for deploying business practices. Using the simulation model, the factors (business practices) can be classified according to their impact on productivity: (1) modular design, (2) dynamic and reconfigurable organization, (3) use of cobots, (4) use of robots, and (5) natural line balancing. Modular design, which has the greatest impact on productivity, primarily concerns the product, while the organization, the use of cobots and robots, and line balancing concern the process. This observation leads us to believe that SMEs should begin by rethinking their products and their processes before automating. Based on our results and the experience acquired at MS, we propose the following steps to undertake a digital shift (Figure 7).
The I4.0 implementation strategies proposed by Gamache [21] and Cotrino et al. [17], among others, are conceptual and general. The advantage of Gamache’s strategy is that it is supported by a classification of business practices based on their impact on company digital performance. However, these practices are presented together and without order of precedence. Our work is a first step toward developing more specific implementation strategies to better guide SMEs, from the start, in their digital shift.
This study is part of a larger research program. Four case studies have been or are being conducted. These case studies will soon complement the results of this research. A case study conducted by Bouchard [52] in a manufacturing SME demonstrated that pairing Lean with 4.0 reduced the number of parts in inventory by 70% and cut makespan by more than 80%. Abdul-Nour et al. [53] presented a case where modular product structure, Lean, and 4.0 were implemented, and the company’s revenues rose from USD 2 million to USD 6 million in three years with the same resources. Today, the company has revenues of USD20 million with only three times the previous number of employees.

5. Conclusions

The goal of this paper was to present the digital shift process of an SME in a personalized mass production context. This case study led to the following observations:
Implementing Lean and developing agility, developing a modular product structure, and automating processes by step completed at the outset of a digital shift process lead to significant productivity gains.
Simulation coupled with an experimental plan (DOE) is a relevant decision-making tool for companies. With a simulation model, companies may, for example, assess which tasks must be automated and measure the impact of technological tools on productivity and variability without upsetting daily production activities.
The strategy proposed demonstrates that SMEs that undertake a digital shift must rethink the designs of their products (modular design) and of their processes before automating. Reconfigurability becomes the watchword.
Our work makes it easier to understand the interaction between Lean and I4.0 [22]. It will also contribute to the development of less general Lean 4.0 implementation strategies [12,16,17,18,21,35,50,51] that are better adapted to manufacturing SMEs in a personalized mass production context. Lastly, integrating simulation into the I4.0 implementation process assists with decision making and should be used more often by SMEs [7]. The documentation of a practical case fills a gap in the scientific research identified by several researchers [7,17,22].
This study has certain limitations. The case presented in this paper concerns a manufacturing SME that produces personalized products in the metal transformation sector. The other case studies were conducted in this sector, and a fourth is ongoing. These additional studies will allow us to refine the I4.0 implementation strategy in SMEs. However, our results already show SMEs that appreciable gains are possible by implementing Lean 4.0 by using the proposed strategy.
Other sectors have been targeted for our future studies. Thus, our results can be generalized to other sectors of activity. Following the encouraging results concerning Lean 4.0 in this study, other case studies will be conducted.
Furthermore, a research project is ongoing to apply these same principles to distributed manufacturing systems, known as network companies, which are specialized in personalized mass production. Two networks are currently under study.
The documentation of several practical cases in diverse activity sectors will make it possible to better identify the real difficulties of SMEs when implementing Lean 4.0. This will also make it possible to develop more specific implementation strategies that are better adapted to each sector. The lessons learned from these cases are a step toward an essential contribution to the development of I4.0 and Lean best practices in SMEs.

Author Contributions

S.A.: Conceptualization, methodology, Software, validation, formal analysis, investigation, validation, data curation, original draft preparation, visualization; C.B.: Conceptualization, Methodology, Software, Validation, writing—original draft preparation, resources, writing—review and editing, supervision; G.A.: Conceptualization, methodology, validation, review and editing, supervision, project administration; S.G.: Conceptualization, methodology, visualization. All authors have read and agreed to the published version of the manuscript.

Funding

This research received no external funding.

Institutional Review Board Statement

Not applicable.

Informed Consent Statement

Not applicable.

Data Availability Statement

Not applicable.

Conflicts of Interest

The authors declare no conflict of interest.

References

  1. Raymond Chabot Grant Thornton. Les PME Québécoises et Leurs Différents Enjeux: Une Étude Réalisée Auprès des Dirigeants de PME Québécoises; Raymond Chabot Grant Thornton: Montreal, QC, Canada, 2019; p. 46. [Google Scholar]
  2. Liker, J. Le Modèle Toyota: 14 Principes Qui Feront la Réussite de Votre Entreprise; Pearson Education: Paris, France, 2009. [Google Scholar]
  3. Alhuraish, I.; Robledo, C.; Kobi, A. A comparative exploration of lean manufacturing and six sigma in terms of their critical success factors. J. Clean. Prod. 2017, 164, 325–337. [Google Scholar] [CrossRef]
  4. Caggiano, A.; Caiazzo, F.; Teti, R. Digital factory approach for flexible and efficient manufacturing systems in the aerospace industry. Procedia CIRP 2015, 37, 122–127. [Google Scholar] [CrossRef]
  5. Économie du Savoir Site Web. Available online: https://economiedusavoir.com/eacm/transformation-numerique/#:~:text=L’industrie%204.0%2C%20fait%20r%C3%A9f%C3%A9rence,vos%20machines%20et%20votre%20%C3%A9quipement (accessed on 19 April 2021).
  6. Wankhede, V.A.; Vinodh, S. State of the art review on Industry 4.0 in manufacturing with the focus on automotive sector. Int. J. Lean Six Sigma 2021, 13, 2040–4166. [Google Scholar] [CrossRef]
  7. Moeuf, A.; Lamouri, S.; Pellerin, R.; Tamayo-Giraldo, S.; Tobon-Valencia, E.; Eburdy, R. Identification of critical success factors, risks and opportunities of Industry 4.0 in SMEs. Int. J. Prod. Res. 2020, 58, 1384–1400. [Google Scholar] [CrossRef]
  8. Raj, A.; Dwivedi, G.; Sharma, A.; de Sousa Jabbour, A.B.L.; Rajak, S. Barriers to the adoption of industry 4.0 technologies in the manufacturing sector: An inter-country comparative perspective. Int. J. Prod. Econ. 2020, 224, 107546. [Google Scholar] [CrossRef]
  9. Wankhede, V.A.; Vinodh, S. Analysis of barriers of cyber-physical system adoption in small and medium enterprises using interpretive ranking process. Int. J. Qual. Reliab. Manag. 2021. [Google Scholar] [CrossRef]
  10. Wankhede, V.A.; Vinodh, S. Analysis of Industry 4.0 challenges using best worst method: A case study. Comput. Ind. Eng. 2021, 159, 107–487. [Google Scholar] [CrossRef]
  11. Gamache, S.; Abdul-Nour, G.; Baril, C. Evaluation of the influence parameters of Industry 4.0 and their impact on the Quebec manufacturing SMEs: The first findings. Cogent Eng. 2020, 7, 1771818. [Google Scholar] [CrossRef]
  12. McKinsey Digital. Industry 4.0. How to Navigate Digitization of the Manufacturing Sector; McKinsey & Company: Chicago, IL, USA, 2015. [Google Scholar]
  13. Sishi, M.; Telukdarie, A. Implementation of Industry 4.0 technologies in the mining industry—A case study. Int. J. Min. Miner. Eng. 2020, 11, 1–12. [Google Scholar] [CrossRef]
  14. Mittal, S.; Khan, M.A.; Romero, D.; Wuest, T. A critical review of smart manufacturing and industry 4.0 maturity models: Implications for small and medium-sized enterprises (SMEs). J. Manuf. Syst. 2018, 49, 194–214. [Google Scholar] [CrossRef]
  15. Wankhede, V.A.; Vinodh, S. Benchmarking Industry 4.0 readiness evaluation using fuzzy approaches. Benchmarking Int. J. 2022. [Google Scholar] [CrossRef]
  16. Amaral, A.; Peças, P. A Framework for Assessing Manufacturing SMEs Industry 4.0 Maturity. Appl. Sci. 2021, 11, 6127. [Google Scholar] [CrossRef]
  17. Cotrino, A.; Sebastián, M.A.; González-Gaya, C. Industry 4.0 Roadmap: Implementation for Small and Medium-Sized Enterprises. Appl. Sci. 2020, 10, 8566. [Google Scholar] [CrossRef]
  18. Liebrecht, C.; Kandler, M.; Lang, M.; Schaumann, S.; Stricker, N.; Wuest, T.; Lanza, G. Decision support for the implementation of Industry 4.0 methods: Toolbox, Assessment and Implementation Sequences for Industry 4.0. J. Manuf. Syst. 2021, 58, 412–430. [Google Scholar] [CrossRef]
  19. Nakagawa, E.Y.; Antonino, P.O.; Schnicke, F.; Capilla, R.; Kuhn, T.; Liggesmeyer, P. Industry 4.0 reference architectures: State of the art and future trends. Comput. Ind. Eng. 2021, 156, 107241. [Google Scholar] [CrossRef]
  20. Horváth, D.; Szabó, R.Z. Driving forces and barriers of Industry 4.0: Do multinational and small and medium-sized companies have equal opportunities? Technol. Forecast. Soc. Chang. 2019, 146, 119–132. [Google Scholar] [CrossRef]
  21. Gamache, S. Stratégies de Mise en Oeuvre de l’Industrie 4.0 dans les Petites et Moyennes Entreprises Manufacturières Québécoises. Ph.D. Thesis, Université du Québec à Trois-Rivières, Trois-Rivières, QC, Canada, 2019. [Google Scholar]
  22. Tissir, S.; Cherrafi, A.; Chiarini, A.; Elfezazi, S.; Bag, S. Lean Six Sigma and Industry 4.0 combination: Scoping review and perspectives. Total Qual. Manag. Bus. Excel. 2022, 1–30. [Google Scholar] [CrossRef]
  23. Ministère de l’Économie et de l’Innovation. Industrie 4.0: Origine et Définition. 2016. Available online: https://www.economie.gouv.qc.ca/fr/bibliotheques/outils/gestion-dune-entreprise/industrie-40/feuille-de-route-industrie-40/1-industrie-40-origine-et-definition/ (accessed on 10 May 2019).
  24. Ghobakhloo, M. The future of manufacturing industry: A strategic roadmap toward Industry 4.0. J. Manuf. Technol. Manag. 2018, 29, 910–936. [Google Scholar] [CrossRef] [Green Version]
  25. De Paula Ferreira, W.; Armellini, F.; De Santa-Eulalia, L. Simulation in industry 4.0: A state-of-the-art review. Comput. Ind. Eng. 2020, 149, 1–17. [Google Scholar] [CrossRef]
  26. Burke, T. OPC Unified Architecture Inteoperability for Industry 4.0 and the Internet of Things; OPC Foundation: Scottsdale, AZ, USA, 2017. [Google Scholar]
  27. Mabkhot, M.M.; Al-Ahmari, A.M.; Salah, B.; Alkhalefah, H. Requirements of the Smart Factory System: A Survey and Perspective. Machines 2018, 6, 23. [Google Scholar] [CrossRef] [Green Version]
  28. Efatmaneshnik, M.; Shoval, S.; Qiao, L. A Standard Description of the Terms Module and Modularity for Systems Engineering. IEEE Trans. Eng. Manag. 2018, 67, 365–375. [Google Scholar] [CrossRef]
  29. Hermann, M.; Pentek, T.; Otto, B. Design principles for industrie 4.0 scenarios: A Literature Review: Working Paper. 2015. Available online: https://www.researchgate.net/publication/307864150_Design_Principles_for_Industrie_40_Scenarios_A_Literature_Review (accessed on 8 March 2022).
  30. Tavcar, J.; Horvath, I. A Review of the Principles of Designing Smart Cyber-Physical Systems for Run-Time Adaptation: Learned Lessons and Open Issues. IEEE Trans. Syst. Man, Cybern. Syst. 2018, 49, 145–158. [Google Scholar] [CrossRef] [Green Version]
  31. Ustundag, A.; Cevikcan, E. Industry 4.0: Managing The Digital Transformation; Springer: Berlin/Heidelberg, Germany, 2018. [Google Scholar]
  32. Kagermann, H.; Wahlster, W.; Helbig, J. Recommendations for Implementing the Strategic Initiative Industrie 4.0. Securing the Future of German Manufacturing Industry; Final Report of the Industrie 4.0 Working Group; Forschungsunion: Munich, Germany, 2013. [Google Scholar]
  33. Hermann, M.; Pentek, T.; Otto, B. Design principles for industry 4.0 scenarios. In Proceedings of the 2016 49th Hawaii International Conference on System Sciences (HICSS), Koloa, HI, USA, 5–8 January 2016. [Google Scholar] [CrossRef] [Green Version]
  34. Bosman, L.; Hartman, N.; Sutherland, J. How manufacturing firm characteristics can influence decision making for investing in Industry 4.0 technologies. J. Manuf. Technol. Manag. 2019, 31, 1117–1141. [Google Scholar] [CrossRef]
  35. Impuls. Industry 4.0 Readiness. Online Self-Check for Business. Available online: https://www.industrie40-readiness.de/?lang=en (accessed on 11 March 2017).
  36. Abdul-Nour, G.; Lambert, S.; Drolet, J. Adaptation of jit phylosophy and kanban technique to a small-sized manufacturing firm; a project management approach. Comput. Ind. Eng. 1998, 35, 419–422. [Google Scholar] [CrossRef]
  37. Duray, R.; Ward, P.T.; Milligan, G.W.; Berry, W.L. Approaches to mass customization: Configurations and empirical validation. J. Oper. Manag. 2000, 18, 605–625. [Google Scholar] [CrossRef]
  38. Kampen, T.; Donk, D. Coping with product variety in the food processing industry: The effect of form postponement. Int. J. Prod. Res. 2014, 52, 353–367. [Google Scholar] [CrossRef]
  39. Kim, D.-Y.; Park, J.-W.; Baek, S.; Park, K.-B.; Kim, H.-R.; Kim, B.-B.; Oh, H.-Y.; Namgung, K.; Baek, W. A modular factory testbed for the rapid reconfiguration of manufacturing systems. J. Intell. Manuf. 2019, 31, 661–680. [Google Scholar] [CrossRef]
  40. Evans, S.; Li, H.; Yang, M. Classifying different types of modularity for technical system. Int. J. Technol. Manag. 2019, 81, 1–23. [Google Scholar] [CrossRef]
  41. Pahl, G.; Beitz, W. Engineering Design: A Systemic Approach; Springer: Berlin, Germany, 1996. [Google Scholar]
  42. Rheault, M.; Drolet, J.R.; Abdulnour, G. Physically reconfigurable virtual cells: A dynamic model for a highly dynamic environment. Comput. Ind. Eng. 1995, 29, 221–225. [Google Scholar] [CrossRef]
  43. Gupta, P. Modularity enablers: A tool for Industry 4.0. Life Cycle Reliab. Saf. Eng. 2018, 8, 157–163. [Google Scholar] [CrossRef]
  44. Gilchrist, A. Industry 4.0. The Industrial Internet of Things; Apress: New York, NY, USA, 2016; p. 250. [Google Scholar]
  45. Cohen, Y.; Faccio, M.; Galizia, F.G.; Mora, C.; Pilati, F. Assembly system configuration through Industry 4.0 principles: The expected change in the actual paradigms. IFAC-PapersOnLine 2017, 50, 14958–14963. [Google Scholar] [CrossRef]
  46. Pollard, D.; Chuo, S.; Lee, B. Strategies for mass customization. J. Bus. Econ. Res. 2008, 6, 77–86. [Google Scholar]
  47. Qin, Z.; Lu, Y. Self-organizing manufacturing network: A paradigm towards smart manufacturing in mass personalization. J. Manuf. Syst. 2021, 60, 35–47. [Google Scholar] [CrossRef]
  48. Sharp, J.; Irani, Z.; Desai, S. Working towards agile manufacturing in the UK industry. Int. J. Prod. Econ. 1999, 62, 155–169. [Google Scholar] [CrossRef]
  49. Moeuf, A.; Pellerin, R.; Lamouri, S.; Tamayo, S.; Barbaray, R. The industrial management of SMEs in the era of Industry 4.0. Int. J. Prod. Res. 2017, 56, 1118–1136. [Google Scholar] [CrossRef] [Green Version]
  50. HUB Institute. HUB Institute Forum Rapport; HUB Institute: Paris, France, 2017. [Google Scholar]
  51. Vinodh, S.; Antony, J.; Agrawal, R.; Douglas, J.A. Integration of continuous improvement strategies with Industry 4.0: A systematic review and agenda for further research. TQM J. 2020, 33, 441–472. [Google Scholar] [CrossRef]
  52. Bouchard, S. Stratégie d’Implantation de l’I4.0 et de l’Agilité dans une PME Manufacturière Québécoise. Master’s Thesis, Université du Québec à Trois-Rivières, Trois-Rivières, QC, Canada, 2021. [Google Scholar]
  53. Gursel, A.S.; Gen, M. Chapitre 1—Cellular manufacturing system evolution from group technology to reconfigurable system: A case study of dynamic cellular manufacturing system (DCMS) in an Electromechanical Assembly Industry. In Cellular Manufacturing Systems: Recent Developments, Analysis and Case Studies; Abdul-Nour, G., Gamache, S., Nouri, K., Eds.; Nova Science Publishers, Inc.: New York, NY, USA, 2018; ISBN 978-1-53612-879-6. [Google Scholar]
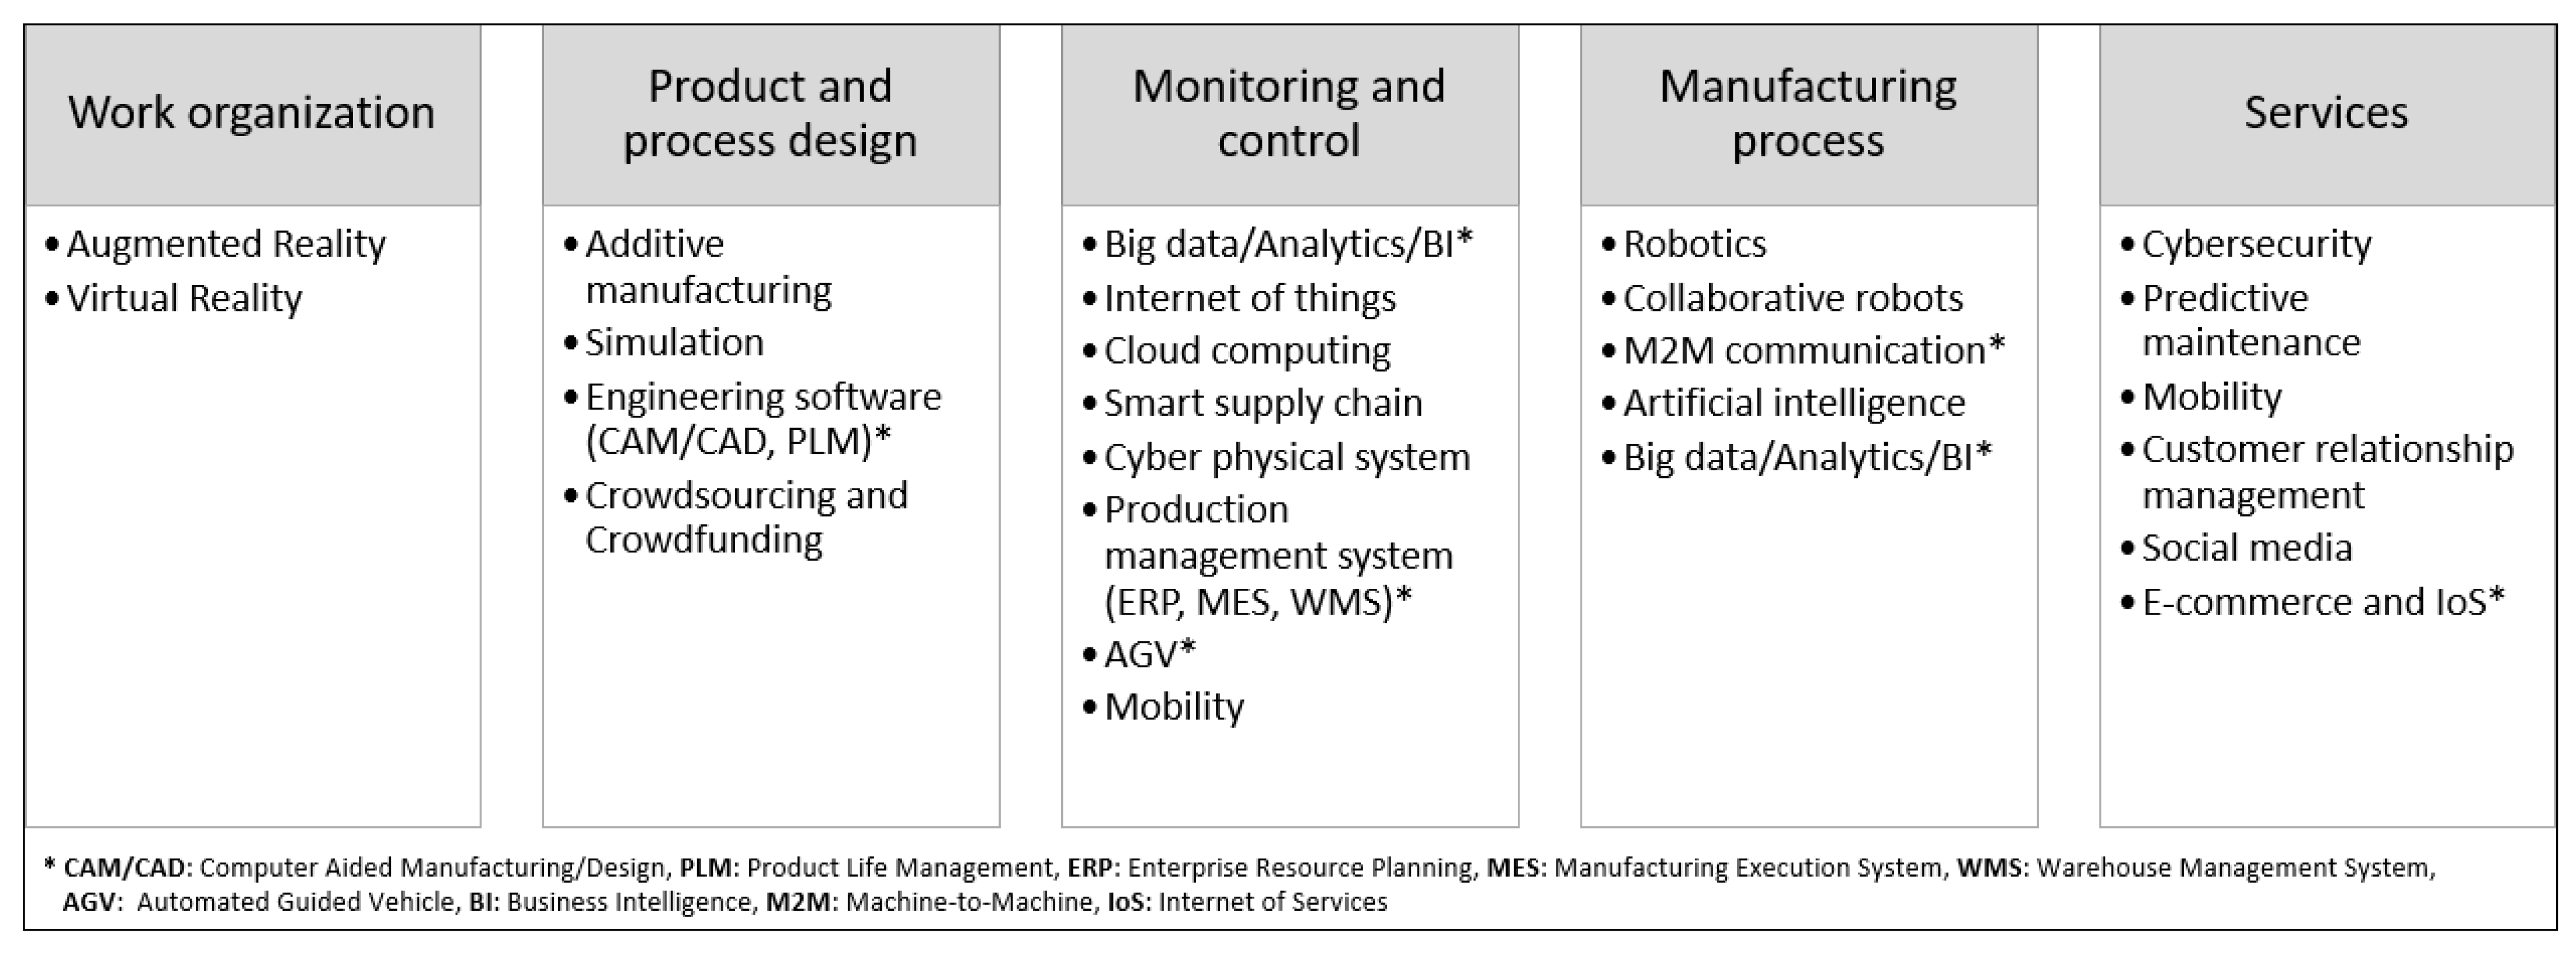
Figure 1. The 24 I4.0 technological tools.
Sustainability 14 06336 g001
Figure 2. Map of the ambulance structure production line.
Sustainability 14 06336 g002
Figure 3. Simulation model screenshot.
Sustainability 14 06336 g003
Figure 4. Pareto analysis of structure model sales.
Sustainability 14 06336 g004
Figure 5. Assembly and welding of the left wall (left/right wall cell)—model 616.
Sustainability 14 06336 g005
Figure 6. Graphic analysis of the main effects on makespan.
Sustainability 14 06336 g006
Figure 7. Sequence of steps and results obtained at MS.
Sustainability 14 06336 g007
Table 1. Design principles of Industry 4.0.
Design Principles of Industry 4.0
1Vertical integration10Autonomy
2Horizontal integration11Optimization
3End-to-end engineering integration12Flexibility
4Smart factory13Agility
5Interoperability14Service orientation
6Modularity15Smart product
7Real-time capability16Product personalization
8Virtualization17Corporate and social responsibility
9Decentralization
Table 2. Roadmap proposed and adapted from Cotrino et al. [17].
Step 0: Identify your bottlenecks
  • Evaluate current KPIs
Step 1: Develop a strategy
  • Select the Industry 4.0 technology based on budget and personnel requirements
Step 2: Ideas and Prototypes
  • Measure the success of the prototype
Step 3: Connect/Plug-in your devices
  • Deploy on the production line and employee training
Step 4: Analyze
  • Define new KPIs, store and analyze the data
Step 5: Go live
  • Proceed with official roll-out and sustainment
Table 3. Categories for classifying business practices.
Business PracticesImpact on the Digital Performance of Companies
EssentialSignificant impact and potential improvement > 20%
PrioritySignificant impact and potential improvement < 20%
Not priorityInsignificant impact and possible improvement > 10%
Specific casesInsignificant impact and possible improvement < 10%
Table 4. Classification of business practices according to Gamache [21].
CategoryBusiness Practices
Essential1Develop a digital vision and strategy
2Develop and clarify the digital ecosystem and architecture (with IT bridges for example)
3Demonstrate commitment and set an example
4Be proficient in digital tools
5Automate processes: implement ERP, MES, IoT, Robots, Cobots, AI systems
6Ensure data quality
7Benefit from e-commerce advantages (product configurator or a transactional website)
Priority8Improve change management
9Encourage Agility and Innovation
10Implement Lean and Continuous Improvement: define relevant performance indicators (KPI)
11Ensure cybersecurity
12Optimize data delivery (ERP, MES, and dynamic dashboard systems)
13Implement Mass Personalization
14Maximize the operational use of data (IoT, MES, dynamic dashboards)
15Maximize the strategic use of data
Non-priority16Develop new business models
17Deploy resources and investments
18Optimize skill acquisition and development (video training programs)
19Maximize internal communication (collaboration platform)
20Improve the data collection system (RFID, IoT, sensors, cloud computing)
21Ensure customer loyalty, service, and loyalty
Specific cases22Technology monitoring
23Openness to the outside
24Co-creation
Table 5. Digital shift strategy proposed by Gamache [21].
Preliminary Step
  • Map the value chain to ensure process control
  • Develop a strategic company vision and plan
Audit Step
  • Assess the company’s digital performance
Planning Step
  • Identify the business practices to implement (digital or not)
  • Prioritize and plan projects in a digital plan
Implementation Step
  • First, implement digital and non-digital business practices in the priority category
  • Implement Lean and optimize before deployment
Deployment Step
  • Deploy digital and non-digital solutions in all business processes
Optimization Step
  • Correct, optimize, and implement the next project on the list
Table 6. Experimental plan’s factors and levels.
FactorsLevel 1Level 2
Organization (A)CurrentDynamic cell
Modular design (B)NoneStandard platform and modules
Robot (C)NoneRobot
Line balancing (D)No balancingNatural balancing
Cobot (E)NoneCobot
Table 7. Statistical distributions (in hours) used for the left/right wall cells.
OperationsModel 616Model 619Model 621Model 633
Left wall weld0.63 + 1.36 × BETA (1.72, 3.24)0.27 + LOGN (0.816, 0.502)0.999 + WEIB (0.876, 1.28)0.999 + WEIB (0.876, 1.28)
Right wall weld0.71 + GAMM (0.237, 3.43)0.32 + LOGN (0.841, 0.539)NORM (2.36, 1.28)NORM (2.36, 1.28)
Table 8. Validation of the discrete-event simulation model.
IndicatorsValues Observed at MSSimulated Values with the ModelDelta
Structure makespan140 h147 h5.0%
Number of structures produced6 structures/week5.8 structures/week3.3%
Table 9. Results obtained with the simulation model.
ExperimentsFactors and ColumnsResults
BAEDCRepetitions and Makespan (in Hours)
124815R1R2R3R4R5R6R7R8R9R10
111111241.81124.75184.87122.63135.64140.15118.31143.82153.22114.41
211122185.06142.20157.14125.82120.52121.83171.14143.73135.64112.32
311212116.08115.29121.12132.72178.89116.65113.24119.73116.69185.71
411221130.76117.19120.96159.61172.14133.46173.58120.53113.56140.36
512112145.39128.84162.03137.52118.04116.39134.14121.49158.00113.30
612121138.17117.71119.25116.45186.06113.09109.54160.12112.86174.05
712211118.67117.38122.57120.74199.14130.59113.22120.61117.90180.80
812222118.08122.08117.52137.81153.25130.08158.85115.80113.36131.12
921112119.24176.88160.29135.13122.91115.68117.63114.63135.85118.66
1021121138.91115.69131.60114.98158.53143.58146.22113.59111.86137.40
1121211143.41125.41118.62110.38160.99127.61185.95109.86117.98130.88
1221222133.05110.33137.09108.36148.89132.30185.28111.37113.89111.84
1322111161.08112.50111.70149.02128.09132.99135.78185.25115.29121.09
1422122146.24132.73118.58144.14112.61113.16155.30110.70115.04109.12
1522212122.34111.32136.06109.64121.84115.53117.47110.60111.92136.78
1622221161.57116.06114.69128.90112.81127.49113.24116.86132.11113.35
Table 10. Structure makespan (in hours) for each factor level.
LevelModular Design (B)Organization (A)Cobot (E)Line Balancing (D)Robot (C)
1136.4135.6135.2133.3134.8
2128.7129.5129.9131.8130.3
Delta7.865.31.64.5
Ranking12354
Table 11. Analysis of variance.
SourceDLSomCar AjustCM AjustFp-Value
Organization (A)11498.91498.912.770.098
Modular design (B)12466.82466.784.570.034
Robot (C)1775.6775.631.440.233
Balancing the line (D)198.097.970.180.671
Cobot (E)11126.41126.362.090.151
Organization × Modular Design (AB)127.427.390.050.822
Organization × Robot (AC)18.58.500.020.900
Organization × Balancing (AD)110.510.510.020.889
Organization × Cobot (DE)1185.6185.590.340.559
Error15081,026.6540.18
Lack-of-fit6719.7119.950.220.972
Pure error14480,306.9557.69
Total15987,224.3
Table 12. Descriptive statistics of experiments.
ExperimentsColumnResults
Modular Design (B)Organization (A)Cobot (E)Line Balancing (D)Robot (C)Makespan (av.)Typical DeltaScopeav. Number Structure/Week
1NoneCurrent organizationWithout cobotWithout balancingWithout robot147.9638.89127.405.83
2NoneCurrent organizationWithout cobotWith natural balancingWith robot141.8423.5672.746.03
3NoneCurrent organizationWith cobotWithout balancingWith robot131.9831.64104.336.24
4NoneCurrent organizationWith cobotWith natural balancingWithout robot138.2222.6160.026.05
5NoneDynamic cellWithout cobotWithout balancingWith robot133.5117.2448.736.18
6NoneDynamic cellWithout cobotWith natural balancingWithout robot134.7328.4476.526.11
7NoneDynamic cellWith cobotWithout balancingWithout robot134.1630.0685.926.11
8NoneDynamic cellWith cobotWith natural balancingWith robot129.8015.8945.496.32
9Standard platforms and modulesCurrent organizationWithout cobotWithout balancingWith robot131.6921,17662.256.19
10Standard platforms and modulesCurrent organizationWithout cobotWith natural balancingWithout robot131.2416,36946.676.20
11Standard platforms and modulesCurrent organizationWith cobotWithout balancingWithout robot133.1124.1876.096.14
12Standard platforms and modulesCurrent organizationWith cobotWith natural balancingWith robot129.2424.1876.926.38
13Standard platforms and modulesDynamic cellWithout cobotWithout balancingWithout robot135.2823.7673.556.09
14Standard platforms and modulesDynamic cellWithout cobotWith natural balancingWith robot125.7617.2546.186.45
15Standard platforms and modulesDynamic cellWith cobotWithout balancingWith robot119.3510.0327.146.83
16Standard platforms and modulesDynamic cellWith cobotWith natural balancingWithout robot123.7115.1548.766.75
Table 13. Impact on variability.
Performance IndicatorsExperiment 1 (Current)Experiment 15 (4.0)Delta
Makespan147.96 h119.35 h28.61 h (↓19.34%)
Typical delta38.8910.0328.86 (↓74.21%)
Range127.4027.14100.26 (↓78.70%)
Publisher’s Note: MDPI stays neutral with regard to jurisdictional claims in published maps and institutional affiliations.