Figure 1.
Mediation Illustration for Classroom Interaction, PLD, and Father Employment.
Figure 1.
Mediation Illustration for Classroom Interaction, PLD, and Father Employment.
Figure 2.
Mediation Effect for Classroom Interaction, PLD, and Father Employment.
Figure 2.
Mediation Effect for Classroom Interaction, PLD, and Father Employment.
Figure 3.
Mediation Illustration for Classroom Interaction, PLD, and Mother Employment.
Figure 3.
Mediation Illustration for Classroom Interaction, PLD, and Mother Employment.
Figure 4.
Mediation Effect for Classroom Interaction, PLD, and Mother Employment.
Figure 4.
Mediation Effect for Classroom Interaction, PLD, and Mother Employment.
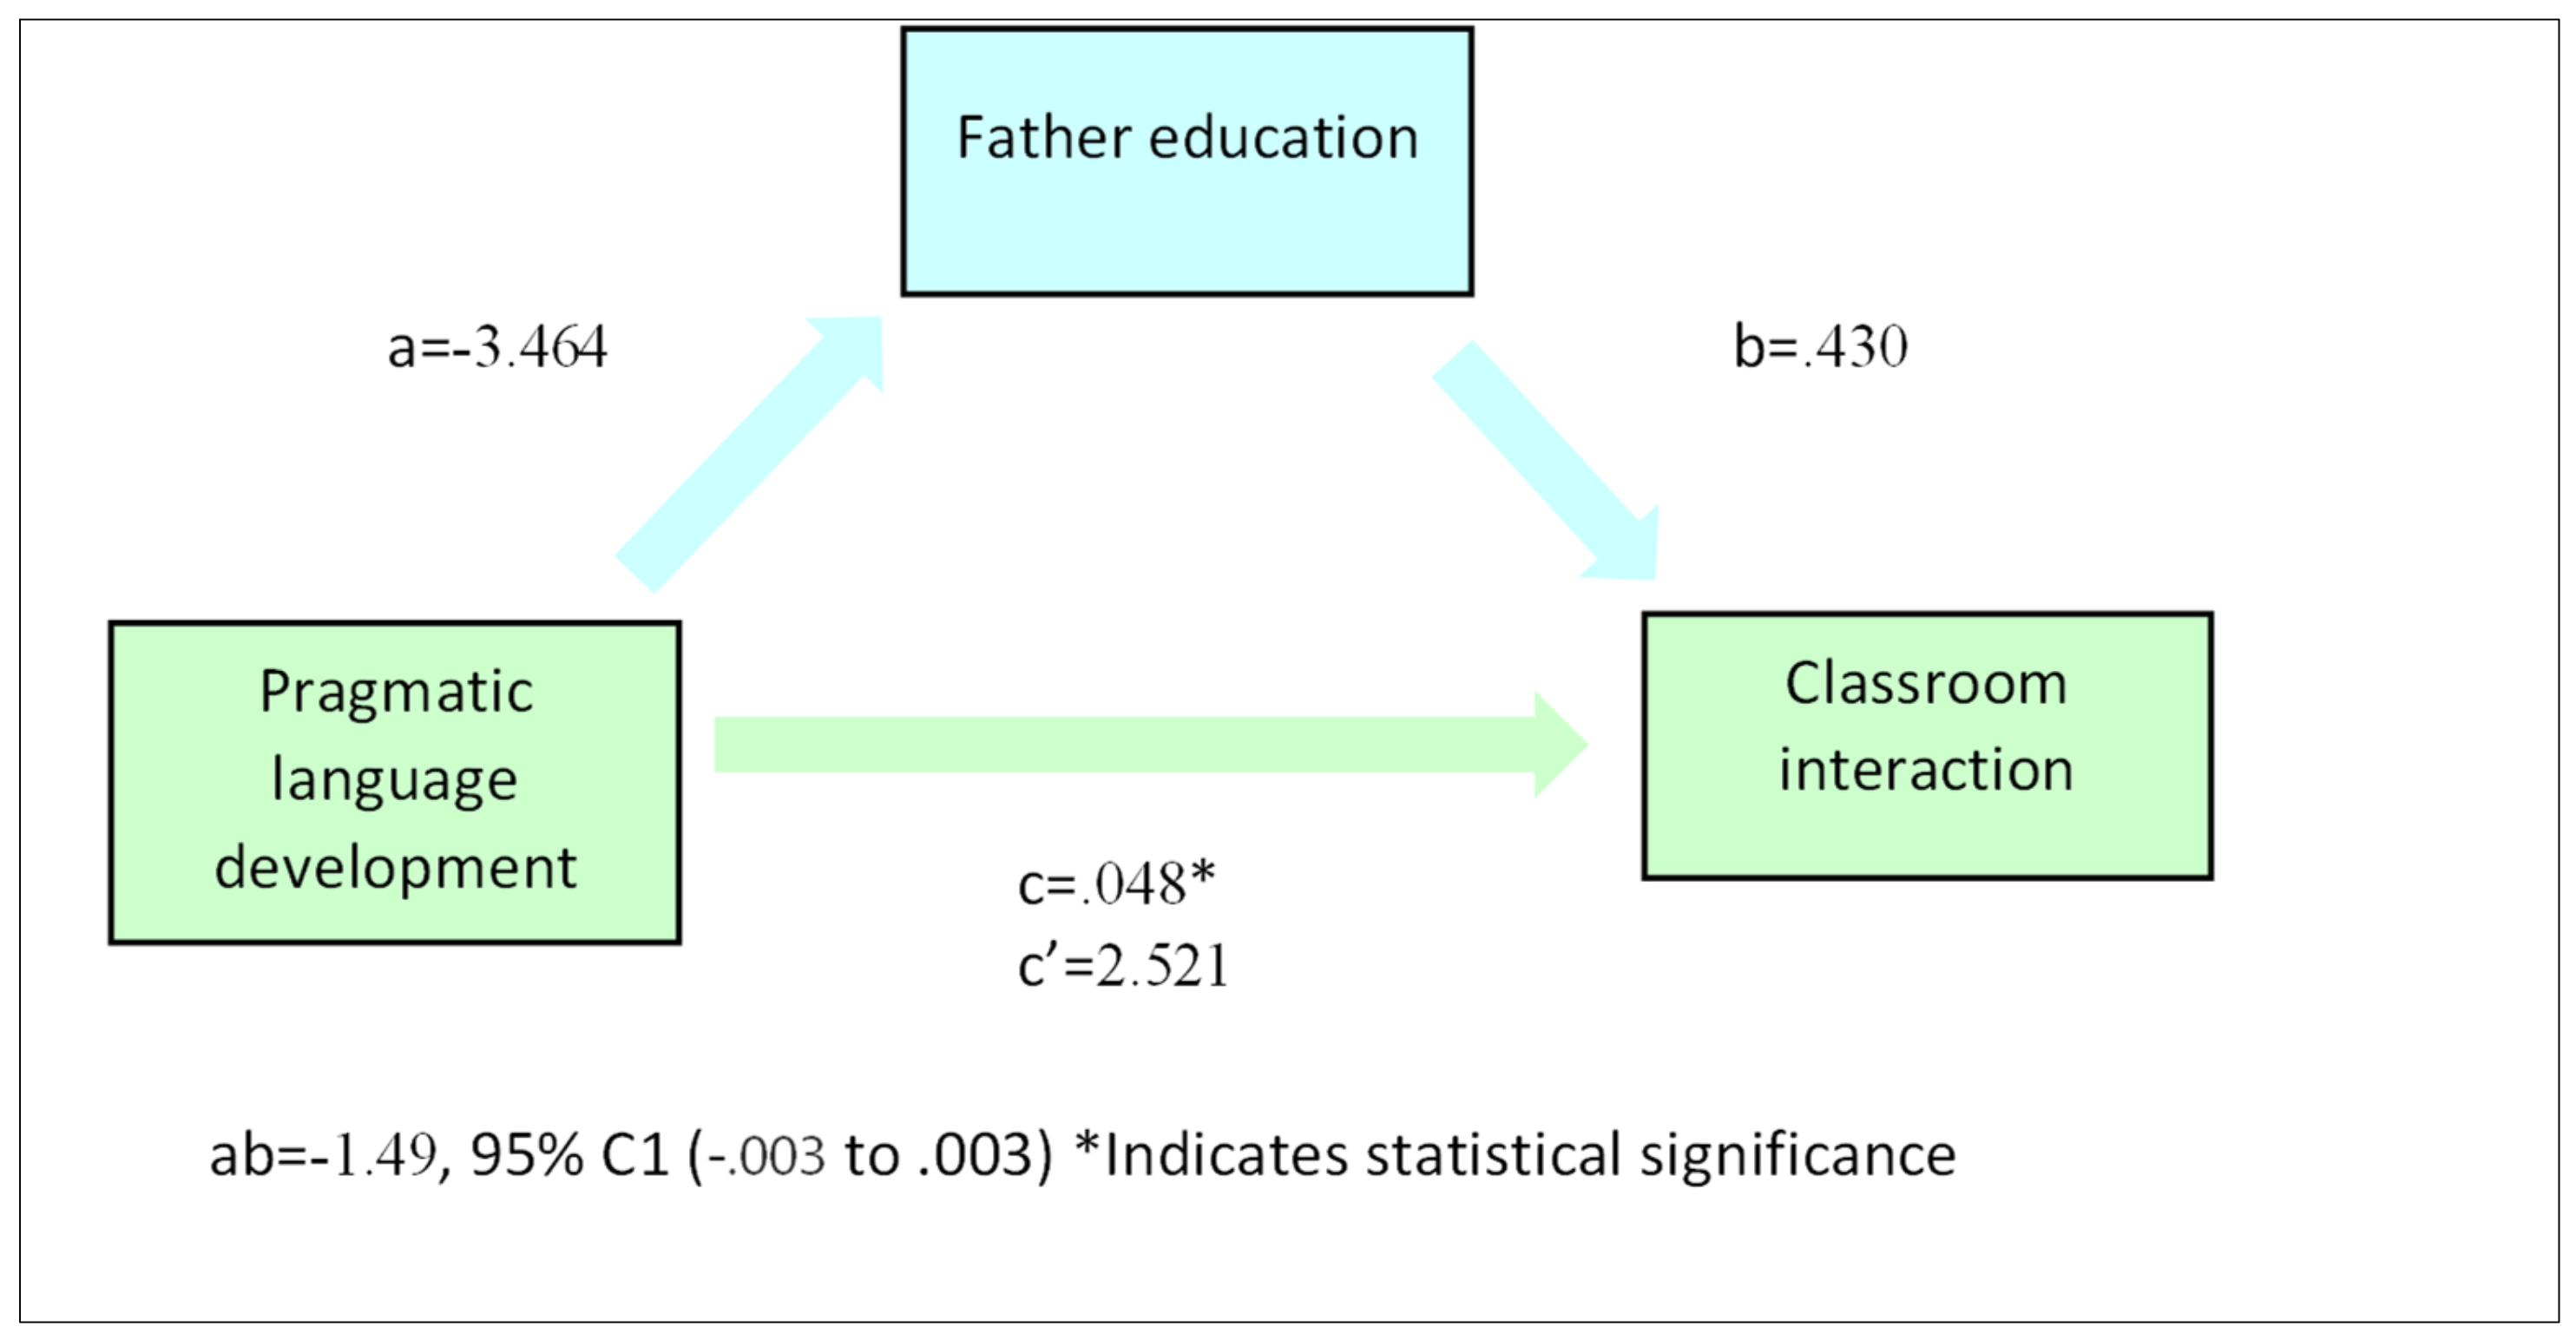
Figure 5.
Mediation Illustration for Classroom Interaction, PLD, and Father Education.
Figure 5.
Mediation Illustration for Classroom Interaction, PLD, and Father Education.
Figure 6.
Mediation Effect for Classroom Interaction, PLD, and Father Education.
Figure 6.
Mediation Effect for Classroom Interaction, PLD, and Father Education.
Figure 7.
Mediation Illustration for Classroom Interaction, PLD, and Mother Education.
Figure 7.
Mediation Illustration for Classroom Interaction, PLD, and Mother Education.
Figure 8.
Mediation Effect for Classroom Interaction, PLD, and Mother Education.
Figure 8.
Mediation Effect for Classroom Interaction, PLD, and Mother Education.
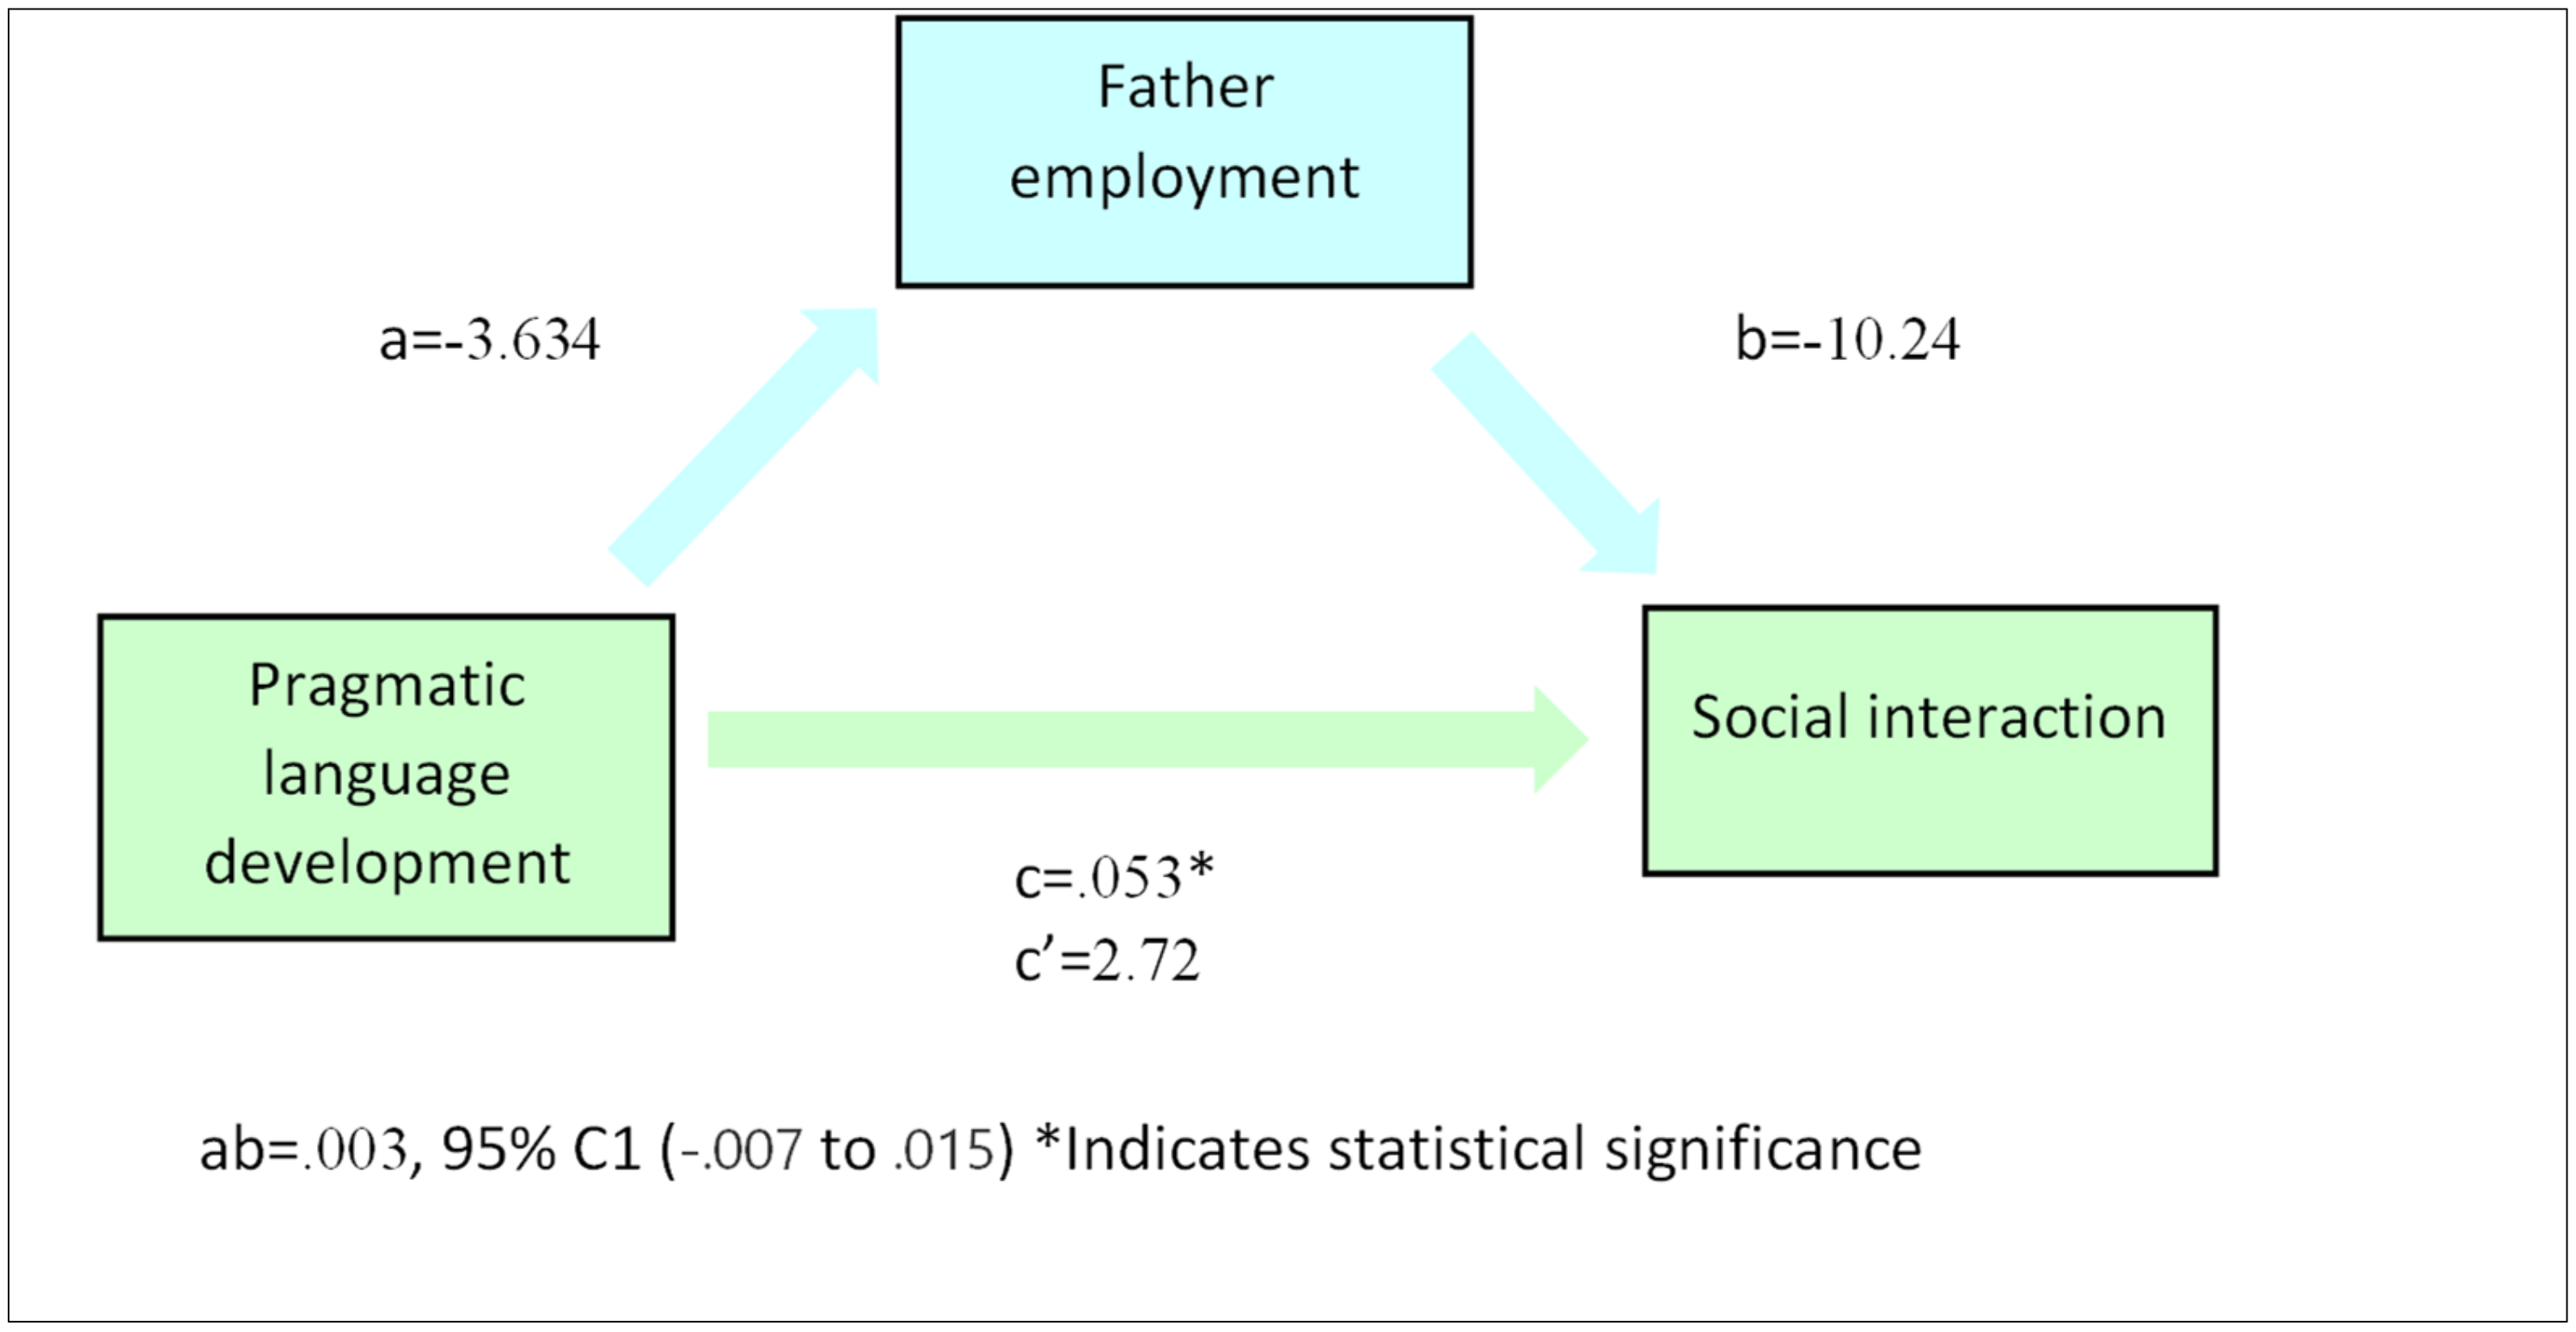
Figure 9.
Mediation Illustration for Social Interaction, PLD, and Father Employment.
Figure 9.
Mediation Illustration for Social Interaction, PLD, and Father Employment.
Figure 10.
Mediation Effect for Social Interaction, PLD, and Father Employment.
Figure 10.
Mediation Effect for Social Interaction, PLD, and Father Employment.
Figure 11.
Mediation Illustration for Social Interaction, PLD, and Mother Employment.
Figure 11.
Mediation Illustration for Social Interaction, PLD, and Mother Employment.
Figure 12.
Mediation Effect for Social Interaction, PLD, and Mother Employment.
Figure 12.
Mediation Effect for Social Interaction, PLD, and Mother Employment.
Figure 13.
Mediation Illustration for Social Interaction, PLD, and Father Education.
Figure 13.
Mediation Illustration for Social Interaction, PLD, and Father Education.
Figure 14.
Mediation Effect for Social Interaction, PLD, and Father Education.
Figure 14.
Mediation Effect for Social Interaction, PLD, and Father Education.
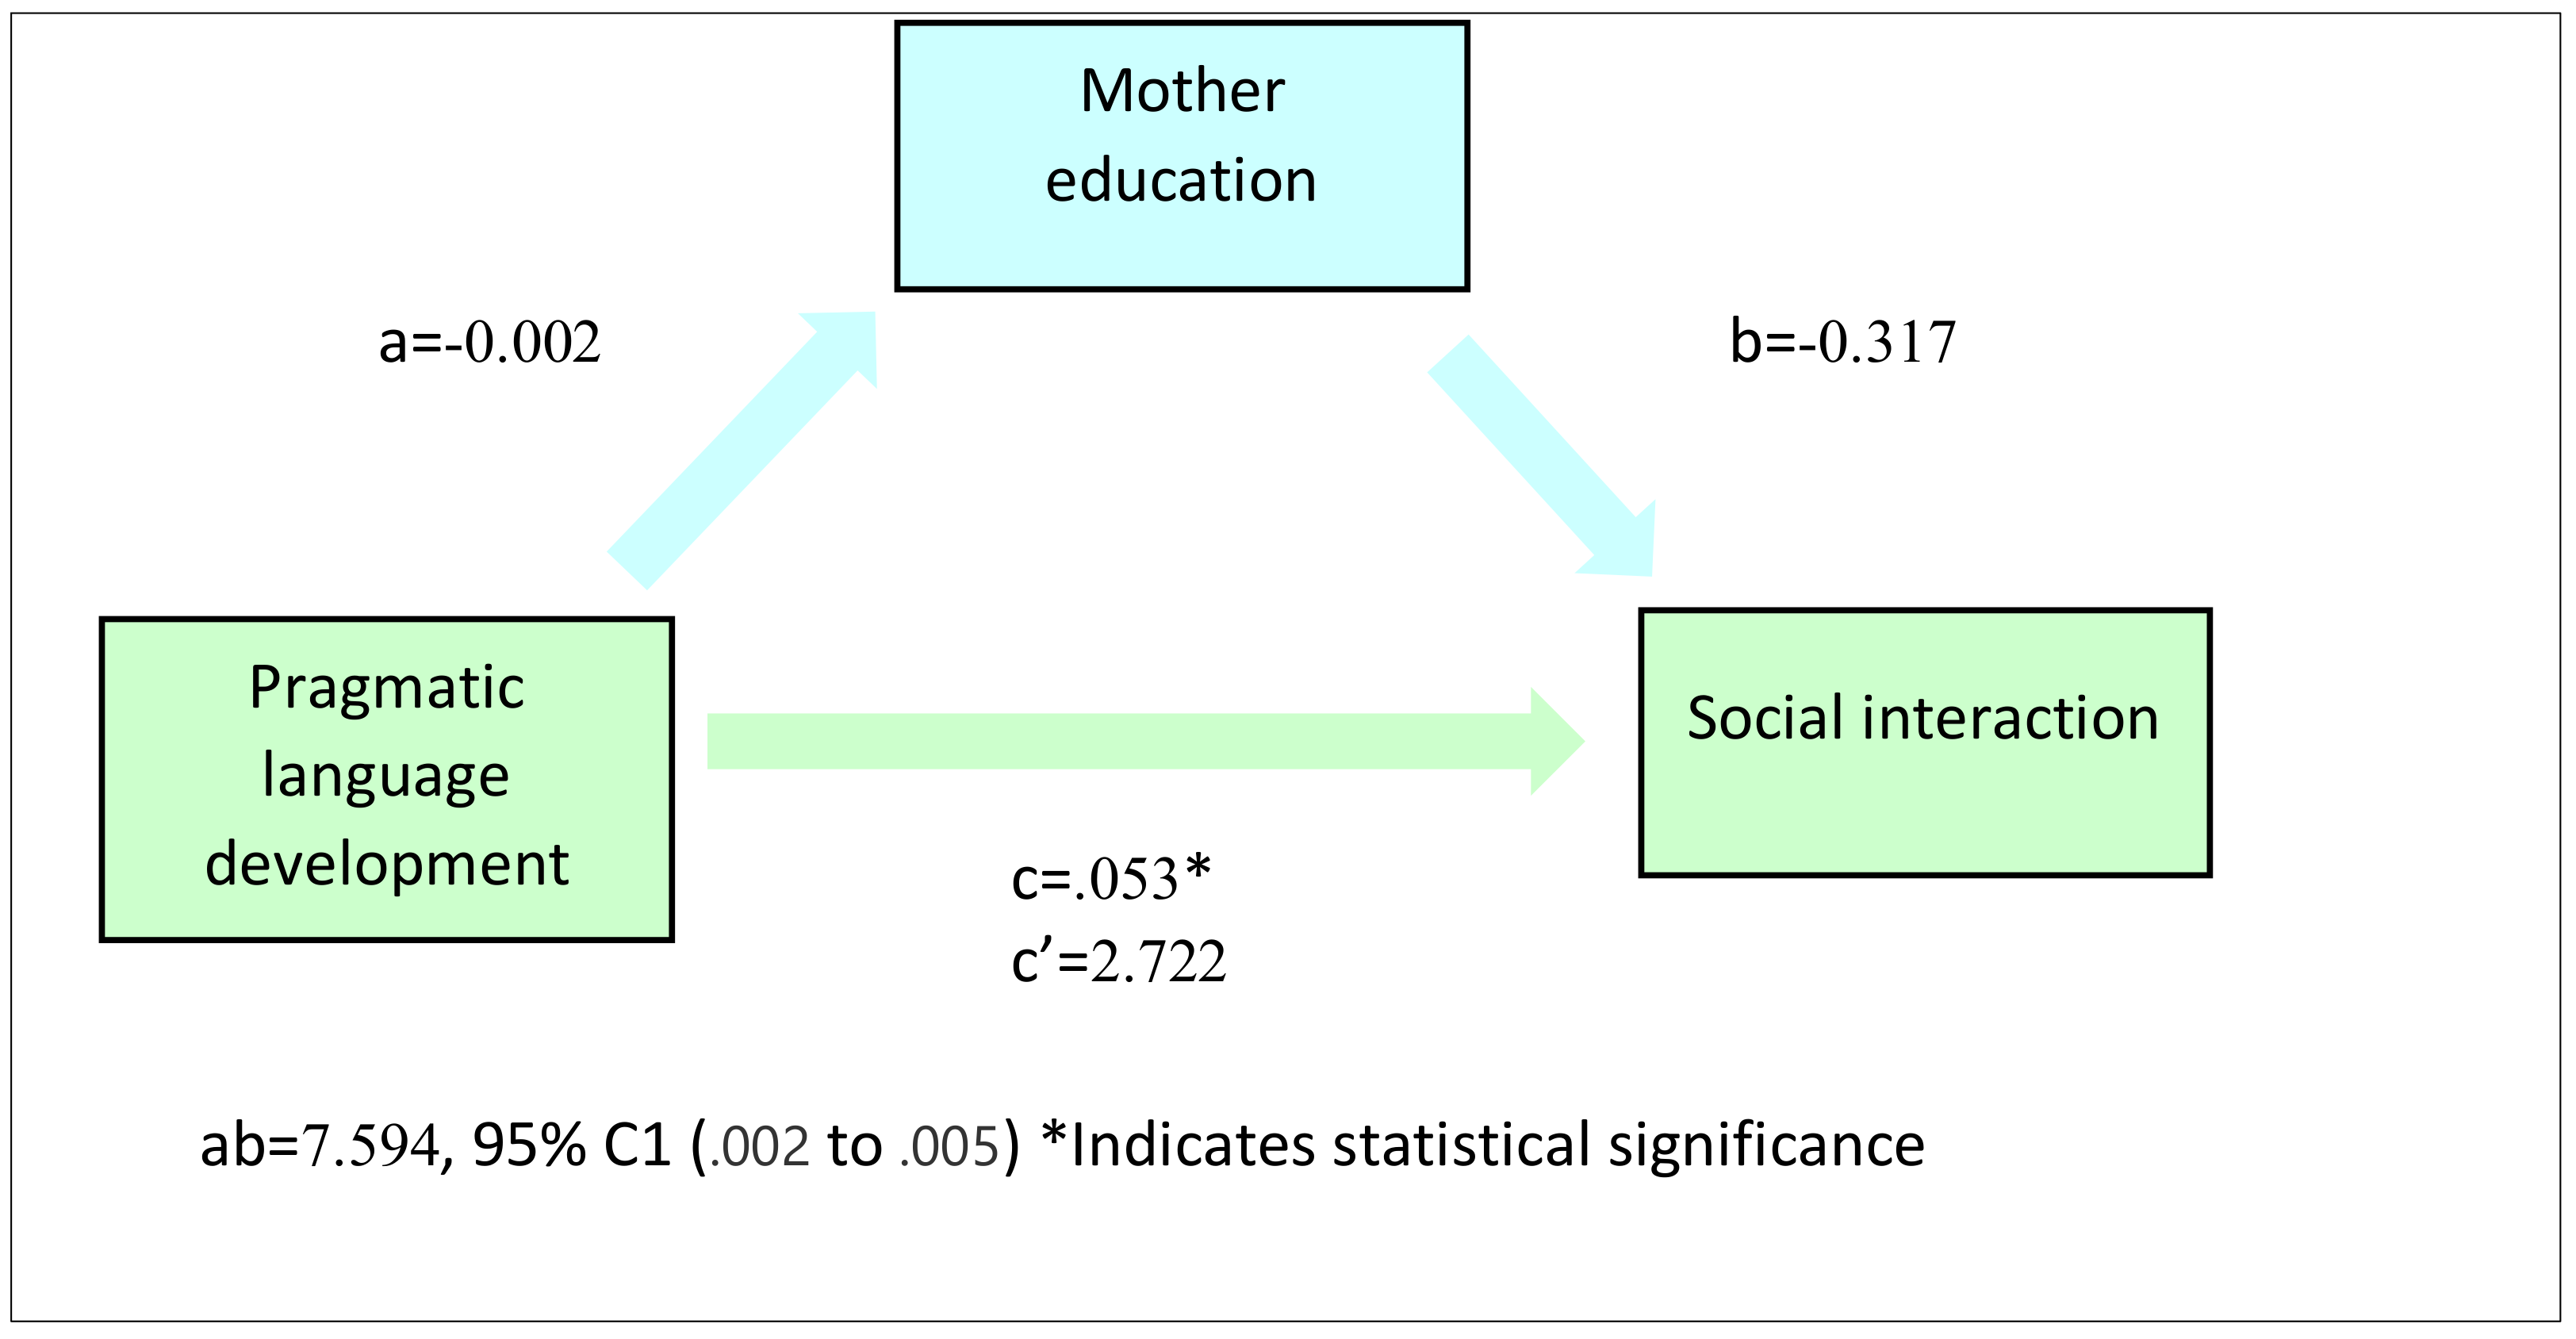
Figure 15.
Mediation Illustration for Social Interaction, PLD, and Mother Education.
Figure 15.
Mediation Illustration for Social Interaction, PLD, and Mother Education.
Figure 16.
Mediation Effect for Social Interaction, PLD, and Mother Education.
Figure 16.
Mediation Effect for Social Interaction, PLD, and Mother Education.
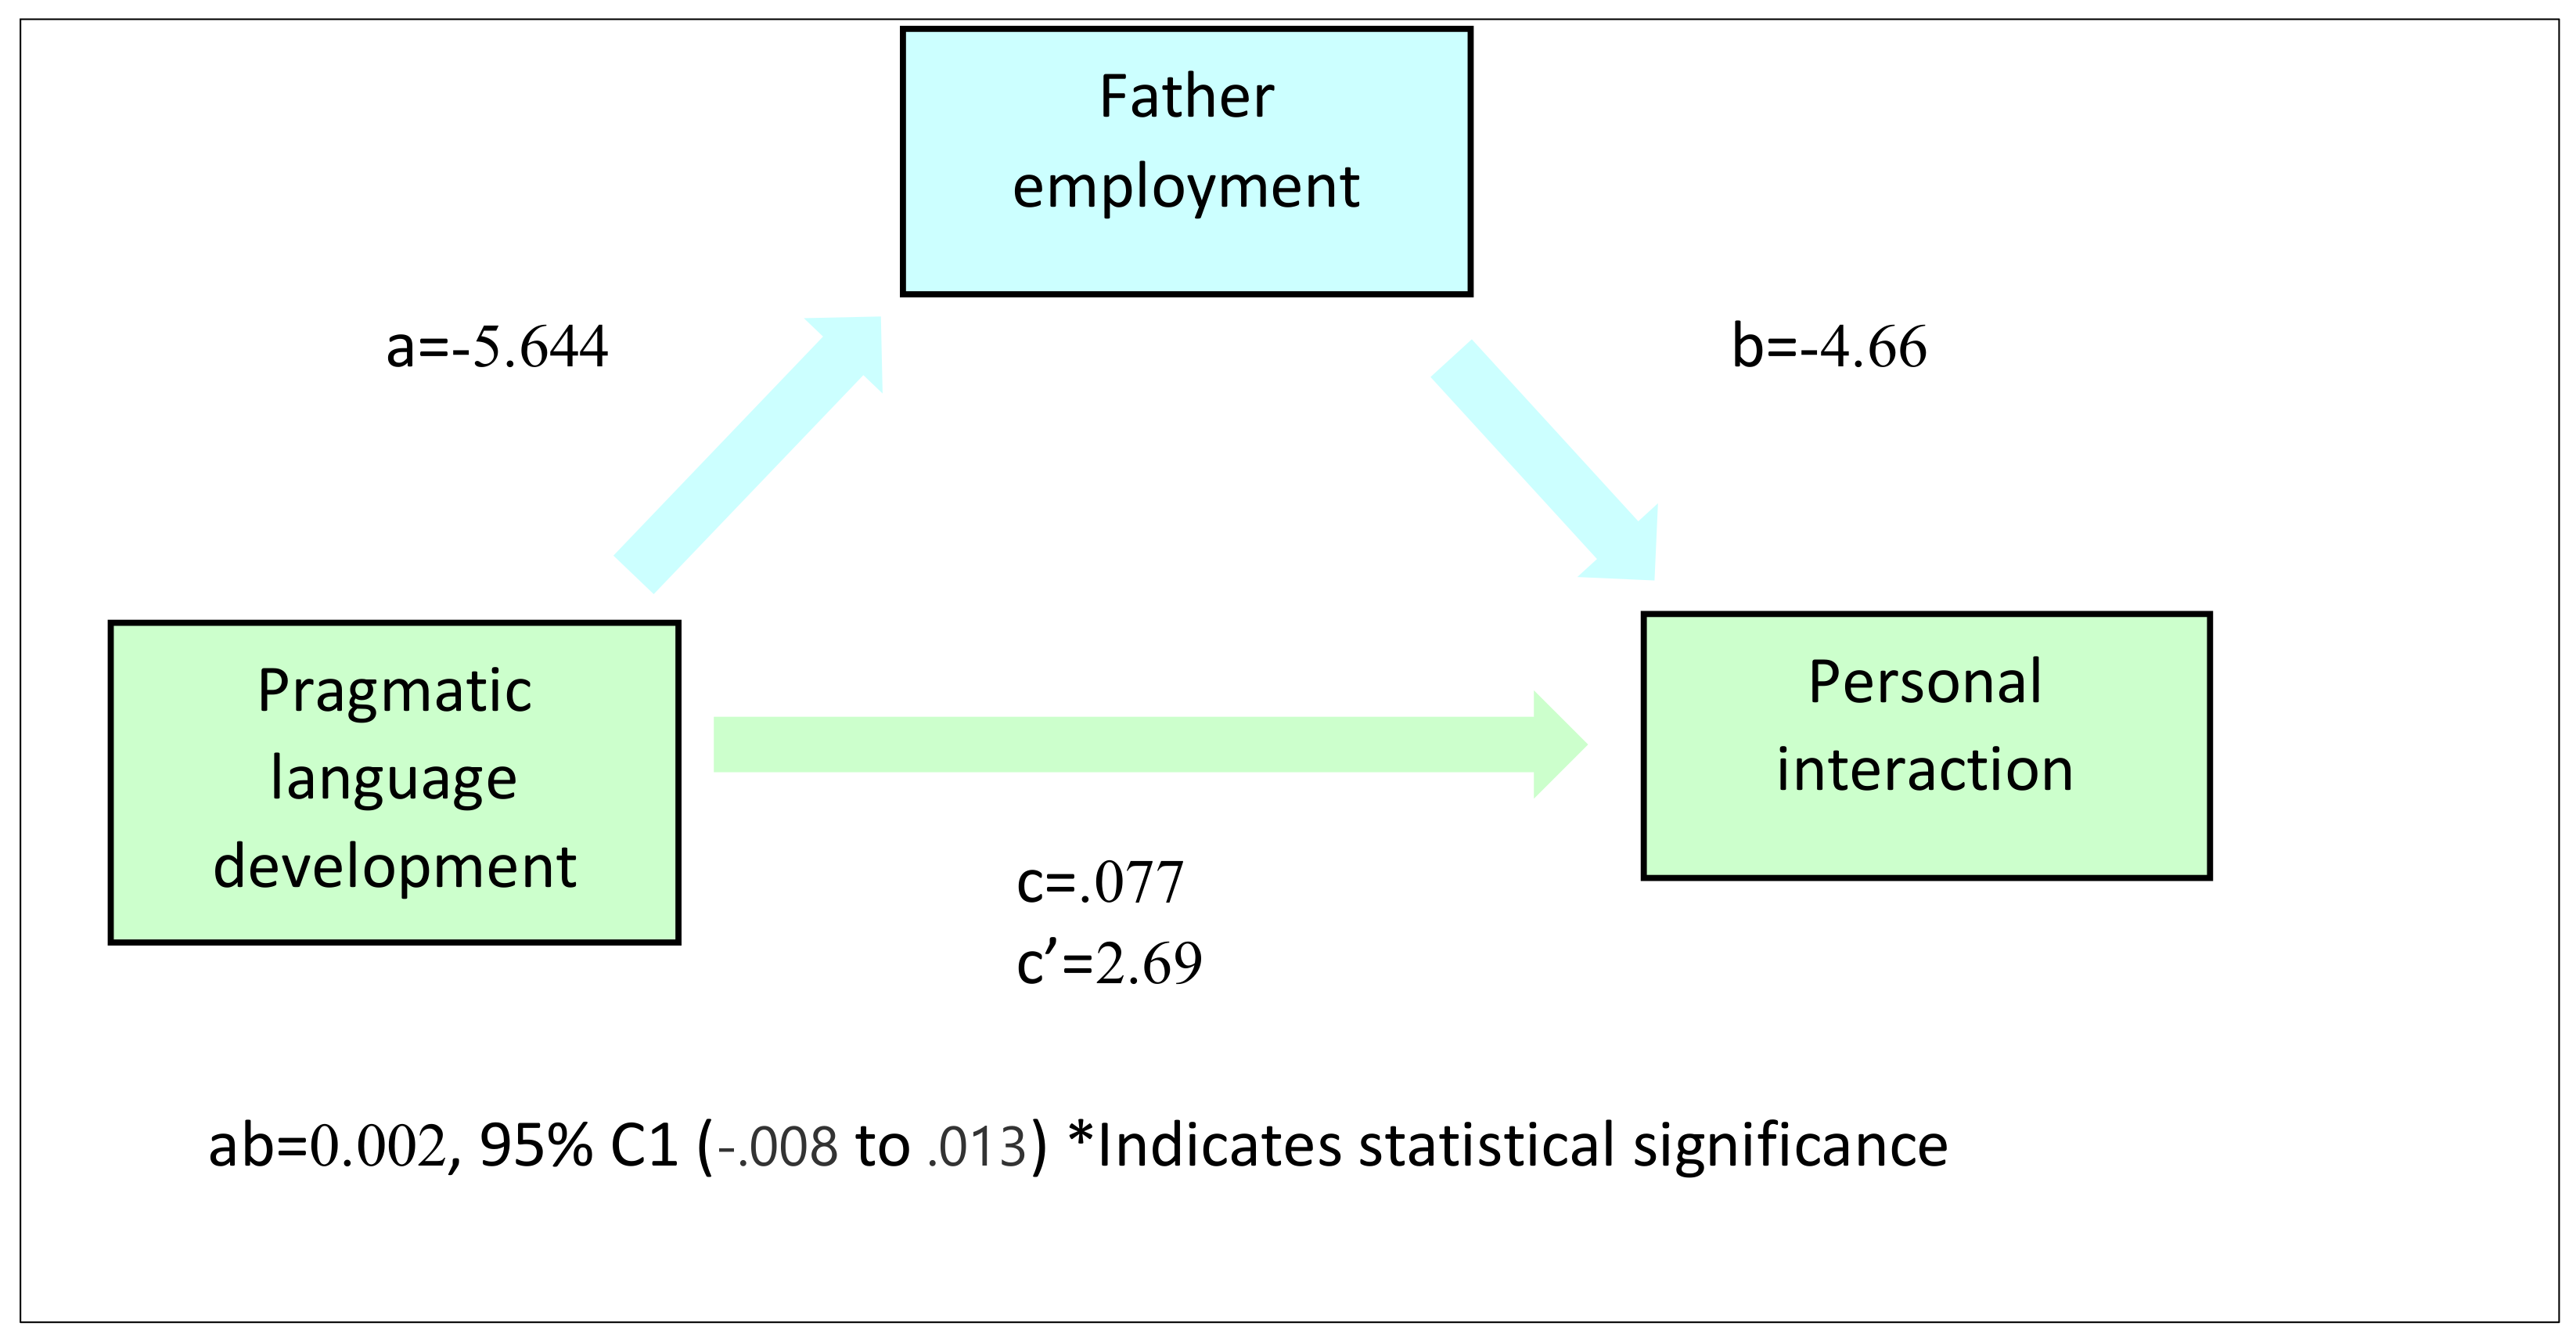
Figure 17.
Mediation Illustration for Personal Interaction, PLD, and Father Employment.
Figure 17.
Mediation Illustration for Personal Interaction, PLD, and Father Employment.
Figure 18.
Mediation Effect for Personal Interaction, PLD, and Father Employment.
Figure 18.
Mediation Effect for Personal Interaction, PLD, and Father Employment.
Figure 19.
Mediation Illustration for Personal Interaction, PLD, and Mother Employment.
Figure 19.
Mediation Illustration for Personal Interaction, PLD, and Mother Employment.
Figure 20.
Mediation Effect for Personal Interaction, PLD, and Mother Employment.
Figure 20.
Mediation Effect for Personal Interaction, PLD, and Mother Employment.
Figure 21.
Mediation Illustration for Personal Interaction, PLD, and Father Education.
Figure 21.
Mediation Illustration for Personal Interaction, PLD, and Father Education.
Figure 22.
Mediation Effect for Personal Interaction, PLD, and Father Education.
Figure 22.
Mediation Effect for Personal Interaction, PLD, and Father Education.
Figure 23.
Mediation Illustration for Personal Interaction, PLD, and Mother Education.
Figure 23.
Mediation Illustration for Personal Interaction, PLD, and Mother Education.
Figure 24.
Mediation Effect for Personal Interaction, PLD, and Mother Education.
Figure 24.
Mediation Effect for Personal Interaction, PLD, and Mother Education.
Figure 25.
Moderation Relationship Direction for Age, PLD, and Classroom Interaction.
Figure 25.
Moderation Relationship Direction for Age, PLD, and Classroom Interaction.
Figure 26.
Moderation Relationship Direction for Age, PLD, and Social Interaction.
Figure 26.
Moderation Relationship Direction for Age, PLD, and Social Interaction.
Figure 27.
Moderation Relationship Direction for Age, PLD, and Personal Interaction.
Figure 27.
Moderation Relationship Direction for Age, PLD, and Personal Interaction.
Figure 28.
Moderation Relationship Direction for Gender, PLD, and Classroom Interaction.
Figure 28.
Moderation Relationship Direction for Gender, PLD, and Classroom Interaction.
Figure 29.
Moderation Relationship Direction for Gender, PLD, and Social Interaction.
Figure 29.
Moderation Relationship Direction for Gender, PLD, and Social Interaction.
Figure 30.
Moderation Relationship Direction for Gender, PLD, and Personal Interaction.
Figure 30.
Moderation Relationship Direction for Gender, PLD, and Personal Interaction.
Figure 31.
Performance of Preschoolers with and without PLI in PLD.
Figure 31.
Performance of Preschoolers with and without PLI in PLD.
Table 1.
Respondents’ Characteristics.
Table 1.
Respondents’ Characteristics.
| | School Setting (N) | Clinical Setting (N) | % |
|---|
| Age Group | 237 | 27 | | |
| 4 | 14 | 15 | 6 | 55 |
| 5 | 19 | 8 | 8 | 30 |
| 6 | 56 | 40 | 24 | 150 |
| 7 | 148 | 0 | 62 | 0 |
| Gender Group | | | | |
| Female | 142 | 5 | 60 | 19 |
| Male | 95 | 22 | 40 | 81 |
| City Group | | | | |
| Riyadh | 158 | | 67 | |
| Eastern region | 18 | | 8 | |
| Jeddah | 14 | 27 | 6 | 100 |
| Khamis Mushait | 14 | | 6 | |
| Makkah | 10 | | 4 | |
| Other cities | 23 | | 9 | |
| Socioeconomic Status | | | | |
| Father employment | | | | |
| Employed | 227 | 23 | 96 | 85 |
| Unemployed | 10 | 4 | 4 | 15 |
| Mother employment | | | | |
| Employed | 127 | 2 | 54 | 7 |
| Unemployed | 110 | 25 | 46 | 93 |
| Father education | | | | |
| Middle school | 6 | 0 | 3 | 0 |
| Secondary school | 58 | 7 | 24 | 26 |
| Bachelor’s degree | 141 | 13 | 59 | 48 |
| Master’s degree | 17 | 4 | 7 | 15 |
| Doctorate | 15 | 3 | 6 | 11 |
| Mother education | | | | |
| Middle school | 15 | 1 | 6 | 4 |
| Secondary school | 44 | 7 | 19 | 26 |
| Bachelor’s degree | 150 | 16 | 63 | 59 |
| Master’s degree | 23 | 2 | 10 | 7 |
| Doctorate | 5 | 1 | 2 | 4 |
| Exceptionality Status | | | | |
| No exceptionality | 237 | 27 | NA | NA |
| Attention-deficit hyperactivity disorder | NA | 3 | 11 | NA |
| Hearing impairment | NA | 3 | 11 | NA |
| (Speech and) language delay | NA | 10 | 37 | NA |
| Childhood apraxia/dyslexia | NA | 5 | 18.5 | NA |
| Autism spectrum disorder | NA | 4 | 15 | NA |
| Developmental delay | NA | 1 | 3.5 | NA |
| Down’s syndrome | NA | 1 | 3.5 | NA |
Table 2.
Mediation Analysis for Classroom Interaction, PLD, and Father Employment.
Table 2.
Mediation Analysis for Classroom Interaction, PLD, and Father Employment.
| Effect and Path | Label | Estimate | SE | Z | p | Mediation % |
|---|
| Indirect | a × b | −0.00438 | 0.00533 | 0.00533 | −0.822 | 0.173 |
| Direct | c | 2.52518 | 0.04824 | 0.04824 | 52.349 | 99.827 |
| Total | c + a × b | 2.52080 | 0.04812 | 0.04812 | 52.389 | 100.000 |
| CI→FE | a | −7.43−4 | 4.914 | −1.513 | 0.130 | |
| FE→PLD | b | 5.90 | 6.0221 | 0.980 | 0.327 | |
| CI→PLD | c | 2.53 | 0.0482 | 52.349 | <0 .001 | |
Table 3.
Mediation Analysis for Classroom Interaction, PLD, and Mother Employment.
Table 3.
Mediation Analysis for Classroom Interaction, PLD, and Mother Employment.
| Effect and Path | Label | Estimate | SE | Z | p | Mediation % |
|---|
| Indirect | a × b | 0.0267 | 0.0169 | 1.58 | 0.115 | 1.06 |
| Direct | c | 2.4941 | 0.0505 | 49.35 | <0.001 | 98.94 |
| Total | c + a × b | 2.5208 | 0.0481 | 52.39 | <0.001 | 100.00 |
| CI→ME | a | −0.00573 | 0.00104 | −5.50 | <0.001 | |
| ME→PLD | b | −4.65852 | 2.82874 | −1.65 | 0.100 | |
| CI→PLD | c | 2.49410 | 0.05054 | 49.35 | <0.001 | |
Table 4.
Mediation Analysis for Classroom Interaction, PLD, and Father Education.
Table 4.
Mediation Analysis for Classroom Interaction, PLD, and Father Education.
| Effect and Path | Label | Estimate | SE | Z | p | Mediation % |
|---|
| Indirect | a × b | −1.494 | 0.00163 | −0.0912 | 0.927 | 0.00590 |
| Direct | c | 2.52 | 0.04809 | 52.4206 | <0.001 | 99.99410 |
| Total | c + a × b | 2.52 | 0.04812 | 52.3891 | <0.001 | 100.00000 |
| CI→FED | a | −3.464 | 0.00374 | −0.0925 | 0.926 | |
| FED→PLD | b | 0.430 | 0.79127 | 0.5431 | 0.587 | |
| CI→PLD | c | 2.521 | 0.04809 | 52.4206 | <0.001 | |
Table 5.
Mediation Analysis for Classroom Interaction, PLD, and Mother Education.
Table 5.
Mediation Analysis for Classroom Interaction, PLD, and Mother Education.
| Effect and Path | Label | Estimate | SE | Z | p | Mediation % |
|---|
| Indirect | a × b | 0.00117 | 0.00284 | 0.410 | 0.681 | 0.0463 |
| Direct | c | 2.51963 | 0.04807 | 52.413 | <0.001 | 99.9537 |
| Total | c + a × b | 2.52080 | 0.04812 | 52.389 | <0.001 | 100.0000 |
| CI→MED | a | −0.00169 | 0.00360 | −0.471 | 0.638 | |
| MED→PLD | b | −0.68910 | 0.82204 | −0.838 | 0.402 | |
| CI→PLD | c | 2.51963 | 0.04807 | 52.413 | <0.001 | |
Table 6.
Mediation Analysis for Social Interaction, PLD, and Father Employment.
Table 6.
Mediation Analysis for Social Interaction, PLD, and Father Employment.
| Effect and Path | Label | Estimate | SE | Z | p | Mediation % |
|---|
| Indirect | a × b | 0.00371 | 0.00590 | 0.629 | 0.529 | 0.136 |
| Direct | c | 2.71935 | 0.05342 | 50.901 | <0.001 | 99.864 |
| Total | c + a × b | 2.72306 | 0.05366 | 50.750 | <0.001 | 100.000 |
| SI→FE | a | −3.634 | 0.00360 | −0.680 | 0.497 | |
| FE→PLD | b | −10.24 | 0.82204 | −1.662 | 0.096 | |
| SI→PLD | c | 2.72 | 0.04807 | 50.901 | <0.001 | |
Table 7.
Mediation Analysis for Social Interaction, PLD, and Mother Employment.
Table 7.
Mediation Analysis for Social Interaction, PLD, and Mother Employment.
| Effect and Path | Label | Estimate | SE | Z | p | Mediation % |
|---|
| Indirect | a × b | 0.0181 | 0.0192 | 0.944 | 0.345 | 0.666 |
| Direct | c | 2.7049 | 0.0568 | 47.606 | <0.001 | 99.334 |
| Total | c + a × b | 2.7231 | 0.0537 | 50.750 | <0.001 | 100.000 |
| SI→ME | a | −0.00646 | 0.00112 | −5.751 | <0.001 | |
| ME→PLD | b | −2.80951 | 2.93540 | −0.957 | 0.339 | |
| SI→PD | c | 2.70491 | 0.05682 | 47.606 | <0.001 | |
Table 8.
Mediation Analysis for Social Interaction, PLD, and Father Education.
Table 8.
Mediation Analysis for Social Interaction, PLD, and Father Education.
| Effect and Path | Label | Estimate | SE | Z | p | Mediation % |
|---|
| Indirect | a × b | −0.00331 | 0.00582 | −0.570 | 0.569 | 0.121 |
| Direct | c | 2.72637 | 0.05341 | 51.042 | <0.001 | 99.879 |
| Total | c + a × b | 2.72306 | 0.05366 | 50.750 | <0.001 | 100.000 |
| SI→FED | a | 0.00245 | 0.00405 | 0.606 | 0.544 | |
| FED→PLD | b | −1.35031 | 0.81124 | −1.664 | 0.096 | |
| SI→PLD | c | 2.72637 | 0.05341 | 51.042 | <0.001 | |
Table 9.
Mediation Analysis for Social Interaction, PLD, and Mother Education.
Table 9.
Mediation Analysis for Social Interaction, PLD, and Mother Education.
| Effect and Path | Label | Estimate | SE | Z | p | Mediation % |
|---|
| Indirect | a × b | 7.594 | 0.00237 | 0.320 | 0.749 | 0.0279 |
| Direct | c | 2.72 | 0.05368 | 50.714 | <0.001 | 99.9721 |
| Total | c + a × b | 2.72 | 0.05366 | 50.750 | <0.001 | 100.0000 |
| SI→MED | a | −0.00239 | 0.00390 | −0.613 | 0.540 | |
| MED→PLD | b | −0.31777 | 0.84730 | −0.375 | 0.708 | |
| SI→PLD | c | 2.72230 | 0.05368 | 50.714 | <0.001 | |
Table 10.
Mediation Analysis for Personal Interaction, PLD, and Father Employment.
Table 10.
Mediation Analysis for Personal Interaction, PLD, and Father Employment.
| Effect and Path | Label | Estimate | SE | Z | p | Mediation % |
|---|
| Indirect | a × b | 0.00263 | 0.00549 | 0.479 | 0.632 | 0.0977 |
| Direct | c | 2.69042 | 0.07739 | 34.765 | <0.001 | 99.9023 |
| Total | c + a × b | 2.69305 | 0.07728 | 34.848 | <0.001 | 100.0000 |
| PI→FE | a | −5.644 | 5.544 | −1.019 | 0.308 | |
| FE→PLD | b | −4.66 | 8.5814 | −0.543 | 0.587 | |
| PI→PLD | c | 2.69 | 0.0774 | 34.765 | <0.001 | |
Table 11.
Mediation Analysis for Personal Interaction, PLD, and Mother Employment.
Table 11.
Mediation Analysis for Personal Interaction, PLD, and Mother Employment.
| Effect and Path | Label | Estimate | SE | Z | p | Mediation % |
|---|
| Indirect | a × b | 0.0695 | 0.0268 | 2.59 | 0.010 | 2.58 |
| Direct | c | 2.6235 | 0.0793 | 33.10 | <0.001 | 97.42 |
| Total | c + a × b | 2.6930 | 0.0773 | 34.85 | <0.001 | 100.00 |
| PI→ME | a | −0.00576 | 0.00119 | −4.86 | <0.001 | |
| ME→PLD | b | −12.06322 | 3.94050 | −3.06 | 0.002 | |
| PI→PLD | c | 2.62352 | 0.07927 | 33.10 | <0.001 | |
Table 12.
Mediation Analysis for Personal Interaction, PLD, and Father Education.
Table 12.
Mediation Analysis for Personal Interaction, PLD, and Father Education.
| Effect and Path | Label | Estimate | SE | Z | p | Mediation % |
|---|
| Indirect | a × b | −0.00124 | 0.00424 | −0.291 | 0.771 | 0.0458 |
| Direct | c | 2.69428 | 0.07719 | 34.904 | <0.001 | 99.9542 |
| Total | c + a × b | 2.69305 | 0.07728 | 34.848 | <0.001 | 100.0000 |
| PI→FED | a | −0.00131 | 0.00421 | −0.310 | 0.756 | |
| FED→PLD | b | 0.94536 | 1.12810 | 0.838 | 0.402 | |
| PI→PLD | c | 2.69428 | 0.07719 | 34.904 | < .001 | |
Table 13.
Mediation Analysis for Personal Interaction, PLD, and Mother Education.
Table 13.
Mediation Analysis for Personal Interaction, PLD, and Mother Education.
| Effect and Path | Label | Estimate | SE | Z | p | Mediation % |
|---|
| Indirect | a × b | −0.00127 | 0.00454 | −0.279 | 0.780 | 0.0470 |
| Direct | c | 2.69432 | 0.07739 | 34.816 | <0.001 | 99.9530 |
| Total | c + a × b | 2.69305 | 0.07728 | 34.848 | <0.001 | 100.0000 |
| PI→MED | a | −0.00367 | 0.00405 | −0.907 | 0.364 | |
| MED→PLD | b | 0.34488 | 1.17539 | 0.293 | 0.769 | |
| PI→PLD | c | 2.69432 | 0.07739 | 34.816 | <0.001 | |
Table 14.
Moderation Analysis for Age, Gender, and Pragmatic Language Development.
Table 14.
Moderation Analysis for Age, Gender, and Pragmatic Language Development.
| Moderation | Estimate | SE | Z | p | Slope | Estimate | SE | Z | p |
|---|
| Classroom interaction | 2.451 | 0.0514 | 47.676 | <0.001 | Average | 2.45 | 0.0523 | 46.9 | <0.001 |
| Age in years | −0.284 | 1.2868 | −0.221 | 0.825 | Low (−1 SD) | 2.61 | 0.0534 | 48.8 | <0.001 |
| Classroom interaction * Age in years | −0.151 | 0.0423 | −3.578 | <0.001 | High (+1 SD) | 2.30 | 0.0803 | 28.6 | <0.001 |
| Classroom interaction * Gender |
| Classroom interaction | 2.498 | 0.0481 | 51.88 | <0.001 | Average | 2.50 | 0.0483 | 51.7 | <0.001 |
| Gender | −5.310 | 2.6804 | −1.98 | 0.048 | Low (−1 SD) | 2.43 | 0.0729 | 33.3 | <0.001 |
| Classroom interaction * Gender | 0.133 | 0.0961 | 1.39 | 0.166 | High (+1 SD) | 2.56 | 0.0627 | 40.9 | <0.001 |
| Social interaction * Age in years |
| Social interaction | 2.683 | 0.0586 | 45.82 | <0.001 | Average | 2.68 | 0.0593 | 45.2 | <0.001 |
| Age in years | −2.364 | 1.3320 | −1.77 | 0.076 | Low (−1 SD) | 2.84 | 0.0585 | 48.5 | <0.001 |
| Social interaction * Age in years | −0.150 | 0.0468 | −3.20 | 0.001 | High (+1 SD) | 2.53 | 0.0911 | 27.8 | <0.001 |
| Social interaction * Gender |
| Social interaction | 2.740 | 0.0550 | 49.834 | <0.001 | Average | 2.74 | 0.0552 | 49.6 | <0.001 |
| Gender | −0.646 | 2.7776 | −0.232 | 0.816 | Low (−1 SD) | 2.82 | 0.0861 | 32.8 | <0.001 |
| Social interaction * Gender | −0.161 | 0.1092 | −1.477 | 0.140 | High (+1 SD) | 2.66 | 0.0678 | 39.2 | <0.001 |
| Personal interaction * Age in years |
| Personal interaction | 2.476 | 0.0763 | 32.44 | <0.001 | Average | 2.48 | 0.0775 | 32.0 | <0.001 |
| Age in years | 9.726 | 1.7211 | 5.65 | <0.001 | Low (−1 SD) | 2.69 | 0.0806 | 33.4 | <0.001 |
| Personal interaction * Age in years | −0.211 | 0.0618 | −3.42 | <0.001 | High (+1 SD) | 2.26 | 0.1170 | 19.3 | <0.001 |
| Personal interaction * Gender |
| Personal interaction | 2.676 | 0.0783 | 34.194 | <0.001 | Average | 2.68 | 0.0783 | 34.2 | <0.001 |
| Gender | −2.634 | 3.8591 | −0.682 | 0.495 | Low (−1 SD) | 2.62 | 0.1193 | 22.0 | <0.001 |
| Personal interaction * Gender | 0.104 | 0.1565 | 0.664 | 0.507 | High (+1 SD) | 2.73 | 0.1007 | 27.1 | <0.001 |
Table 15.
Comparison of PLD in preschoolers with and without PLI.
Table 15.
Comparison of PLD in preschoolers with and without PLI.
| Variables | N | Mean | SD | Min. | Max. | SE | p |
|---|
| Age in years—S | 237 | 6.43 | 0.873 | 4 | 7 | | |
| Age in years—C | 27 | 4.59 | 0.747 | 4 | 6 | | |
| Classroom interaction—S | | 104.32 | 22.346 | 30 | 135 | 1.4515 | <0.001 |
| Classroom interaction—C | | 49.81 | 25.391 | 15 | 112 | 4.8865 | <0.001 |
| Standard score CI—S | | 12.97 | 2.750 | 3 | 17 | 0.1786 | <0.001 |
| Standard score CI—C | | 6.93 | 2.999 | 2 | 14 | 0.5772 | <0.001 |
| Social interaction—S | | 108.02 | 21.166 | 36 | 135 | 1.3749 | <0.001 |
| Social interaction—C | | 62.33 | 27.554 | 17 | 120 | 5.3028 | <0.001 |
| Standard score SI—S | | 12.47 | 2.716 | 5 | 17 | 0.1764 | <0.001 |
| Standard score SI—C | | 7.63 | 3.224 | 1 | 15 | 0.6205 | <0.001 |
| Personal interaction—S | | 102.64 | 21.219 | 24 | 135 | 1.3783 | <0.001 |
| Personal interaction—C | | 64.30 | 28.510 | 26 | 122 | 5.4868 | <0.001 |
| Standard score PI—S | | 12.42 | 3.008 | 2 | 18 | 0.1954 | <0.001 |
| Standard score PI—C | | 7.48 | 3.945 | 1 | 16 | 0.7593 | <0.001 |
| Standard score sum—S | | 37.86 | 7.702 | 10 | 52 | 0.5003 | <0.001 |
| Standard score sum—C | | 22.04 | 9.630 | 4 | 45 | 1.8532 | <0.001 |
| Pragmatic Language Development—S | | 314.98 | 58.863 | 118 | 405 | 3.8236 | <0.001 |
| Pragmatic Language Development—C | | 176.44 | 77.560 | 58 | 348 | 14.9264 | <0.001 |
| Pragmatic Language Index—S | | 113.42 | 13.064 | 66 | 137 | 0.8486 | <0.001 |
| Pragmatic Language Index—C | | 86.26 | 16.564 | 56 | 125 | 3.1877 | <0.001 |


