
Drilling Process of GFRP Composites: Modeling and Optimization Using Hybrid ANN


Mechanical Engineering Department, King Abdulaziz University, Jeddah 22254, Saudi Arabia
Sustainability 2022, 14(11), 6599; https://doi.org/10.3390/su14116599
Submission received: 5 May 2022
/
Revised: 21 May 2022
/
Accepted: 24 May 2022
/
Published: 27 May 2022
Abstract
:This paper aims to optimize the machining parameters of the drilling process of woven-glass-fiber reinforced epoxy (WGFRE) composites. It will focus on modeling and optimizing drill spindle speed and feed with different laminate thicknesses, with respect to torque and delamination factor. The response surface analysis and artificial neural networks are utilized to model and evaluate the effect of control parameters and their interaction on the drilling process outcomes. The particle swarm optimization algorithm is used to improve the ANN training, to increase its performance in prediction. The optimization method of desirability, based on RSM, is applied to validate the optimal combination of control factors, in the space of the study. The influences of the control parameters on the drilling process outcomes are discussed in detail. The optimal machining parameters were 0.025 mm/r and 1600 rpm for feed and spindle speed, respectively, with a GFRE laminate of 5.4 mm thickness. The RSM and ANN–PSO models applied to predict the drilling-process parameters showed a very high agreement with the experimental data.
1. Introduction
Nowadays, fiber-reinforced polymer (FRP) composite laminates attract a lot of importance in the industry, due to their competed characteristics, which are opposite to those of other conventional materials. It is included in many uses, such as structural parts in aircraft, automobiles, marine vehicles, and railways [1,2].
The drilling in fiber-reinforced composites is a crucial machining operation because their laminates are usually assembled by bolted joints or through any connection type. The quality of the drilled hole, such as wall-surface finishing, represented in waviness/roughness, straightness, and the circularity of the hole, is critical, especially with the strict dimension tolerances in advanced applications [3]. The quality characteristics, such as the wall-surface finish, represented by roughness/waviness, straightness, and the roundness of the hole, can cause high stresses on the nails, causing them to fail [4].
Much research has investigated the influence of drilling parameters, such as feed, spindle speed, drill diameter, and tool geometry, on machinability properties, such as thrust force, torque, generated temperature, and delamination damage, in fiber-reinforced polymer composites, for example, GFRP [5] and CFRP [2].
Recently, many statistical experimental design methods are used in different industries, for optimization of process parameters. Design of experiments (DOE) is an efficient systematic method that can be used to determine the relationship between the control factors affecting a process and the outcome of that process, which could help in the optimization of experimental parameters and provide statistical models [6]. DOE methods have been used, extensively, in investigating the significance of manufacturing process conditions on the process outputs, such as forming operations output [7], yield of chemical processing [8], assembled product performance during production [9], and quality of machined surfaces [10]. The Taguchi method was used to find the optimal process variables for the extrusion of Al 6061 alloy [11]. Nezadi, M. et al. [12] demonstrated that the Taguchi method was, successfully, applied to the optimization of electrospinning conditions for thermoplastic polyurethane nanofibers. The Box–Behnken design was used to determine the optimal conditions of the reductive leaching process of MnO2 from manganese mine tailings [13]. Response surface methodology (RSM) was used to characterize the influential parameters on the flotation behavior of a sulfurized mixed copper ore [14] and to optimize the grinding process parameters of phosphate ore, to minimize the slimes during production [15].
Flores, V. et al. [16] employed ANNs to build a predictive model for copper recovery in leaching piles. Much research has coupled neural networks with the design of experiments, for developing prediction models [9,17,18]. ANNs were utilized, to evaluate the influence of the cutting parameters in drilling operations, such as jute-fiber-reinforced epoxy on the delamination factor [19]. Adda et al. [20] applied the RSM and ANNs for validation of the results obtained experimentally as well as for predicting the composite structure behavior depending on the machining parameters. The prediction capability of both RSM and Multilayer Perception NNs, supported by the genetic algorithm, was compared with respect to thrust force and torque in the drilling process [21].
Traditionally, as an objective function of manufacturing process optimization, maximizing productivity or reducing manufacturing cost is the usual goal, subject to meeting quality requirements. To date, in several studies, the drilling process of FRP composite materials has been investigated, to study the interactions between the machining parameters, cutting tool types, and the work material, aiming to identify the most influential factors to obtain the optimal process outcomes [18,20,22,23,24,25,26].
The prediction of the drilling process outcomes of GFRP, such as drilling torque, power consumption, and produced delamination, is a critical issue that should be exanimated for enhancing the sustainability of the manufacturing processes and products. However, little work on drilling GFRP composites has been reported in the literature.
While the use of analytical and numerical modeling techniques is, now, routine in many areas of design and analytics, it suffers from many limitations, such as model complexity, more simplification assumptions, constraints of plasticity theories, the non-homogeneous nature of FRP composites, and high computational cost. The finite element model requires defining large amounts of information, such as the contact of the drill with the workpiece, boundary and initial conditions, work material properties, element type, erosion model, and setting of the solution scheme. The model proposed in [27] successfully simulated the drilling of woven GFRP, after about 250 h. Although the use of the finite element method (FEM) enhances the accuracy of the results [10], it is computationally expensive. On the other side, ANNs can be used with a bit lower accuracy, which is enhanced using metaheuristic algorithms, such as PSO. Therefore, modeling techniques that are based on artificial intelligence could be used as a good solution to overcome these problems.
The full factorial design was used to design the experiments, and the experimental results were analyzed using statistical tools. The experimental data were used in training and testing a hybrid ANN–PSO model, where PSO was used to optimize the ANN training process. The performance of the proposed predictive models is evaluated using different measures. Finally, the optimization function desirability method, based on the RSM, was used to recognize the optimal combination of machining parameters (f, N, and t) in the drilling process of the WGFRE composite material studied in this work.
In Section 2, the methods and techniques used in the design of experiments, artificial neural networks, and particle swarm optimization are analyzed. In Section 3, results from the experiments conducted and the ANNs with PSO parameters are analyzed and discussed. Finally, the paper is concluded in Section 4.
2. Material and Methods
The experiments were conducted on woven-glass-fiber reinforced epoxy (WGFRP) samples, fabricated by the hand lay-up technique and constructed from 8 glass fiber layers, 16 glass fiber layers, and 24 glass fiber layers to produce three laminates in different thicknesses of 2.6 mm, 5.3 mm, and 7.7 mm, respectively [28]. The fabrication process was done using Araldite LY5138-2 epoxy polymer and HY5138 Hardener, with fiber volume fractions of 40%. The samples for the drilling test, of 36.6 × 36.6 mm, were cut using a CNC abrasive water-jet machine. The tensile properties were characterized according to ASTM D 3039, using a servo-hydraulic testing machine (Instron 8803-500 kN), at a loading test rate of 1.0 mm/min. Five samples were tested for each laminate thickness, and the average values were a tensile strength of 203.86 MPa, an elastic modulus of 16.05 GPa, and a Poisson’s ratio of 0.295. The Poisson’s ratio was determined by two perpendicular strain gauges, attached with the tensile specimens at the center of the gauge length of 170 mm.
Drilling operations were implemented under dry-cutting conditions, using a CNC milling machine. Two flute drills were used, with special ultrafine cemented carbide tips, which have excellent toughness and abrasion resistance. Material details of the used twist drills and their geometrical parameters are presented in Table 1.
The full factorial experiments of design were used. Three control factors with specific levels were considered in this study, as illustrated in Table 2. The experimental results extracted from [28] are shown in Table 3 and Table 4. They investigated the effect of the machining parameters (spindle speed, feed, and thickness) on the machinability proprieties’s thrust force and torque, and on the quality characteristic represented by the delamination factor.
Measurements of the torque, tabulated in Table 3, were recorded using a Kistler dynamometer, model 9272, fixed on a CNC milling machine and connected by PC. The experimental setup for online measuring of the thrust and torque as well as the dynamometer-fixture workpiece assembly are illustrated in [10]. A Kistler dynamometer, model 9272, which can measure thrust force and torque up to 20 kN and 200 N·m, respectively, is used. The specimen is fixed on the dynamometer, via a circular aluminum disk with a U-groove. The disk is clamped on the specimen using two bolts (M16). The back-up plate has a hole on the exit, of a 20 mm diameter. A very weak GFRE composite chip is attached to the drill.
The values of exit delamination factor (Fd-out), shown in Table 4, was evaluated by:
in which Fd is the delamination factor, D0 is the hole nominal diameter of 6 mm, and Dmax is the maximum delaminated diameter that can be drawn from the center point of D0.
2.1. Artificial Neural Network Models
An ANN is an arrangement of statistical algorithms, which mimics human brain patterns (Haykin, 2009) [29]. ANN is a powerful tool used to model the non-linear relationships between process inputs and output(s) [29]. Multi-layer perceptron is the most common type of feed-forward network, which is used here. It consists of an input layer, hidden layer(s), and an output layer, as shown in Figure 1. Every layer consists of weights and biases and uses mathematical functions, such as the linear activation function, sigmoid activation function, logistic activation function, mathematical function for conversion of inputs into outputs, and learning algorithm [30].
Three sequential processes, training, validation and testing, occur for developing and applying an ANN. Training of the networks is for finding the optimum values of various weights and biases of the network. To find the suitable values of weights and biases of the ANN, several techniques are utilized.
The objective function of the optimum training of ANN is minimum MSE, as is shown in Equation (2),
where, I and O are the actual response, as considered in the target set and output of ANN, respectively, and n is the number of the network outputs.
The best architecture was selected based on the minimum mean square error (MSE) between the measured and predicted values. The correlation coefficient (R), between the targets and the corresponding network outputs, is used to investigate the performance of the best-obtained network.
2.2. Particle Swarm Optimization
The PSO is originally attributed to Kennedy, Eberhart, and Shi and is a metaheuristic optimization technique, mimicking the behavior of birds and fish while seeking food sources [31,32].
The algorithm of PSO was simplified and observed to be performing optimization, by applying swarm intelligence. Each particle has a separate memory, to store its best positions side by side with the global-best position. Based on the information stored in the separated particle memory and its velocity vi, the particle position updated is a new position, .
Within the upper and lower boundaries of the search domain, UB and LB, respectively, Equation (3) is used to generate the population of moving particles.
The velocity, , of each particle can be updated, by applying Equation (4)
where w is the inertia weight to accelerate the convergence, r1 and r2 are random numbers, c1 and c2 are the acceleration coefficients, and k stands for the iteration number. Then, Equation (5) is used to calculate the new position of the particle.
After that, the fitness function of each particle is computed. Then, the global-best solution gBest and the best-particle position pBest are determined. These steps are repeated, until a predefined criterion is reached.
2.3. ANN–PSO Model
ANN training can be considered as a minimization problem, where the weights and biases of the ANN must be determined to make the prediction error minimum. The commonly used algorithms during the training process, such as the Levenberg–Marquardt algorithm, might consume a lot of time and are, likely, tricked into local minimum points. Therefore, integrating ANN with the metaheuristic optimization methods is highly required to evade the obstacles facing the traditional training algorithms and, then, improve the prediction performance of ANN [33]. ANN–PSO proposed here is to utilize PSO as an optimization technique, to minimize the prediction errors of the ANN, by identifying the optimal values of the weights as well as the biases of the net. The minimum MSE is defined as the objective function of the optimum training of ANN using PSO and is expressed by Equation (2). The PSO updates the ANN, until reaching the stop criterion.
3. Results and Discussion
3.1. Effect of Drilling Parameters on the Responses
Response surface analysis was used in determining the relationship between the responses (generated delamination factor and torque) and the drilling parameters, for three different laminates thickness. The damage caused by the drilling operations in the manufacturing of FRP composites is a part of the delamination factor. Delamination is a primary concern in choosing cutting parameters during the design process. The delamination factor of WGFRE, for three different laminates thickness, is related to many factors, such as feed and spindle speed.
For analyzing the torque and delamination factor models, the assumptions were that the loading of the tool is uniformly distributed and the peel-up delamination is considered negligible, compared to push-out delamination.
The thickness of the laminate can maintain the axial force, at the beginning of drilling, but it cannot bear the same load near the exit, where the applied thrust force exceeds the shear stress between the uncut layers. Therefore, it causes severe damage, called push-out delamination. The main parameter responsible for this delamination is the critical thrust force [28,34].
From ANOVA results, the control factor effect on the drilling process responses was evaluated by their contribution percentage to the total variation. The p-value is used to estimate the significance of the machining parameter effect on the responses. In most experimental work, a p-value less than 0.05 indicates the effect significance of the related factor. Correspondingly, all machining parameters studied have a significant effect on at least one of the drilling process outcomes, as shown in Table 5.
The RSM was used to evaluate the experimental results, to find the correlation between the drilling operation responses and the different machining parameters. The mathematical equations of the regression for torque, and the delamination factor reported in [10], are quadratic models. The goodness of the models was excellent. The significance indicator of the results revealed that the quadratic models are statistically significant in analyzing every response, with a 95% confidence level.
Since the machining parameters are considered at multiple levels, the quadratic model, based on RSM, can be expressed as follows:
where is the response, and the are the coefficients of the variation resources of the prediction model listed in Table 6, beside the coefficient of determination (R2) value of each estimated model. To the adequacy of the obtained mathematical models, the 3D surface plots constructed by them can be used for predicting the responses for any combination of the machining parameters.
Regarding delamination factor, the surface plots for the Fd-out shown in Figure 2, plotted using the obtained quadratic equation, can be used for estimating the Fd-out values for any appropriate combination of the machining parameters: f, N, and t. Figure 2 illustrates that the delamination factor increases with the increase in the feed and decreases with the increase in the spindle speed. It is noticed that with the decrease in laminate thickness, the Fd-out increases. The effect of the feed can be explained: as the feed is increased, the area of the chip increases, where resistance to the cutting of the material is higher. Therefore, large efforts are required to remove the chip [35]. Moreover, Figure 2 elucidates that as the thickness increases, the delamination factor decreases.
By comparing the maximum torque for the three different thicknesses shown in Figure 3, it is noted that the specimen thickness of 2.6 mm has a minor effect on the torque. The larger thicknesses of 5.3 mm and 7.7 mm have the largest torque, which is attributed to the increased friction between the formed surface, chips, and drill tips, as concluded by [10].
Regarding the required power (P) for the drilling process, which can be calculated by , the 3D surface plots shown in Figure 3 can be used for predicting the torque values for any appropriate machining parameter combinations. Figure 3 demonstrates the evolution of the maximum torque, according to the speed and feed for each thickness of the laminate.
3.2. Prediction of Responses by ANN–PSO Model
In the literature, there are a number of studies that used ANNs to predict the characteristics of the drilling processes in FRP composites, such as functionally graded composite [4], bidirectional jute fiber, and cork-reinforced polymer [4,19].
The experimentally measured data are used to train the proposed NN–PSO model, which is exploited to predict the torque and Fd-out in the space of this study. The ANN–PSO model learns the relationship between the process control factors (feed, spindle speed, and workpiece thickness) and responses.
The experimental data are divided between the training dataset, which represents 70%, and the test dataset, which represents 30%. This allocation is applied for torque and delamination factor. Then, the training process is carried out, aiming to obtain the optimal configurations and parameters of the models, which minimize model errors. The accuracy of the ANN–PSO model is compared with the RSM model, for predicting the T and Fd-out under diverse combinations of drilling parameters.
In the hidden layer, the number of neurons depends on decreasing the error, while increasing the number of hidden nodes [29], without over-fitting. Table 7 elucidates the architectures of the obtained ANN–PSO, MSE, and correlation coefficient (R) values of the training results of the torque and delamination factor data. The neurons are linked together, by means of weights.
The correlation strength between the experimental data and predicted results by ANN–PSO is illustrated in Figure 4, for torque and delamination factors, respectively. It is obvious that the ANN–PSO predictions correspond to the experimental results, with respect to both drilling outcomes, herein.
Figure 4a of the ANN–PSO model of torque shows that the predicted points appear scattered very closely around the straight line, indicating the existence of the high accuracy of the model. While, for the ANN–PSO of delamination factor, Figure 4b shows the scatter of predicted points to be loosely spread around the straight line, indicating accuracy lower than the torque-related model. The high value of R2, of 0.9967, for torque, is higher than that of ANN–PSO for the delamination factor, which is 0.9582. Moreover, the traditional training technique (Levenberg–Marquardt algorithm) was used and appeared to possess lower accuracy than the ANN–PSO model.
The 3D surface plots, shown in Figure 5 and Figure 6, are plotted as a function of f, N, and t for torque and Fd-out, respectively, using the proposed ANN–PSO models. These 3D plots elucidate that the developed ANN–PSO models can interpret the data well and serve as an efficient prediction tool for the torque and Fd-out produced during the drilling process of WGFRE. Thus, it facilitates the exploitation of artificial intelligence in the manufacture of FRP.
3.3. Comparison of Obtained Predictive Models
The results, obtained experimentally, are compared with those predicted by the proposed models of ANN–PSO and RSM, as shown in Figure 6 for torque and Fd-out. Table 8 illustrates the statistical measures of both prediction models: R2, MSE, and MAPE. From the plots in Figure 7 and the performance measures in Table 8, it was found that the two models can, acceptably, draw and describe the experimental results.
Figure 8 illustrates the absolute percentage error (APE) in the prediction process of the proposed models. The maximum APE in the prediction of torque and Fd-out by the ANN–PSO model is 3.55% and 2.52%, respectively, while by the RSM model, it is 9.25% and 3.58%, respectively, as shown in the figure.
Consequently, the prediction accuracy with the ANN–PSO model is more than those obtained with the RSM model. At the extent of these low error rates, we can say that the model predicts process response with high accuracy and can be used in the optimization process, as has, also, been confirmed by [19].
3.4. Optimizing Responses
Figure 9 and Figure 10 show the desirability-contour and ramp-function mapping for torque and delamination factor. Determining the optimal machining parameters to minimize delamination factor is the main objective of the optimization, as well as torque, which has a significant role in the consumed power needed for the drilling process. Table 9 shows the machining parameters used in the optimization process. While Table 10 illustrates the optimal values of the control factors and drilling process responses obtained by the RSM model.
The selected 10 conducted trials show that at a low level of feed, a high spindle speed, and a medium level of laminate thickness, the reduction in delamination factor and torque are attained with a desirability factor of 0.906. According to Table 10, the optimal drilling parameters (f = 0.025 mm/r, N = 1600 rpm, and t = 5.43 mm) resulted in a minimal delamination factor of 1.32, with an appropriate torque of 21.9 N·cm.
In the end, the results of the obtained models are discussed here. For the torque prediction model, the model based on the RSM is well suited and consistent with [36]. The R2 value has been improved, from 0.993 for the same model to 0.9967 for the artificial neural network model trained using the POS optimization algorithm. With this small improvement, however, the values of the APE were clearly different between the two models, as shown in Figure 8a.
This superiority is due to the ability of neural networks to modify and adapt, through the values of weights and biases during training, to reach the best construct with the lowest error rate.
Regarding the delamination factor model: the superiority of the neural network model trained with the PSO optimization algorithm is shown by the value of R2, which increased from 0.864 with RSM to 0.9582 with ANN–PSO. This makes us say that the neural network model is more capable of describing and evaluating the experimental results, and this is evident in Figure 5 and Figure 8b.
4. Conclusions
The present research aimed to optimize the WGFRE composites delamination factor as well as the produced drilling torque during the drilling process. The results above showed that a combination of a low level of feed and a high level of spindle speed is, clearly, required to minimize the delamination factor and the maximum torque produced in the drilling process.
Results from the predictive models and experimental measurements agree well, and the optimization process gave good results, with an overall desirability factor of 90%. The RSM and ANN–PSO models applied to predict the drilling-process parameters showed a very high correspondence with the experimental data. Comparing the results predicted by the RSM and ANN–PSO models with the experimental results demonstrates that the ANN–PSO model is more accurate.
The use of artificial neural network models, enhanced by the PSO algorithm, might be exploited in transforming into industry 4.0, with the manufacturing processes of FRP composites, such as drilling and milling operations. Such attempts should be considered to be placed in a broader framework and linked with the elements of the digital industry, in future research.
Funding
This research was funded by the Deanship of Scientific Research (DSR), King Abdulaziz University, Jeddah, under grant number (G: 1322-135-1440).
Institutional Review Board Statement
Not applicable.
Informed Consent Statement
Not applicable.
Data Availability Statement
Data are not publicly available, though the data may be made available on request from the corresponding author.
Acknowledgments
This project was supported by the Deanship of Scientific Research (DSR), King Abdulaziz University, Jeddah, under grant number (G: 1322-135-1440). The author, therefore, acknowledges with thanks DSR for technical and financial support.
Conflicts of Interest
The author declares no conflict of interest.
References
- Reisgen, U.; Schiebahn, A.; Lotte, J.; Hopmann, C.; Schneider, D.; Neuhaus, J. Innovative joining technology for the production of hybrid components from FRP and metals. J. Mater. Process. Technol. 2020, 282, 116674. [Google Scholar] [CrossRef]
- Khashaba, U.A.; Othman, R.; Najjar, I.M.R. Effect of Water Absorption on the Impact Behaviors of CFRE Composites. Glob. J. Res. Eng. AMechanical Mech. Eng. 2017, 17. Available online: https://www.engineeringresearch.org/index.php/GJRE/article/view/1693 (accessed on 4 May 2022).
- Malik, K.; Ahmad, F.; Gunister, E. Drilling Performance of Natural Fiber Reinforced Polymer Composites: A Review. J. Nat. Fibers 2021, 1–19. [Google Scholar] [CrossRef]
- Köklü, U.; Mayda, M.; Morkavuk, S.; Avcı, A.; Demir, O. Optimization and prediction of thrust force, vibration and delamination in drilling of functionally graded composite using Taguchi, ANOVA and ANN analysis. Mater. Res. Express 2019, 6, ab2617. [Google Scholar] [CrossRef]
- Khashaba, U.A.; El-Keran, A.A. Drilling analysis of thin woven glass-fiber reinforced epoxy composites. J. Mater. Process. Technol. 2017, 249, 415–425. [Google Scholar] [CrossRef]
- Montgomery, D.C. Design and Analysis of Experiments, 8th ed.; Wiley: Hoboken, NJ, USA, 2013. [Google Scholar]
- Tahboub, K.K.; Rawabdeh, I.A. A design of experiments approach for optimizing an extrusion blow molding process. J. Qual. Maint. Eng. 2004, 10, 47–54. [Google Scholar] [CrossRef]
- Cathie Lee, W.P.; Mah, S.-K.; Leo, C.P.; Wu, T.Y.; Chai, S.-P. Phosphorus removal by NF90 membrane: Optimisation using central composite design. J. Taiwan Inst. Chem. Eng. 2014, 45, 1260–1269. [Google Scholar] [CrossRef]
- El-Midany, T.T.; El-Baz, M.A.; Abdelwahed, M.S. Improve Characteristics of Manufactured Products Using Artificial Neural Network Performance Prediction Model. Int. J. Recent Adv. Mech. Eng. 2013, 2, 23–34. [Google Scholar]
- Khashaba, U.A.; Abd-Elwahed, M.S.; Ahmed, K.I.; Najjar, I.; Melaibari, A.; Eltaher, M.A. Analysis of the machinability of GFRE composites in drilling processes. Steel Compos. Struct. 2020, 36, 417–426. [Google Scholar] [CrossRef]
- Rao, T.B.; Krishna, A.G. Design and Optimization Of Extrusion Process Using FEA And Taguchi Method. Int. J. Eng. Res. Technol. 2012, 1, 1–5. [Google Scholar]
- Nezadi, M.; Keshvari, H.; Yousefzadeh, M. Using Taguchi design of experiments for the optimization of electrospun thermoplastic polyurethane scaffolds. Adv. Nano Res. 2021, 10, 59–69. [Google Scholar]
- Alaoui, A.; El Kacemi, K.; El Ass, K.; Kitane, S. Application of Box-Behnken design to determine the optimal conditions of reductive leaching of MnO2 from manganese mine tailings. Russ. J. Non-Ferr. Met. 2015, 56, 134–141. [Google Scholar] [CrossRef]
- Azizi, A.; Masdarian, M.; Hassanzadeh, A.; Bahri, Z.; Niedoba, T.; Surowiak, A. Parametric Optimization in Rougher Flotation Performance of a Sulfidized Mixed Copper Ore. Minerals 2020, 10, 660. [Google Scholar] [CrossRef]
- Gamal, S.A.; Mohamed, S.; Abd-Elwahed; Hefni, M.A. Controlling Grinding Process Parameters Using Central Composite Design to Reduce Slimes in Phosphate Ore Beneficiation. Rud.-Geol.-Naft. Zb. 2022, 59. [Google Scholar]
- Flores, V.; Keith, B.; Leiva, C. Using Artificial Intelligence Techniques to Improve the Prediction of Copper Recovery by Leaching. J. Sens. 2020, 2020, 2454875. [Google Scholar] [CrossRef] [Green Version]
- Abdelwahed, M.S.; El-Baz, M.A.; El-Midany, T.T. A Proposed Performance Prediction Approach for Manufacturing Processes using ANNs. Int. J. Ind. Manuf. Eng. 2012, 6, 260–265. [Google Scholar] [CrossRef]
- Kharwar, P.; Verma, R. Grey embedded in artificial neural network (ANN) based on hybrid optimization approach in machining of GFRP epoxy composites. FME Trans. 2019, 47, 641–648. [Google Scholar] [CrossRef] [Green Version]
- Tabet, Z.; Belaadi, A.; Boumaaza, M.; Bourchak, M. Drilling of a Bidirectional Jute Fibre and Cork-Reinforced Polymer Biosandwich Structure: ANN and RSM approaches for Modelling and Optimization. Int. J. Adv. Manuf. Technol. 2021, 117, 3819–3839. [Google Scholar] [CrossRef]
- Adda, B.; Belaadi, A.; Boumaaza, M.; Bourchak, M. Experimental investigation and optimization of delamination factors in the drilling of jute fiber–reinforced polymer biocomposites with multiple estimators. Int. J. Adv. Manuf. Technol. 2021, 116, 2885–2907. [Google Scholar] [CrossRef]
- Anarghya, A.; Harshith, D.N.; Rao, N.; Nayak, N.S.; Gurumurthy, B.M.; Abhishek, V.N.; Patil, I.G.S. Thrust and torque force analysis in the drilling of aramid fibre-reinforced composite laminates using RSM and MLPNN-GA. Heliyon 2018, 4, e00703. [Google Scholar] [CrossRef] [Green Version]
- Erturk, A.T.; Vatansever, F.; Yarar, E.; Guven, E.A.; Sinmazcelik, T. Effects of cutting temperature and process optimization in drilling of GFRP composites. J. Compos. Mater. 2020, 55, 235–249. [Google Scholar] [CrossRef]
- Bayraktar, Ş.; Turgut, Y. Determination of delamination in drilling of carbon fiber reinforced carbon matrix composites/Al 6013-T651 stacks. Measurement 2020, 154, 107493. [Google Scholar] [CrossRef]
- Solati, A.; Hamedi, M.; Safarabadi, M. Comprehensive investigation of surface quality and mechanical properties in CO2 laser drilling of GFRP composites. Int. J. Adv. Manuf. Technol. 2019, 102, 791–808. [Google Scholar] [CrossRef]
- Rajaraman, G.; Agasti, S.K.; Jenarthanan, M.P. Investigation on effect of process parameters on delamination during drilling of kenaf-banana fiber reinforced in epoxy hybrid composite using Taguchi method. Polym. Compos. 2019, 41, 994–1002. [Google Scholar] [CrossRef]
- Wang, H.; Zhang, X.; Duan, Y. Effects of drilling area temperature on drilling of carbon fiber reinforced polymer composites due to temperature-dependent properties. Int. J. Adv. Manuf. Technol. 2018, 96, 2943–2951. [Google Scholar] [CrossRef]
- Abd-Elwahed, M.; Khashaba, U.; Ahmed, K.; Eltaher, M.; Najjar, I.; Melaibari, A.; Abdraboh, A. Experimental and Numerical FEM of Woven GFRP Composites during Drilling. Struct. Eng. Mech. 2021, 80, 503–522. [Google Scholar] [CrossRef]
- Khashaba, U.A.; Abd-Elwahed, M.S.; Eltaher, M.A.; Najjar, I.; Melaibari, A.; Ahmed, K.I. Thermo-Mechanical and Delamination Properties in Drilling GFRP Composites by Various Drill Angles. Polymers 2021, 13, 1884. [Google Scholar] [CrossRef]
- Haykin, S. Neural Networks and Learning Machines, 3rd ed.; Pearson Education Inc.: Hoboken, NJ, USA, 2009. [Google Scholar]
- Cater, J.P. Successfully using of peak learning rates of 10 (and greater) in back-propagation networks with the heuristic learning algorithm. In Proceedings of the IEEE First International Conference on Neural Networks, San Diego, CA, USA, 21–24 June 1987; pp. 645–651. [Google Scholar]
- Shi, Y.; Eberhart, R. A modified particle swarm optimizer. In Proceedings of the 1998 IEEE International Conference on Evolutionary Computation Proceedings, IEEE World Congress on Computational Intelligence (Cat. No.98TH8360), Anchorage, AK, USA, 4–9 May 1998; pp. 69–73. [Google Scholar]
- Kennedy, J.; Eberhart, R. Particle swarm optimization. In Proceedings of the ICNN’95—International Conference on Neural Networks, Perth, WA, Australia, 27 November–1 December 1995; Volume 1944, pp. 1942–1948. [Google Scholar]
- Rukhaiyar, S.; Alam, M.N.; Samadhiya, N.K. A PSO-ANN hybrid model for predicting factor of safety of slope. Int. J. Geotech. Eng. 2017, 12, 556–566. [Google Scholar] [CrossRef]
- Kilickap, E. Analysis and modeling of delamination factor in drilling glass fiber reinforced plastic using response surface methodology. J. Compos. Mater. 2010, 45, 727–736. [Google Scholar] [CrossRef]
- Belaadi, A.; Laouici, H.; Bourchak, M. Mechanical and drilling performance of short jute fibre-reinforced polymer biocomposites: Statistical approach. Int. J. Adv. Manuf. Technol. 2019, 106, 1989–2006. [Google Scholar] [CrossRef]
- Khashaba, U.A.; El-Sonbaty, I.A.; Selmy, A.I.; Megahed, A.A. Drilling analysis of woven glass fiber-reinforced/epoxy composites. J. Compos. Mater. 2012, 47, 191–205. [Google Scholar] [CrossRef]
Figure 1.
ANN architecture.
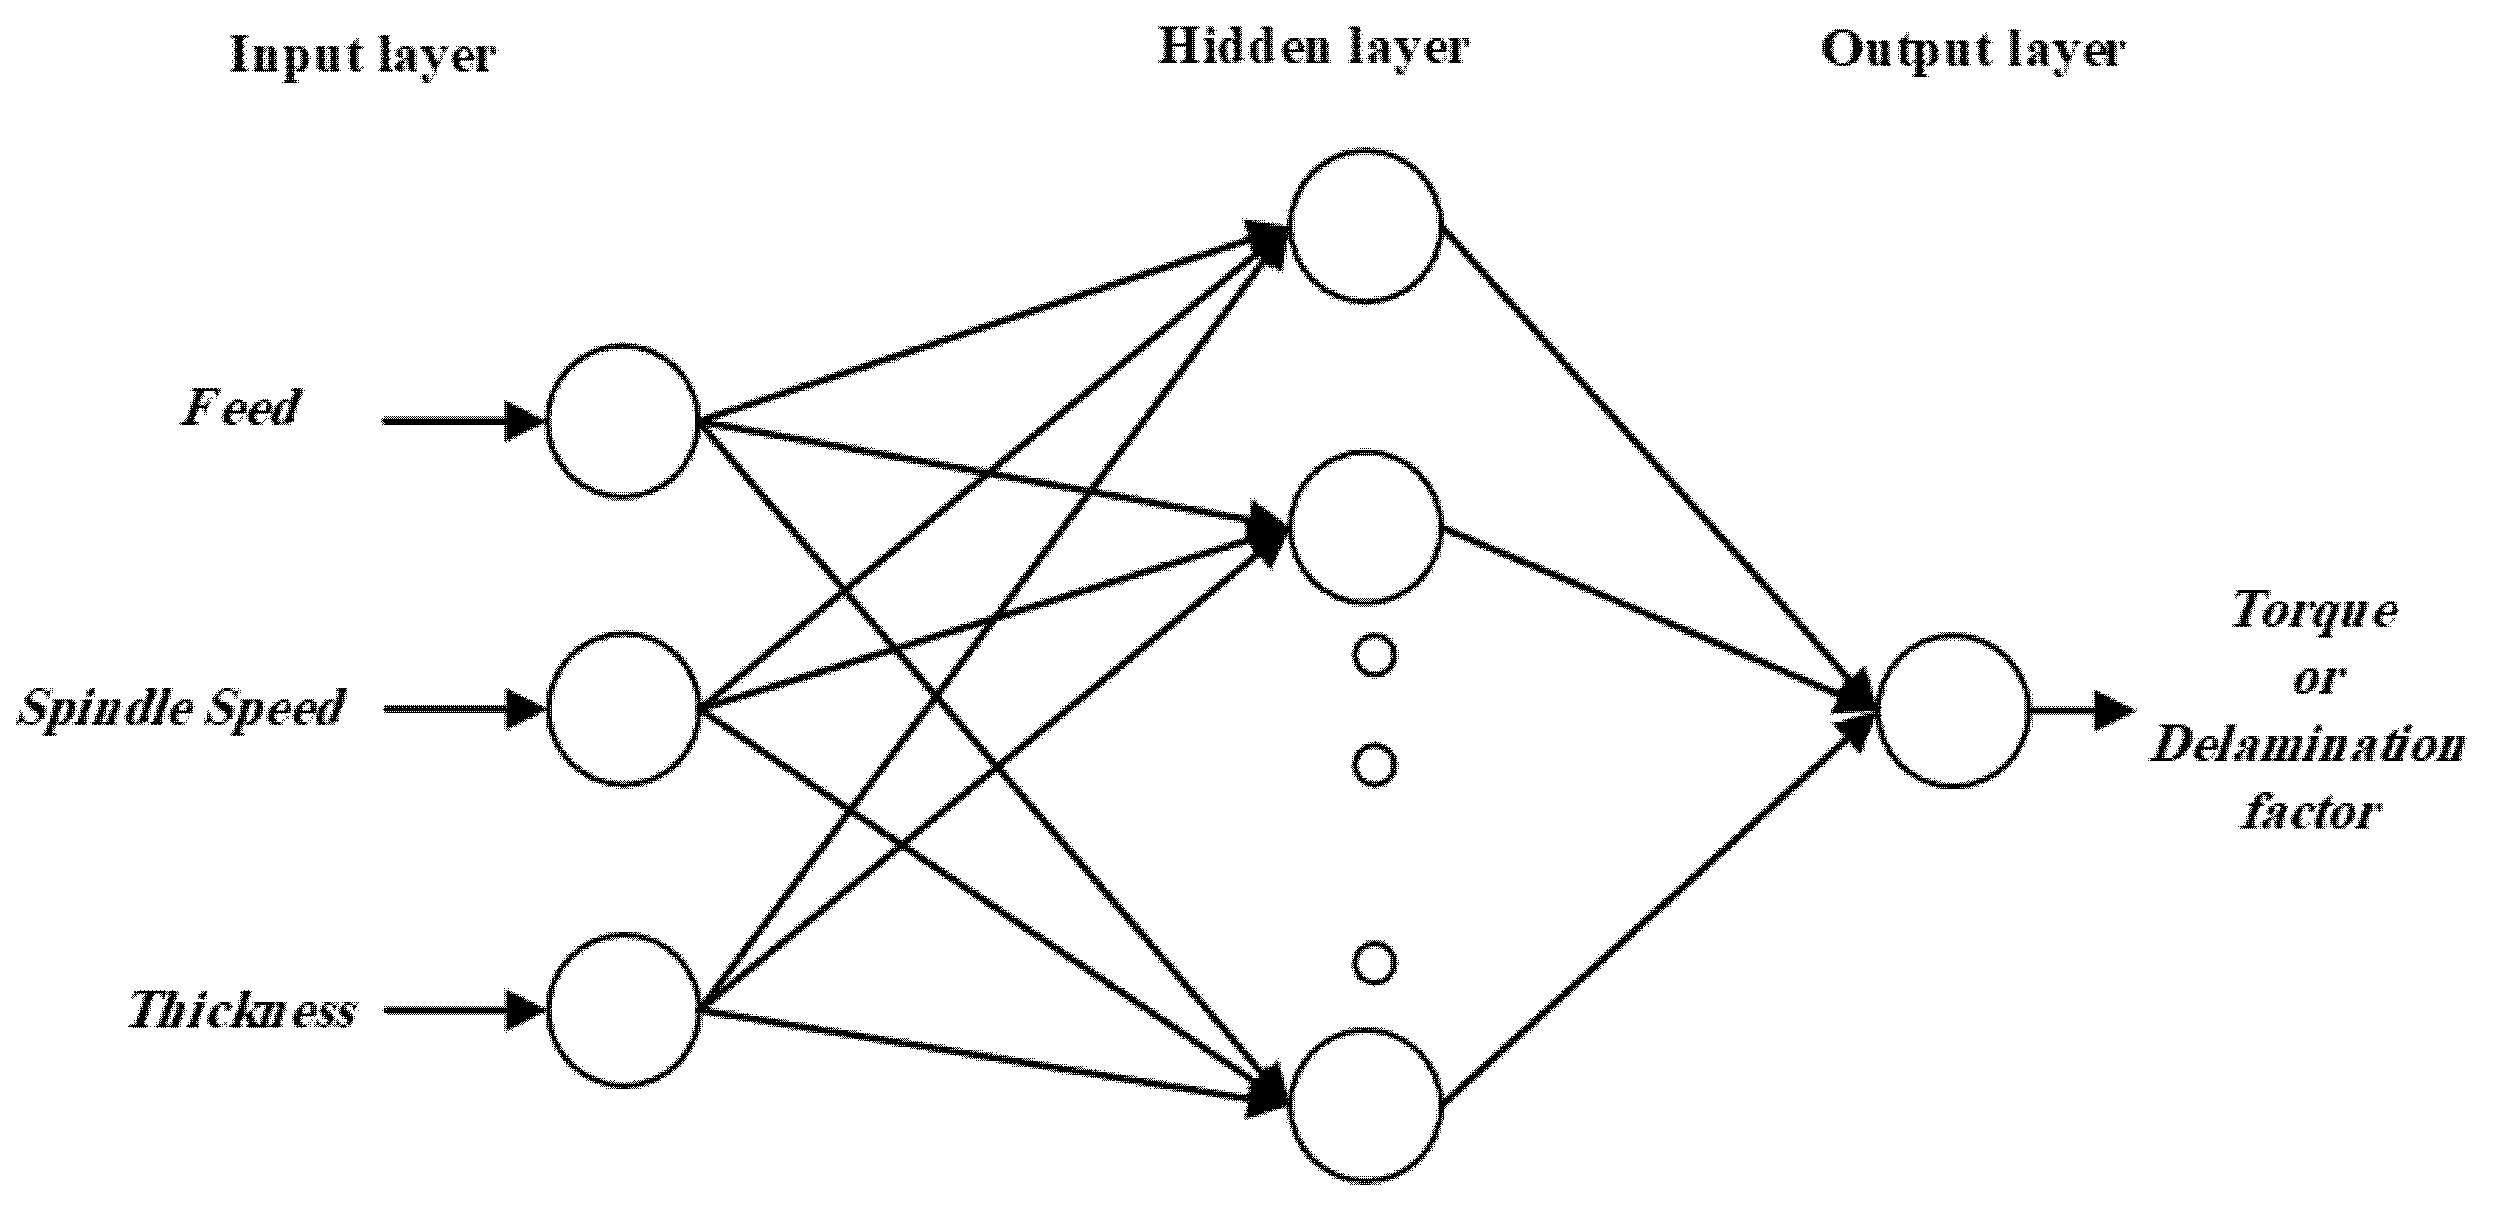
Figure 2.
Surface plot of push-out delamination factor (Fd-out) versus feed, spindle speed, and sample thickness from RSM model.
Figure 2.
Surface plot of push-out delamination factor (Fd-out) versus feed, spindle speed, and sample thickness from RSM model.

Figure 3.
Torque versus f, N, and t from RSM model.

Figure 4.
Regression plot between experimental and predictive results of ANN–PSO models: (a) torque (N·cm) and (b) delamination factor.
Figure 4.
Regression plot between experimental and predictive results of ANN–PSO models: (a) torque (N·cm) and (b) delamination factor.
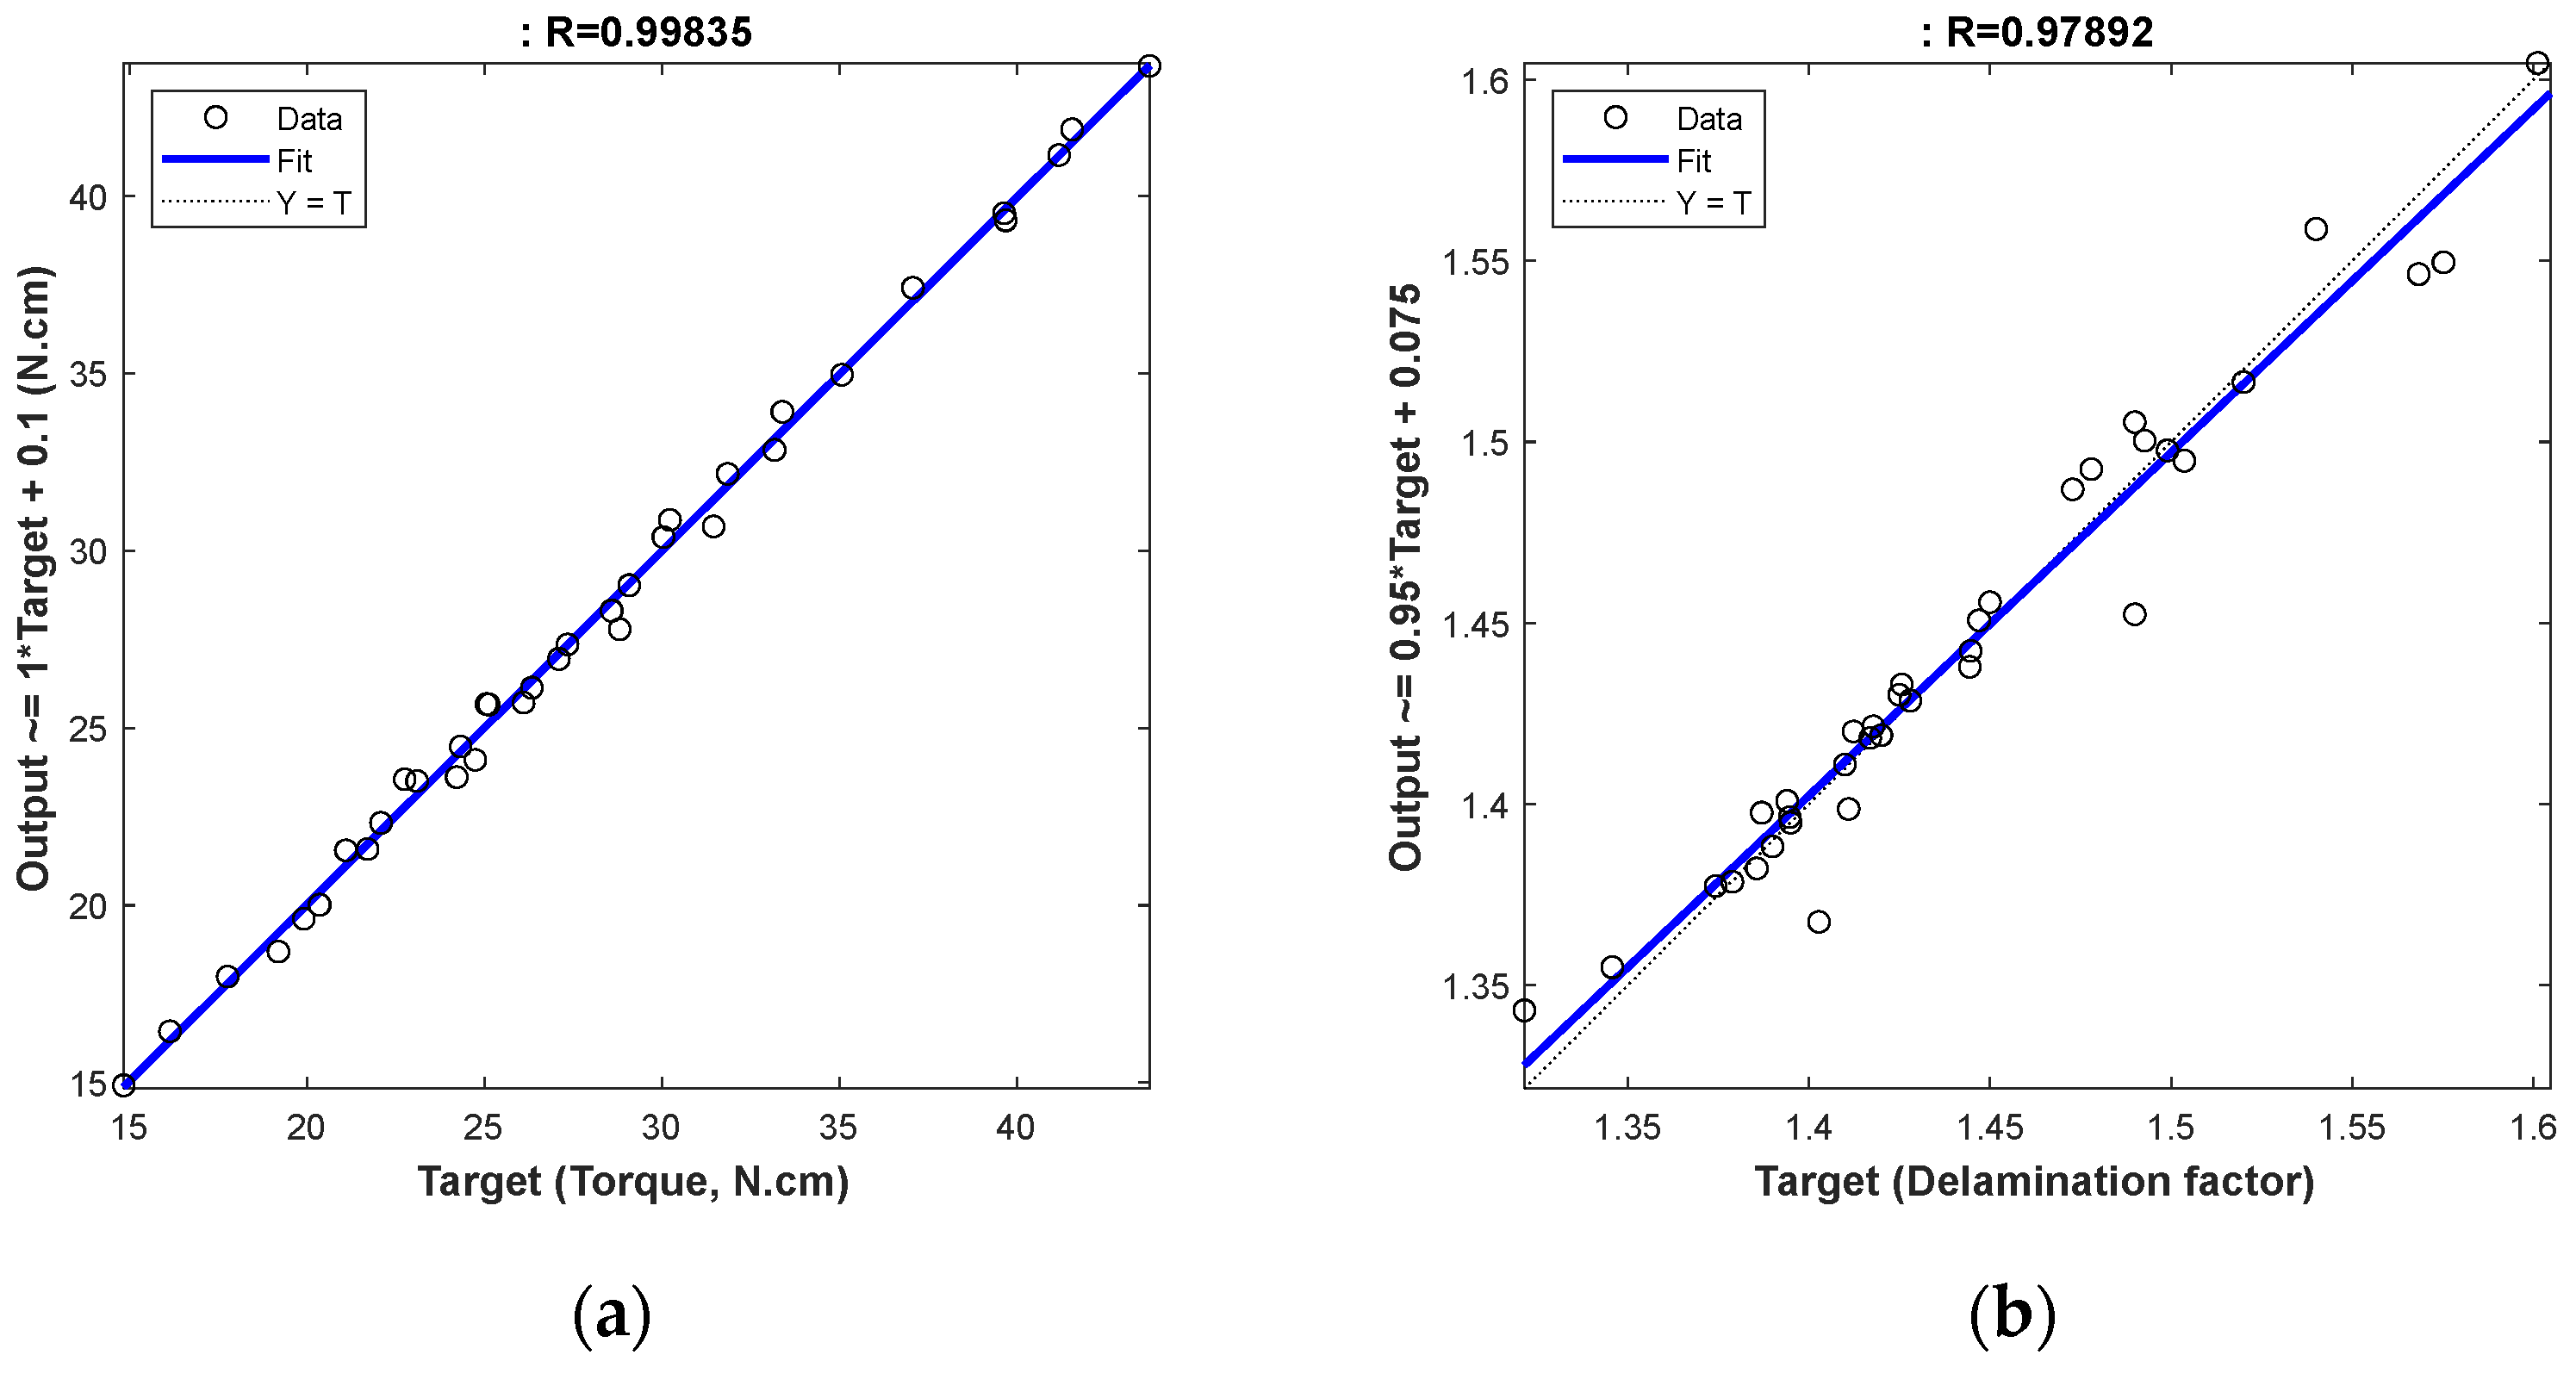
Figure 5.
The 3D surface plots of push-out delamination factor (Fd-out) versus feed and spindle speed, at sample thickness of 2.6 mm of drilled samples, obtained by ANN–PSO model.
Figure 5.
The 3D surface plots of push-out delamination factor (Fd-out) versus feed and spindle speed, at sample thickness of 2.6 mm of drilled samples, obtained by ANN–PSO model.
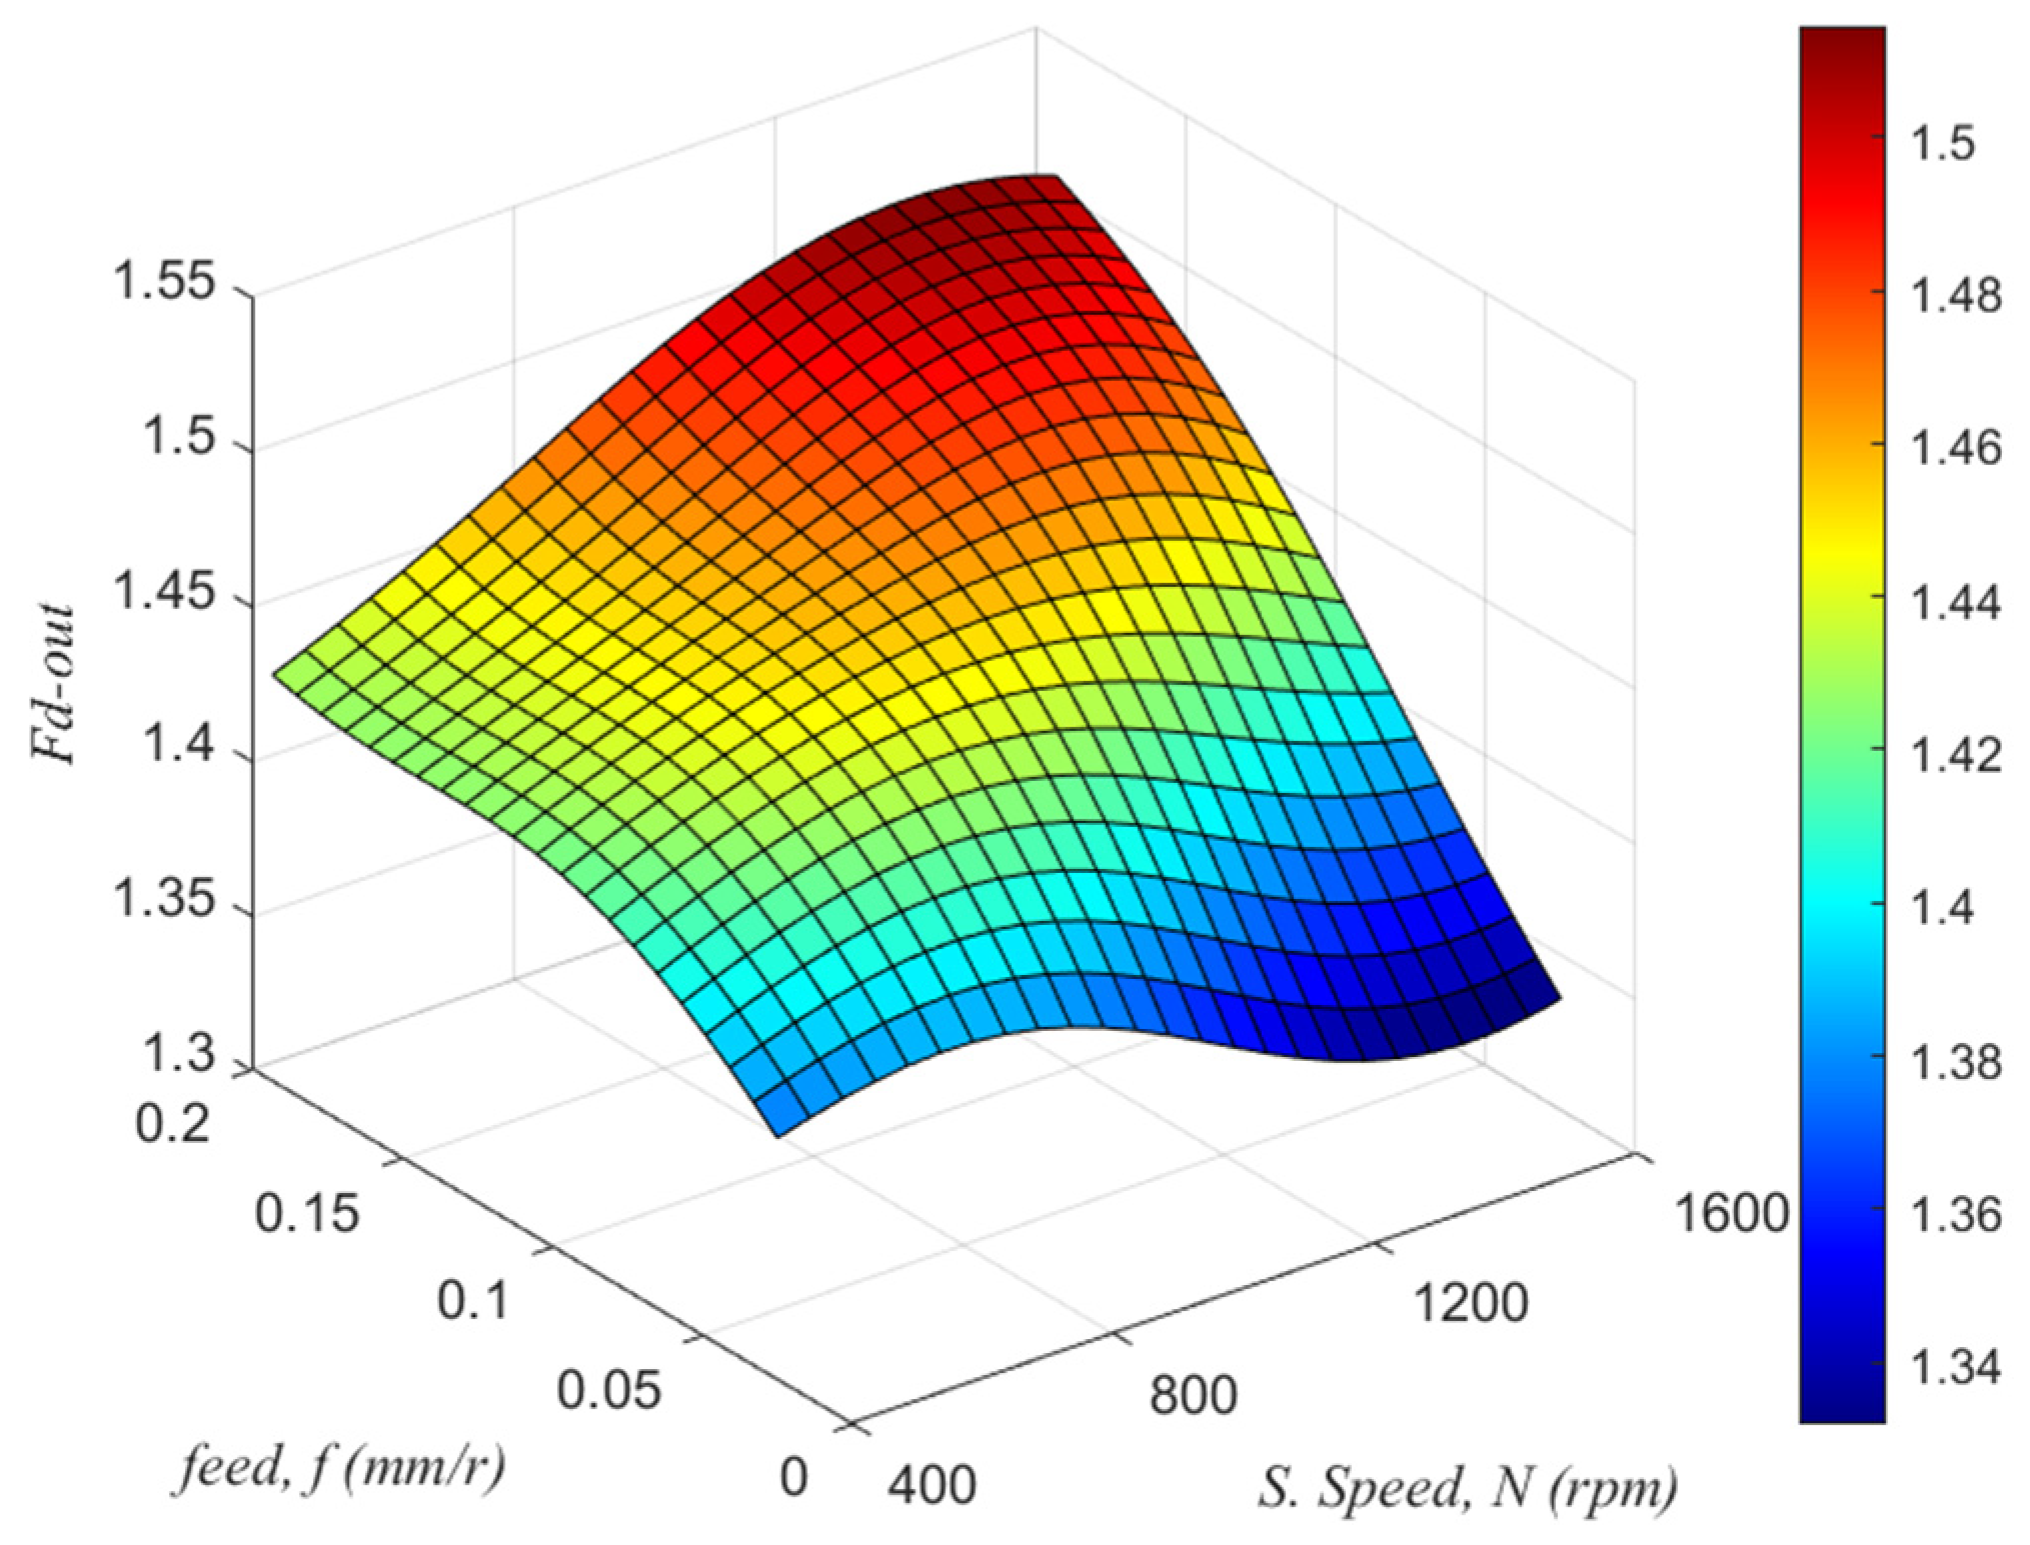
Figure 6.
The 3D surface plots f torque versus Feed and spindle speed, at three deferent thicknesses obtained by ANN-– model.
Figure 6.
The 3D surface plots f torque versus Feed and spindle speed, at three deferent thicknesses obtained by ANN-– model.
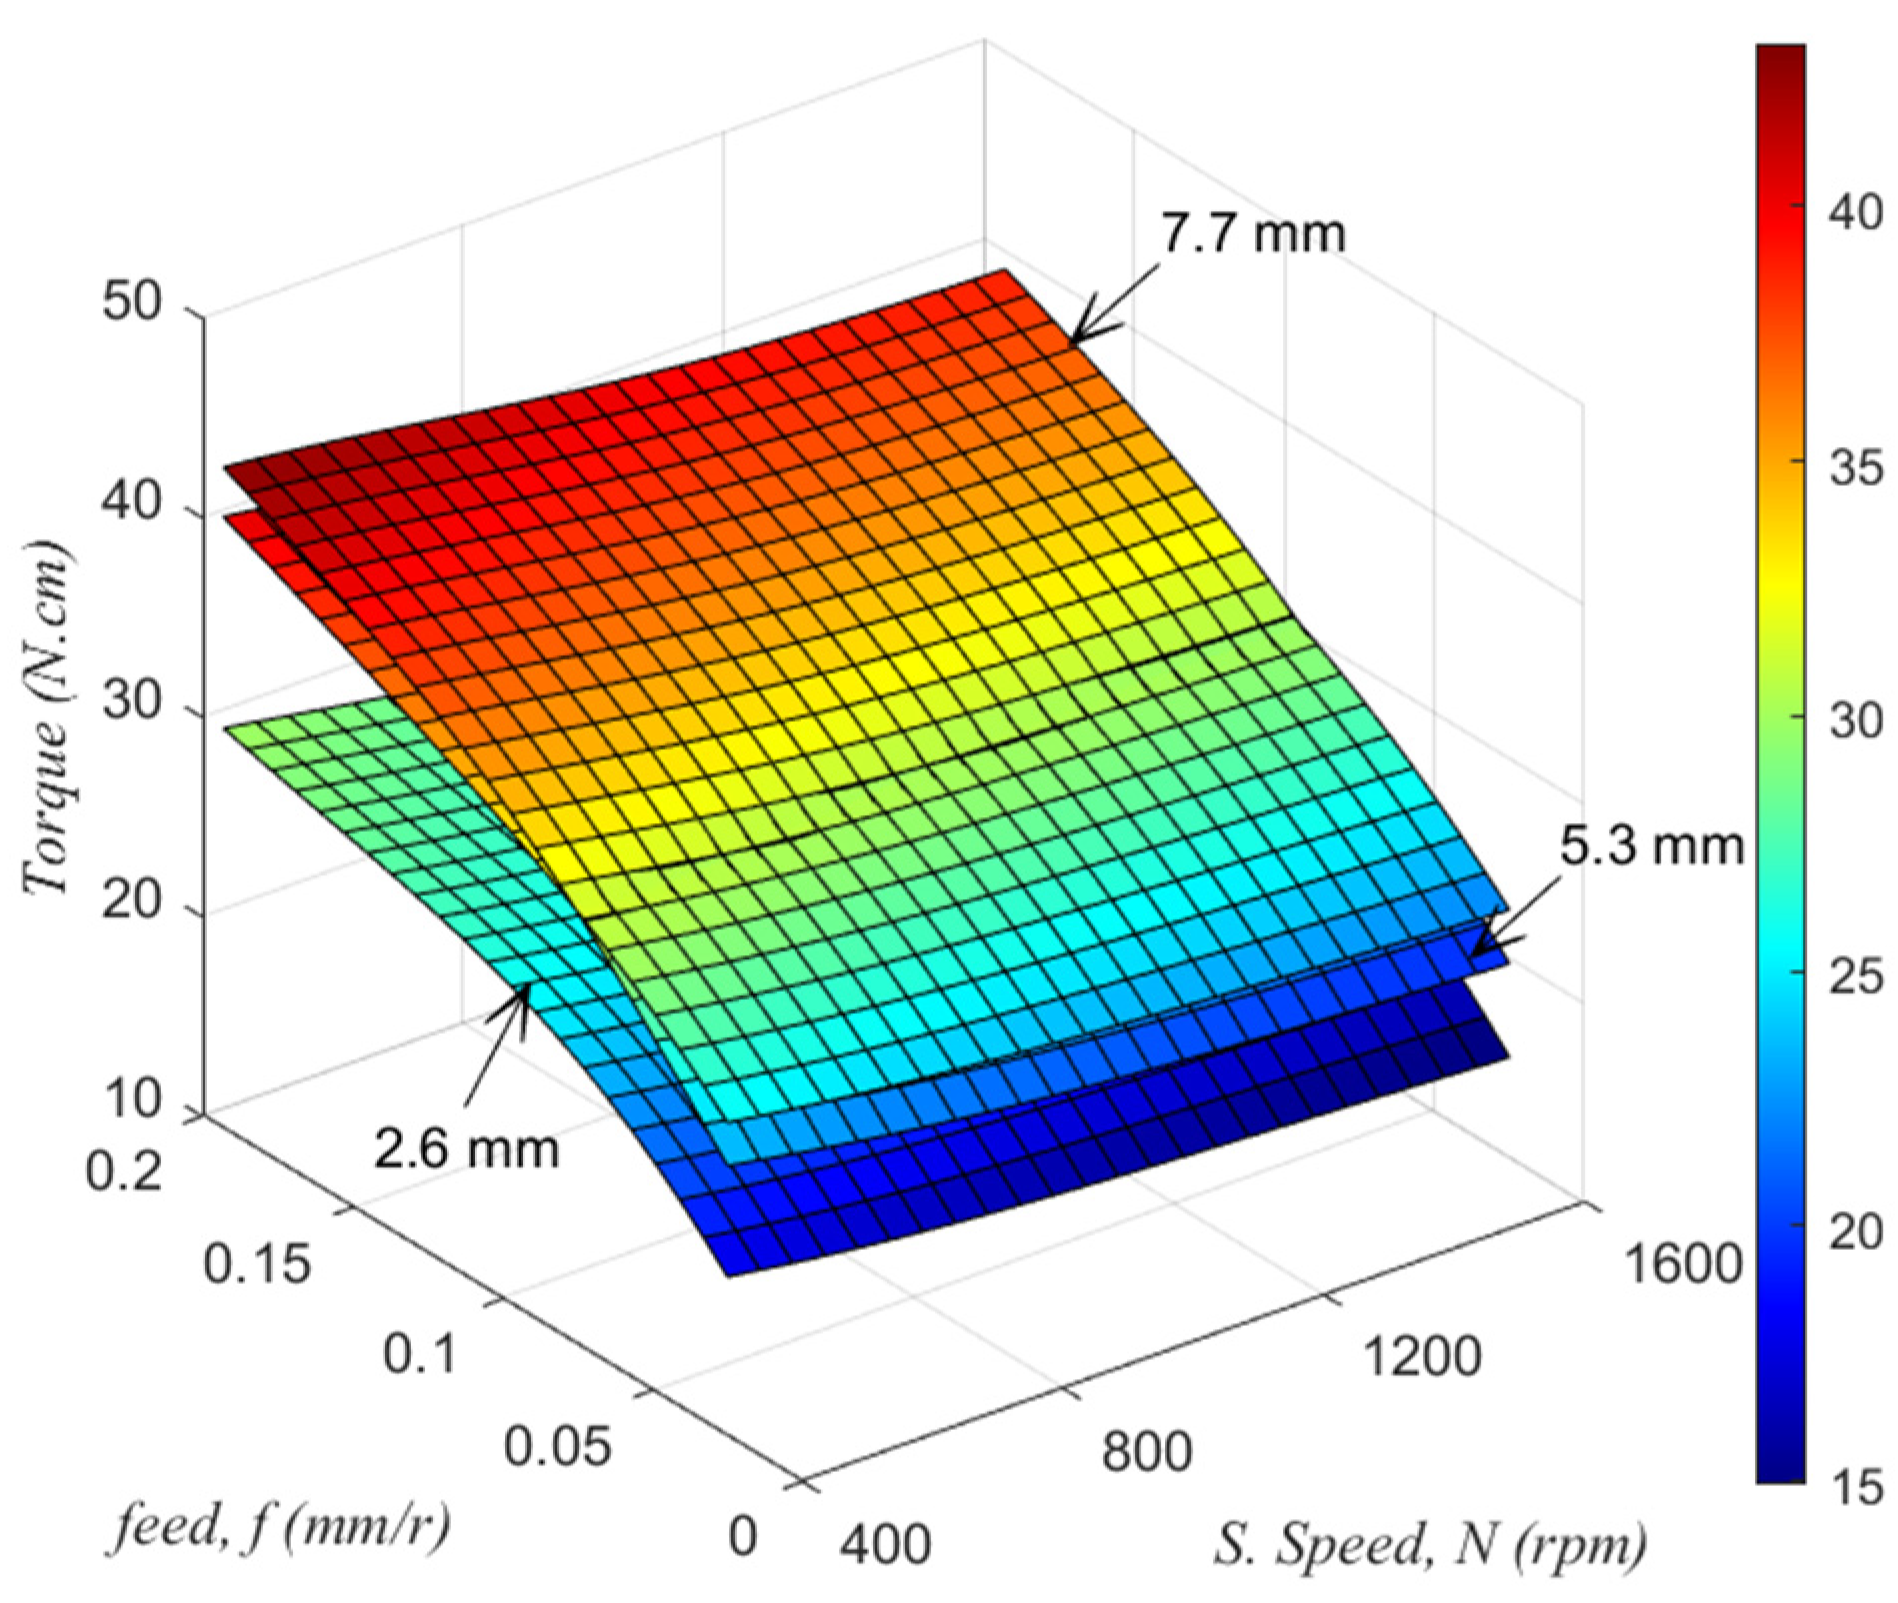
Figure 7.
Comparison between experimental and predicted results by proposed models for (a) torque (N·cm) and (b) push-out delamination factor.
Figure 7.
Comparison between experimental and predicted results by proposed models for (a) torque (N·cm) and (b) push-out delamination factor.
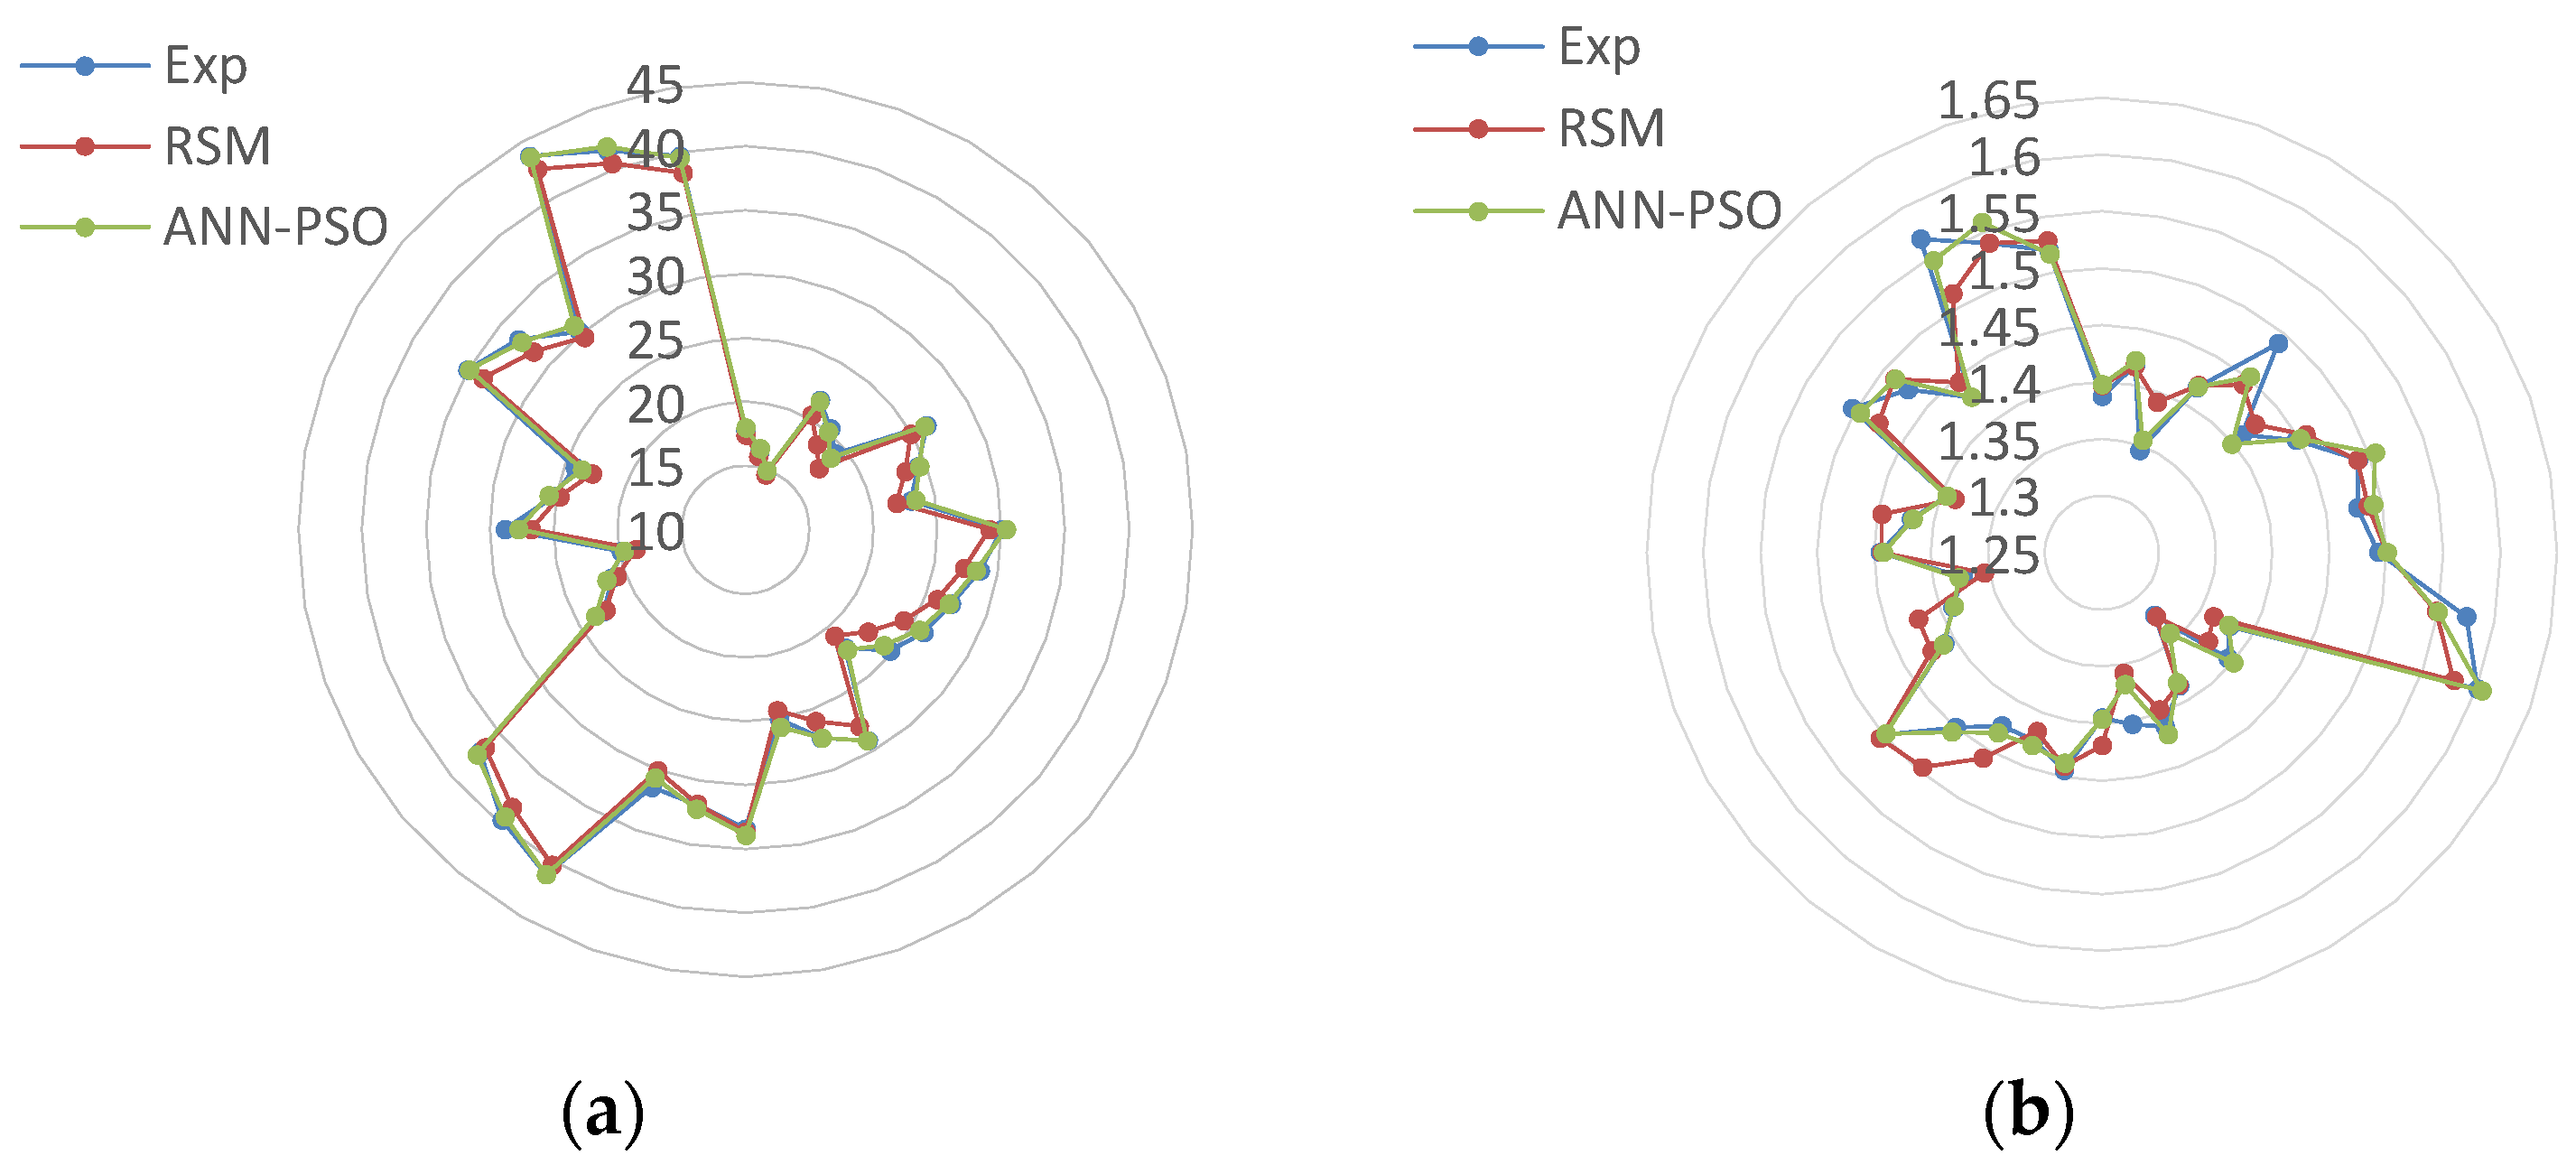
Figure 8.
Absolute percentage error (APE) in the prediction of proposed models for (a) torque and (b) Fd-out.
Figure 8.
Absolute percentage error (APE) in the prediction of proposed models for (a) torque and (b) Fd-out.
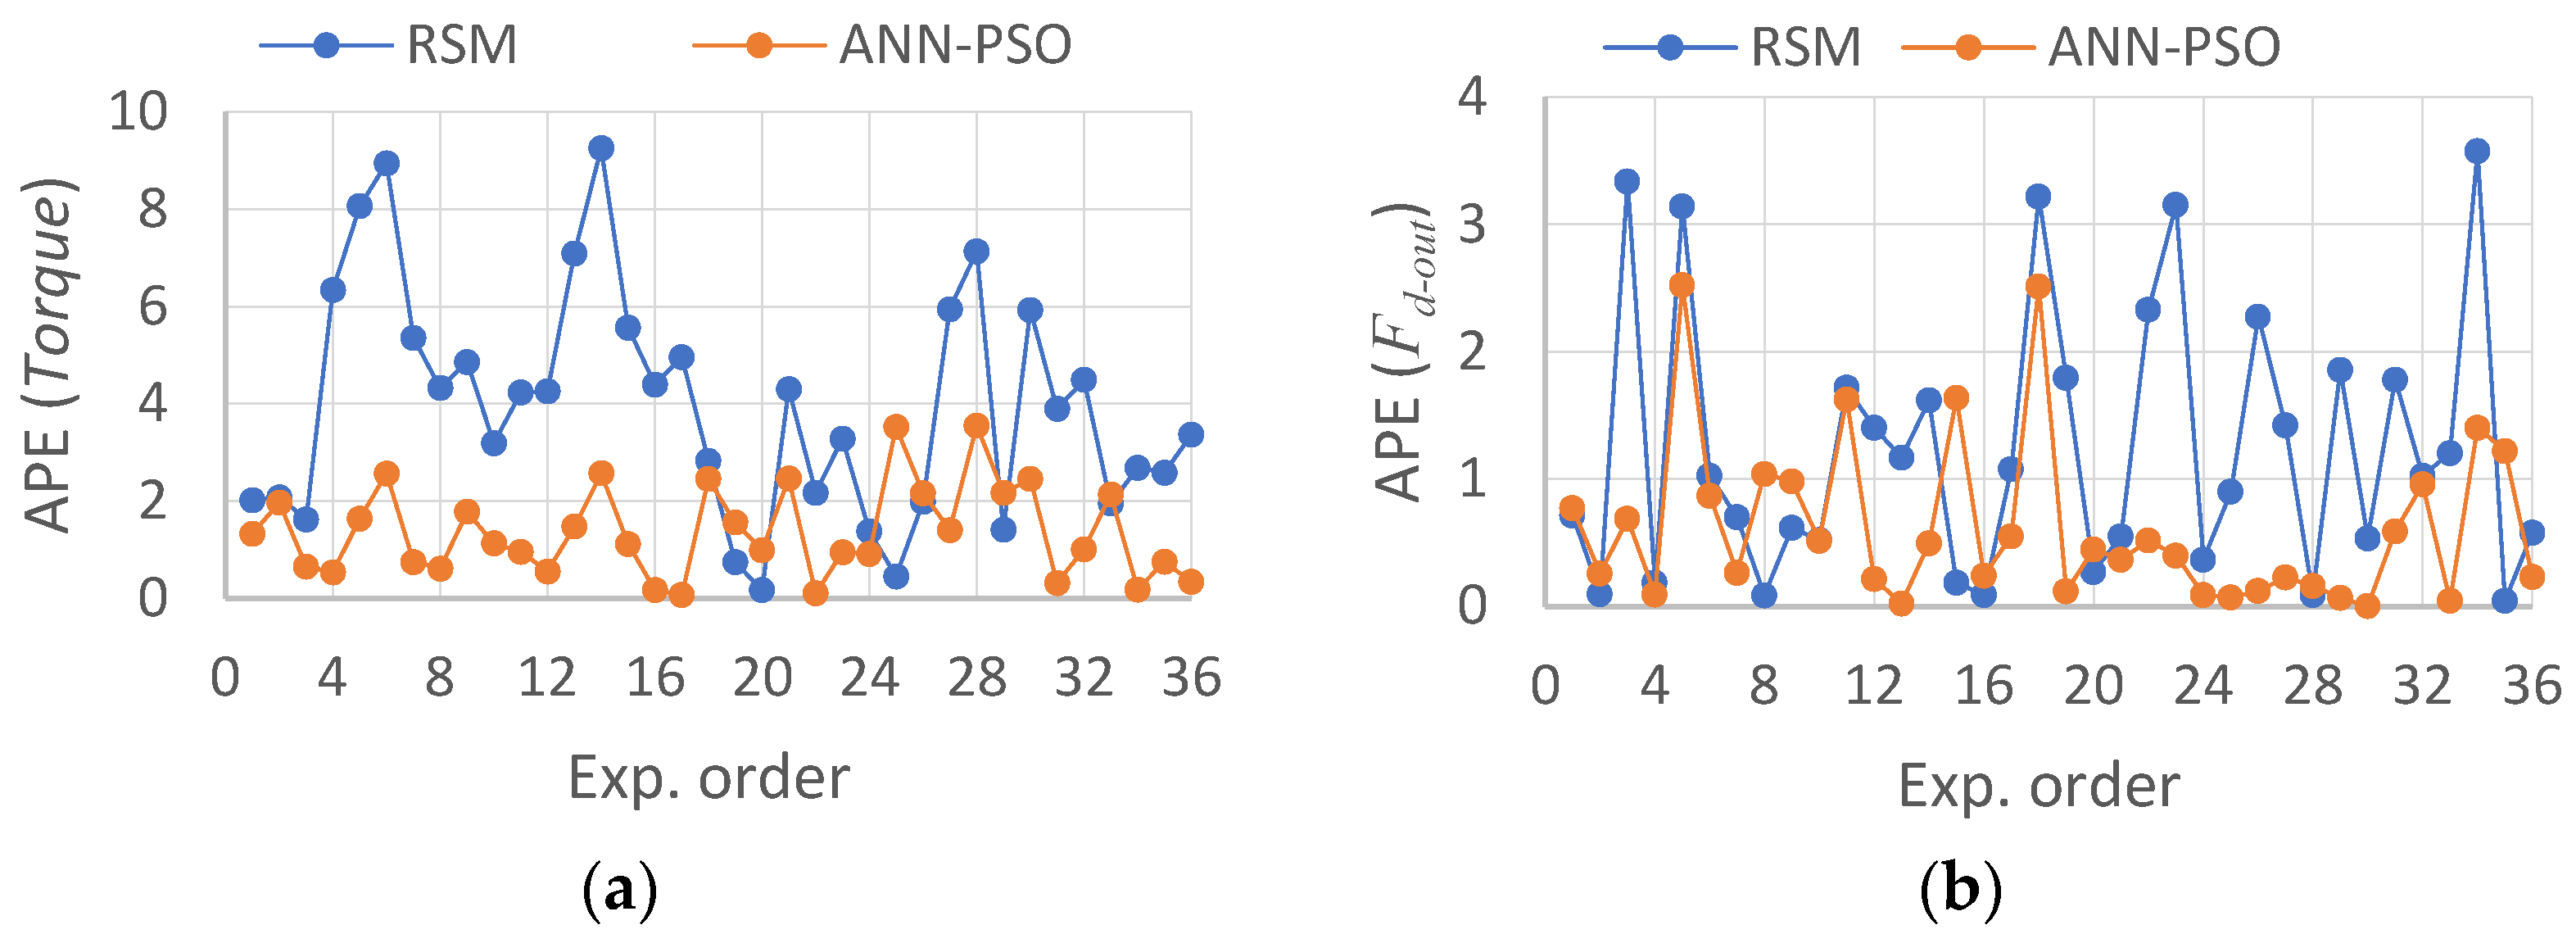
Figure 9.
Contour plot of desirability for Fd-out and torque.

Figure 10.
Multi-objective optimization ramp function for torque and Fd-out.


Table 1.
Material details of the used twist drills.
| Materials of Used Drill | Geometries | ||
|---|---|---|---|
| Material Grade | K200 | D (mm) | 6 |
| ISO Code | K20~K40 | Flute Length (mm) | 28 |
| Tungsten carbide (WC) | 90% | Overall Length (mm) | 66 |
| Cobal (Co) | 10% | Helix Angle | 30° |
| Grain Size (µm) | 0.5~0.8 | Rake Angle | 30° |
| Density (g/cm3) | 14.4 | Clearance Angle | 12° |
| Hardness (HRA) | 91.3 | Point Angles | 100° |
| Rupture Strength Transverse (MPa) | 3920 | Chisel Edge Length (mm) | 0.3 |
| KIC (MPa·m1/2) | 10.5 | ||
Table 2.
Full factorial design.
| Factors | Levels | |||
|---|---|---|---|---|
| 1 | 2 | 3 | 4 | |
| Feed, f (mm/r) | 0.025 | 0.05 | 0.1 | 0.2 |
| Spindle speed, N (rpm) (Cutting speed, m/min) | 400 (7.5) | 800 (15) | 1600 (30) | - |
| Sample thickness, t (mm) | 2.6 | 5.3 | 7.7 | - |
Table 3.
The variation of torque.
| Spindle Speed, N (rpm) | Feed, f (mm/r) | Thickness, t (2.6 mm) | Thickness, t (5.3 mm) | Thickness, t (7.7 mm) |
|---|---|---|---|---|
| 400 | 0.025 | 17.76 | 26.10 | 22.75 |
| 0.05 | 21.70 | 29.08 | 28.81 | |
| 0.1 | 26.33 | 33.39 | 35.07 | |
| 0.2 | 30.04 | 41.19 | 43.74 | |
| 800 | 0.025 | 16.13 | 24.74 | 21.09 |
| 0.05 | 20.35 | 27.34 | 25.12 | |
| 0.1 | 24.33 | 31.85 | 33.17 | |
| 0.2 | 28.58 | 39.69 | 41.56 | |
| 1600 | 0.025 | 14.83 | 22.08 | 19.91 |
| 0.05 | 19.19 | 25.06 | 24.21 | |
| 0.1 | 23.10 | 31.45 | 30.22 | |
| 0.2 | 27.10 | 37.07 | 39.64 |
Table 4.
The variation of delamination factor.
| Spindle Speed, N (rpm) | Feed, f (mm/r) | Thickness, t (2.6 mm) | Thickness, t (5.3 mm) | Thickness, t (7.7 mm) |
|---|---|---|---|---|
| 400 | 0.025 | 1.39 | 1.38 | 1.41 |
| 0.05 | 1.42 | 1.39 | 1.44 | |
| 0.1 | 1.45 | 1.39 | 1.50 | |
| 0.2 | 1.49 | 1.43 | 1.57 | |
| 800 | 0.025 | 1.42 | 1.39 | 1.39 |
| 0.05 | 1.49 | 1.41 | 1.42 | |
| 0.1 | 1.49 | 1.44 | 1.47 | |
| 0.2 | 1.58 | 1.45 | 1.54 | |
| 1600 | 0.025 | 1.35 | 1.32 | 1.37 |
| 0.05 | 1.41 | 1.40 | 1.40 | |
| 0.1 | 1.48 | 1.43 | 1.43 | |
| 0.2 | 1.60 | 1.50 | 1.52 |
Table 5.
Contribution of control factors from ANOVA results.
| Source | Degree of Freedom | Torque (N·cm) | p-Value | Fd-out | p-Value |
|---|---|---|---|---|---|
| f (mm/r) | 3 | 65.48% | 0.000 | 64.22% | 0.000 |
| N (rpm) | 2 | 3.77% | 0.000 | 2.82% | 0.160 |
| t (mm) | 2 | 27.08% | 0.000 | 12.81% | 0.001 |
| Residual/ Error | 28 | 3.67% | 20.05% | ||
| Total | 35 |
Table 6.
Quadratic mathematical model for responses.
| Coeff. Values | ||
|---|---|---|
| Coeff. | T | Fd-out |
| B0 | 2.504821562361 | 1.4573630529957 |
| B1 | 118.92109172956 | 0.94650108016652 |
| B2 | −0.0059756624435889 | 0.00014598690410596 |
| B3 | 7.3417239905438 | −0.06642819426032 |
| B11 | −335.5708004779 | −2.1115459976105 |
| B22 | 0.000002076953125 | −6.7491319444444 × 10⁻⁸ |
| B33 | −0.62808747881869 | 0.0073693566932946 |
| B12 | −0.0015827267080745 | 0.00040208364389234 |
| B13 | 9.2268980164296 | −0.015652138293372 |
| B23 | −0.0001833230469607 | −0.00001008312417709 |
| R2 | 0.993 | 0.864 |
Table 7.
ANN–PSO architectures.
| Model | Network Structure | Mean Square Error | R-Value (R2) |
|---|---|---|---|
| Torque | 3-6-1 | 0.18 | 0.99835 (0.9967) |
| Fd-out | 3-6-1 | 0.16968 × 10−³ | 0.97892 (0.9582) |
Table 8.
Performance measures of RSM and ANN–PSO models.
| RSM | ANN–PSO | |||||
|---|---|---|---|---|---|---|
| Model | R2 | Mean Square Error | Mean Absolute Percentage Error | R2 | Mean Square Error | Mean Absolute Percentage Error |
| Torque | 0.993 | 1.4277 | 9.249 | 0.9967 | 0.18 | 3.5487 |
| Fd-out | 0.864 | 0.55 × 10⁻³ | 3.5768 | 0.9582 | 0.17 × 10⁻³ | 2.5223 |
Table 9.
Parameter ranges and goals for optimizing cutting parameters for drilling outcomes.
| Condition | Goal | Lower Limit | Upper Limit | Importance |
|---|---|---|---|---|
| Feed, f (mm/r) | In range | 0.025 | 0.2 | 3 |
| Spindle speed, N (rpm) | In range | 400 | 1600 | 3 |
| Laminate thickness, t (mm) | In range | 2.6 | 7.7 | 3 |
| Fd-out | minimize | 1.3215 | 1.60117 | 4 |
| Torque | minimize | 14.8337 | 43.7449 | 2 |
Table 10.
Response optimization using RSM for torque and delamination.
| Number | N | f | t | Fd_out | Torque | Desirability |
|---|---|---|---|---|---|---|
| 1 | 1600.000 | 0.025 | 5.433 | 1.323 | 21.968 | 0.906 |
| 2 | 1599.998 | 0.025 | 5.413 | 1.323 | 21.959 | 0.906 |
| 3 | 1599.997 | 0.025 | 5.452 | 1.323 | 21.977 | 0.906 |
| 4 | 1599.997 | 0.025 | 5.486 | 1.323 | 21.991 | 0.906 |
| 5 | 1599.990 | 0.025 | 5.366 | 1.324 | 21.935 | 0.906 |
| 6 | 1599.999 | 0.025 | 5.317 | 1.324 | 21.908 | 0.906 |
| 7 | 1599.997 | 0.025 | 5.559 | 1.323 | 22.016 | 0.906 |
| 8 | 1599.998 | 0.025 | 5.583 | 1.323 | 22.022 | 0.905 |
| 9 | 1599.999 | 0.025 | 5.237 | 1.324 | 21.856 | 0.905 |
| 10 | 1599.999 | 0.025 | 5.210 | 1.324 | 21.836 | 0.905 |
Publisher’s Note: MDPI stays neutral with regard to jurisdictional claims in published maps and institutional affiliations. |
© 2022 by the author. Licensee MDPI, Basel, Switzerland. This article is an open access article distributed under the terms and conditions of the Creative Commons Attribution (CC BY) license (https://creativecommons.org/licenses/by/4.0/).
Share and Cite
MDPI and ACS Style
Abd-Elwahed, M.S. Drilling Process of GFRP Composites: Modeling and Optimization Using Hybrid ANN. Sustainability 2022, 14, 6599. https://doi.org/10.3390/su14116599
AMA Style
Abd-Elwahed MS. Drilling Process of GFRP Composites: Modeling and Optimization Using Hybrid ANN. Sustainability. 2022; 14(11):6599. https://doi.org/10.3390/su14116599
Chicago/Turabian StyleAbd-Elwahed, Mohamed S. 2022. "Drilling Process of GFRP Composites: Modeling and Optimization Using Hybrid ANN" Sustainability 14, no. 11: 6599. https://doi.org/10.3390/su14116599
Note that from the first issue of 2016, this journal uses article numbers instead of page numbers. See further details here.