Article

Estimating Pruning-Caused Loss on Ecosystem Services of Air Pollution Removal and Runoff Avoidance

School of Forestry & Resource Conservation, National Taiwan University, Taipei 10617, Taiwan
*
Author to whom correspondence should be addressed.
Sustainability 2022, 14(11), 6637; https://doi.org/10.3390/su14116637
Submission received: 10 May 2022 / Revised: 21 May 2022 / Accepted: 25 May 2022 / Published: 28 May 2022
(This article belongs to the Section Sustainable Management)

Abstract

:
Trees provide multiple ecosystem services (ES) and are generally considered an important natural-based approach for climate change adaptation and mitigation. In urban areas, proper pruning practices can help enhance ES provided by trees, but in areas with issues of typhoons or storms, routinely intensive pruning may reduce ES. Therefore, it is critical to determine proper pruning intensity in balancing the ES provision and life/property protection. With the aim of promoting sustainable urban forestry management, we applied the i-Tree Eco to quantify ES and ES values of air pollution removal and runoff avoidance provided by a total of 87,014 Taipei street trees and developed an analytical method to estimate the potential loss caused by different pruning intensities. Based on the i-Tree Eco estimates, the Taipei street trees on average provide ES values of air pollution removal and runoff avoidance at $2.31 and $1.87 USD/tree/y, respectively. By changing the ratio of crown missing as a surrogate for different pruning intensities, we found that with a less than 25% pruning intensity, the decline ratio of ES values was relatively constant, and the potential loss was estimated at $0.47 USD/tree/y at the 25% pruning intensity. As such, in general maintenance situations, we recommend a less than 25% pruning intensity. However, during typhoon or monsoon seasons, a less than 45% pruning intensity is suggested to balance the ES provision and public safety with an estimated loss at $0.96 USD/tree/y. We also suggest creating visualization maps incorporating the potential ES and the local in situ environmental and tree conditions at a community level to support decision making for a more comprehensive management plan. Based on the framework and method developed in this study, the science-based information can be used to assist maintenance practices and highlight the potential ES values to be enhanced by choosing proper pruning intensity for a more sustainable future.

1. Introduction

Global climate has been observed and reported changes in temperature, elevated CO2 concentration, variations in the frequency and intensity of heavy precipitation events, and shifts on the timing of storms or typhoons [1]. Recent climate changes have had significant impacts on human society and may be intensified by urbanization leading to health-related and socioeconomic issues, as well as environmental problems and degradation [2]. Possible approaches and tools are needed for climate change adaptation and mitigation [3,4]. Among many possible solutions, trees are commonly used to ameliorate problems associated with urbanization and climate change [5,6]. Under the constraints of limited land in most cities, street trees are an effective landscape design to provide ecosystem services (ES) and improve the livability of metropolitan environments [7,8,9,10]. Many of the studies indicated a positive correlation between trees’ physical conditions to sequestrate greater carbon [11], remove more pollutants and ambient CO2 [12,13], and intercept larger amounts of rainfall [9,10] to mitigate climate-related issues.
In most cities, street trees are regularly maintained for attractive shapes; while in some cities encountering periodic storms and typhoons, the maintenance routine is additionally targeted at reducing life or property threats from tree failures. Among various maintenance applications, pruning in many areas has been applied as a maintenance routine to achieve multiple objectives, such as controlling pests or diseases, increasing light penetration and air movement, providing aesthetic views, raising the crown height, and improving growth forms and tree structures [14,15]. On the other hand, tree pruning implies an unavoidable loss in the provision of ES, not to mention the additional losses from inappropriate pruning-caused deterioration of tree condition, physical damage, or disease infection [14,16]. However, the potential loss of ES due to pruning has seldom been studied or discussed.
Quantification of ES values has gained increased interest as policy instruments that postulate the provision of ES as a co-production process by nature and society [17]. A widely used and open-access software, the i-Tree Eco (http://www.itreetools.org/eco/ (accessed on 1 December 2020)), has been developed and updated by the US Forest Service since 2006 to support the examination of tree structure and health based on the Urban Forest Effects (UFORE) model and can further transform the estimated ES into monetary values [18,19]. Despite the great resources, services, and multiple tools provided or embedded in the i-Tree Eco, many parameters or coefficients are not easily found in the i-Tree Eco software. Yet, they are important determinants underpinning the estimation of ES and ES values.
As a result, with the aim of promoting green urban centers of tomorrow, this study focuses on quantifying ES values provided by trees and estimating potential loss due to pruning, particularly on the climate-related ES of air pollution removal and runoff avoidance. We use a case study in Taipei to present the quantification of ES values with basic equations and detailed parameterization, demonstrate a new idea of manipulating crown missing rate as different pruning intensity for estimating the potential loss of the ES of air pollution removal and runoff avoidance, create visualization maps to support perceivable dialog between stakeholders and decision makers, and recommend proper pruning intensity for improved urban street tree management.

2. Material and Method

We have listed the main procedures of this study from assembling tree inventories for assessment of street tree community structure, to quantification of ES and ES values, evaluating the pruning effects, and visualization for decision making (Figure 1). Each procedure follows.

2.1. Assembling Tree Inventories for Assessment of Street Tree Community Structure

To estimate ES and ES values of trees to ameliorate the climate-related problems of air pollution and excessive runoff in urban areas, information on tree inventories is required. However, in many cities, it is not always readily available. This concern does not apply to Taipei because the Parks and Street Lights Office of the Taipei city government conducted street tree inventories in the city from 2015 to 2017, in compliance with Taiwan’s Forestry Law (article 38-2), and compiled a database of a total of 87,014 Taipei street trees with complete information of diameter at breast height (DBH) > 1 cm, total tree height, tree species, habitat form, and GPS coordinates.
Based on the tree inventory data, we assessed the structure of the street tree community by considering species composition, dominance, and age distribution [20]. Species composition is described by the number of species and their abundance within the community, and the importance value (IV) is used to assess the importance and dominance of a species in the tree community. Ranges of the IV for single species vary from 0 to 200. Species with higher IV are often considered dominant species in the community. To calculate the value of IV, three separated indexes are generally used [21]:
I V = R L A + R D + R F
where RLA represents the relative leaf area, RD is the relative density, and RF is the relative frequency, and can be calculated as [22]:
R L A = L e a f   a r e a   o f   a   s p e c i e s T o t a l   l e a f   a r e a   o f   a l l   s p e c i e s × 100 %  
R D = I n d i v i d u a l s   o f   a   s p e c i e s A l l   i n d i v i d u a l s   o f   a l l   s p e c i e s × 100 %  
R F = N u m b e r   o f   p l o t s   o f   a   s p e c i e s   o b s e r v e d T o t a l   n u m b e r   o f   p l o t s × 100 %  
Since the inventory of the Taipei street trees was conducted by a complete census, these was no sampling design for using the concept of plot. Therefore, RF was omitted. Therefore, IV in this study was calculated by:
I V = R L A + R D
To assess the age distribution, DBH was used to predict age based on species-specific allometric equations [23]. In this study, the Taipei street tree community was classified based on DBH into 4 classes: young trees (1.0–15.0 cm), maturing trees (15.1–30.0 cm), mature trees (30.1–60.0 cm), and old trees (>60.1 cm) [24,25].

2.2. Quantification of ES and ES Values

The ES provided by trees are typically determined by the rate of tree growth, which varies with tree species and their health conditions. The magnitude of ES can be further influenced by the environmental settings and management practices [26]. Consequently, to quantify ES, core attributes of trees (i.e., DBH, tree height, and crown size), as well as local environmental conditions, are needed. In the circumstance of the street tree inventory lacking information on the crown size (i.e., crown width and crown height), we made two assumptions for model simplification and the subsequent simulations. First, we assumed a circular shape of the crown (i.e., the crown width is the same in every direction). Second, we set the crown height ratio as 0.5 compared with a naturally open-grown tree as 0.78 [18] to reflect the reality of smaller crown height due to intensive pruning practices to avoid tree failures during typhoon or storm seasons in Taipei. After that, we calculated the leaf area and crown size of the street trees to assess the ecosystem functions using the i-Tree Eco Version 6.0.14. [18].
To estimate the ES of runoff avoidance, we applied a process-based model embedded in the i-Tree Eco that employed physically-based water balance equations based on the size of the crown and the total leaf area to account for the sum of rainfall interception and evapotranspiration and the amounts of depression storage and water infiltrated into soils [27,28,29]. The total leaf area ( L ) was estimated by an equation considering crown height (H), crown width (W), species-specific shading coefficient (S) [30], and outer surface area of a crown ( C r ) [31], with a default dieback rate (d) of 13% [26,32]:
ln L = ( α 0 + α 1 H + α 2 W + α 3 S + α 4 C r ) ( 1 d )
where α 0 = 4.3309 , α 1 = 0.2942 , α 2 = 0.7312 , α 3 = 5.7217 , and α 4 = 0.0148 . Species-specific shading coefficient (S) was estimated based on the formula [19,33]:
S = 0.0617 × ln ( D B H ) + 0.615 + c ¯ ,
where c ¯ is a species-specific coefficient. It was found that the predictions of S for individuals larger than 150 cm in DBH may be biased due to data limitations [33].
The rainfall interception process starts when the rainfall event begins until the canopy reaches its maximum canopy store capacity, which is determined by the size of leaf area and specific leaf storage of water.
The leaf area index (LAI) is a critical element associated with leaf area and specific leaf storage of water to account for the ES quantification in the i-Tree Eco, and was calculated by dividing the derived leaf area (L) by a projected canopy cover ( C c ) [19]:
LAI = L / C c
where C c can be calculated by crown width (d), where with a simplified circular shape assumption in this study, C c can be calculated as:
C c = π ( d 2 ) 2
When the canopy reaches its store capacity, the canopy starts to drip excessive precipitation out of the canopy. After the rainfall event stops, evaporation occurs. The runoff avoidance estimation also considers the condition of groundcover to be impervious or pervious for calculating the amount of depression storage, infiltration, and surface runoff [27,28,29].
The ES of air pollution removal in the i-Tree Eco is approximated by a canopy deposition model considering local climatological conditions, air pollutant concentrations, tree canopy cover, and LAI in a city-scale [29,34,35,36,37]. Daily climatological and air pollution measurements at the Taipei weather station in 2015 were assembled by the Central Weather Bureau and the Department of Environmental Monitoring and Information Management of Taiwan to calculate the pollutant flux ( F , unit: g/m2/s) by the following formula [29]:
F = V d P c
where V d is the dry deposition velocity (m/s), and P c is the observed pollutant concentration (g/m3). Dry deposition velocity ( V d ) can be separated into aerodynamic ( R a ) , quasi-laminar ( R b ), and canopy resistance ( R c ) by [38]:
V d = 1 / ( R a + R b + R c )
where R a and R b are calculated with a standard resistance formula and local weather data [34,36] and are less affected by tree characteristics [35]. It is noted that different pollutants have different R c according to their links with transpiration. For O3 and NO2, R c is calculated based on a modified hybrid of big-leaf and multilayer canopy deposition models, which combined components of stomatal resistance, mesophyll resistance, and cuticular resistance, and is influenced by photosynthetic solar radiation, air temperature, wind speed, friction velocity, CO2 concentration, and absolute humidity [35]. CO and particle matter (PM) are not directly related to transpiration, and therefore, their R c is adjusted by seasons of leaf-in or leaf-off, LAI, and wind speed [37]. Lastly, the total hourly pollution removal by trees can be calculated by multiplying the average hourly pollutant flux with total canopy coverage.
The ES values were estimated by linking a tree’s surface area to the accumulation of pollutant deposition flux and surface water storage through time [27,39] and then transformed by monetary values [19]. For comparison purposes with other studies, we used the default multipliers in the i-Tree Eco as: water ($2.36 USD/m3), air pollution removal (CO: $1,520.9 USD/t; O3 and NO2: $10,707.9 USD/t; and PM2.5: $7149.2 USD/t) [19].

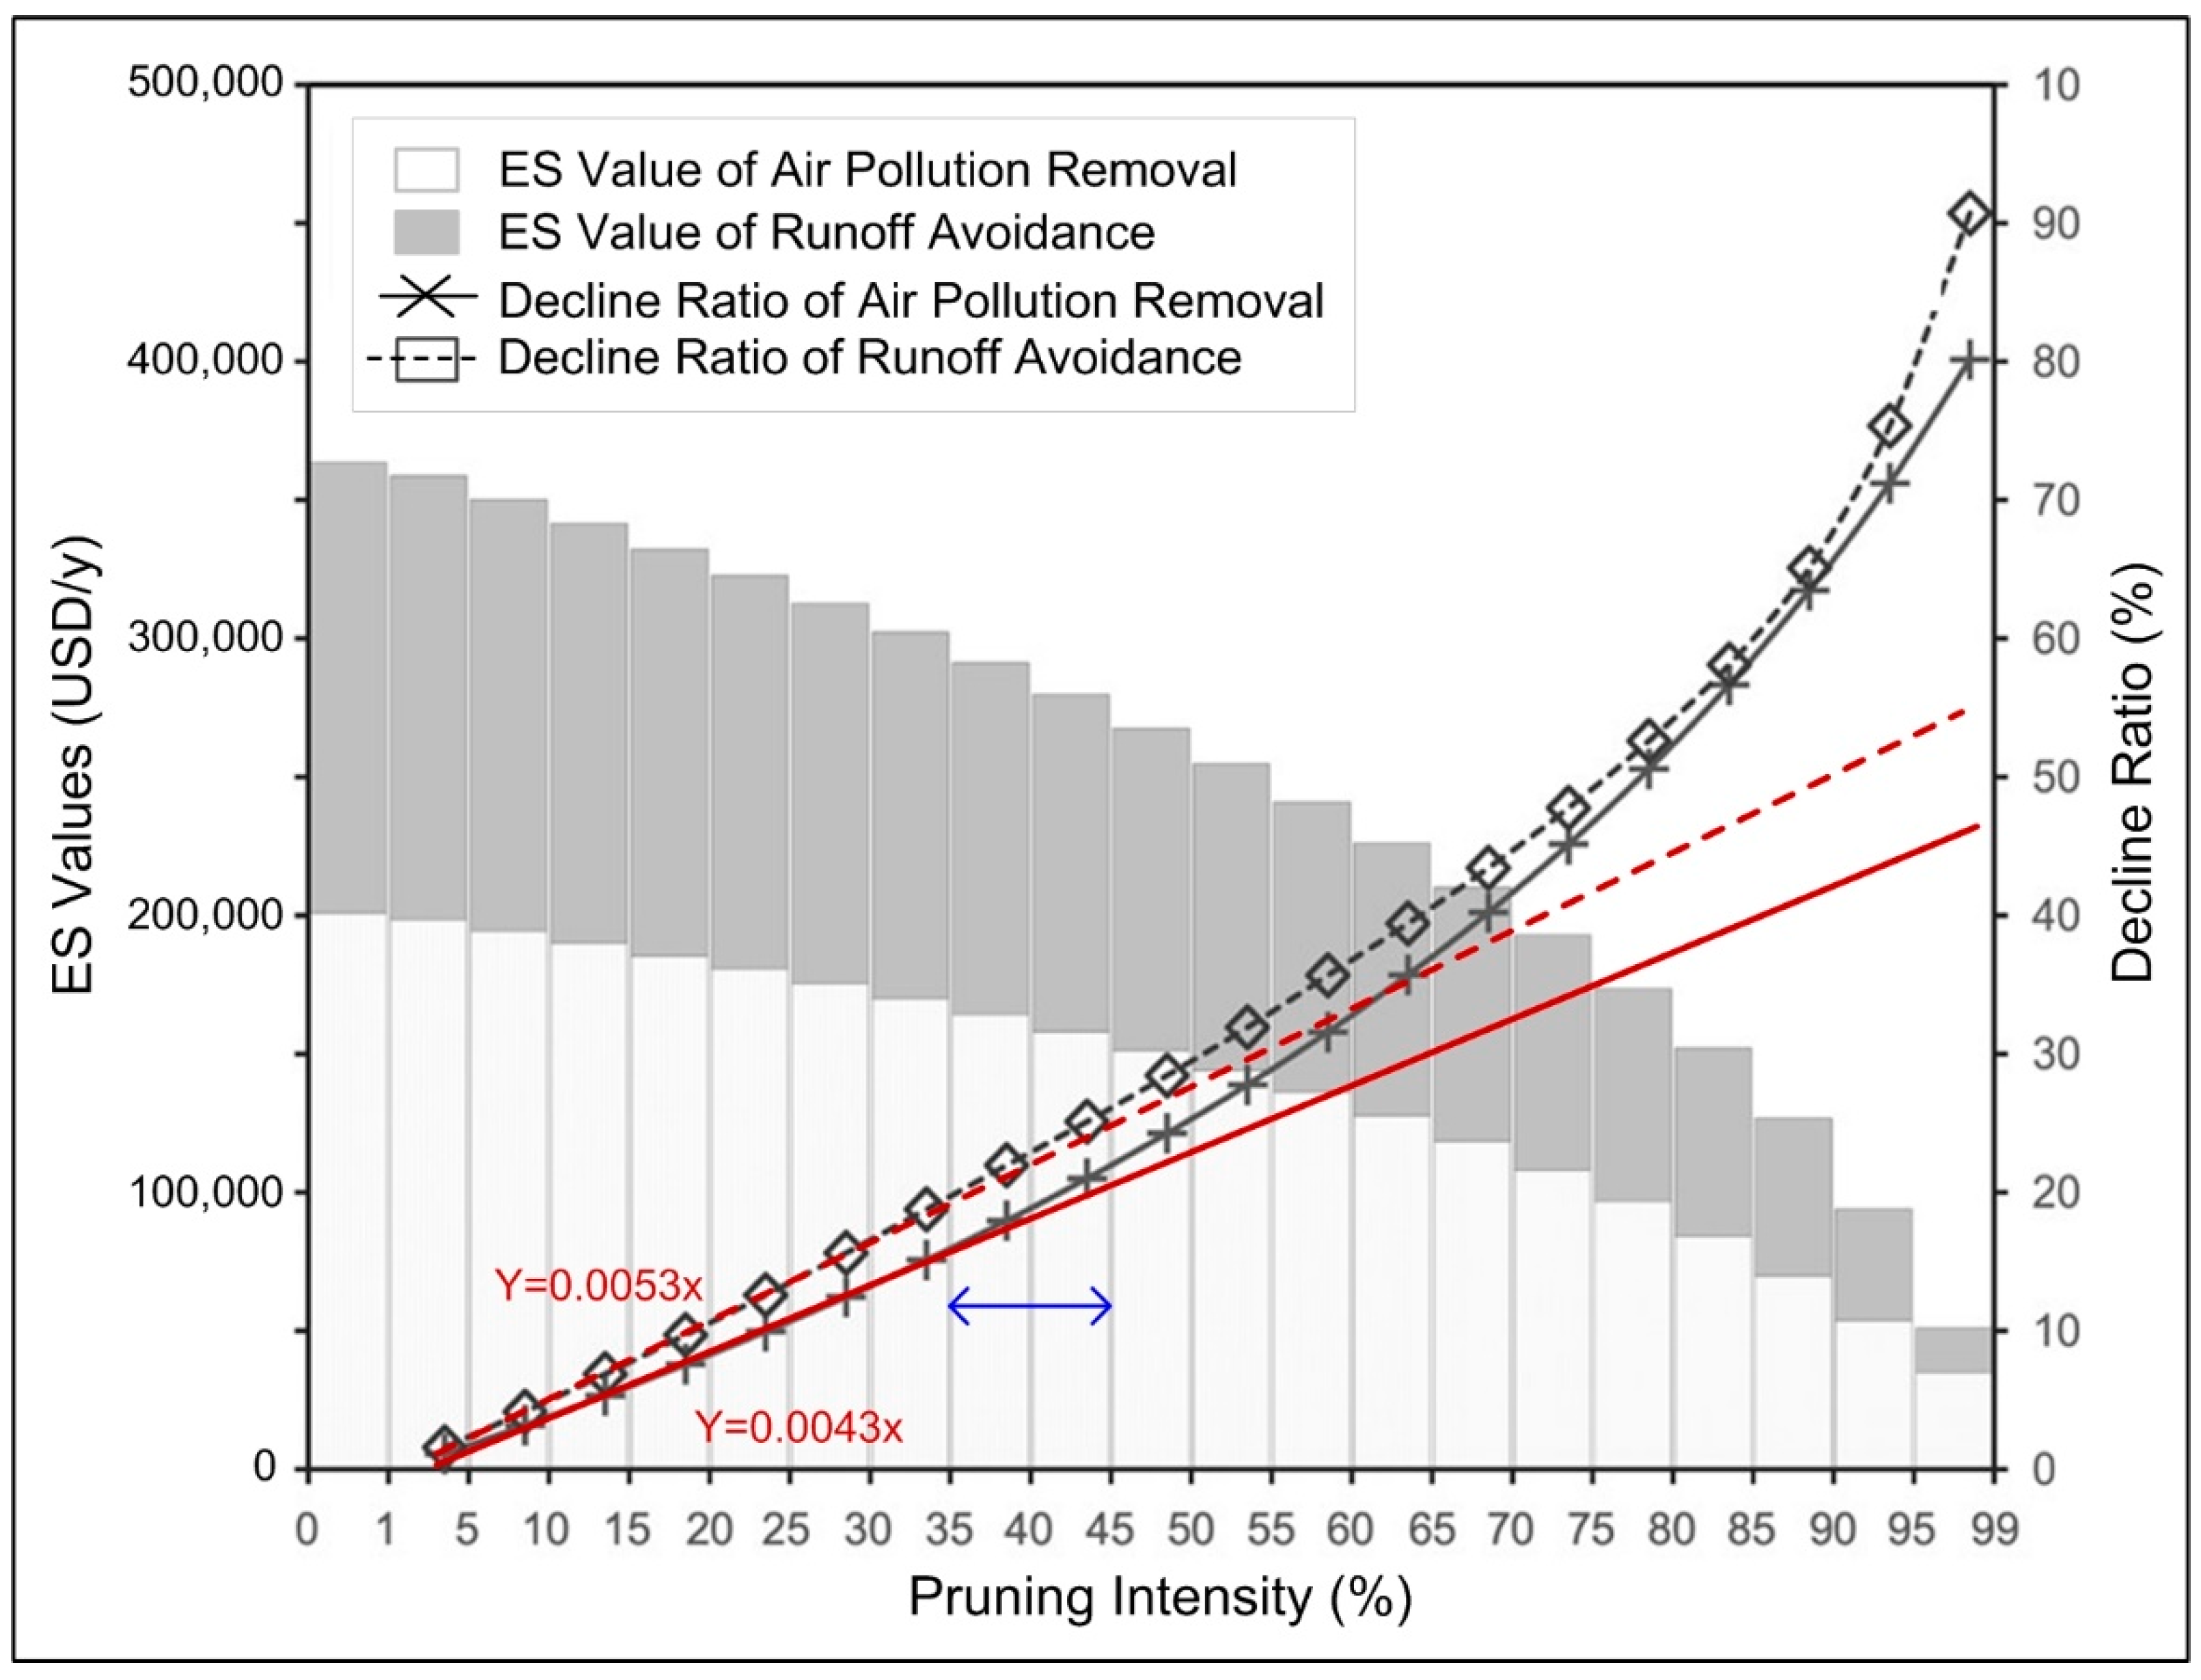
2.3. Effect of Pruning Intensity on ES and ES Values

To delineate how changes in different pruning intensities affect ES, we modeled the crown volume loss (%) induced by pruning by adjusting the individual tree’s canopy size using the variable of “crown missing” in the i-Tree Eco, to calculate the subsequent changes in crown volume, leaf area, and biomass. Then we approximated the functional change of runoff avoidance and air pollution removal [40]. However, because we did not have detailed regrowth data after pruning to account for physiological responses of photosynthesis and respiration that may be induced by changes in sunlight potential or water uptake, our estimation focused on the potential loss directly from the pruning itself and omitted issues associated with afterward physiological rate changes in up-taking air pollution gases such as CO, O3, and NO2, regrowth of leaves, or the architectural change of the trees.
The pruning intensity was set from 0% to 99% by 21 categories with a 5% difference that determined the crown missing rate to mathematically compute the associated change of the targeted ES. The 0% pruning intensity was used as the baseline to estimate the magnitude change of ES with different pruning intensity. Potential loss of the ES value was estimated by multiplying the magnitude change of ES by the associated monetary value. We calculated the decline ratio (%) as the difference between the simulated results from the baseline divided by the baseline. Based on the trend of the decline ratio, we fitted a linear curve for lower pruning intensity less than 30% to compare the deviation from the linear trend at higher pruning intensities.

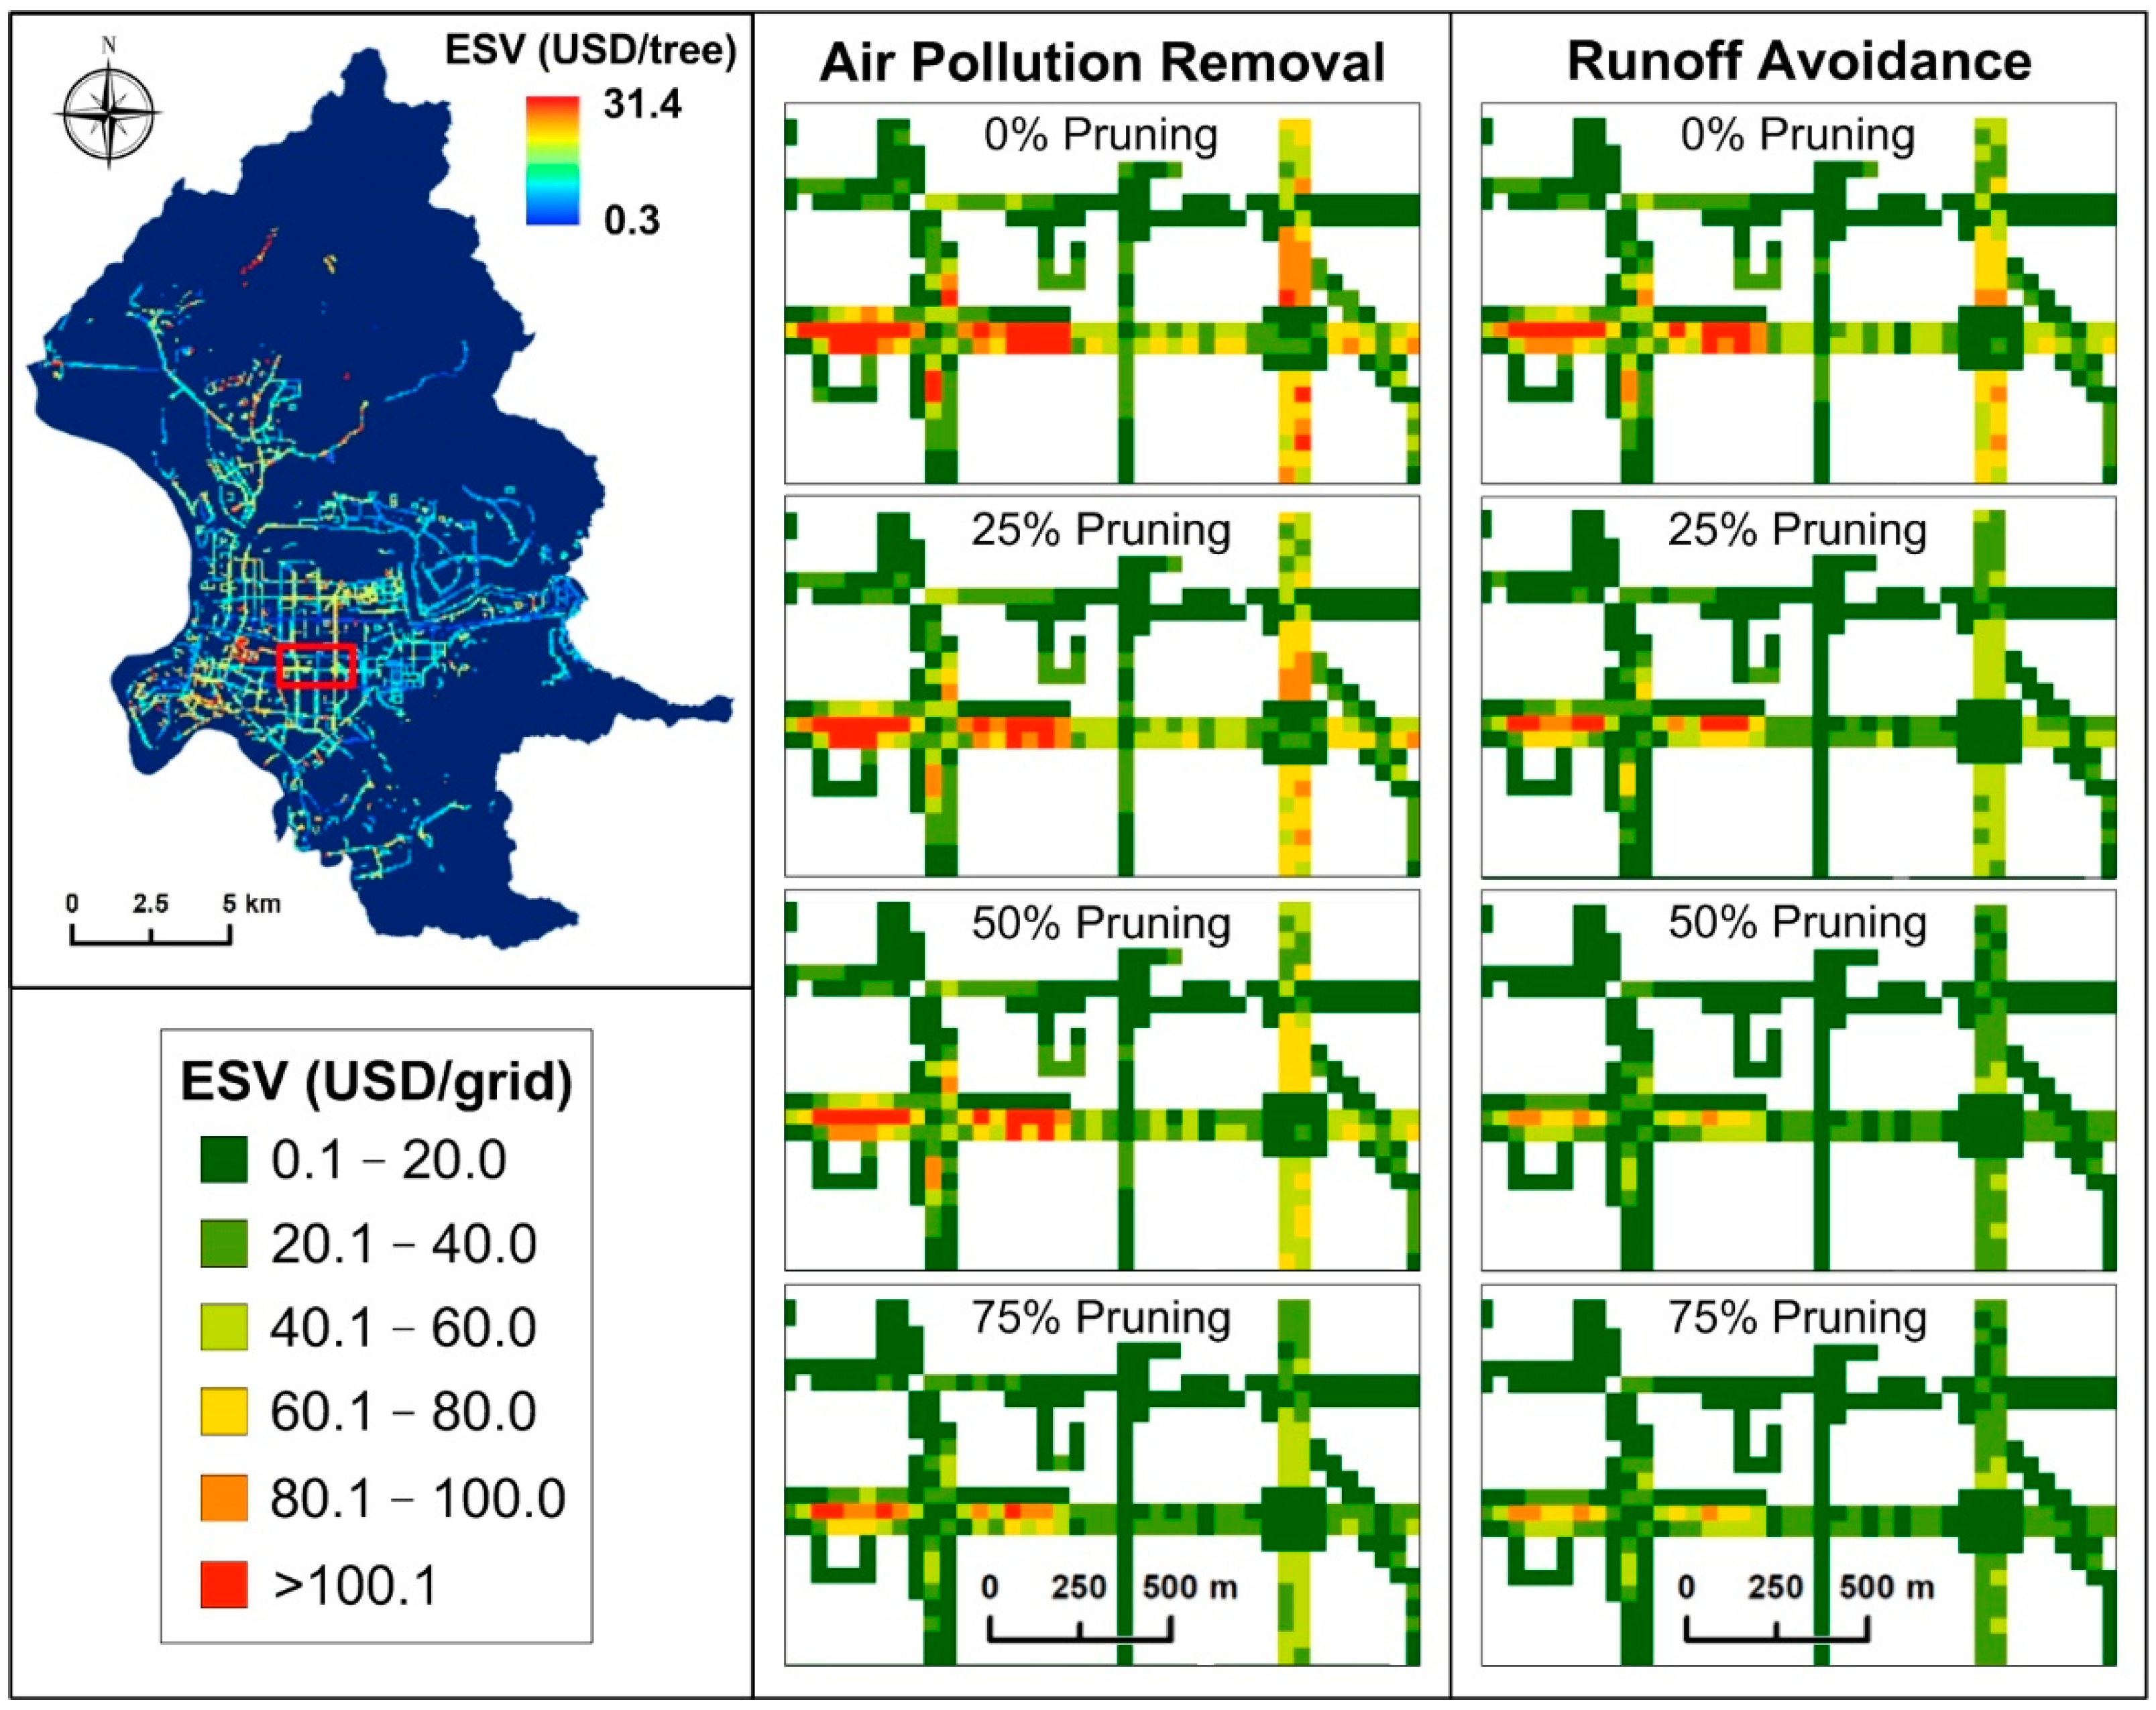
2.4. Visualization for Decision Making

To create a more comprehensive view for decision making, the single tree information was transformed into the street trees’ community configuration and structure by 50 m x 50 m grids. We produced a map to show the spatial patterns of the potential loss of ES values from pruning. The map was demonstrated in color gradients using ArcGIS 10.5 for visualizing the value changes in a landscape-scale that reflect effects from different pruning intensities for smart landscape management recommendations.

3. Results

Based on DBH, we classified the Taipei street tree community into four classes: young trees (1.0–15.0 cm), maturing trees (15.1–30.0 cm), mature trees (30.1–60.0 cm), and old trees (>60.1 cm) representing age distribution [24,25]. Results showed the Taipei street trees were mostly represented by maturing (37.9%) and mature trees (36.5%), followed by young trees (21.7%), and very few old trees (3.8%). The top five species that possessed the highest IV were Ficus microcarpa (37.0), Cinnamomum camphora (23.6), Bischofia jabanica (21.0), Koelreuteria elegans (16.4), and Melaleuca leucadendra (14.3) (Table 1).
The Taipei street trees in total eliminated 19.8 t/y of pollutants (i.e., CO: 769.1 kg/y; NO2: 4828.2 kg/y; O3: 13,047.5 kg/y; and PM2.5: 1,141.5 kg/y) valued at $0.20 million USD/y, and conserved runoff up to 68,950.5 m3/y valued at $0.16 million USD/y (Table 2). On average, each tree was estimated to provide ES values of air pollution removal and runoff avoidance at $2.31 and $1.87 USD/tree/y, respectively (Table 2). Compared with other studies centered on a similar scope of street trees, the Taipei street tree was estimated to provide ES values of air pollution removal and runoff avoidance summed at $4.18 USD/tree/y, similar to the estimated values of $6.55 USD/tree in California [41], but much lower than those estimated in Dalian ($11.32 USD/tree) and Kyoto ($15.06 USD/tree) [25,42].
Results revealed that with less than a 25% pruning intensity, the decline ratio of ES values was relatively constant, but when a greater than 35% pruning intensity was applied, the decline ratio increased greatly in a nonlinear fashion and resulted in a greater deviation to the fitted linear trend (see red lines in Figure 2). The decline ratio of runoff avoidance increased from 1.57% with a 1–5% minimal pruning intensity to 12.58% with a 21–25% pruning intensity and further to 28.45% with a 46–50% pruning intensity. At a 45% pruning intensity, the deviation between the linear trend and the estimated decline ratio was around 1.25% for runoff avoidance (Figure 2). Similarly, the decline ratio of the air pollution removal raised from 1.11% to 9.95% for a pruning intensity at 1–5% and 21–25%, respectively. The decline ratio exceeded 25% when a greater than 45% pruning intensity was applied. With a greater than 35% pruning intensity, the deviation of decline ratio to the fitted linear trend (see red lines in Figure 2) increased nonlinearly. At a 45% pruning intensity, the deviation between the linear trend and the estimated decline ratio was around 1.65% for air pollution removal. The potential loss for the summation of the two ES values was estimated at $0.47 USD/tree/y at a 25% pruning intensity, and at $0.70–0.96 USD/tree/y at a 35–45% pruning intensity (Figure 2).
Synthesizing the point data of Taipei street trees into 50 m × 50 m community groups, we produced a map showing the distribution of the cumulative ES values of air pollution removal or runoff avoidance. We found that the ES values in most areas were less than $60 USD/y either in air pollution removal or in runoff avoidance (Figure 3) with uneven spatial patterns resulting from the variations in the street tree’s size, composition, and density. Greater ES values were located in the city center along the main roads because of the long-standing older and larger trees (see the red frame in Figure 3). Zooming into the red frame, we compared the changes in ES values associated with different pruning intensities of 0%, 25%, 50%, and 75% and found different effects. Results showed greater pruning intensity effects on the value of runoff avoidance than air pollution removal. The simulated ES values of the runoff avoidance changed from greater ES values (colored in red) to lower ones (colored in orange, yellow, and greens) by a 25% pruning intensity, and after a 50% pruning intensity, no red-colored areas were found (Figure 3). In contrast, the simulated ES values of the air pollution removal decreased gradually at an intensity of 75% pruning, where we can still observe a few red-colored areas representing > $100.1 USD/y ES values (Figure 3).

4. Discussion

In this study, we evaluated the ES and ES values of air pollution removal and runoff avoidance provided by 87,014 individual street trees in Taipei using i-Tree Eco and assessed the changes due to different pruning intensities to provide science-based recommendations. Analysis results of species IV (i.e., importance value) showed that the street tree community in Taipei exhibited a codominant status [43] that mirrored the characteristics of a natural forest and was thought to be more stable than a strongly dominant community [44]. Unlike using seeds for the regeneration process to assure generational transmission in the natural environments, the dominance of urban tree species is often determined by humans and is mostly transplanted from nurseries [45]. The dominance of species, genera, and families of the plant community in urban environments is suggested no more than 10%, 20%, and 30%, respectively, of the total number of trees [46]. Based on those criteria, the Taipei street tree community has two species, India laurel fig (Ficus microcarpa) (14.9%) and autumn maple (Bischofia jabanica) (11.0%), slightly over the 10% criterion for the species composition percentage. All the information helps check if the arrangement of the city street trees is currently in good balance of species diversity with proper structure status and configuration. The more balanced the distribution is, the lower the possibility of catastrophic disease or pest outbreak [44]. In addition, many studies suggested that high tree species diversity in urban environments can help provide valuable ES and promote city resilience to severe climate change [47,48].
The age distribution analysis found more maturing and/or mature street trees than young ones in the city, which provide greater ES due to their larger leaf areas and trunk volumes [49]. However, this may result in a situation to maintain rapid growth and could risk higher maintenance costs [50]. Currently, the ES provided by the street trees were mainly generated by those larger than 30 cm DBH individual trees, which consisted of more than 40% of the street tree community. Due to frequent anthropogenic and climatic disturbances, appropriate maintenance practices will be required to ensure the survival of the existing mature and old trees for maintaining ES. Considering the status of the Taipei street tree community and limited financial budget, we suggest that applicable and economical solutions could be: (1) planting young trees regularly, and (2) ensuring the survival of the existing mature and old trees to maximize the provision of ES by street trees.
In comparison with other studies, the ES values of air pollution removal and runoff avoidance provided by Taipei street trees were relatively low. The estimated ES values of air pollution removal by Taipei street trees were about $2.31 USD/tree but seasonal variations existed. We suspect that the rainy winter washes off air pollutants, and the deciduous species in the wintertime cannot contribute to the deposition of air pollutants [51]. However, the magnitude of air pollution removal may be underestimated due to the setup of the i-Tree Eco using a dry deposition model that did not fully depict the wet deposition process during rainy events, especially in a city like Taipei having more than 150 rainy days per year. The ES of runoff avoidance in our analysis showed a value of $1.87 USD/tree, which may be explained by the records of more than 2000 mm cumulative precipitation per year in Taipei. It may constrain the ability of trees to intercept water during short duration but high intensity rainfall events [27]. In the situations of typhoons and winter monsoons accompanying high-wind-speed strong storms, it may induce further loss of interception [10]. Similarly, street trees in Kyoto, Japan were estimated to have lower ES values of runoff avoidance at $3.26 USD/tree due to receiving more than 2000 mm heavy rain in a year [42]. In the contrast, in cities with much lower precipitation across 49 municipalities in California, USA, studies showed higher ES values of runoff avoidance at around $ 6.77 USD/tree [41].
The provision of ES is directly related to the size of leaf area and crown cover. In this regard, pruning will lead to unavoidable loss. When pruning becomes a necessary routine for cities that encounter periodic typhoons or storms, choosing proper pruning intensity is critical to minimize the loss. In our analysis, the loss of ES values by a less than 25% pruning intensity seems acceptable because the decline ratio is linearly proportional to pruning intensity (see red lines in Figure 2), which is in agreement with the recommendation from the American National Standard Institute [ANSI] [52] for annually removing less than 25% live foliage to maintain sound tree physiology. Based on our simulation, when pruning intensity is greater than 35%, the relationship between the decline ratio per unit of pruning intensity becomes nonlinear, and we observe an increasing change rate of the decline ratio with greater pruning intensity. At a 45% pruning intensity, the deviation between the linear trend and the estimated decline ratio is around 1.25% for runoff avoidance, and 1.65% for air pollution removal (Figure 2). According to this information, when facing the challenge of balancing public safety against high ES provision in the typhoon or monsoon seasons, we suggest a less than 45% pruning intensity as a trade-off for life and property protection. The practitioners should consider tree condition and operate cautiously to reduce undesired outcomes from intense pruning. In addition, we suggest using a visualization map to assist in making smart decisions on pruning intensity, considering local conditions, such as the severity of air pollution, traffic congestion, population density, and flood-prone areas, for a more comprehensive evaluation.
One should be aware that the uncertainties associated with the ES estimation can arise from multiple aspects. Take this study for instance, uncertainties can be embraced in the measurement errors during the tree inventory, the fitness of the empirical equations to the actual condition of a tree, the unavoidable simplification in the model, and the subsequent error propagation into the prediction of pruning effects. Known to have certain errors and uncertainties at the individual tree level, it is recommended to synthesize street trees into groups to help manage the urban landscape into a more sustainable scheme, considering the surrounding environments and maintenance activities on a broader scale. Our visualization map using the grid method can serve as an example to account for the potential effects of pruning practices on the ES values that incorporate tree species, tree size of DBH, canopy, height, and planting density under in situ circumstances. The grid size is easily manipulated to suit the needs of various management plans.
As demonstrated in this research, the quantification of ES undoubtedly involves complex processes and requires interdisciplinary knowledge for “rough” estimations. Although street trees provide a unique opportunity for climate change mitigation with very limited land for tree planting in urban areas, it is necessary to maintain and maximize the ES offered by trees. Article 38-2 in the Forestry Law of Taiwan obligates local governments to conduct a general inspection of trees, record, and announce the measurements. With this information, we can explore the ability of trees to tackle the climate change challenge from bottom-up inventories and field surveys and identify potential losses of ES value from pruning to convey the importance of ES, attract the attention of the public, engage the local authorities and stakeholders, raise the awareness on preserving the environment, and recognize how far away we are from the goal.

5. Conclusions

In this study, we assembled a total of 87,014 Taipei street trees’ inventory data and estimated the ES and ES values of air pollution removal and runoff avoidance using i-Tree Eco. These trees were estimated to provide ES values of air pollution removal and runoff avoidance at $2.31 and $1.87 USD/tree/y, respectively. With the new idea of using crown missing to approximate the effects from different pruning intensities, we quantified the potential loss of ES values and suggested proper pruning intensity for different circumstances. According to the simulation results, in general situations, a proper pruning intensity should consider sound tree physiology. Therefore, a less than 25% pruning intensity is recommended. However, during typhoon and monsoon seasons, a trade-off needs to be made between losses in ES and public safely, so we suggest a less than 45% pruning intensity with spatial mapping information integrating local in situ tree community status, the environmental conditions, and the potential ES values for more comprehensive decision making. We anticipate the framework and method developed in this study to assist urban forestry managers in making smart implementation strategies for a more sustainable future.

Author Contributions

S.-T.C. designed the study and acquired the funding; S.W. compiled the database; S.W. and S.-T.C. analyzed the data, prepared the figures, interpreted the results, and wrote the manuscript. All authors have read and agreed to the published version of the manuscript.

Funding

This research was funded by Belmont Forum, Urban Europe (Project no. 730254), the Ministry of Science and Technology, Taiwan, R.O.C. (MOST 107-2621-M-002-004-MY3 & MOST 108-2621-M-002-010-MY3), and Academia Sinica (AS-SS-108-03-1).

Institutional Review Board Statement

Not applicable.

Data Availability Statement

The data that support the findings of this study are available from the Website of Street Trees and Street Lights of Taipei City Government (https://geopkl.gov.taipei/# (accessed on 1 December 2020)), and the Open Weather Data of Taiwan (https://opendata.cwb.gov.tw/dataset/climate?page=1 (accessed on 1 December 2020)). Restrictions may apply to the availability of these data with the permission of the institutions.

Acknowledgments

We sincerely thank the Central Weather Bureau, Ministry of Transportation and Communication, Taiwan (R.O.C.), and Parks and Street Lights Office, Taipei City Government, for providing weather data and street tree inventory.

Conflicts of Interest

The authors declare no conflict of interest.

References

  1. IPCC. Summary for Policymakers. In Climate Change 2021: The Physical Science Basis. Contribution of Working Group I to the Sixth Assessment Report of the Intergovernmental Panel on Climate Change; Masson-Delmotte, V., Zhai, P., Pirani, A., Connors, S.L., Péan, C., Berger, S., Caud, N., Chen, Y., Goldfarb, L., Gomis, M.I., et al., Eds.; Cambridge University Press: Cambridge, UK; New York, NY, USA, 2021. [Google Scholar]
  2. Berry, B.J.L. Urbanization. In Urban Ecology: An International Perspective on the Interaction between Humans and Nature; Marzluff, J.M., Shulenberger, E., Endlicher, W., Alberti, M., Bradley, G., Ryan, C., ZumBrunnen, C., Simon, U., Eds.; Springer: Boston, MA, USA, 2008; pp. 25–48. [Google Scholar]
  3. Goulder, L.H.; Schein, A.R. Carbon taxes versus cap and trade: A critical review. Clim. Change Econ. 2013, 4, 13500010. [Google Scholar] [CrossRef]
  4. Kabisch, N.; Korn, H.; Stadler, J.; Bonn, A. (Eds.) Nature-based solutions to climate change adaptation in urban areas. In Theory and Practice of Urban Sustainability Transitions; Springer: Cham, Switzerland, 2017. [Google Scholar] [CrossRef] [Green Version]
  5. Alberti, M.; Marzluff, J.M. Ecological resilience in urban ecosystems: Linking urban patterns to human and ecological functions. Urban Ecosyst. 2004, 7, 241–265. [Google Scholar] [CrossRef]
  6. Roy, S.; Byrne, J.; Pickering, C. A systematic quantitative review of urban tree benefits, costs, and assessment methods across cities in different climatic zones. Urban For. Urban Green. 2012, 11, 351–363. [Google Scholar] [CrossRef] [Green Version]
  7. Livesley, S.J.; Mcpherson, E.G.; Calfapietra, C. The urban forest and ecosystem services: Impacts on urban water, heat, and pollution cycles at the tree, street, and city scale. J. Environ. Qual. 2016, 45, 119–124. [Google Scholar] [CrossRef] [PubMed]
  8. Berland, A.; Shiflett, S.A.; Shuster, W.D.; Garmestani, A.S.; Goddard, H.C.; Herrmann, D.L.; Hopton, M.E. The role of trees in urban stormwater management. Landsc. Urban Plan. 2017, 162, 167–177. [Google Scholar] [CrossRef] [Green Version]
  9. Alves, P.L.; Formiga, K.T.M.; Traldi, M.A.B. Rainfall interception capacity of tree species used in urban afforestation. Urban Ecosyst. 2018, 21, 697–706. [Google Scholar] [CrossRef]
  10. Nytch, C.J.; Meléndez-Ackerman, E.J.; Pérez, M.-E.; Ortiz-Zayas, J.R. Rainfall interception by six urban trees in San Juan, Puerto Rico. Urban Ecosyst. 2019, 22, 103–115. [Google Scholar] [CrossRef] [Green Version]
  11. Nowak, D.J. Atmospheric carbon dioxide reduction by Chicago’s urban forest. In Chicago’s Urban Forest Ecosystem: Results of the Chicago Urban Forest Climate Project; General Technical Report NE-186; McPherson, E.G., Nowak, D.J., Rowntree, R.A., Eds.; U.S. Department of Agriculture, Forest Service, Northeastern Forest Experiment Station: Radnor, PA, USA, 1994; pp. 83–94. Available online: https://www.nrs.fs.fed.us/pubs/gtr/gtr_ne186.pdf (accessed on 1 December 2020).
  12. Grote, R.; Samson, R.; Alonso, R.; Amorim, J.H.; Cariñanos, P.; Churkina, G.; Fares, S.; Thiec, D.L.; Niinemets, Ü.; Mikkelsen, T.N.; et al. Functional traits of urban trees: Air pollution mitigation potential. Front. Ecol. Environ. 2016, 14, 543–550. [Google Scholar] [CrossRef]
  13. Baraldi, R.; Neri, L.; Costa, F.; Facini, O.; Rapparini, F.; Carriero, G. Ecophysiological and micromorphological characterization of green roof vegetation for urban mitigation. Urban For. Urban Green. 2019, 37, 24–32. [Google Scholar] [CrossRef]
  14. Clark, J.; Matheny, N. The research foundation to tree pruning: A review of the literature. Arboric. Urban For. 2010, 36, 110–120. [Google Scholar] [CrossRef]
  15. Ryder, C.M.; Moore, G.M. The arboricultural and economic benefits of formative pruning street trees. Arboric. Urban For. 2013, 39, 17–24. [Google Scholar] [CrossRef]
  16. Fini, A.; Frangi, P.; Faoro, M.; Piatti, R.; Amoroso, G.; Ferrini, F. Effects of different pruning methods on an urban tree species: A four-year-experiment scaling down from the whole tree to the chloroplasts. Urban For. Urban Green. 2015, 14, 664–674. [Google Scholar] [CrossRef]
  17. Reed, J.; van Vianen, J.; Foli, S.; Clendenning, J.; Yang, K.; MacDonald, M.; Petrokofsky, F.; Padoch, C.; Sunderland, T. Trees for life: The ecosystem service contribution of trees to food production and livelihoods in the tropics. For. Policy Econ. 2017, 84, 62–71. [Google Scholar] [CrossRef]
  18. USDA Forest Service. i-Tree Eco User’s Manual v 6.0; U.S. Department of Agriculture, Forest Service, Northeastern Research Station: Washington, DC, USA, 2016; p. 93.
  19. Nowak, D.J. Understanding i-Tree: Summary of Programs and Methods; General Technical Report NRS-200; U.S. Department of Agriculture, Forest Service, Northern Research Station: Madison, WI, USA, 2020; p. 100, [Plus 14 Appendixes]. [Google Scholar] [CrossRef]
  20. Lohbeck, M.; Bongers, F.; Martinez-Ramos, M.; Poorter, L. The importance of biodiversity and dominance for multiple ecosystem functions in a human-modified tropical landscape. Ecology 2016, 97, 2772–2779. [Google Scholar] [CrossRef]
  21. Cottam, G.; Curtis, J.T. The use of distance measures in phytosociological sampling. Ecology 1956, 37, 451–460. [Google Scholar] [CrossRef]
  22. Curtis, J.T.; Mcintosh, R.P. The interrelations of certain analytic and synthetic phytosociological characters. Ecology 1950, 31, 434–455. [Google Scholar] [CrossRef]
  23. McPherson, E.G.; Peper, P.J. Urban tree growth modeling. Arboric. Urban For. 2012, 38, 175–183. [Google Scholar] [CrossRef]
  24. Peper, P.J.; McPherson, E.G.; Mori, S.M. Equations for predicting diameter, height, crown width, and leaf area of San Joaquin Valley street trees. J. Arboric. 2001, 27, 306–317. Available online: https://www.fs.fed.us/psw/topics/urban_forestry/products/cufr_94_PP01_39.pdf (accessed on 1 December 2020). [CrossRef]
  25. Wang, X.; Yao, J.; Yu, S.; Miao, C.; Chen, W.; He, X. Street trees in a Chinese forest city: Structure, benefits and costs. Sustainability 2018, 10, 674. [Google Scholar] [CrossRef] [Green Version]
  26. Nowak, D.J.; Crane, D.E.; Stevens, J.C.; Hoehn, R.E.; Walton, J.T.; Bond, J. A ground-based method of assessing urban forest structure and ecosystem services. Arboric. Urban For. 2008, 34, 347–358. [Google Scholar] [CrossRef]
  27. Wang, J.; Endreny, T.A.; Nowak, D.J. Mechanistic simulation of tree effects in an urban water balance model. J. Am. Water Resour. Assoc. 2008, 44, 75–85. [Google Scholar] [CrossRef]
  28. Hirabayashi, S. i-Tree Eco Precipitation Interception Model Descriptions v. 1.3; U.S. Department of Agriculture, Forest Service: Washington, DC, USA; Davey Tree Expert Co., and Other Cooperators: Kent, OH, USA, 2013; p. 21. Available online: https://www.itreetools.org/documents/61/iTree_Eco_Precipitation_Interception_Model_Descriptions.pdf (accessed on 10 May 2022).
  29. Hirabayashi, S. Air Pollutant Removals, Biogenic Emissions and Hydrologic. Estimates for i-Tree Applications v. 1.1; U.S. Department of Agriculture, Forest Service: Washington, DC, USA; Davey Tree Expert Co., and Other Cooperators: Kent, OH, USA, 2016; p. 57. Available online: https://www.itreetools.org/documents/112/Air_Pollutant_Removals_Biogenic_Emissions_and_Hydrologic_Estimates_for_iTree_v6_Applications.pdf (accessed on 10 May 2022).
  30. McPherson, E.G. Energy-Conserving Site Design; Landscape Architecture Foundation: Washington, DC, USA, 1984; p. 325. [Google Scholar]
  31. Nowak, D.J. Estimating leaf area and leaf biomass of open-grown deciduous urban trees. For. Sci. 1996, 42, 504–507. [Google Scholar]
  32. Nowak, D.J.; Crane, D.E.; Stevens, J.C.; Ibarra, M. Brooklyn’s Urban Forest; General Technical Report NE-290; U.S. Department of Agriculture, Forest Service, Northeastern Research Station: Newtown Square, PA, USA, 2002; p. 107. [Google Scholar]
  33. McPherson, E.G.; Xiao, Q.; van Doorn, N.S.; Johnson, N.; Albers, S.; Peper, P.J. Shade factors for 149 taxa of in-leaf urban trees in the USA. Urban For. Urban Green. 2018, 31, 204–211. [Google Scholar] [CrossRef]
  34. Killus, J.P.; Meyer, J.P.; Durran, D.R.; Anderson, G.E.; Jerskey, T.N.; Reynolds, S.D.; Ames, J. Continued Research in Mesoscale Air Pollution Simulation Modeling, Volume V: Refinements in Numerical Analysis, Transport, Chemistry, and Pollutant Removal; EPA-600/384-095a; U.S. Environmental Protection Agency: Research Triangle Park, NC, USA, 1984. [Google Scholar]
  35. Pederson, J.R.; Massman, W.J.; Mahrt, L.; Delany, A.; Oncley, S.; Hartog, G.D.; Neumann, H.H.; Mickle, R.E.; Shaw, R.H.; Paw U, K.T.; et al. California ozone deposition experiment: Methods, results, and opportunities. Atmos. Environ. 1995, 29, 3115–3132. [Google Scholar] [CrossRef]
  36. Nowak, D.J.; McHale, P.J.; Ibarra, M.; Crane, D.; Stevens, J.; Luley, C. Modeling the effects of urban vegetation on air pollution. In Air Pollution Modeling and Its Application, XII; Gryning, S.E., Chaumerliac, N., Eds.; Plenum Press: New York, NY, USA, 1998; pp. 399–407. [Google Scholar]
  37. Nowak, D.J.; Crane, D.E.; Stevens, J.C. Air pollution removal by urban trees and shrubs in the United States. Urban For. Urban Green. 2006, 4, 115–123. [Google Scholar] [CrossRef]
  38. Baldocchi, D.D.; Hicks, B.B.; Camara, P. A canopy stomatal resistance model for gaseous deposition to vegetated surfaces. Atmos. Environ. 1987, 21, 91–101. [Google Scholar] [CrossRef]
  39. Nowak, D.J.; Crane, D.E. The Urban Forest Effects UFORE model: Quantifying urban forest structure and functions. In Integrated Tools for Natural Resources Inventories in the 21st Century; General Technical Report, NC-212; Hansen, M., Burk, T., Eds.; U.S. Department of Agriculture, Forest Service, Pacific Southwest Research Station: St. Paul, MN, USA, 2000; pp. 714–720. Available online: https://www.nrs.fs.fed.us/pubs/gtr/gtr_nc212/gtr_nc212_714.pdf (accessed on 1 December 2020).
  40. Schomaker, M.E.; Zarnoch, S.J.; Bechtold, W.A.; Latelle, D.J.; Burkman, W.G.; Cox, S.M. Crown-Condition Classification: A Guide to Data Collection and Analysis; General Technical Report SRS-102; U.S. Department of Agriculture, Forest Service, Southern Research Station: Asheville, NC, USA, 2007; p. 78. Available online: https://www.srs.fs.usda.gov/pubs/gtr/gtr_srs102.pdf (accessed on 1 December 2020).
  41. Mcpherson, E.G.; van Doorn, N.; de Goede, J. Structure, function and value of street trees in California, USA. Urban For. Urban Green. 2016, 17, 104–115. [Google Scholar] [CrossRef] [Green Version]
  42. Tan, X.; Hirabayashi, S.; Shibata, S. Estimation of ecosystem services provided by street trees in Kyoto, Japan. Forests 2021, 12, 311. [Google Scholar] [CrossRef]
  43. Mcpherson, E.G.; Rowntree, R.A. Using structural measures to compare twenty-two U.S. street tree populations. Landsc. J. 1989, 8, 13–23. [Google Scholar] [CrossRef]
  44. Mcpherson, E.G.; Kotow, L. A municipal forest report card: Results for California, USA. Urban For. Urban Green. 2013, 12, 134–143. [Google Scholar] [CrossRef]
  45. Pincetl, S.; Gillespie, T.; Pataki, D.E.; Saatchi, S.; Saphores, J.D. Urban tree planting programs, function or fashion? Los Angeles and urban tree planting campaigns. GeoJournal 2013, 78, 475–493. [Google Scholar] [CrossRef]
  46. Santamour, F.S., Jr. Trees for urban planting: Diversity, uniformity, and common sense. In Proceedings of the Seventh Conference of the Metropolitan Tree Improvement Alliance (METRIA), Mills River, NC, USA, 11–12 June 1990; Volume 7, pp. 57–65. [Google Scholar]
  47. Pandey, R.K.; Kumar, H. Tree species diversity and composition in urban green spaces of Allahabad City (UP). Plant Arch. 2018, 18, 2687–2692. Available online: http://www.plantarchives.org/18-02/2687-2692%20(4426).pdf (accessed on 1 December 2020).
  48. Pickett, S.T.A.; Cadenasso, M.L.; Grove, J.M.; Groffman, P.M.; Band, L.E.; Boone, C.G.; Burch, W.R.; Crimmond, C.S.B.; Hom, J.; Jenkins, J.C.; et al. Beyond urban legends: An emerging framework of urban ecology, as illustrated by the Baltimore Ecosystem Study. BioScience 2008, 58, 139–150. [Google Scholar] [CrossRef]
  49. Millward, A.A.; Sabir, S. Benefits of a forested urban park: What is the value of Allan Gardens to the city of Toronto, Canada? Landsc. Urban Plan. 2011, 100, 177–188. [Google Scholar] [CrossRef]
  50. Vogt, J.M.; Hauer, R.J.; Fischer, B.C. The costs of maintaining and not maintaining the urban forest: A review of the urban forestry and arboriculture literature. Arboric. Urban For. 2015, 41, 293–323. [Google Scholar] [CrossRef]
  51. Selmi, W.; Weber, C.; Rivière, E.; Blond, N.; Mehdi, L.; Nowak, D. Air pollution removal by trees in public green spaces in Strasbourg city, France. Urban For. Urban Green. 2016, 17, 192–201. [Google Scholar] [CrossRef] [Green Version]
  52. American National Standard Institute [ANSI]. ANSI A300, Part 1–Tree, Shrub and Other Woody Plant Management–Standard Practice Pruning; Tree Care Industry Association: Londonderry, NH, USA, 2008. [Google Scholar]
Figure 1. The framework and procedure of this study.
Sustainability 14 06637 g001
Figure 2. Change in ES values of runoff avoidance and air pollution removal (bar plot) and the associated decline ratio (line) with a fitted linear trend (red line) under different pruning intensities.
Sustainability 14 06637 g002
Figure 3. Mapping the ES values distribution provided by street trees in Taipei city by 50 m × 50 m grids and zooming into the simulated results of 0%, 25%, 50%, and 75% pruning intensities on the ES values of runoff avoidance and air pollution removal.
Sustainability 14 06637 g003
Table 1. The quantity (N), importance value (IV), and parameters used to calculate tree growth, including species-specific shading coefficient ( c ¯ ), range of shading coefficient (S) by DBH classification, and conversion factor ( γ , g/m2) of the top 10 street tree species in Taipei.
SpeciesNIV c ¯ Range of Shading Coefficient (S) γ g/m2
YoungMaturingMatureOld
Ficus microcarpa12,98537.00.0066790.62–0.790.79–0.880.83–0.870.87–0.9882.62
Bischofia jabanica952221.00.0314870.58–0.750.75–0.880.79–0.840.84–0.91178.57
Cinnamomum camphora862923.60.0176350.63–0.800.80–0.930.84–0.890.89–0.9267.57
Liquidamber formosana678513.60.0212530.64–0.800.80–0.940.85–0.890.89–0.9245.91
Koelreuteria elegans666916.40.0165860.60–0.770.77–0.900.81–0.850.85–0.8680.81
Melaleuca leucadendra491714.30.0454970.57–0.620.74–0.870.78–0.820.82–0.87130.34
Alstonia scholaris42278.10.005580.62–0.790.79–0.920.83–0.870.87–0.92148.70
Terminalia mantaly25424.90.0648230.55–0.720.72–0.850.76–0.800.80–0.81130.34
Lagerstroemia speciosa20983.40.0452150.57–0.740.74–0.870.78–0.82NA130.34
Millettia pinnata20084.00.0303100.58–0.750.75–0.890.79–0.840.84–0.84152.36
Table 2. The magnitude of the ES and ES values provided by Taipei street trees.
ESMagnitudeMonetary Value
TotalAverageTotalAverage
Annual Air Pollution Removal19.8 t/y227.3 g/tree/y$0.20 million USD/y$2.31 USD/tree/y
(CO: 769.1 kg/y;(CO: 8.8 g/tree/y;
NO2: 4828.2 kg/y;NO2: 55.5 g/tree/y
O3: 13047.5 kg/y;O3: 149.9 g/tree/y;
PM2.5: 1141.5 kg/y)PM2.5: 13.1 g/tree/y)
Annual Runoff Avoidance68950.5 m3/y0.8 m3 /tree/y$0.16 million USD/y$1.87 USD/tree/y
Publisher’s Note: MDPI stays neutral with regard to jurisdictional claims in published maps and institutional affiliations.

