Abstract
Conservation and mitigation banks allow their proponents to buy credits to offset the negative residual impacts of their development projects with the goal of no net loss (NNL) in the ecosystem function and habitat area. However, little is known about the extent to which these bank transactions achieve NNL. We synthesized and reviewed 12,756 transactions in the United States which were related to meeting area and ecological equivalence (n = 4331) between the approved negative impact and offset. While most of these transactions provided an offset that was equal to or greater than the impacted area, approximately one quarter of the transactions, especially those targeting wetlands, did not meet ecological equivalence between the impact and offset. This missing ecological equivalence was often due to the significantly increasing use of preservation, enhancement, and rehabilitation over creating new ecosystems through establishment and re-establishment. Stream transactions seldom added new ecosystem area through creation but mainly used rehabilitation in order to add offset benefits, in many cases leading to a net loss of area. Our results suggest that best practice guidance on habitat creation as well as the incentivization of habitat creation must increase in the future to avoid net loss through bank transactions and to meet the ever-accelerating global changes in land use and the increased pressure of climate change.
1. Introduction
Land-use development has steadily increased in recent decades, leading to significant losses in biodiversity and large-scale habitat degradation and fragmentation on a global scale [1,2,3]. Driven by stakeholders, such as policymakers, financial institutions, non-governmental organizations (NGOs), and industry, conservation efforts have shifted from simply protecting certain species or areas to developing frameworks and approaches that are aimed to preserve a diverse array of functions and ecosystems services, as well as species diversity, adaptively and sustainably [4,5]. Offsetting is one such approach that has been widely adopted into legislation across the globe (e.g., Natura 2000 and the Installation Classified for the Protection of the Environment (ICPE) in France, Environmental Impact Assessment legislation (EIA) in Europe, the Clean Water Act and Endangered Species Act in the United States, and the Biodiversity Offset Scheme and Victorian Native Vegetation Framework in Australia; [4,5,6,7,8,9]). Offsetting is based on the principle that negative impacts on a species or ecosystem will be compensated for at the impact site (on-site) or somewhere else (offsite). The underlying principle of offsetting is that there is no net loss (NNL) of habitat area (with a minimum of a 1:1 ratio of gains to losses), function, condition (quality), biodiversity, services, or other defined equivalency targets (Figure 1a; [5,8,9]).
The use of banking has been established as an increasingly popular and constantly evolving mechanism for delivering a required offset. Unlike traditional offsetting mechanisms, which are proponent-led (i.e., the impact’s proponent is responsible for the offset’s approval and implementation), banking allows the proponent to purchase credits using an accreditation system to secure gains elsewhere (Figure 1b,c; [10,11,12]).
Banking features many similarities to the proponent-led compensation mechanism, as the offset that is provided by the bank is the last step in the mitigation hierarchy [10,11,12]. Banks are composed of the banking instrument (a formal agreement between the owner/sponsor and the regulatory agency), physical banking areas (managed through preservation, enhancement, etc.), service area (the geographic area in which a bank can sell credits to a proponent), and the Interagency Review Team. Banks can be created and managed by government agencies, industry, NGOs, or private entities [13]. In North America, banking types are divided into (wetland and stream) mitigation banks, conservation banks, In-Lieu Fee programs (ILFs), and umbrella banks [13,14,15,16].
The banking mechanism features some unique differences when it is compared to traditional proponent-led offsets. Firstly, the act of moving responsibility away from the proponent reduces the time and potentially the monetary investments that are required from the proponent [13,16,17]. Secondly, the perpetuity requirements for the banks are often met more successfully due to the potential for the banks to rely on more extensive financial means and sponsorships as well as better scientific and on-the-ground implementation support, as opposed to proponent-led offsets [18,19]. Similarly, banking in the North American context of proponent-led versus banking-led offsets can reduce risk since the legal liability and responsibility for any ecological offsets’ failures are transferred to the bank [19,20]. While offsetting creates a market-driven environment, in the case of banking it allows landowners to use their land for conservation purposes rather than exploiting its resources. However, this incentivized form of ecosystem stewardship requires the loss of ecosystem aspects, services, or biodiversity elsewhere. Banking is well suited for preserving high-quality habitats as well as securing larger areas of connected habitat, thus ensuring better connectivity, as opposed to a patchwork of offsets [16]. These benefits are also in the interest of the public as they allow time-sensitive projects to be actualized sooner [16].
Banking faces many of the same technical issues as traditional offsetting mechanisms, such as achieving ecological equivalency between the impact and offset [19,21,22]. Further issues include poor transparency in the reporting and collection of data, as well as the lack of resources that are required to enforce long-term monitoring by regulatory agencies [18,23]. Some banks struggle with the inability to secure the necessary endowment funds for perpetual management, which can lead to management and sponsorship changes or the bank’s closure [24,25]. There has also been a disjunction between the regulatory requirements and ecosystem function, meaning that compliance with regulation does not necessarily lead to good ecosystem function [21,22,25,26]. Furthermore, unavoidable long-term losses at the impact site and offset degradation over time, as well as the loss of irreplaceable ecosystem aspects, are frequently insufficiently accounted for in the initial project and offset planning process due to high degrees of uncertainty [26,27]. The main, persisting issue for banks is the overuse of preserving habitat areas of low ecological value or species that are not in immediate danger. This can have a similar effect wherein true ecosystem equivalency is not met or the multi-dimensional ecosystem services or biodiversity values are not considered (Figure 1c; [18,19,21,23,28]).
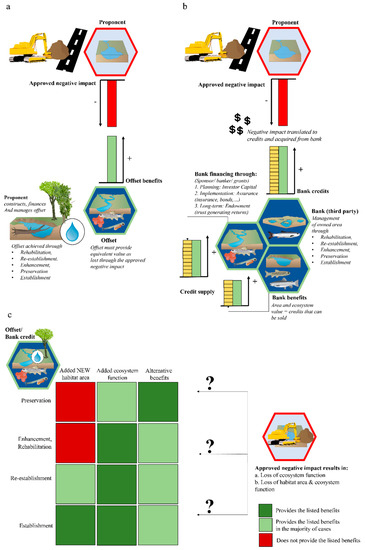
Figure 1.
Steps taken allowing for harmful impact to be compensated for through an equivalent or larger offset. (a) Example of impact to offset translation through banking credits. (b) Commonly accepted benefit provision through different offset methods (preservation, enhancement, rehabilitation, re-establishment, or establishment. (c) Figure content based on [9,17,20]. (Digital symbols attribution: Jason C. Fisher; Tracey Saxby; Emily Nastase; Jane Hawkey; [29]).

Unified legislation and policy guidelines were released in 1995 in the United States as part of the Clean Water Act (CWA 404) regarding the role and the establishment of banks. Many states and regions laid their banking groundwork and practices independently, which resulted in distinct differences between established banking networks across regions in the United States [30,31]. To unify banking practices, the United States Army Corps of Engineers (USACE) and the Environmental Protection Agency (USEPA), as well as the Fish and Wildlife Service (USFWS), have evaluated the projects that were undertaken and permits that were issued between 1995 and 2008 [17,32].
In order to investigate whether banks achieve ecological equivalency as well as NNL in terms of habitat area on a national scale, we used publicly available data on banks in the United States through the Regulatory In-lieu Fee and Bank Information Tracking System [14,23,33,34,35].
Our main research questions were:
- (1)
- Are transactions that are conducted by habitat banks in the United States likely to achieve NNL for ecological equivalency and ratio equivalency and are there discernible differences in achieving NNL between different mitigation targets and mitigation methods?
- (2)
- What are the possible shortcomings and reasons for not meeting NNL and ecological equivalency targets?
- (3)
- Is preservation overused as a mitigation method and what targets and benefits does it provide?
We addressed question (1) by extracting bank transactions from RIBITS and assessing the associated impact, offset, and credits in order to determine gain:loss ratios, with the assumption that a ratio of 1:1 is accepted as NNL. Question (2) was answered by looking at how gains and losses are recorded in the RIBITS database and how well the impact types and offset types match; this is ecological equivalency between the gains and losses. Question (3) was investigated through an assessment of banks’ reliance on preservation as their main mitigation method.
2. Materials and Methods
Data were extracted from the Regulatory In-Lieu Fee and Banking Information Tracking System (RIBITS; last accessed 29 November 2021). RIBITS contains up-to-date banking reports for the entirety of the United States. We extracted data from 4039 banks and In-Lieu Fee program (ILF) sites that were listed for the United States. The banks were defined as either conservation, mitigation, and umbrella banks since they all state that their end goal is to satisfy compensatory mitigation through preservation, establishment, re-establishment, rehabilitation, and enhancement (Table 1; [9,12]). In order to investigate current banking practices, only approved banks were included in our analysis, as well as only banks which had the required information listed (Table 1). No ILF sites were retained in our analysis. In-Lieu Fee programs and sites were excluded since they often do not provide the same environmental benefit as bank credits [10]. This is because funds from a proponent are deposited into in-lieu fee funds that are managed by an NGO or government agency mostly for the purpose of future environmental management. These funds are generally spent on future projects, thus potentially allowing the advent of habitat loss or degradation without a timely offset [10]. We also only considered banks that were established after the USACE guidelines of 1995 were put into place in order to have banks with a uniform reporting system. This led to the inclusion of 1736 banks for analysis (Table 1). A second dataset was used containing all the ledger transactions that were associated with the banks, providing information about impacts and offsets as well as mitigation methods and mitigation targets (n = 12,756; Table 1; transaction and data details can be found in Appendix A Figure A1).

Table 1.
Key variables and definitions used for ratio and ecological equivalency comparisons.
2.1. Key Variables
Compensatory Mitigation Methods for Banking
The term “mitigation method” describes the method that was used to meet the compensatory mitigation goal. We identified five different methods: enhancement, establishment, re-establishment, rehabilitation, and preservation (Table 1). Enhancement covers the manipulation of the physical, chemical, or biological characteristics of a habitat area in order to improve a specific ecosystem function (USACE 2008; Table 1). Establishment, in the context of RIBITS and this study, means the creation of a habitat area that was previously non-existent. Re-establishment has the same definition, except that it is meant to rebuild a former habitat area. Both of these methods result in a gain in habitat area and ecosystem function (Table 1; [17]). Rehabilitation aims at repairing the natural or historic function of a degraded ecosystem, resulting in ecosystem function gain. Preservation is defined as threat removal or the prevention of a decline in an ecosystem’s function or habitat area, while also covering maintenance and management mechanisms (Table 1; [17]).
2.2. Gain:loss Ratios—Ratio Equivalency
The transactions (n = 12,756), which are linked to their recorded impacts and credits, were converted into gain:loss ratios. The gain:loss ratios were calculated for a given mitigation method (gain) in acre/linear feet as compared to the impact (loss). For example: the re-establishment of 10 acres and a negative impact on 10 acres results in a gain:loss ratio of 1:1. Ratios, representing the ratio equivalency between gain and loss, were assigned to four categories corresponding to the attainment of NNL (assuming a minimum of a 1:1 gain:loss ratio under equivalent impact type to offset type), acknowledging that many regulatory agencies require higher ratios. The categories are as follows: loss = gain:loss < 0.25:1, partial = gain:loss 0.25–0.9:1, NNL = gain:loss > 0.9–1.25:1, and gain = gain:loss > 1.25:1; see Table 1). These ratio ranges account for the inherent variability and inaccuracy of measuring offsets [22,34,35]. In this way, each transaction is associated with one of the four NNL categories (loss, partial, NNL, or gain) as well as its mitigation target (wetland, stream, species, or group) and mitigation method (preservation, enhancement, rehabilitation, re-establishment, or establishment; see Table 1; [36]) allowing the comparison of the likelihood that a transaction that is linked to a certain mitigation target or mitigation method meets NNL in terms of its ratio equivalency.
2.3. Matching Impact Type to Offset Type—Ecological Equivalency
Ecological equivalency between impact and offset is an important aspect of the offsetting process. In a concrete example, a compensation lake was constructed in the northern boreal forest of Canada in order to replace lost habitat area and ecosystem function which stemmed from mining operations in the Alberta oil sands region [37]. This example shows how an impact on a habitat area and ecosystem function requires an offset that provides compensation for both of these aspects. The comparison of impact type to offset type, as applied as an indicator for the ecological equivalency of a transaction, was investigated by converting each impact of a transaction (if the information was available; n = 4331) to the area and function loss (loss of habitat area and ecosystem function) or function loss (degradation of ecosystem function but not area). The offset type of the transaction was determined by assuming that preservation, enhancement, and rehabilitation lead to ecosystem function gain (function gain) and that establishment and re-establishment lead to habitat area and ecosystem function gain (area and function gain). Per our example from the oil sands region, an offset that is enacted through large scale stream enhancement, though potentially meeting ratio equivalency, would be deemed as not meeting ecological equivalency since it does only add ecosystem function nor new habitat area, compared to the initial loss. An appropriate match was labeled as a match (e.g., the function loss impact type matched with the function gain offset type). A mismatch resulting in a loss (e.g., the area and function loss impact type matched with the function gain offset type) was labeled as a mismatch. Finally, a positive mismatch (e.g., the function loss impact type matched with the area and function gain offset type) was labeled as overcompensate since it adds both ecosystem function and habitat area value. This logic allows us to determine if the impact type matches the offset type (e.g., a function loss impact type should be associated with a function gain offset type or an area and function gain offset type) and how well the bank transactions are approaching ecological equivalency. This is relevant as other studies indicate that NNL attainment that is based on ratio equivalency and ecological equivalency is not always achieved [18,22]. Impact and offset information were collected through a web scraping procedure that was based on the transaction ID and keywords relating to mitigation methods and ecosystem function or habitat area loss (rvest 1.0.2; [38]).
2.4. Preservation Targets
The benefits that are provided by different preservation target measures were investigated by extracting detailed bank information from 64 banks that were operating mainly through preservation. The benefits were assessed based on the main targets and goals (n = 6) that are listed in reports for the individual banks (hydrogeomorphology—HGM physical/chemical, invasive species control—invasive species presence thresholds and removal, habitat quality or breeding pairs/abundance—e.g., minimum breeding pairs for a species, connectivity—habitat connectivity aspects, and vegetation—vegetation cover and presence thresholds). The benefits that were provided through the attainment these preservation targets received additional attention compared to the other mitigation methods that were assessed since preservation is often associated with no additional ecosystem function or habitat area gain in RIBITS, which does not adequately represent the value of preservation for different mitigation targets [11,27,35].
2.5. Statistical Analysis
All of the statistical analyses were completed in R, version 4.1.0 (R-Core team 2020, [39]) and GitHub extensions. All of the graphs were created in R through corrplot, networkD3, and lattice and post processed in Inkscape 1.1.2 (full list in Appendix A Figure A1).
2.6. Compensatory Mitigation Methods for Banking
In order to determine whether mitigation methods have changed in the popularity and frequency of their application over the years, transactions for the five mitigation methods (enhancement, establishment, re-establishment, rehabilitation, and preservation; n = 12,576) were analyzed through a linear model that tested for the trends in each method’s utilization frequency over time (the proportion of transactions for each method per total transaction each year from 1995 to 2020). Significant increases or decreases in the proportions were identified through the use of an accepted alpha value of 0.05 and assessment using the effect size as estimated by r-squared values (R2; Table A1; [40]).
2.7. Gain:loss Ratios—Ratio Equivalency
In order to elucidate if certain mitigation targets or mitigation methods were associated with meeting or missing the NNL criteria, gain:loss ratios and their four related categories (loss, partial, NNL, and gain) for each of the 12,756 transactions were analyzed through Pearson’s chi-squared test of independence for frequency analyses for the gain:loss categories across the mitigation targets (wetland, stream, species, and group; Table 1; Table A2) and the assessed mitigation method (enhancement, establishment, re-establishment, rehabilitation, and preservation; Table 1; Table A3) against an accepted alpha level of 0.05. The results were plotted in a correlation plot, showing negative or positive correlations between the gain:loss categories and specific mitigation targets and mitigation methods based on residuals (corrplot 0.2-0). Significant correlations were tested for through post-hoc tests with an accepted alpha level of 0.05 and using the Bonferroni correction (Table A2 and Table A4; chisq.posthoc.test 0.1.2; [41]). In detail, the transaction numbers were plotted into a Sankey diagram showing the transaction numbers per each mitigation target (wetland, stream, species, and group). The mitigation methods for each target and the number of transactions that were associated with the four gain:loss categories were also plotted (networkD3 0.4; [42]). These Sankey diagrams, showing the flow from one set of values to another, in our case allow a more in-depth look at how the mitigation method use and gain:loss categories vary in terms of their transactions and NNL outcomes across different mitigation targets, such as wetlands or species (networkD3 0.4; [42]).
2.8. Impact Type to Offset Type—Ecological Equivalency
Impact and offset type, corresponding to the three categories of match mismatch and overcompensate, were analyzed through Pearson’s chi-squared test of independence for frequency analyses. This manner of analysis was applied to the impact to offset type categories across the mitigation targets (wetland, stream, species, and group; Table A4) with an accepted alpha level of 0.05. The results were plotted in a correlation plot, showing negative or positive correlations between the impact type and offset-type categories and the specific mitigation targets based on residuals (corrplot 0.2-0). Significant correlations were tested for through the use of post-hoc tests with an accepted alpha level of 0.05 and the application of the Bonferroni correction (Table A4; chisq.posthoc.test 0.1.2; [40]). The correlation plot and post-hoc analysis helped us to determine if the impact types were generally matched with the appropriate offset types and, if not, whether these mismatches were related to specific mitigation targets, such as wetlands or streams.
2.9. Preservation Targets
The identified preservation targets (n = 6), from the aforementioned 64 banks, were plotted in a simple heat map across five regions (northeast, southeast, midwest, west, and southwest) based on the frequency of the targets mentioned by the bank and region, with multiple targets being possible per bank (lattice 0.20–45; [43]). This way we do not only showcase the diverse targets that preservation efforts can aim at, but we are also able to relate these findings to specific regions.
3. Results
3.1. Compensatory Mitigation Methods for Banking
We found that, over the past 25 years, the mitigation methods that were recorded in the assessed transactions (n = 12,756) changed in their utilization frequencies (Figure 2a). Enhancement and preservation measures’ usages did not change significantly over time, with 16.2% (±5.2) of yearly transactions on average for enhancement and 29.4% (±11.3) for preservation transactions (Figure 2a). Rehabilitation measures (14.6 ± 5.5% yearly average) had a strong positive trend associated with them (R2 = 0.74; p-value < 0.001; Table A1), increasing from less than 5% in the 1990s to around 15 to 20% of all yearly transactions in 2010 and onward (Figure 2a). Re-establishment (30.9 ± 7.8% yearly average) and establishment (8.9 ± 6.9% yearly average) transactions decreased in frequency over time. Yearly establishment proportionate transactions decreased by around 6% between 1995 and 2020 (R2 = 0.37; p-value < 0.001; Table A1). Re-establishment proportionate transactions decreased by around 10% over time (R2 = 0.25; p-value < 0.05; Table A2). Overall, re-establishment and preservation were the predominant mitigation methods from 1995 to 2020, with rehabilitation usage rapidly increasing over time and establishment and re-establishment usage decreasing.
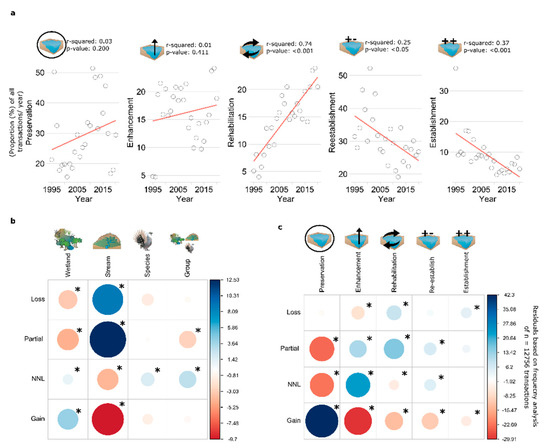
Figure 2.
Used mitigation methods (a) in the extracted transactions (n = 12,756; enhancement, establishment, preservation, re-establishment, and rehabilitation) in the percentage of total transactions each year ranging from 1995 to 2020 with linear model outputs, p-values, and r-squared values indicating significant changes in method utilization over time (Table A1). Chi-squared tests of independence (b) for mitigation target (wetland, stream, species, or group) and mitigation method (enhancement, establishment, preservation, re-establishment, or rehabilitation) (c) in relation to meeting NNL under a gain:loss ratio of 1:1 for each transaction (n = 12,756; NNL categories = loss, partial, NNL, and gain). Positive residuals indicate a positive correlation between two categories and circle size indicates residual magnitude. Post-hoc analysis for chi-squared test based on standardized residuals with Bonferroni correction indicating significance of positive or negative correlations, denoted by * (Table A2 and Table A4). (Digital symbols attribution: Jason C. Fisher; Tracey Saxby; Emily Nastase; Jane Hawkey; ian.umces.edu/media-library [29]).
3.2. Gain:loss Ratios—Ratio Equivalency
The gain:loss ratios differed across the mitigation targets (Figure 2b; chi-squared = 419.02; df = 9; p-value < 0.001; Table A2). Transactions targeting wetlands (n = 10,628) using mainly preservation, enhancement, and re-establishment (Figure 3a) were strongly associated with NNL (; p-value < 0.001) and gain (p-value < 0.001; Figure 2b). Stream transactions (n = 1647), mainly relying on rehabilitation, preservation, and enhancement (Figure 3b), were strongly related to partial NNL (p-value < 0.001) and loss (p-value = 0.001; Figure 2b). Transactions targeting species (n = 151), often relying on preservation (Figure 3c), were strongly associated with NNL (p-value < 0.001; Figure 2b). Half of the group transactions (n = 330) were linked to preservation and enhancement (Figure 3d). Group transactions were positively related to NNL (p-value < 0.05; Figure 2b).
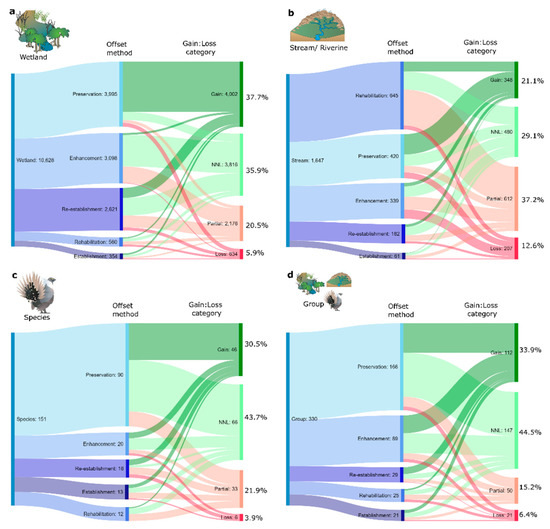
Figure 3.
Sankey diagram showing distribution of extracted transactions (n = 12,756) across transaction targets type (wetland, stream, species, and group), mitigation method (enhancement, establishment, preservation, re-establishment, and rehabilitation) and transactions leading to one of four NNL/ratio equivalency outcomes based on gain:loss ratios (loss: <0.2:1, partial: 0.2 to 0.9:1, NNL: >0.9 to 1.25:1, and gain: >1.25:1). Green flows indicate meeting or exceeding NNL gain:loss ratios while red flows indicate not meeting ratio equivalency requirements (detailed results table in Table A5). (Digital symbols attribution: Jason C. Fisher; Tracey Saxby; Emily Nastase; Jane Hawkey; [29]).
The results of the chi-squared tests for the mitigation methods showed that the gain:loss ratios differed between the methods (Figure 2c; chi-squared = 5234.5; df = 12; p-value < 0.001; Table A3). Transactions that were linked to preservation (n = 4671; Figure 3) were the most likely to lead to gain (p-value < 0.001; Figure 2c). Enhancement (n = 3564; Figure 3) was associated with NNL (p-value < 0.001) and partial NNL (p-value < 0.001; Figure 2c) and so was re-establishment (n = 2848; NNL; p-value < 0.001; partial NNL; p-value < 0.001; Figure 2c). Rehabilitation (n = 1242; Figure 3) and establishment (n = 449; Figure 3) were likely to lead to loss (rehabilitation and establishment; p-value < 0.001; Figure 2c) and rehabilitation was linked to partial NNL (p-value < 0.001). Overall, preservation was the most utilized mitigation method for the four mitigation targets, followed by enhancement, re-establishment, and rehabilitation. Wetland transactions and the utilization of preservation were the most likely to lead to gain while stream transactions were most likely to only meet partial NNL in terms of their gain:loss ratios. Enhancement and re-establishment were likely to meet the partial or NNL criteria. Species and group transactions mostly led to NNL. Rehabilitation and establishment had the highest likelihood of leading to loss in terms of their gain:loss ratios.
3.3. Matching Impact Type to Offset Type—Ecological Equivalency
Investigating the matches of the impact type to offset type through chi-squared tests of 4331 transactions (Figure 4b; chi-squared = 98.005; df = 6; p-value < 0.001; Table A4) revealed that wetland transactions (n = 3702) were matching their impact type to offset type the most often (79.5%; p-value < 0.001; Figure 4b) with mismatches (23.9%) being mostly attributed to preservation not meeting habitat area and ecosystem function loss. Stream transactions (n = 501) were the most likely to mismatch their impact type and offset type (25.6%; p-value < 0.001) or overcompensate (10.0%; p-value < 0.001; Figure 4b), with mismatches being linked to rehabilitation (47.7%). Species transactions (n = 37) were not significantly related to any match type but were identified mostly as matches (78.4%) and mismatches (18.9%), with the latter categorization being associated with preservation (57.1%). Group transactions (n = 91) were strongly associated with overcompensation (11.0%) between impact type and offset type (p-value < 0.05; Figure 4b). Cases of mismatch in group transactions were, in 55.6% of the cases, due to utilizing enhancement for habitat area and ecosystem function loss.

Figure 4.
Heat map of 64 analyzed banks (a) utilizing preservation and its main associated targets (breeding pairs/species abundance, habitat connectivity, invasive species control, habitat quality hydrogeomorphology, and vegetation) across the five main geographic regions (northeast, southeast, midwest, southwest, and west). (b) Chi-squared test of independence for frequency table analyses. Categorical variables are composed out of mitigation target (wetland, stream, species, or group) and impact type to offset type category (match, mismatch, or overcompensate). Positive residuals indicate a positive correlation between two categories and the magnitude. Post-hoc analysis for significant correlations for chi-squared tests based on standardized residuals with Bonferroni corrections of positive or negative correlations are indicated by * (Table A4). (Digital symbols attribution: Jason C. Fisher; Tracey Saxby; Emily Nastase; Jane Hawkey; [29]).
3.4. Preservation Targets
The heat plot (Figure 4a) shows that, overall, hydrogeomorphology (physical and chemical; n = 48 mentions) and parameters relating to vegetation (n = 44 mentions) were the most common targets for banks, using a high frequency of preservation. These targets were mostly associated with banks in the midwest, southeast, and northeast. Invasive species control was mainly associated with banks in the southeast (n = 8 mentions) and west (n = 11 mentions) as well as species abundance and minimum amounts for breeding pairs (southeast, n = 4 mentions; west, n = 6 mentions). Connectivity aspects were only mentioned in the transactions of banks in the southeast (n = 3 mentions) and west (n = 4 mentions) and habitat quality was mostly just mentioned in the west (n = 7 mentions). Overall, hydrogeomorphology and vegetation aspects were the predominant targets for preservation-focused banks, while the preservation-focused banks displayed a wide array of different targets that are distributed across the five geographic regions.
4. Discussion
The usage frequencies of the mitigation methods on a yearly basis have changed over time. Rehabilitation’s usage has increased from 1995 to 2020; whereas the same time period has seen a decrease in establishment and re-establishment. Preservation and re-establishment were the overall most popular mitigation methods. The gain:loss ratios indicate the attainment of NNL on a ratio basis for most of the transactions with wetland targets. Stream targets led to partial NNL and loss. Species and group targets led to NNL on a ratio basis. Preservation as a mitigation method was associated with ratio gains while enhancement and re-establishment were likely to meet NNL. Rehabilitation and establishment most often lead to partial NNL or loss. Wetlands matched the impact type to the offset type well but showed a high likelihood of misusing preservation. Stream transactions tended to mismatch or overcompensate, with rehabilitation often not matching impact types. Group transactions overcompensated impact type to offset type, while species transactions generally led to a match. Investigating our findings requires looking at different aspects of banking, ecosystem availability, and banking history as well as the economic and ecological feasibility of the mitigation methods and mitigation targets.
4.1. How Likely Is a Ratio and Ecological Equivalency across Mitigation Targets and Mitigation Methods?
4.1.1. Wetland Targets
Wetlands, as part of bank transactions, were the most common mitigation targets and they were associated with a high frequency of preservation, re-establishment, and enhancement in order to provide ecosystem function or habitat area. Re-establishing wetlands in the United States has a long-standing history and well-established guidelines, which are supported by historic records on habitat area and ecosystem function [44,45,46]. Re-establishment, while decreasing in popularity over time, is still one of the most effective and widely applied mitigation methods. Though time-consuming, costly, and labor-intensive, re-establishment is more likely to achieve the goal of ecological equivalency, compared to other methods, by considering aspects such as connectivity, water quality, flow rates, food supply, and the development of spawning, nursery, and rearing habitats’ availability [45,46]. An example is the wetland re-establishment in the Sacramento–San Joaquin Delta in California, which is showing tangible results for long-term colonization and wetland progression [47]. Re-establishment, providing habitat area and ecosystem function, is the main reason for wetlands matching impact types to offset types well by re-establishing historic wetlands. This trend is encouraging as it shows that ecological equivalency will likely be met in addition to meeting ratio equivalency.
Preservation was the main cause for mismatches of impact type and offset type in wetland transactions. This ecological mismatch is concerning. The United States has lost large proportions of its wetlands in the past, thus incorporating banks into increased efforts to preserve the remaining ones [45,46]. This fact has likely led to the high usage of preservation by banks. From an economic standpoint, preservation seems appealing due to the lower monetary and temporal investments that are required in order to maintain an existing ecosystem. Furthermore, banking is often targeted at current or former farmland or degraded areas that are adjacent to ecologically important areas, such as wetlands, which may explain an increased interest in preserving adjacent systems while converting degraded developed land back into viable ecosystems [48,49]. Studies suggest that, in the case of banking, inefficient long-term management can reduce diversity in mitigation methods [25]. In a chosen example case study that was extracted from RIBITS, bank management and funding changed over time in a wetland bank in Virginia. The bank area was consequently reduced by 50% and the amount of initially designated area for re-establishment and rehabilitation was reduced while keeping the preservation area almost constant. These often-occurring changes and shifts showcase how non-compliance, unrealistic goals, and management shortcomings can reduce the utilization of certain mitigation methods, partially explaining the consistent popularity of preservation measures [25]. While our results show a multitude of potential benefits being provided through preservation, many of them are not sufficiently supported by scientific evidence in order to be able to be said to meet ecological equivalency [21,23]. Basic maintenance measures, such as plant cover or the reduction of the number of non-native species, are often poor measures of the overall habitat quality and are often deemed too lenient with some essential ecosystem types, such as dry end wetlands which are prone to being overlooked almost completely [25,26,30].
Overall, wetland banking provides high gain:loss ratios due to the common use of preservation, a method that is supported by other studies [50], and it matches impact type to offset type well, especially through the utilization of re-establishment and enhancement. However, a quarter of the assessed transactions inadequately matched impact type to offset type, hence missing ecological equivalency, due to the use of preservation. While preservation fills an important role in protecting existing wetlands in the United States, its role in habitat banking should be revised in order to better match the impact type to the offset type and bridge the gap between ratio equivalency and ecological equivalency [21,23,25,26,30].
4.1.2. Stream Targets
Stream targets often only reached partial NNL through their gain:loss ratios, as well as mismatching the habitat area and ecosystem function losses with just ecosystem function gain through riverine rehabilitation, missing ecological equivalency (an observation which is supported by other studies focusing on streams in the United States) [51]. Compensatory mitigation for streams is a difficult target to approach in proponent-led offsets and it seems that habitat banking is suffering from similar issues [52,53]. The literature suggests that three main problems persist for effectively offsetting stream impacts: habitat availability, the use of improper offsetting techniques, and the underestimation of development’s impacts [51,52,53].
Habitat availability for re-establishing or establishing streams is sparse. Stream construction (establishment) often needs to be incorporated into larger projects or landscape-level planning. The same applies to re-establishment, which in most cases is a large-scale and expensive project, potentially suited for umbrella banks but not feasible for or available to most private banks [54]. Overcompensation, as shown in our results for streams, can be attributed to these large projects exceeding the impacts both on a ratio as well as an ecological level. Enhancement or rehabilitation is the most logical choice when it comes to streams, especially in considering small, degraded, farmland-adjacent streams or habitat area loss in urban streams for which the area for physical habitat creation is simply not available [53,55,56]. This disjoint relationship between losing stream habitat area and offsetting it through function gains will ultimately lead to a consistent loss in stream habitat area. Underestimated development impacts and improper offsetting techniques make it even harder to provide accurate estimates of impact and offset quantities, but this can be improved through the use of more comprehensive assessment and mitigation methods, such as the Index of Biotic Integrity (IBI; [52,53,54,57]). Considering that many stream transactions do not meet ecological and ratio equivalency, the increased number of permit authorizations involving stream habitat areas and ecosystem functions and an increase in rehabilitation’s usage as the main mitigation method for stream impacts underlines the need to rework the current approach in order to compensate for losing physical stream habitat area [57,58].
4.1.3. Group and Species Targets
Overall, preservation was popular for group and species targets, with both of these targets generally meeting ratio equivalency as well as ecological equivalency and with group targets often overcompensating through establishment and re-establishment. Preservation’s popularity for both of these mitigation targets can be attributed to species and group targets often being associated with conservation banks. Conservation banks aim to permanently protect and manage sites for endangered species, threatened species, or species that are at risk. The aim is to offset the adverse impacts to the protected species that are occurring off-site. Benefits for (endangered) species, for example, can be the preservation of corridors linking two habitat patches or protecting wintering habitats [30]. Species that are not able to exist in modern, transformed, semi-natural, and cultural landscapes will require larger and more complex efforts that are currently not achievable by individual banks but instead must be targeted through umbrella banks [59]. An example here can be seen in pilot transboundary projects, such as the restoration agreement between the United States and the Dominican Republic for protecting overwintering habitats for migratory birds abroad, benefiting US bird populations [60]. Overall, preserving already existing habitat is perhaps one of the only feasible methods for banking in some cases and for many endangered and threatened species. However, mismatches of meeting ecological equivalency for species often took place due to preservation not providing any additional habitat area. On a species level, re-establishment tends to be more difficult, but it still often yields successful results, for instance in the case of the San Martin titi monkey in private conservation areas (Plecturocebus oenanthe; [61]) or the endangered aquatic plant communities in the Czech Republic [62]. These examples and our results showcase the opportunity that re-establishment affords in providing vital habitat for endangered species. Overarching management bodies, such as umbrella banks, could help to facilitate the greater utilization of re-establishment for endangered species, as simple habitat preservation will likely not be enough to slow the current loss of biodiversity [32,62,63].
Group targets often led to ratio-based NNL as well as the overcompensating impact type to offset type relationship, which introduces increased additivity, which is another important aspect for current and future banking practice. While many banks combine different mitigation methods in their bank areas (e.g., bank area = 10 acres comprising 20% rehabilitation, 70% preservation, and 10% enhancement), multiple mitigation targets tend to create positive feedback loops between different ecosystems or a species and an ecosystem [64,65]. Group targets furthermore make use of the identification of the priority areas for both ecosystem function and biodiversity [65,66,67]. Mismatches due to enhancement measures show that a few specifically enhanced ecosystem aspects are often not enough when aiming at multiple species or ecosystems with the risk of enhancement in one area being detrimental in another area [32,68,69]. Group transactions still only comprise a small proportion of the overall number of bank transactions, but they hold the potential to provide valuable guidance on how to reach better ecological equivalency for other mitigation targets.
4.2. Implications and Limitations
4.2.1. Policy and Management Implications
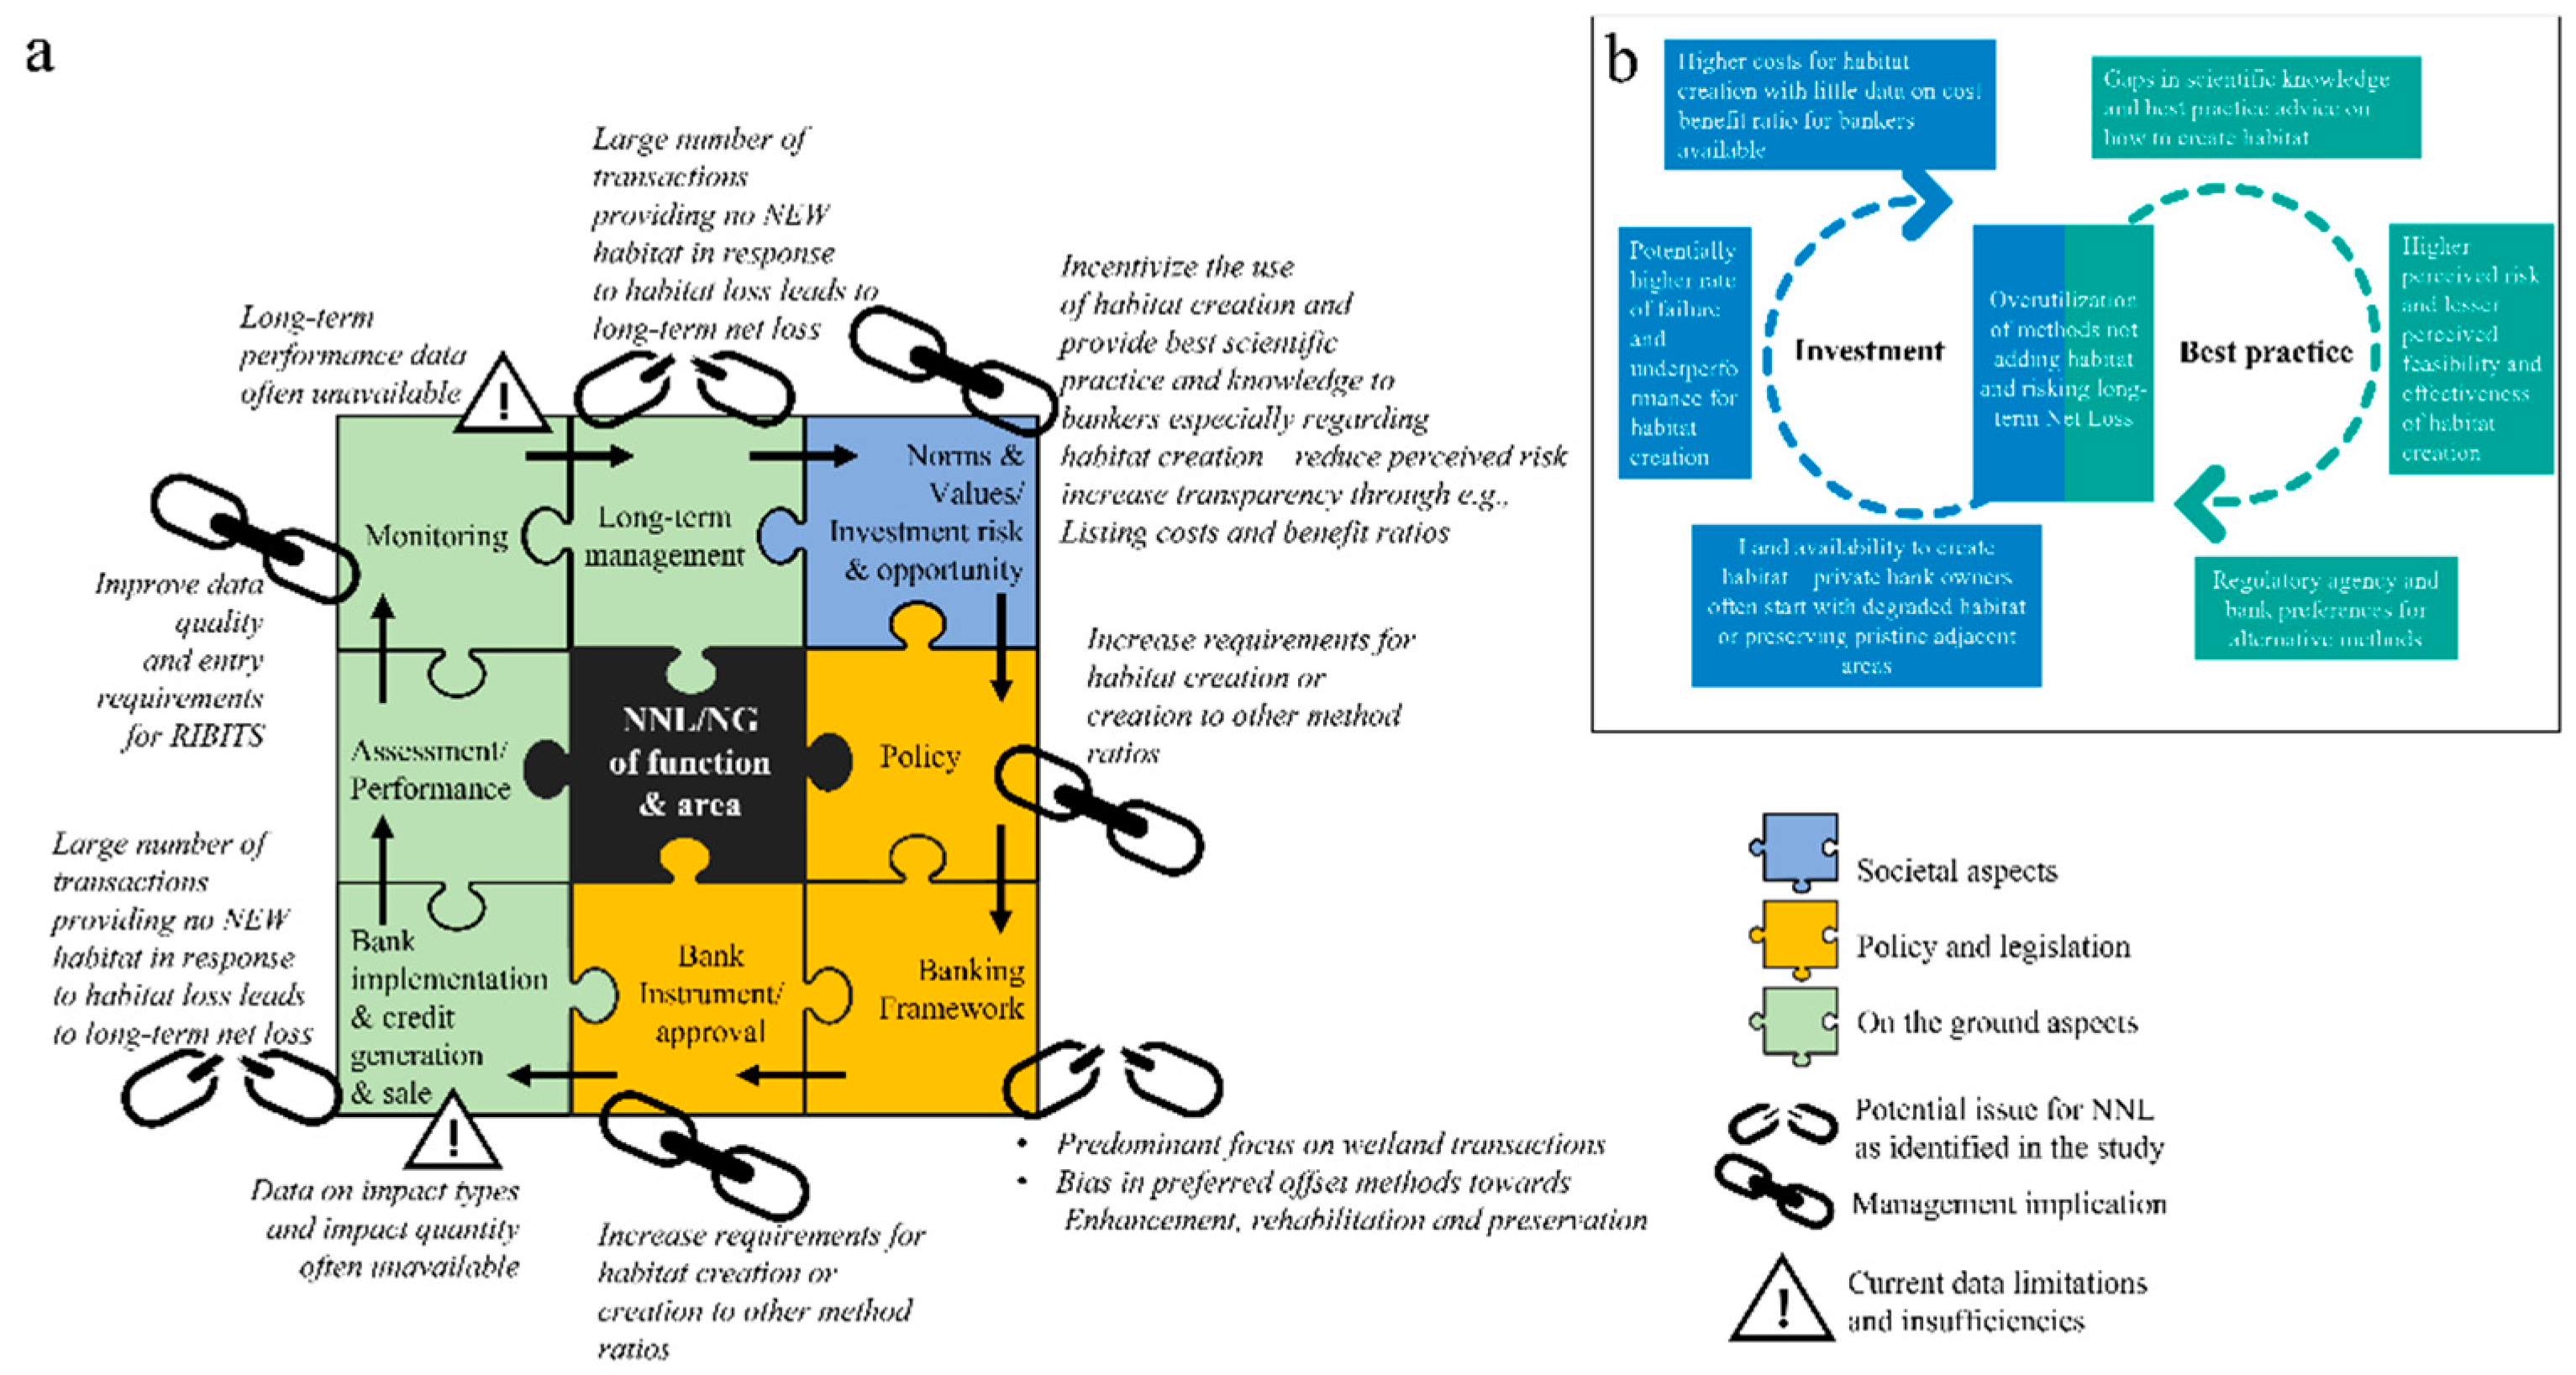
Our results and discussion points hold policy and management implications that could help banks to meet NNL in banking credit transactions (Figure 5a). Our results show how NNL as a declared goal is often not met when aiming for ecological equivalency as shown in other studies [22,23,70,71,72]. Our results clearly point towards the regulatory focus on meeting administrative, financial, or area-based ratios and using habitat enhancement, rehabilitation, and preservation over habitat creation through re-establishment or establishment [71,73,74].
In its easiest form, a loss of one acre of wetland through road construction should be offset through the construction of an acre of wetland close by, initiated by a bank (like for like; [23,75]). However, habitat or ecosystem creation from scratch remains a very difficult and expensive task, which can lead to a potential negative feedback loop (Figure 5b; [76]). Costs, unclear cost to benefit ratios for bankers, and the higher rate of failure increase the perceived risk and lessen the perceived feasibility of habitat creation, which in turn can lead to favoritism among regulators and bankers for using alternative methods, such as enhancement and rehabilitation, as these practices having been studied for decades with well documented gains and benefits in comparison to habitat creation (Figure 5b; [77,78]). Furthermore, bankers are often left with insufficient guidance and base ecosystem metrics that do not adequately capture a holistic approach in offsetting negative impacts, further increasing the negative feedback towards habitat creation (Figure 5b; [22,72,74,79]). Finally, habitat availability plays into the negative feedback loop since a lot of private landowners and bankers do not have the physical space available to create habitat, but rather they own degraded habitat, which in turn is often used for credit generation through rehabilitation and enhancement as well as preserving adjacent pristine areas (Figure 5b; [35,77,79,80]).
Breaking this negative feedback loop requires the incentivization of habitat creation while providing better best practice guidance and scientific knowledge regarding its implementation. Increased transparency of the cost and benefits as well as comparisons among bankers could further reduce their perceived investment risk. Accessible and listed credit cost to benefit ratios would be a first step, as has been shown, for instance, for California in a recent study which could help to increase confidence through reduced perceived investment risks for sponsors and bankers [35,80,81]. Aside from incentivization, an increase in habitat creation requirements quotas as part of the approved banking instrument, in cases that allow habitat creation, could increase the physical habitat area that is added through banking and help to reduce the future risk of bank transactions leading to net loss (Figure 5a). Quotas and credit requirements already exist, for instance in the case of preservation credits, and they could be expanded into establishment and re-establishment credits (Figure 5a; [82]). The true challenge will be to advance the restoration practices and science towards re-establishing essential habitat while fostering transboundary collaboration and agreements in order to be able to include migratory or long-range species into the banking network [83,84].
Overall, our results point to the fact that ecological considerations need to be strengthened in banks’ planning, approval, and implementation processes while backed by an already strong regulatory and legislative framework [23,73,79]. Policies and guidance documents however have not been updated and adjusted accordingly. Other instances show how memorandums, e.g., for the Endangered Species Act, were withdrawn recently. While changes are happening on a state level, like our example from California shows, other cases, such as the one of the greater sage-grouse, show how easy it is to let competing stakeholder and political interests override safeguards; this is a situation which is only compensated for by NGOs and private investors [85,86]. Results from this study and the many other studies evaluating banking practices [18,22,35,70,71,80,87] need to be considered for implementation into updated policies and guidance documents in order to strengthen the ecological benchmarks and requirements for banking practices in the United States. An updated uniform guidance document, incorporating the collected data since the last memorandum, could shift banking practices into a more sustainable and ecological equivalent direction.

Figure 5.
Study results relating to broader management and policy issues within the offsetting framework that compensatory banking is built on. Current data limitations and insufficiencies in RIBITS are indicated. (a) Negative feedback loop for habitat creation through establishment or re-establishment, showcasing aspects leading to the overuse of alternative offset methods. Investment aspects in blue, best practice aspects in green. (b) Figure content based on presented study results and supported through [22,23,35,70,71,72,74,75,76,79,81,82].
4.2.2. Study and Data Limitations and Future Directions
Aside from the management and policy implications for banking practices, our results showcase the inherent data and, consequently, study limitations that potentially limit the ability to assess the true effectiveness of bank transactions approaching NNL (Figure 5a; Figure A1). The biggest current limitation is the lack of readily available information on impact and offset types, as well as their quantities. Only around 15% of our extracted transactions had impact and offset sizes listed and only for around 6% did we managed to acquire information on the impact and offset type in terms of ecological function.
This data limitation needs to be addressed in the future in order for regulators, bankers, and scientists to be able to evaluate current practices. Banking should follow the adaptive management principle through constant assessment, evaluation, and adaption in order to improve NNL goals [7,20,25,74,75,85]. This is a process which becomes inherently difficult with the aforementioned data limitations. As a centralized database, RIBITS has taken the first step to allowing large scale data collection and evaluation. However, future database changes and reporting requirements should include the listing of impact and offset quantities per credit transaction, impact, and offset type per credit transaction and, ideally, the credit prices and impact and credit assessment methods. While some of the banks have stated that this information is listed in individual uploaded reports and documents, it takes an incredible amount of web scraping and manual extraction effort through R to compile these, while still missing most transactions as mentioned before.
Assessment methods and credit prices are two of the unevaluated aspects that are in this study that should be deemed of interest for future studies. Our assessment methods for the provided bank benefits and credit generation, such as the popular ratio method, might miss important ecosystem aspects, while the use of multipliers often tends to limit the effectiveness of assessments in capturing true functions and can lead to false assumptions of equivalency [27]. Credit prices in relation to impacts, offset methods, and the ecosystem could be used in order to evaluate cost benefit ratios and provide bankers with a better idea of their investment opportunities and reduce their uncertainty and the perceived investment risks, this has been done thus far done for conservation but not mitigation banks [80,88]. Overall, both of these suggested future studies aspects hold great potential to add to the best practice for and knowledge of how to meet NNL goals in bank transactions and banking practices.
Another future challenge regarding the offsetting framework and, consequently, the banking mechanism involves the issue of how to incorporate climate change into current and future requirements. Discussions about making climate change impacts an offsetting requirement are ongoing and this seems likely to be implemented at some point [89,90]. The offsets that are provided by banks are meant to be long-term, ideally in perpetuity, and climate change will have a significant effect on the provided benefits, especially when considering temperature-sensitive species or systems. Bank offsets of the future will need to consider climate refugia, both in terms of the physical offset form as well as the location, more strongly [91,92].
5. Conclusions
Our study shows that ratio equivalency is achieved in most bank transactions in the United States; whereas there was a clear struggle to achieve ecological equivalency, which is in line with the findings of other studies [21,23,32,50]. The main reasons for mismatches were the high usage of preservation in wetland transactions and rehabilitation in stream transactions. While rehabilitation has increased in its usage frequency over the past 25 years, its potential for ecological equivalency seems limited in the context of stream impacts, which often lead to the loss of habitat area. Mismatches are potentially due to improper offsets, low area availability, prohibitive costs, and official guidelines focusing on area ratios rather than ecological equivalency [51,52,53]. Preservation is often overused in wetland transactions so much so that, despite greatly exceeding ratio equivalency, these efforts do not meet ecological equivalency in one quarter of all of the assessed wetland transactions. Habitat creation needs to be incentivized in polices and banking instrument requirements as well as through increased transparency for current and future bankers in order to reduce investment risks [80,81,82,85,88]. While we have showcased the wide array of potential preservation benefits, preservation should not be used as a panacea since it does not meet the requirements for additionality and ecological equivalency. The use of re-establishment for wetlands showed a high frequency of meeting ratio and ecological equivalency, which is an encouraging finding. Preservation plays an important role for conservation banks and it contributes to their role to protect habitats for endangered species, which showed even higher rates of ecological and ratio equivalency when they were part of group transactions targeting multiple species or ecosystems. This outcome is mostly attributed to adaptive management and positive feedback loops [64,65]. Data limitations and reporting deficits in RIBITS need to be addressed by providing more comprehensive information on the impact and offset types, metrics, and characteristics in order to allow better evaluation of whether transactions meet NNL goals.
Author Contributions
S.T.: conceptualization, methodology, software, validation, formal analysis, investigation, data curation, writing—original draft, writing—review & editing, visualization, and project administration. M.S.P.: conceptualization, methodology, resources, writing—review & editing, supervision, and funding acquisition. All authors have read and agreed to the published version of the manuscript.
Funding
Funding for this project was provided by Mitacs Cluster Accelerate (RES0027784) and Converge (RES0021639) grants that were awarded to Mark Poesch.
Institutional Review Board Statement
Not applicable.
Informed Consent Statement
Not applicable.
Data Availability Statement
Data is available through the authors or RIBITS.
Acknowledgments
The digital symbols that were used to enhance Figure 1, Figure 2, Figure 3 and Figure 4 were kindly provided by the listed individual creators through the University of Maryland Center for Environmental Science Integration and Application Network. https://ian.umces.edu/media-library/ accessed on 14 May 2022. The digital symbols were used under the Attribution-ShareAlike 4.0 International (CC BY-SA 4.0) rights to share and adapt material in any medium or format. We want to acknowledge the immense impact and application that this digital symbol repository provides for science communication, both in terms of content and accessibility.
Conflicts of Interest
The authors declare no conflict of interest.
Appendix A. Chi-Squared Comparison
Mitigation Methods across Time
Appendix A includes the results for chi-squared tests of independence for the frequency table analyses for bank types across regions, ratio-based NNL across mitigation method and mitigation target, and impact type to offset type across mitigation targets (Table A2, Table A3 and Table A4). Table A1 contains the linear model output and effect size for the mitigation methods and their proportionate yearly use between 1995 and 2020. Finally, the supporting information provides a flowchart overview of the used data and transaction details (Figure A1) and additional results (Table A5). All of the supporting information is available online. The authors are solely responsible for the content and functionality of these materials. Queries (other than those regarding the absence of the material) should be directed to the corresponding author.
Table A1.
Linear model and associated p-values for the six mitigation methods and transactions per method (establishment, preservation, rehabilitation, re-establishment, and enhancement) over time, in years, from 1995 to 2020.
Table A1.
Linear model and associated p-values for the six mitigation methods and transactions per method (establishment, preservation, rehabilitation, re-establishment, and enhancement) over time, in years, from 1995 to 2020.
| Linear model, establishment transactions over time (R2: 0.37) | Estimate | Std. Error | t-value | Pr (>|t|) |
| (Intercept) | 1154.178 | 290.673 | 3.971 | <0.001 |
| Year | −0.570 | 0.144 | −3.940 | <0.001 |
| Linear model, preservation transactions over time (R2: 0.03) | Estimate | Std. Error | t-value | Pr (>|t|) |
| (Intercept) | −742.578 | 585.502 | −1.268 | 0.217 |
| Year | 0.384 | 0.291 | 1.318 | 0.200 |
| Linear model, rehabilitation transactions over time (R2: 0.74) | Estimate | Std. Error | t-value | Pr (>|t|) |
| (Intercept) | −1.222 × 10³ | 1.512 × 10² | −8.079 | <0.001 |
| Year | 6.160 × 10⁻¹ | 7.534 × 10⁻² | 8.176 | <0.001 |
| Linear model, re-establishment transactions over time (R2: 0.25) | Estimate | Std. Error | t-value | Pr (>|t|) |
| (Intercept) | 1123.837 | 353.778 | 3.177 | <0.05 |
| Year | −0.544 | 0.176 | −3.089 | <0.05 |
| Linear model, enhancement transactions over time (R2: 0.01) | Estimate | Std. Error | t-value | Pr (>|t|) |
| (Intercept) | −213.475 | 274.658 | −0.777 | 0.445 |
| Year | 0.114 | 0.136 | 0.836 | 0.411 |
Appendix B. Chi-Squared Comparison of Mitigation Target to NNL and Mitigation Measure to NNL
The following details the chi-squared test of independence for the frequency table analyses. The categorical variables comprise the mitigation target (wetland, stream, species, or group) and NNL category (loss, partial, NNL, or gain). Positive residuals indicate a positive correlation between two categories and the magnitude of this correlation (e.g., −4.417 for wetland and partial NNL means that wetland transactions are not associated with partial NNL). Post-hoc analysis using a chi-squared test, based on standardized residuals with Bonferroni correction, have been used to indicate the significance of positive or negative correlations.
Table A2.
Pearson’s chi-squared test for mitigation target.
Table A2.
Pearson’s chi-squared test for mitigation target.
| Residuals | Wetland | Stream | Species | Group |
| Loss | −3.317 | 8.967 | −1.334 | −0.307 |
| Partial | −4.417 | 12.533 | −0.169 | −2.817 |
| NNL | 0.966 | −4.235 | 1.728 | 2.810 |
| Gain | 4.015 | −9.701 | −1.008 | −0.428 |
| p-values | Wetland | Stream | Species | Group |
| Loss | <0.001 | 0.001 | 1.000 | 1.000 |
| Partial | <0.001 | <0.001 | 1.000 | 0.02 |
| NNL | 0.05 | <0.001 | 0.049 | 0.006 |
| Gain | <0.001 | <0.001 | 1.000 | 1.000 |
X-squared = 419.02; df = 9; p-value < 2.2 × 10⁻¹⁶.
The following details the chi-squared test of independence for the frequency table analyses. The categorical variables comprise the mitigation method (establishment, preservation, rehabilitation, re-establishment, and enhancement). Positive residuals indicate a positive correlation between two categories and the magnitude of this correlation (e.g., −15.310 for preservation and partial NNL means that preservation transactions are not associated with partial NNL). Post-hoc analysis using chi-squared test, based on standardized residuals with Bonferroni correction, indicate the positive or negative correlations.
Table A3.
Pearson’s chi-squared test for mitigation method.
Table A3.
Pearson’s chi-squared test for mitigation method.
| Residuals | Preservation | Enhancement | Rehabilitation | Re-estab. | Establish. |
| Loss | −1.145 | −6.694 | 8.556 | 1.544 | 4.434 |
| Partial | −23.975 | 11.694 | 16.032 | 6.083 | 2.398 |
| NNL | −22.621 | 23.465 | −3.821 | 5.247 | −0.01 |
| Gain | 42.304 | −29.910 | −12.720 | −10.790 | −3.849 |
| p-values | Preservation | Enhancement | Rehabilitation | Re-estab. | Establish. |
| Loss | 1.000 | <0.001 | <0.001 | 1.000 | <0.001 |
| Partial | <0.001 | <0.001 | <0.001 | <0.001 | 0.111 |
| NNL | <0.001 | <0.001 | <0.001 | <0.001 | 1.000 |
| Gain | <0.001 | <0.001 | <0.001 | <0.001 | <0.001 |
X-squared = 5234.5; df = 12; p-value < 2.2 × 10⁻¹⁶.
The following details the chi-squared test of independence for the frequency table analyses. The categorical variables comprised the mitigation target (wetland, stream, species, and group) and NNL category (match—impact type matches offset type; miss—impact type = area and function loss through habitat loss, offset type = function gain through preservation, enhancement, rehabilitation or buffer but with no new area gain; or overcompensate—impact type = function loss through degradation, offset type = function and area gain through establishment or re-establishment). Positive residuals indicate a positive correlation between two categories and the magnitude of this correlation (e.g., −2.668 for wetland and miss means that wetland credit transactions are not associated with mismatching impact and offset type). Post-hoc analysis of chi-squared tests, based on standardized residuals with Bonferroni correction, revealed the positive or negative correlations.
Table A4.
Pearson’s chi-squared test for impact to offset type match or mismatch.
Table A4.
Pearson’s chi-squared test for impact to offset type match or mismatch.
| Residuals | Wetland | Stream | Species | Group |
| Miss | −1.120 | 3.816 | 0.093 | −1.869 |
| Match | 1.214 | −3.374 | 0.042 | 0.147 |
| Overcompensate | −2.971 | 6.749 | −0.387 | 3.359 |
| p-values | Wetland | Stream | Species | Group |
| Miss | 0.0138 | <0.001 | 1.000 | 0.039 |
| Match | <0.001 | <0.001 | 1.000 | 1.000 |
| Overcompensate | <0.001 | <0.001 | 1.000 | 0.006 |
X-squared = 98.005; df = 6; p-value < 2.2 × 10⁻¹⁶.

Figure A1.
Data workflow from extraction to transformation and analyses with corresponding R-packages, used software and used variables.
Figure A1.
Data workflow from extraction to transformation and analyses with corresponding R-packages, used software and used variables.
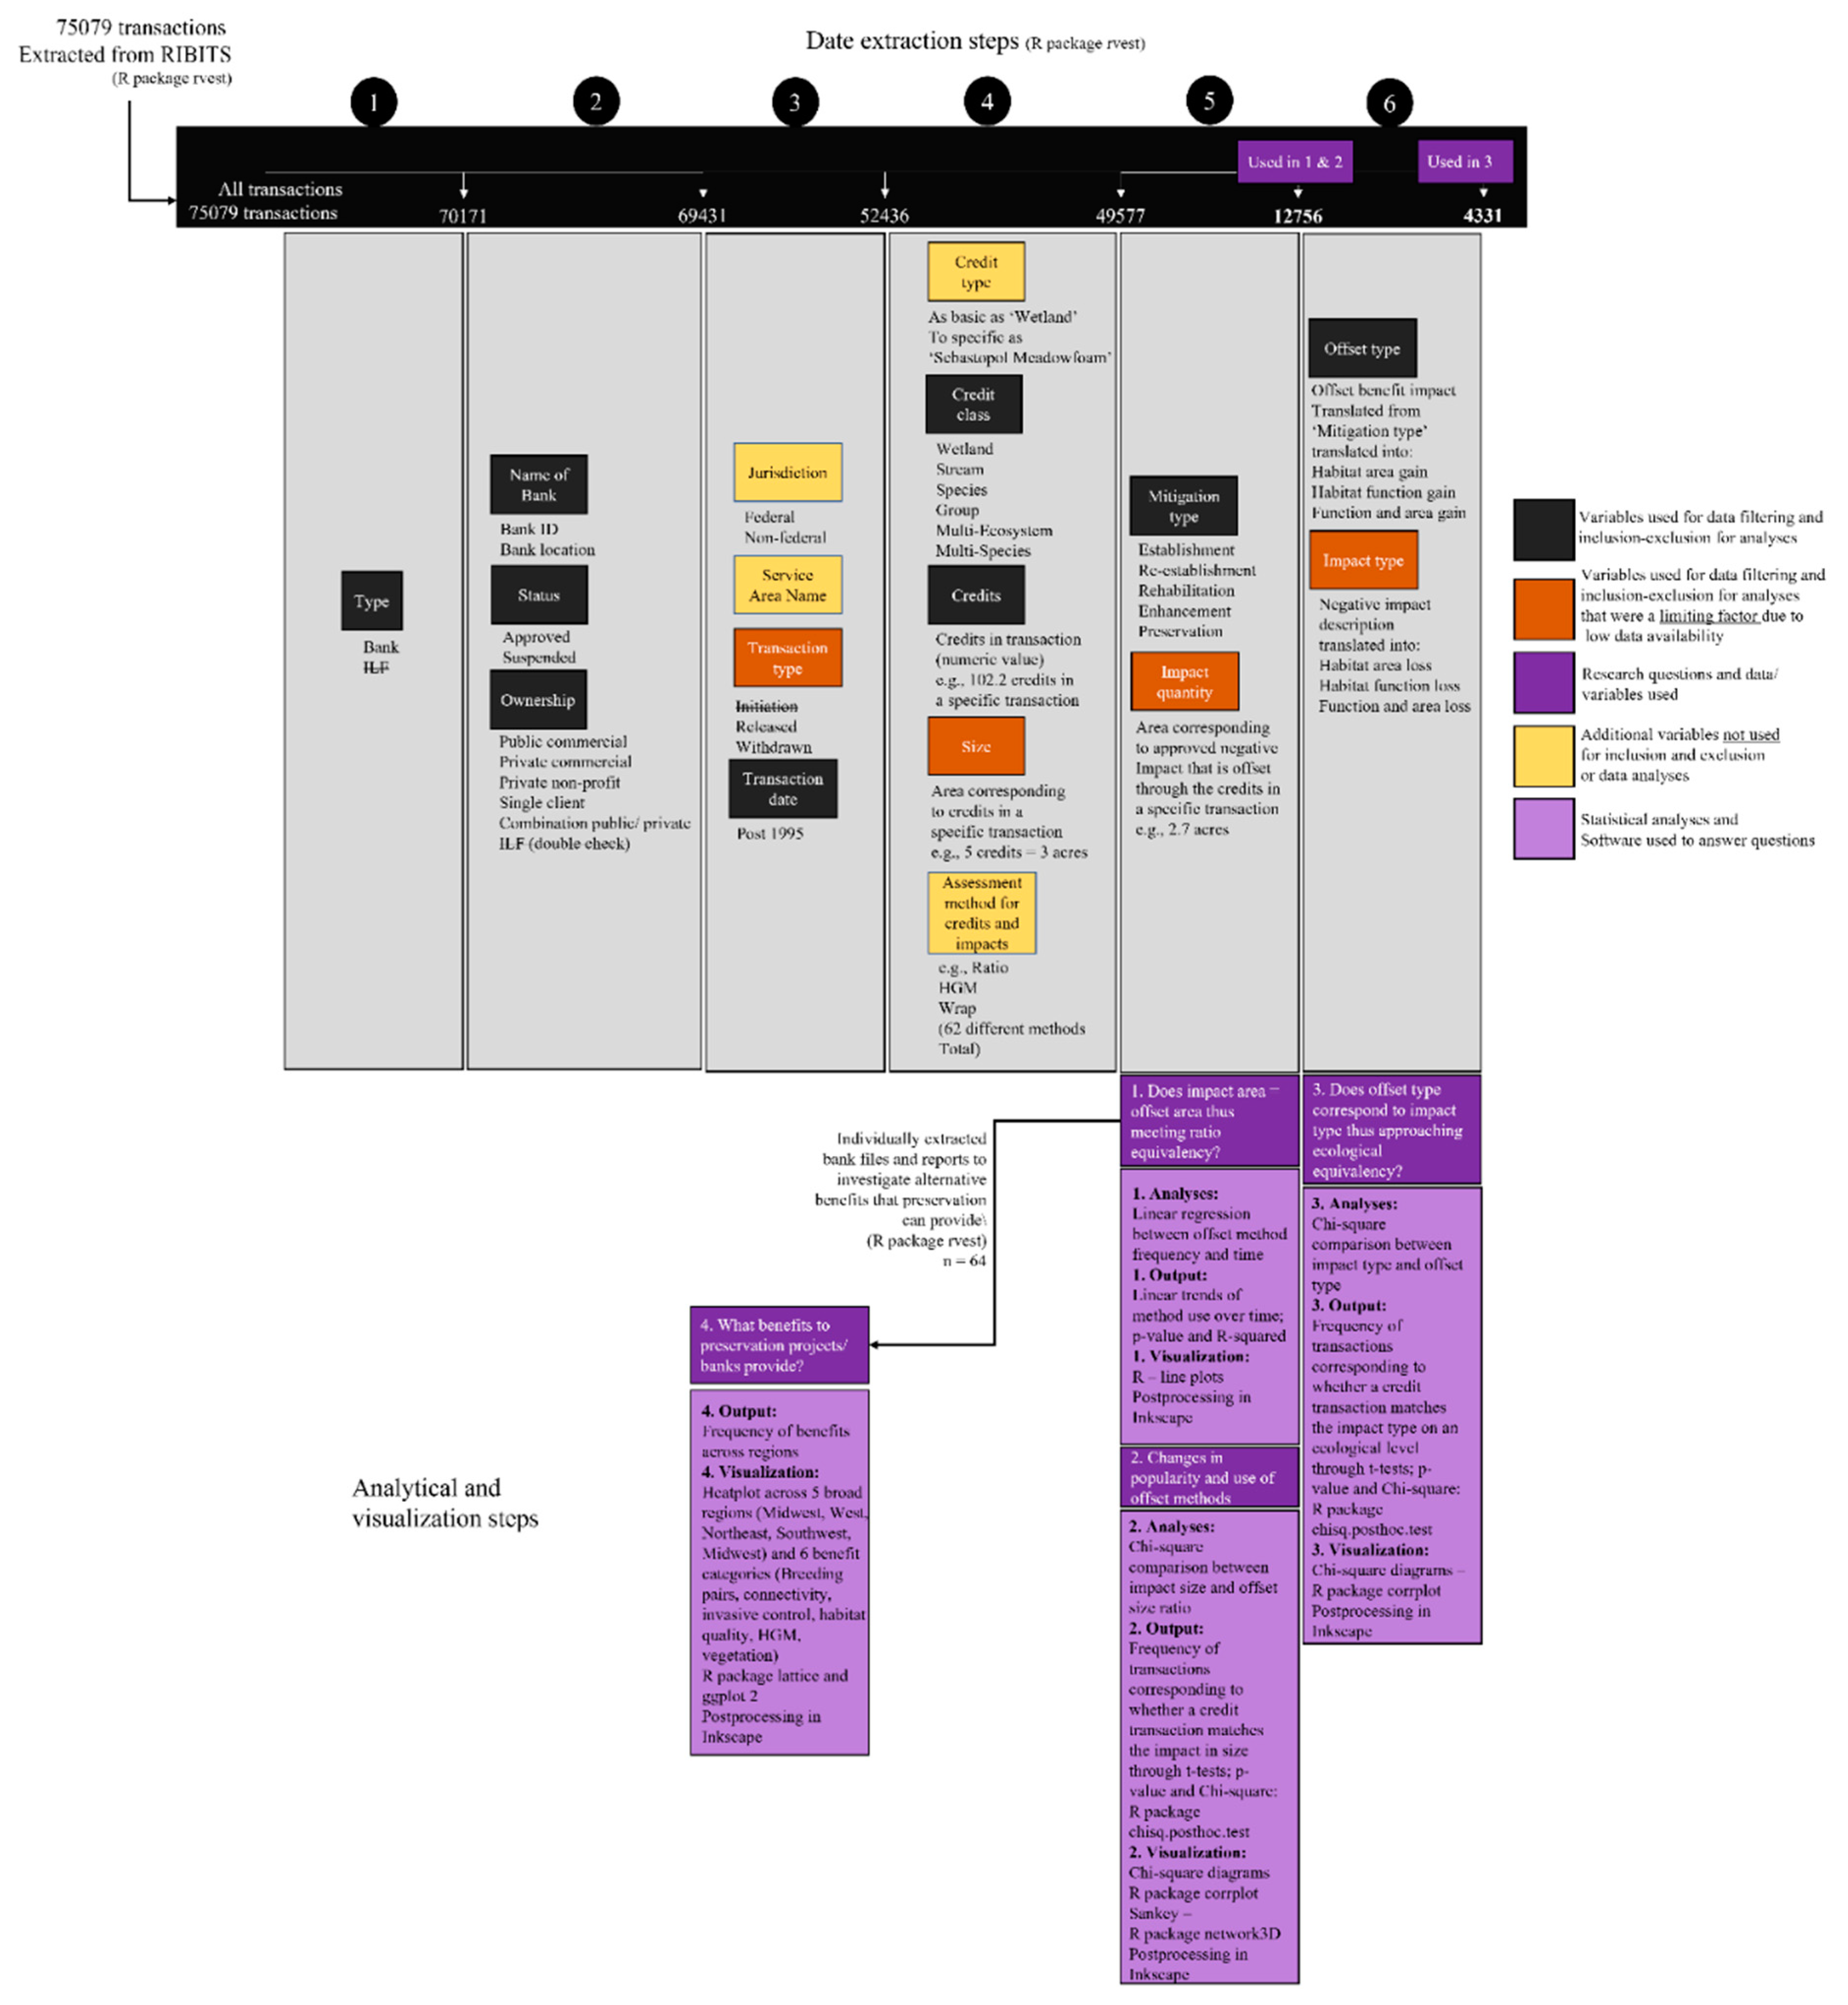
Table A5.
Detailed gain:loss ratios for wetland, stream, group, and species transactions in reference to Figure 4.
Table A5.
Detailed gain:loss ratios for wetland, stream, group, and species transactions in reference to Figure 4.
| n = 10,628 | ||||||
| Wetland | Preservation | Enhancement | Rehabilitation | Reestablishment | Establishment | |
| Loss | 234 | 44 | 121 | 190 | 45 | 634 |
| Partial | 178 | 996 | 190 | 726 | 86 | 2176 |
| NNL | 498 | 1932 | 176 | 1085 | 125 | 3816 |
| Gain | 3085 | 126 | 73 | 620 | 98 | 4002 |
| 3995 | 3098 | 560 | 2621 | 354 | ||
| n = 1647 | ||||||
| Stream | Preservation | Enhancement | Rehabilitation | Reestablishment | Establishment | |
| Loss | 55 | 87 | 37 | 21 | 7 | 207 |
| Partial | 64 | 126 | 336 | 56 | 30 | 612 |
| NNL | 108 | 94 | 174 | 82 | 22 | 480 |
| Gain | 193 | 32 | 98 | 23 | 2 | 348 |
| 420 | 339 | 645 | 182 | 61 | ||
| n = 330 | ||||||
| Group | Preservation | Enhancement | Rehabilitation | Reestablishment | Establishment | |
| Loss | 7 | 6 | 5 | 1 | 2 | 21 |
| Partial | 19 | 13 | 8 | 5 | 5 | 50 |
| NNL | 84 | 37 | 13 | 7 | 6 | 147 |
| Gain | 56 | 33 | 3 | 12 | 8 | 112 |
| 166 | 89 | 29 | 25 | 21 | ||
| n = 151 | ||||||
| Species | Preservation | Enhancement | Rehabilitation | Reestablishment | Establishment | |
| Loss | 0 | 2 | 0 | 3 | 1 | 6 |
| Partial | 13 | 3 | 6 | 6 | 5 | 33 |
| NNL | 45 | 10 | 4 | 2 | 5 | 66 |
| Gain | 32 | 5 | 2 | 5 | 2 | 46 |
| 90 | 20 | 12 | 16 | 13 |
References
- Di Marco, M.; Harwood, T.D.; Hoskins, A.J.; Ware, C.; Hill, S.L.L.; Ferrier, S. Projecting impacts of global climate and land-use scenarios on plant biodiversity using compositional-turnover modelling. Glob. Chang. Biol. 2019, 25, 2763–2778. [Google Scholar] [CrossRef] [PubMed]
- Newbold, T.; Hudson, L.N.; Arnell, A.P.; Contu, S.; De Palma, A.; Ferrier, S.; Hill, S.L.L.; Hoskins, A.J.; Lysenko, I.; Phillips, H.R.P.; et al. Has land use pushed terrestrial biodiversity beyond the planetary boundary? A global assessment. Science 2016, 353, 288–291. [Google Scholar] [CrossRef] [PubMed]
- Reid, A.J.; Carlson, A.K.; Creed, I.F.; Eliason, E.J.; Gell, P.A.; Johnson, P.T.J.; Kidd, K.A.; MacCormack, T.J.; Olden, J.D.; Ormerod, S.J.; et al. Emerging threats and persistent conservation challenges for freshwater biodiversity. Biol. Rev. 2019, 94, 849–873. [Google Scholar] [CrossRef] [Green Version]
- Arlidge, W.N.S.; Bull, J.; Addison, P.F.E.; Burgass, M.J.; Gianuca, D.; Gorham, T.M.; Jacob, C.; Shumway, N.; Sinclair, S.P.; Watson, J.; et al. A Global Mitigation Hierarchy for Nature Conservation. BioScience 2018, 68, 336–347. [Google Scholar] [CrossRef] [PubMed]
- Bull, J.W.; Suttle, K.B.; Gordon, A.; Singh, N.J.; Milner-Gulland, E.J. Biodiversity offsets in theory and practice. Oryx 2013, 47, 369–380. [Google Scholar] [CrossRef] [Green Version]
- GIBOP 2022. Global Inventory of Biodiversity Offset Policies. Available online: https://portals.iucn.org/offsetpolicy/ (accessed on 14 April 2022).
- Phalan, B.; Hayes, G.; Brooks, S.; Marsh, D.; Howard, P.; Costelloe, B.; Vira, B.; Kowalska, A.; Whitaker, S. Avoiding impacts on biodiversity through strengthening the first stage of the mitigation hierarchy. Oryx 2018, 52, 316–324. [Google Scholar] [CrossRef] [Green Version]
- McKenney, B.A.; Kiesecker, J.M. Policy Development for Biodiversity Offsets: A Review of Offset Frameworks. Environ. Manag. 2009, 45, 165–176. [Google Scholar] [CrossRef]
- McKenney, B. Environmental Offset Policies, Principles, and Methods: A Review of Selected Legislative Frameworks; Biodiversity Neutral Initiative: Amherst, NH, USA, 2005; Available online: https://www.issuelab.org/resources/23404/23404.pdf (accessed on 11 May 2022).
- Gardner, R.C. In-Lieu fee mitigation: Money for nothing? In Lawyers, Swamps, and Money; Island Press: Washington, DC, USA, 2011; pp. 129–140. [Google Scholar] [CrossRef]
- Grimm, M.; Köppel, J. Biodiversity Offset Program Design and Implementation. Sustainability 2019, 11, 6903. [Google Scholar] [CrossRef] [Green Version]
- Boisvert, V. Conservation banking mechanisms and the economization of nature: An institutional analysis. Ecosyst. Serv. 2015, 15, 134–142. [Google Scholar] [CrossRef] [Green Version]
- U.S. Environmental Protection Agency. Federal Guidance for the Establishment, Use and Operation of Mitigation Banks (228). 28 November 1995. Available online: https://www.epa.gov/cwa-404/federal-guidance-establishment-use-and-operation-mitigation-banks (accessed on 14 May 2022).
- U.S. Fish and Wildlife Service. Guidance on the Establishment, Use, and Operation of Habitat Conservation Banks; U.S. Department of the Interior Fish and Wildlife Service: Washington, DC, USA, 2003.
- U.S. Fish and Wildlife Service. Conservation Banking Incentives for Stewardship. 2019. Available online: https://www.fws.gov/endangered/esa-library/pdf/conservation_banking.pdf (accessed on 14 May 2022).
- White, W. The advantages and opportunities. In Conservation and Biodiversity Banking: A Guide to Setting up and Running Biodiversity Credit Trading Systems; Bayon, R., Carroll, N., Fox, J., Eds.; Taylor & Francis: Abingdon, UK, 2012; pp. 33–43. [Google Scholar]
- U.S. Army Corps of Engineers. Compensatory Mitigation for Losses of Aquatic Resources. 2008. Available online: https://www.govinfo.gov/content/pkg/CFR-2012-title33-vol3/xml/CFR-2012-title33-vol3-part332.xml (accessed on 13 May 2022).
- Gamarra, M.J.C.; Toombs, T.P. Thirty years of species conservation banking in the U.S.: Comparing policy to practice. Biol. Conserv. 2017, 214, 6–12. [Google Scholar] [CrossRef]
- Moreno-Mateos, D.; Maris, V.; Béchet, A.; Curran, M. The true loss caused by biodiversity offsets. Biol. Conserv. 2015, 192, 552–559. [Google Scholar] [CrossRef]
- Burgin, S. BioBanking: An environmental scientist’s view of the role of biodiversity banking offsets in conservation. Biodivers. Conserv. 2008, 17, 807–816. [Google Scholar] [CrossRef]
- Maron, M.; Ives, C.D.; Kujala, H.; Bull, J.; Maseyk, F.J.F.; Bekessy, S.; Gordon, A.; Watson, J.; Lentini, P.; Gibbons, P.; et al. Taming a Wicked Problem: Resolving Controversies in Biodiversity Offsetting. BioScience 2016, 66, 489–498. [Google Scholar] [CrossRef] [Green Version]
- zu Ermgassen, S.O.S.E.; Baker, J.; Griffiths, R.A.; Strange, N.; Struebig, M.J.; Bull, J.W. The ecological outcomes of biodiversity offsets under “no net loss” policies: A global review. Conserv. Lett. 2019, 12, e12664. [Google Scholar] [CrossRef] [Green Version]
- Quétier, F.; Lavorel, S. Assessing ecological equivalence in biodiversity offset schemes: Key issues and solutions. Biol. Conserv. 2011, 144, 2991–2999. [Google Scholar] [CrossRef]
- Gardner, R.C.; Pulley Radwan, T.J. What happens when a wetland mitigation bank goes bankrupt? Environ. Law Rep. 2005, 35, 10590–10604. Available online: https://ssrn.com/abstract=1127982 (accessed on 7 January 2022).
- Matthews, J.W.; Endress, A.G. Performance Criteria, Compliance Success, and Vegetation Development in Compensatory Mitigation Wetlands. Environ. Manag. 2007, 41, 130–141. [Google Scholar] [CrossRef]
- Gutrich, J.J.; Hitzhusen, F.J. Assessing the substitutability of mitigation wetlands for natural sites: Estimating restoration lag costs of wetland mitigation. Ecol. Econ. 2004, 48, 409–424. [Google Scholar] [CrossRef]
- Bonds, M.H.; Pomp, J.J. Calculating Wetland Mitigation Banking Credits: Adjusting for Wetland Function and Location. Nat. Resour. J. 2003, 43, 961–977. Available online: https://digitalrepository.unm.edu/nrj/vol43/iss4/3 (accessed on 12 May 2022).
- Burgin, S. ‘Mitigation banks’ for wetland conservation: A major success or an unmitigated disaster? Wetl. Ecol. Manag. 2009, 18, 49–55. [Google Scholar] [CrossRef]
- University of Maryland—Center for Environmental Science Integration and Application Network. Available online: https://ian.umces.edu/media-library/ (accessed on 15 May 2022).
- Fox, J.; Nino-Murcia, A. Status of Species Conservation Banking in the United States. Conserv. Biol. 2005, 19, 996–1007. [Google Scholar] [CrossRef]
- Mead, D.L. History and Theory: The Origin and Evolution of Conservation Banking. In Conservation and Biodiversity Banking: A Guide to Setting up and Running Biodiversity Credit Trading Systems, 1st ed.; Bayon, R., Carroll, N., Fox, J., Eds.; Taylor & Francis: Abingdon, UK, 2007; pp. 7–30. [Google Scholar]
- U.S. Army Corps of Engineers. The Mitigation Rule Retrospective: A Review of the 2008 Regulations. 2 November 2015. Available online: https://www.iwr.usace.army.mil/Media/News-Stories/Article/626925/iwr-releases-the-mitigation-rule-retrospective-a-review-of-the-2008-regulations/ (accessed on 14 May 2022).
- Regulatory In-Lieu Fee and Bank Information Tracking System (RIBITS). Available online: https://ribits.ops.usace.army (accessed on 17 August 2021).
- Grimm, M. Metrics and Equivalence in Conservation Banking. Land 2021, 10, 565. [Google Scholar] [CrossRef]
- Sonter, L.J.; Barnes, M.; Matthews, J.W.; Maron, M. Quantifying habitat losses and gains made by U.S. Species Conservation Banks to improve compensation policies and avoid perverse outcomes. Conserv. Lett. 2019, 12, e12629. [Google Scholar] [CrossRef] [Green Version]
- Cowardin, L.M.; U.S. Fish and Wildlife Service; Biological Services Program. Classification of Wetlands and Deepwater Habitats of the United States; Fish and Wildlife Service, U.S. Dept. of the Interior: Washington, DC, USA, 1979. [CrossRef] [Green Version]
- Ruppert, J.L.; Hogg, J.; Poesch, M.S. Community assembly and the sustainability of habitat offsetting targets in the first compensation lake in the oil sands region in Alberta, Canada. Biol. Conserv. 2018, 219, 138–146. [Google Scholar] [CrossRef]
- Wickham, H. Package ‘rvest’. 2021. Available online: https://cran.r-project.org/web/packages/rvest/rvest.pdf (accessed on 28 November 2021).
- R Core Team. Version 4.1.0. June 2020. Available online: https://cran.r-project.org/doc/manuals/r-devel/NEWS.html (accessed on 15 May 2022).
- Hamilton, D.F.; Ghert, M.; Simpson, A.H.R.W. Interpreting regression models in clinical outcome studies. Bone Jt. Res. 2015, 4, 152–153. [Google Scholar] [CrossRef] [Green Version]
- Ebbert, D. Package ‘Chisq.posthoc.test’. 2019. Available online: https://cran.r-project.org/web/packages/chisq.posthoc.test/chisq.posthoc.test.pdf (accessed on 15 May 2022).
- Allaire, J.J. Package ‘Networkd3’. 2017. Available online: https://cran.r-project.org/web/packages/networkD3/networkD3.pdf (accessed on 14 December 2021).
- Sarkar, D. Package ‘Lattice’. 2021. Available online: https://cran.r-project.org/web/packages/lattice/lattice.pdf (accessed on 17 January 2022).
- U.S. Environmental Protection Agency. Principles for the Ecological Restoration of Aquatic Resources; EPA841-F-00-003; Office of Water (4501F), United States Environmental Protection Agency: Washington, DC, USA, 2000; p. 4.
- U.S. Fish and Wildlife Service. Status and Trends of Wetlands in the Coastal Watersheds of the Conterminous United States. 2013. Available online: https://www.fws.gov/wetlands/documents/Status-and-Trends-of-Wetlands-In-the-Coastal-Watersheds-of-the-Conterminous-US-2004-to-2009.pdf (accessed on 11 May 2022).
- U.S. Fish and Wildlife Service. Status and Trends of Prairie Wetlands in the United States 1997 to 2009. 2014. Available online: https://www.fws.gov/wetlands/documents/Status-and-Trends-of-Prairie-Wetlands-in-the-United-States-1997-to-2009.pdf (accessed on 11 May 2022).
- Miller, R.L.; Fujii, R. Plant community, primary productivity, and environmental conditions following wetland re-establishment in the Sacramento-San Joaquin Delta, California. Wetl. Ecol. Manag. 2009, 18, 1–16. [Google Scholar] [CrossRef]
- Liebesman, L.R.; Plott, D.M. The emergence of private wetlands mitigation banking. Nat. Resour. Environ. 1998, 13, 341–344. Available online: https://www.jstor.org/stable/40923767 (accessed on 19 November 2021).
- Dahl, T.E. Status and Trends of Wetlands in the Conterminous United States 1986 to 1997; U.S. Department of the Interior; U.S. Fish and Wildlife Service: Washington, DC, USA, 2000.
- Kihslinger, R.; Libre, C.; Ma, K.R.; Okuno, E.; Gardner, R.C. In-Lieu Fee Mitigation: Review of Program Instruments and Implementation Across the Country; Environmental Law Institute: Washington, DC, USA, 2019. [Google Scholar]
- Palmer, M.A.; Hondula, K.L. Restoration as Mitigation: Analysis of Stream Mitigation for Coal Mining Impacts in Southern Appalachia. Environ. Sci. Technol. 2014, 48, 10552–10560. [Google Scholar] [CrossRef] [Green Version]
- Gibson, R.J.; Haedrich, R.L.; Wernerheim, C.M. Loss of Fish Habitat as a Consequence of Inappropriately Constructed Stream Crossings. Fisheries 2005, 30, 10–17. [Google Scholar] [CrossRef]
- Sweeney, B.W.; Bott, T.L.; Jackson, J.K.; Kaplan, L.A.; Newbold, J.D.; Standley, L.J.; Hession, W.C.; Horwitz, R.J. Riparian deforestation, stream narrowing, and loss of stream ecosystem services. Proc. Natl. Acad. Sci. USA 2004, 101, 14132–14137. [Google Scholar] [CrossRef] [Green Version]
- Roni, P.; Hanson, K.; Beechie, T. Global Review of the Physical and Biological Effectiveness of Stream Habitat Rehabilitation Techniques. N. Am. J. Fish. Manag. 2008, 28, 856–890. [Google Scholar] [CrossRef]
- Larson, M.G.; Booth, D.; Morley, S.A. Effectiveness of large woody debris in stream rehabilitation projects in urban basins. Ecol. Eng. 2001, 18, 211–226. [Google Scholar] [CrossRef] [Green Version]
- Suren, A.M. Using Macrophytes in Urban Stream Rehabilitation: A Cautionary Tale. Restor. Ecol. 2009, 17, 873–883. [Google Scholar] [CrossRef]
- Teels, B.M.; Mazanti, L.E.; Rewa, C.A. Using an IBI to assess effectiveness of mitigation measures to replace loss of a wetland-stream ecosystem. Wetlands 2004, 24, 375–384. [Google Scholar] [CrossRef]
- Lave, R.; Robertson, M.M.; Doyle, M.W. Why You Should Pay Attention to Stream Mitigation Banking. Ecol. Restor. 2008, 26, 287–289. [Google Scholar] [CrossRef]
- Webb, N. The traditional management of European heathlands. J. Appl. Ecol. 2008, 35, 987–990. [Google Scholar] [CrossRef]
- U.S. Fish and Wildlife Service. $4.3 Million for Neotropical Migratory Birds and Habitat Conservation; U.S. Fish & Wildlife Service: Washington, DC, USA, 2011. Available online: https://www.fws.gov/news/ShowNews.cfm?ref=$43-million-for-neotropical-migratory-birds-and-habitat-conservation&_ID=30796 (accessed on 5 April 2022).
- Allgas, N.; Shanee, S.; Shanee, N.; Chambers, J.; Tello-Alvarado, J.C.; Keeley, K.; Pinasco, K. Natural re-establishment of a population of a critically endangered primate in a secondary forest: The San Martin titi monkey (Plecturocebus oenanthe) at the Pucunucho Private Conservation Area, Peru. Primates 2016, 58, 335–342. [Google Scholar] [CrossRef]
- Kaplan, Z.; Šumberová, K.; Formanová, I.; Ducháček, M. Re-establishment of an extinct population of the endangered aquatic plant Potamogeton coloratus. Aquat. Bot. 2014, 119, 91–99. [Google Scholar] [CrossRef]
- Harris, J.B.C.; Fordham, D.A.; Mooney, P.A.; Pedler, L.P.; Araújo, M.B.; Paton, D.C.; Stead, M.G.; Watts, M.J.; Akçakaya, H.R.; Brook, B.W. Managing the long-term persistence of a rare cockatoo under climate change. J. Appl. Ecol. 2012, 49, 785–794. [Google Scholar] [CrossRef]
- Cimon-Morin, J.; Poulin, M. Setting conservation priorities in cities: Approaches, targets and planning units adapted to wetland biodiversity and ecosystem services. Landsc. Ecol. 2018, 33, 1975–1995. [Google Scholar] [CrossRef]
- Strassburg, B.B.N.; Iribarrem, A.; Beyer, H.L.; Cordeiro, C.L.; Crouzeilles, R.; Jakovac, C.C.; Junqueira, A.B.; Lacerda, E.; Latawiec, A.E.; Balmford, A.; et al. Global priority areas for ecosystem restoration. Nature 2020, 586, 724–729. [Google Scholar] [CrossRef] [PubMed]
- Cameron, D.R.; Marvin, D.C.; Remucal, J.M.; Passero, M.C. Ecosystem management and land conservation can substantially contribute to California’s climate mitigation goals. Proc. Natl. Acad. Sci. USA 2017, 114, 12833–12838. [Google Scholar] [CrossRef] [PubMed] [Green Version]
- Rondinini, C.; Chiozza, F. Quantitative methods for defining percentage area targets for habitat types in conservation planning. Biol. Conserv. 2010, 143, 1646–1653. [Google Scholar] [CrossRef]
- Langler, G.J.; Smith, C. Effects of habitat enhancement on 0-group fishes in a lowland river. Regul. Rivers: Res. Manag. 2001, 17, 677–686. [Google Scholar] [CrossRef]
- Salt, D.; Freudenberger, D. Biodiversity and habitat enhancement. In Agroforestry for Natural Resource Management, 1st ed.; Nuberg, I., George, B., Reid, R., Eds.; CSIRO Publishing: Clayton, Australia, 2009; pp. 87–106. [Google Scholar]
- Gardner, T.A.; von Hase, A.; Brownlie, S.; Ekstrom, J.M.M.; Pilgrim, J.D.; Savy, C.E.; Stephens, R.T.T.; Treweek, J.; Ussher, G.T.; Ward, G.; et al. Biodiversity Offsets and the Challenge of Achieving No Net Loss. Conserv. Biol. 2013, 27, 1254–1264. [Google Scholar] [CrossRef]
- Turner, R.E.; Redmond, A.M.; Zedler, J.B. Count it by acre or function Mitigation adds up to net loss of wetlands. Natl. Wetl. Newsl. 2011, 23, 1–5. Available online: http://www.eli.org/ (accessed on 11 November 2021).
- Walker, S.; Brower, A.L.; Stephens, R.T.; Lee, W.G. Why bartering biodiversity fails. Conserv. Lett. 2009, 2, 149–157. [Google Scholar] [CrossRef]
- Bull, J.; Milner-Gulland, E.; Suttle, K.; Singh, N. Comparing biodiversity offset calculation methods with a case study in Uzbekistan. Biol. Conserv. 2014, 178, 2–10. [Google Scholar] [CrossRef] [Green Version]
- Quétier, F.; Regnery, B.; Levrel, H. No net loss of biodiversity or paper offsets? A critical review of the French no net loss policy. Environ. Sci. Policy 2014, 38, 120–131. [Google Scholar] [CrossRef] [Green Version]
- Maron, M.; Hobbs, R.; Moilanen, A.; Matthews, J.; Christie, K.; Gardner, T.A.; Keith, D.A.; Lindenmayer, D.B.; McAlpine, C. Faustian bargains? Restoration realities in the context of biodiversity offset policies. Biol. Conserv. 2012, 155, 141–148. [Google Scholar] [CrossRef]
- Theis, S.; Ruppert, J.L.; Roberts, K.N.; Minns, C.K.; Koops, M.; Poesch, M.S. Compliance with and ecosystem function of biodiversity offsets in North American and European freshwaters. Conserv. Biol. 2019, 34, 41–53. [Google Scholar] [CrossRef] [PubMed]
- Pattison, J.; Boxall, P.C.; Adamowicz, W.L. The Economic Benefits of Wetland Retention and Restoration in Manitoba. Can. J. Agric. Econ. Can. Agroecon. 2011, 59, 223–244. [Google Scholar] [CrossRef]
- Ramchunder, S.J.; Brown, L.E.; Holden, J. Catchment-scale peatland restoration benefits stream ecosystem biodiversity. J. Appl. Ecol. 2011, 49, 182–191. [Google Scholar] [CrossRef] [Green Version]
- Poulton, D. Key Issues in Biodiversity Offset Law and Policy: A Comparison of Six Jurisdictions. Ontario Nature’s Greenway Guide Series, June 2015. 2016. Available online: https://ssrn.com/abstract=2797384 (accessed on 22 January 2022).
- Poudel, J.; Zhang, D.; Simon, B. Habitat conservation banking trends in the United States. Biodivers. Conserv. 2019, 28, 1629–1646. [Google Scholar] [CrossRef]
- Poudel, J.; Pokharel, R. Financial Analysis of Habitat Conservation Banking in California. Sustainability 2021, 13, 12441. [Google Scholar] [CrossRef]
- Levrel, H.; Scemama, P.; Vaissière, A.-C. Should We Be Wary of Mitigation Banking? Evidence Regarding the Risks Associated with this Wetland Offset Arrangement in Florida. Ecol. Econ. 2017, 135, 136–149. [Google Scholar] [CrossRef]
- Lambertucci, S.; Alarcón, P.; Hiraldo, F.; Sanchez-Zapata, J.A.; Blanco, G.; Donázar, J.A. Apex scavenger movements call for transboundary conservation policies. Biol. Conserv. 2014, 170, 145–150. [Google Scholar] [CrossRef] [Green Version]
- Trouwborst, A. Transboundary Wildlife Conservation in A Changing Climate: Adaptation of the Bonn Convention on Migratory Species and Its Daughter Instruments to Climate Change. Diversity 2012, 4, 258–300. [Google Scholar] [CrossRef] [Green Version]
- Catalano, A.S.; Lyons-White, J.; Mills, M.M.; Knight, A.T. Learning from published project failures in conservation. Biol. Conserv. 2019, 238, 108223. [Google Scholar] [CrossRef]
- Stoellinger, T. Implications of a Greater Sage-Grouse Listing on Western Energy Development. Policy Brief, 33. 2014. Available online: https://www.nardep.info/wpcontent/uploads/2020/09/Brief33_ImplicationsListingSageGrouse.pdf (accessed on 13 March 2022).
- Gamarra, M.J.C.; Lassoie, J.P.; Milder, J. Accounting for no net loss: A critical assessment of biodiversity offsetting metrics and methods. J. Environ. Manag. 2018, 220, 36–43. [Google Scholar] [CrossRef]
- Poudel, J.; Zhang, D.; Simon, B. Estimating the demand and supply of conservation banking markets in the United States. Land Use Policy 2018, 79, 320–325. [Google Scholar] [CrossRef]
- Anderson, C.M.; Field, C.B.; Mach, K.J. Forest offsets partner climate-change mitigation with conservation. Front. Ecol. Environ. 2017, 15, 359–365. [Google Scholar] [CrossRef]
- Roberts, C.M.; O’Leary, B.C.; Hawkins, J.P. Climate change mitigation and nature conservation both require higher protected area targets. Philos. Trans. R. Soc. B Biol. Sci. 2020, 375, 20190121. [Google Scholar] [CrossRef] [PubMed] [Green Version]
- Coggan, A.; Carwardine, J.; Fielke, S.; Whitten, S. Co-creating knowledge in environmental policy development. An analysis of knowledge co-creation in the review of the Significant Residual Impact Guidelines for environmental offsets in Queensland, Australia. Environ. Chall. 2021, 4, 100138. [Google Scholar] [CrossRef]
- May, J.; Hobbs, R.; Valentine, L. Are offsets effective? An evaluation of recent environmental offsets in Western Australia. Biol. Conserv. 2017, 206, 249–257. [Google Scholar] [CrossRef] [Green Version]
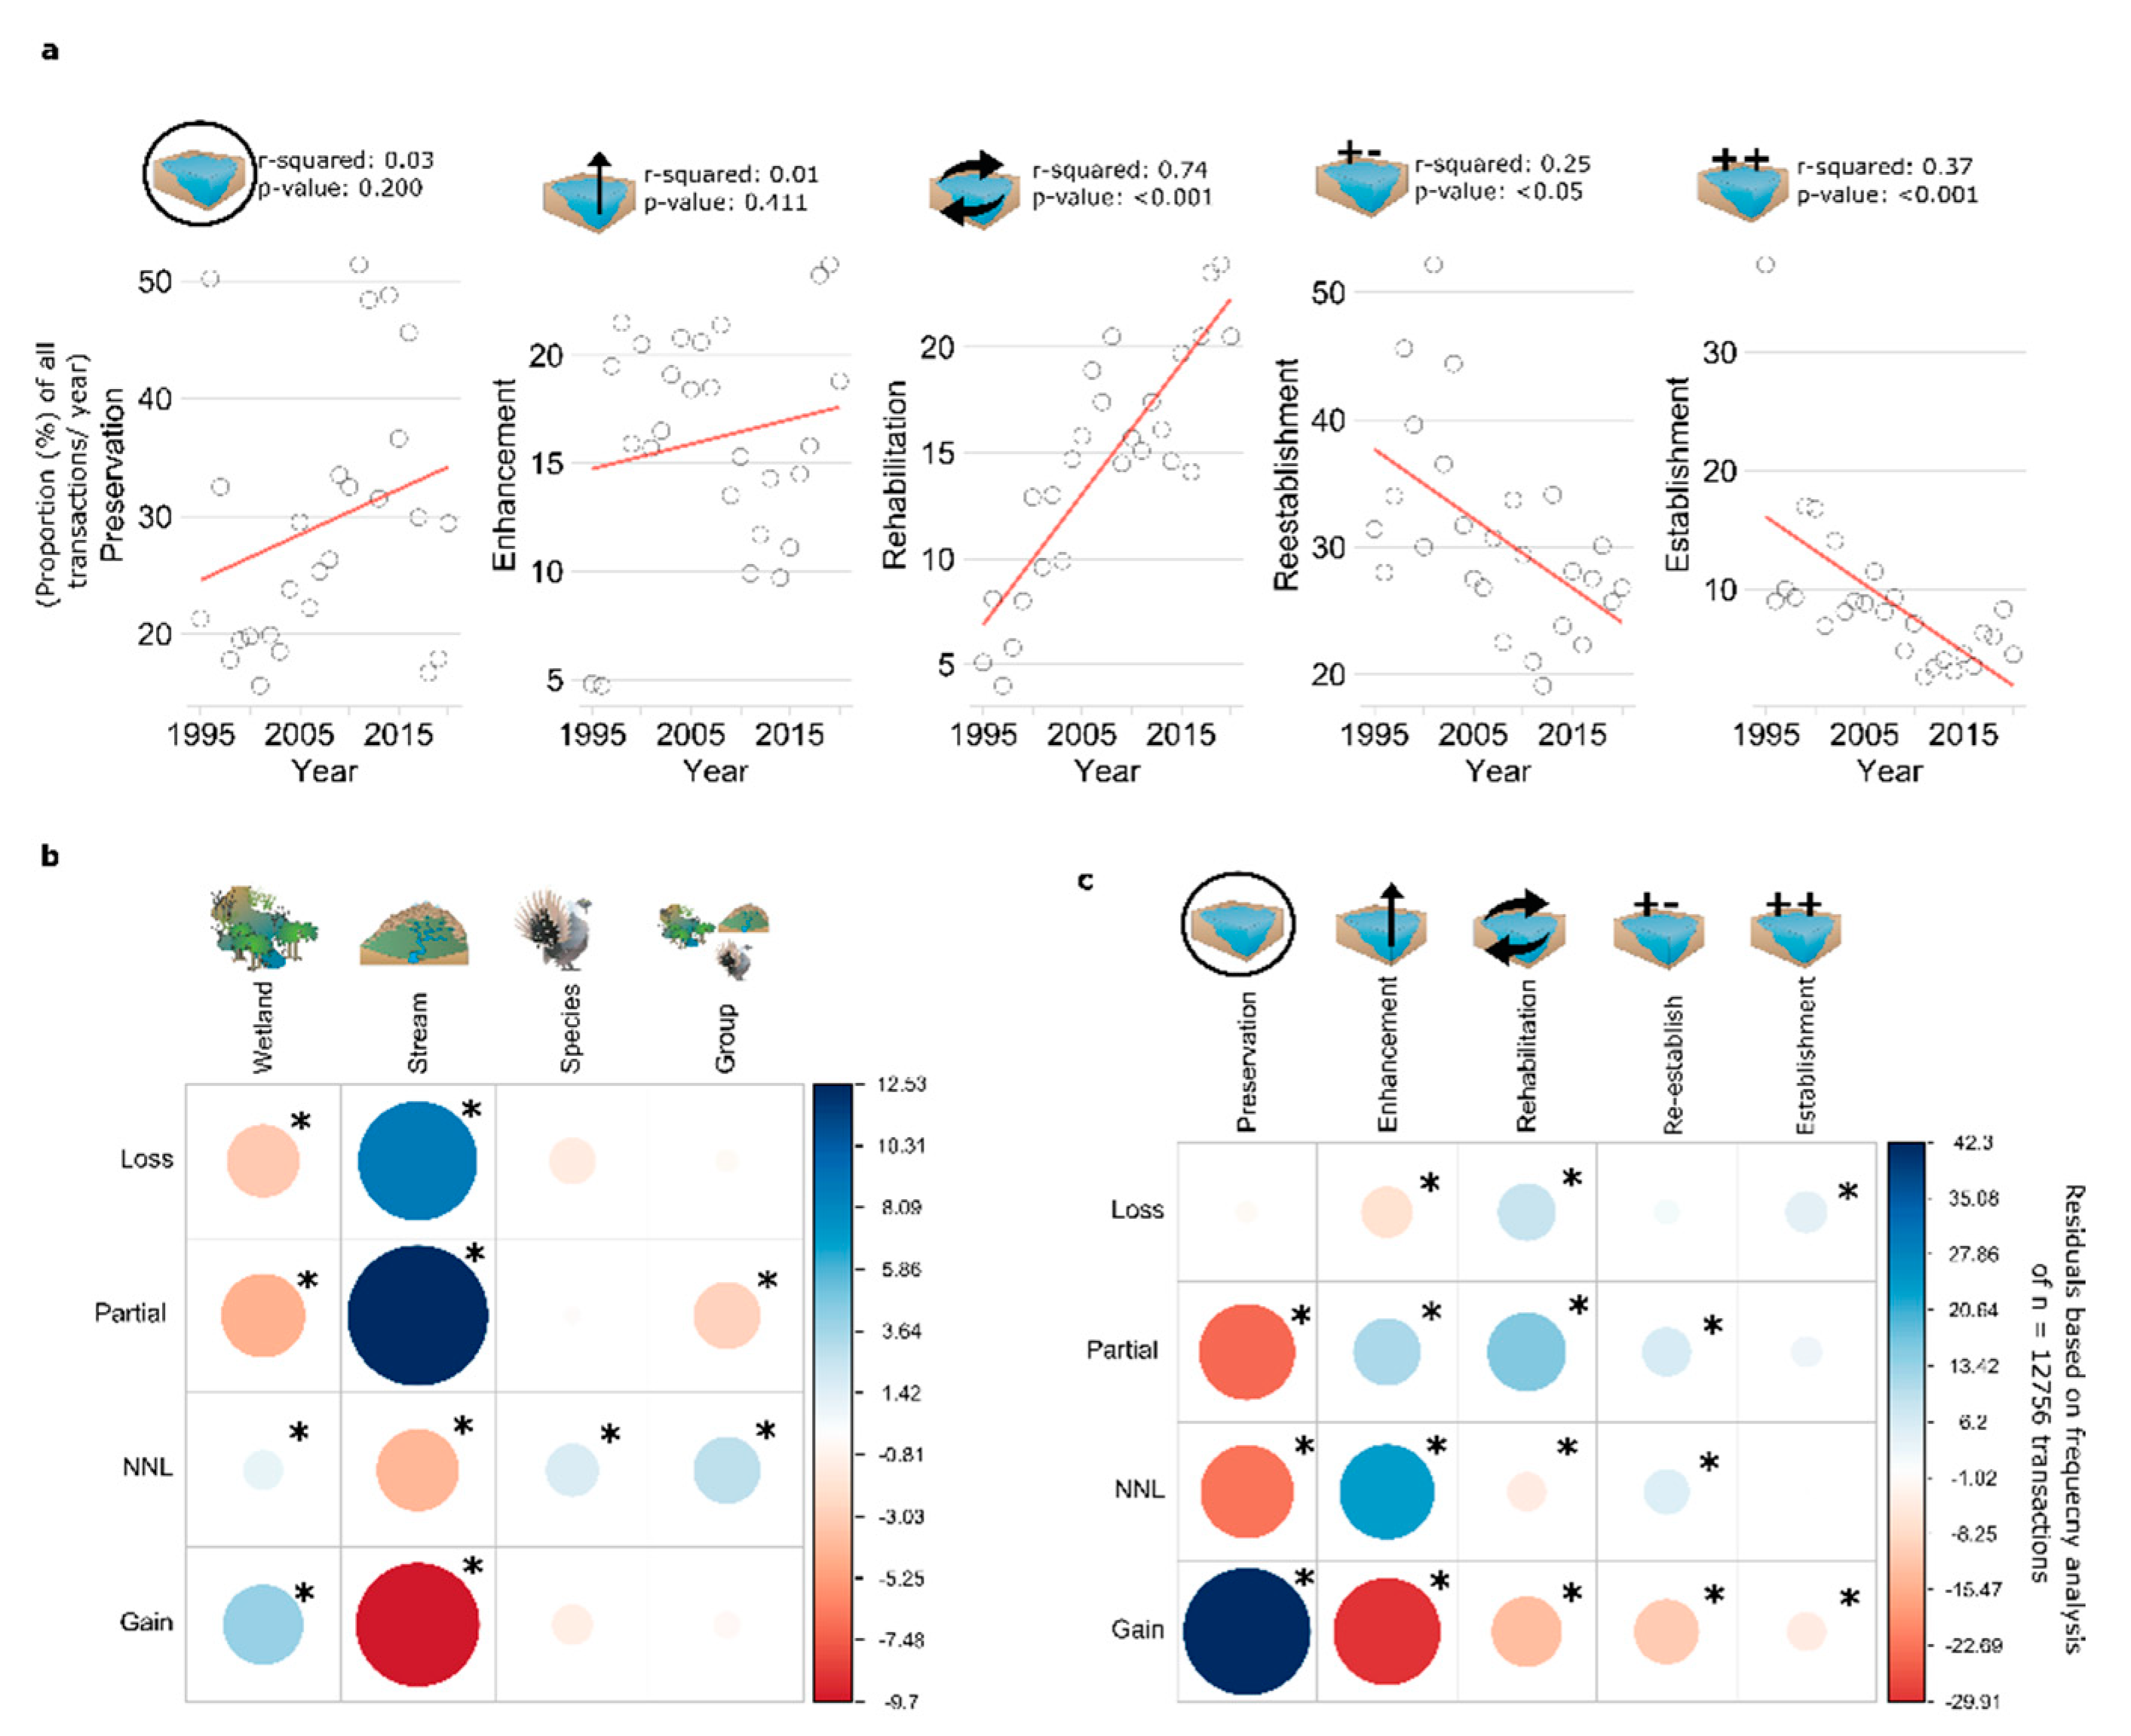
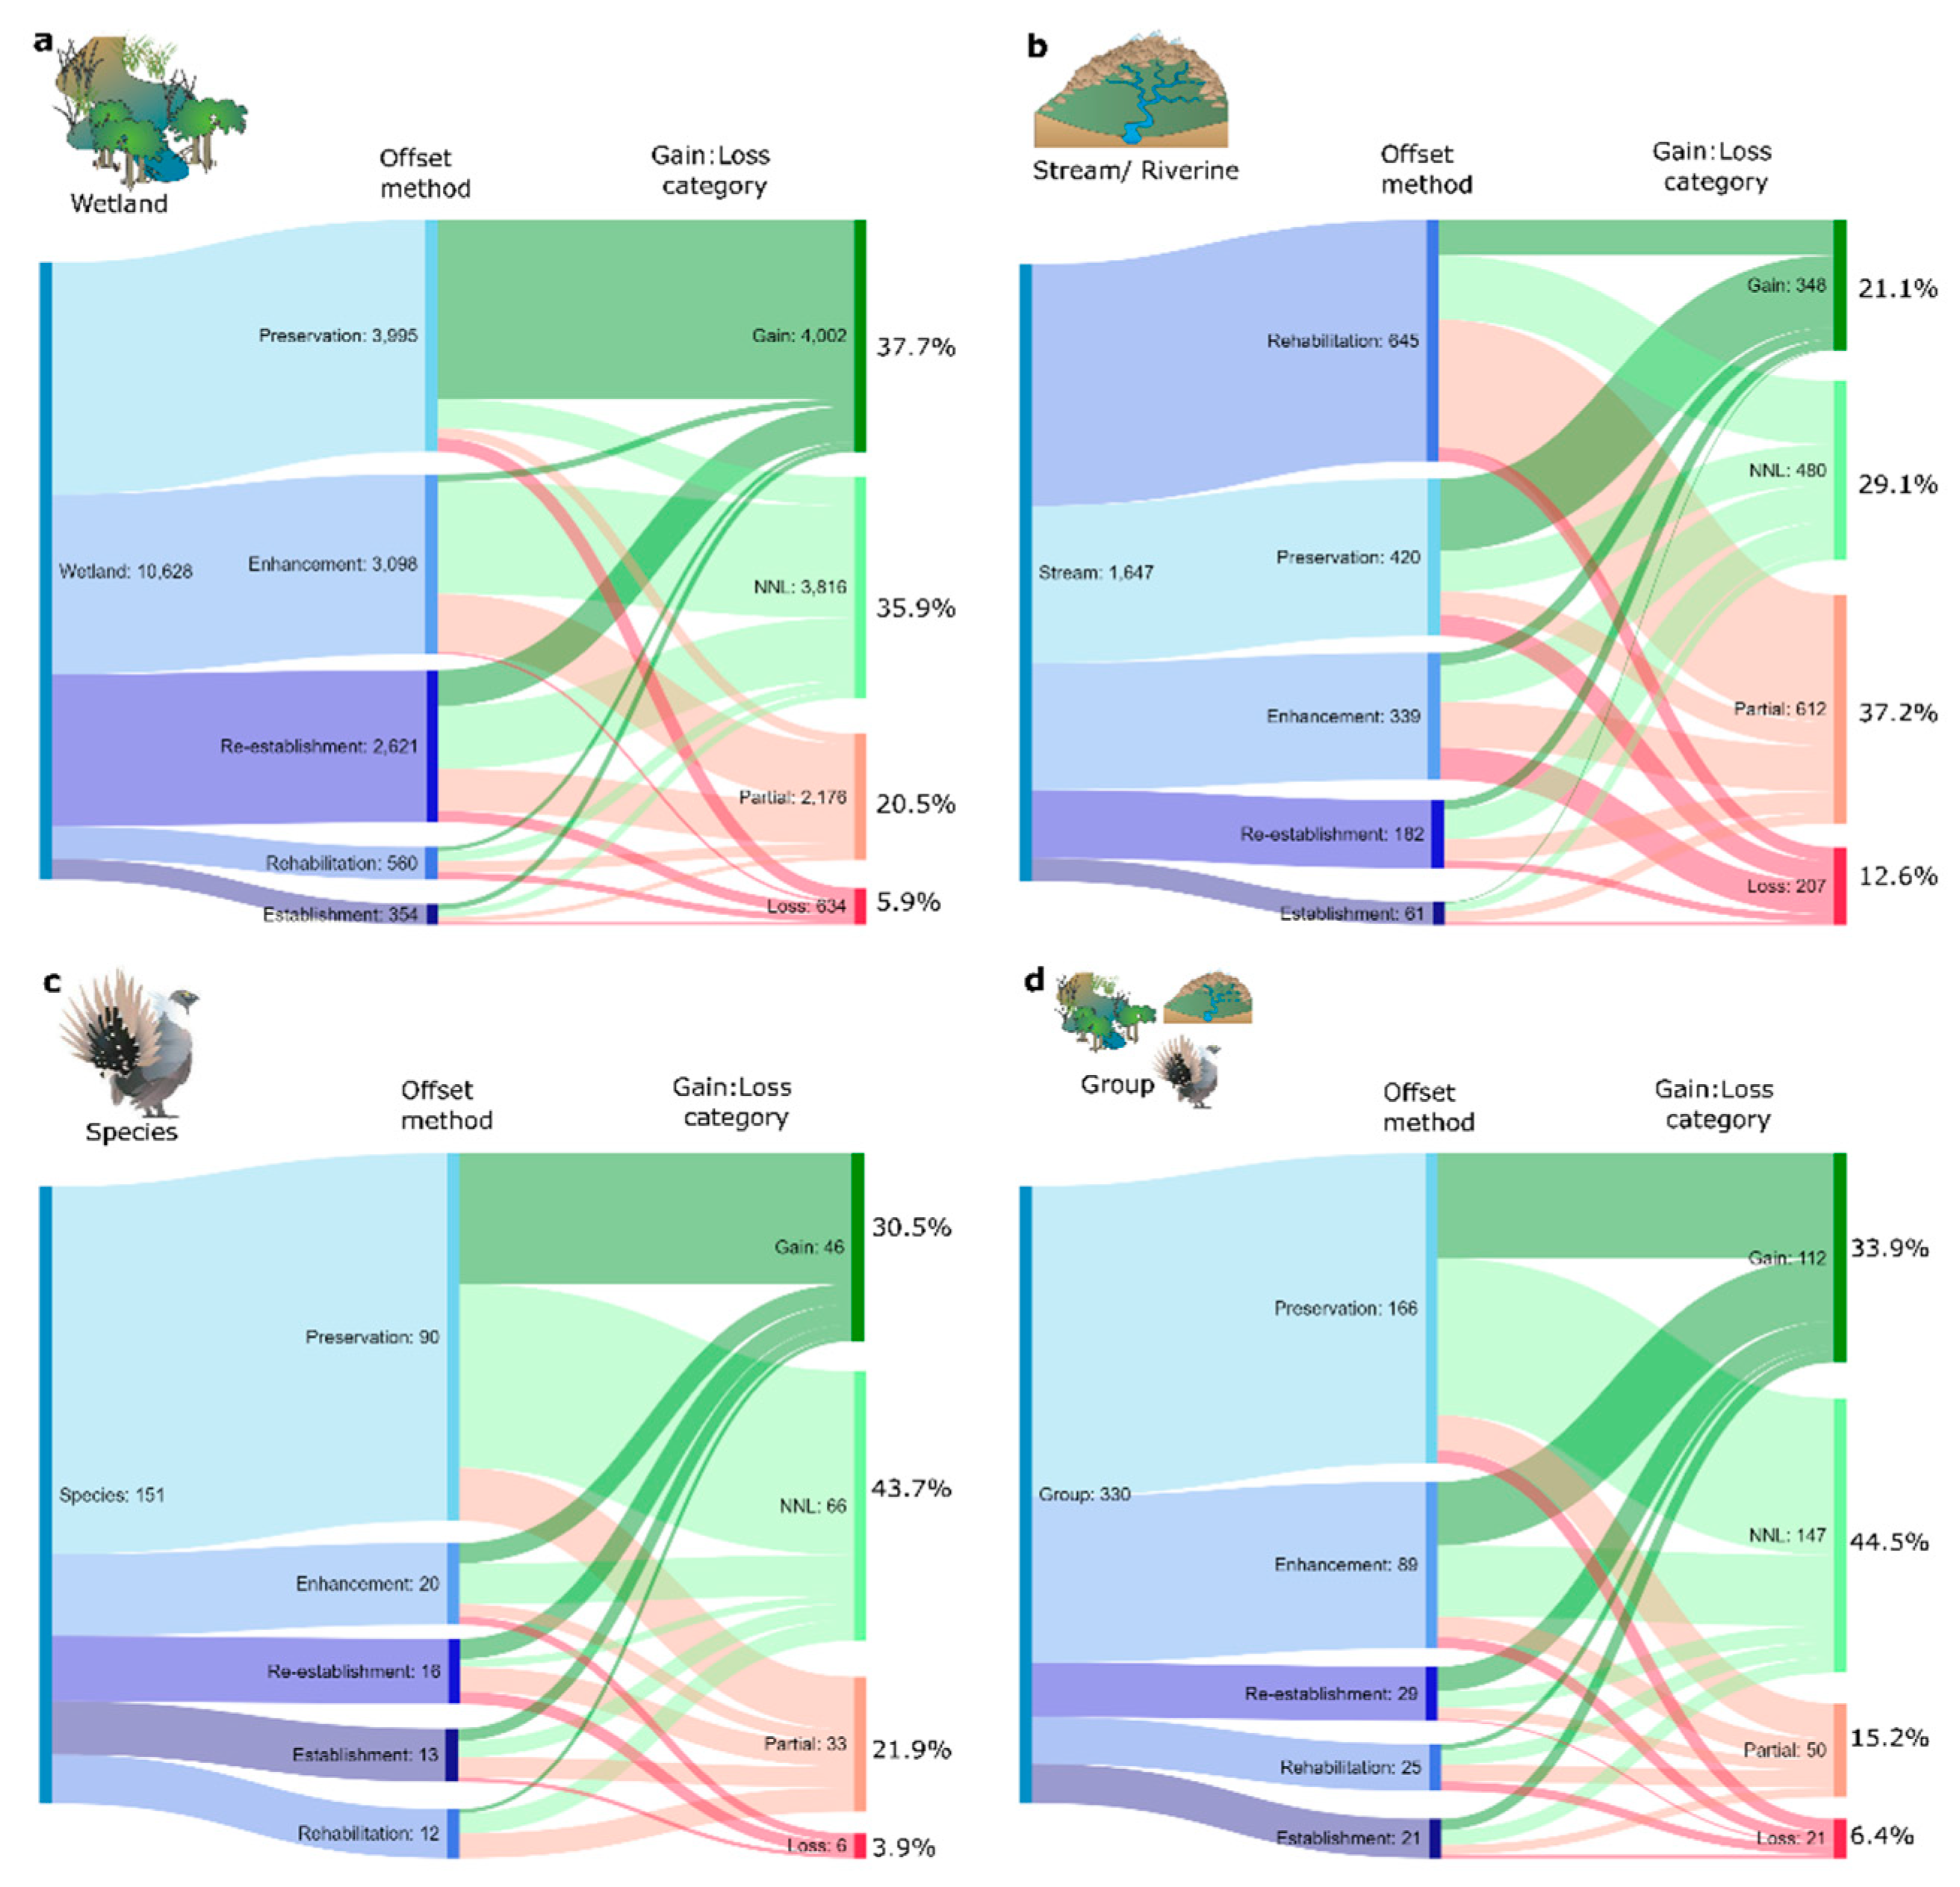
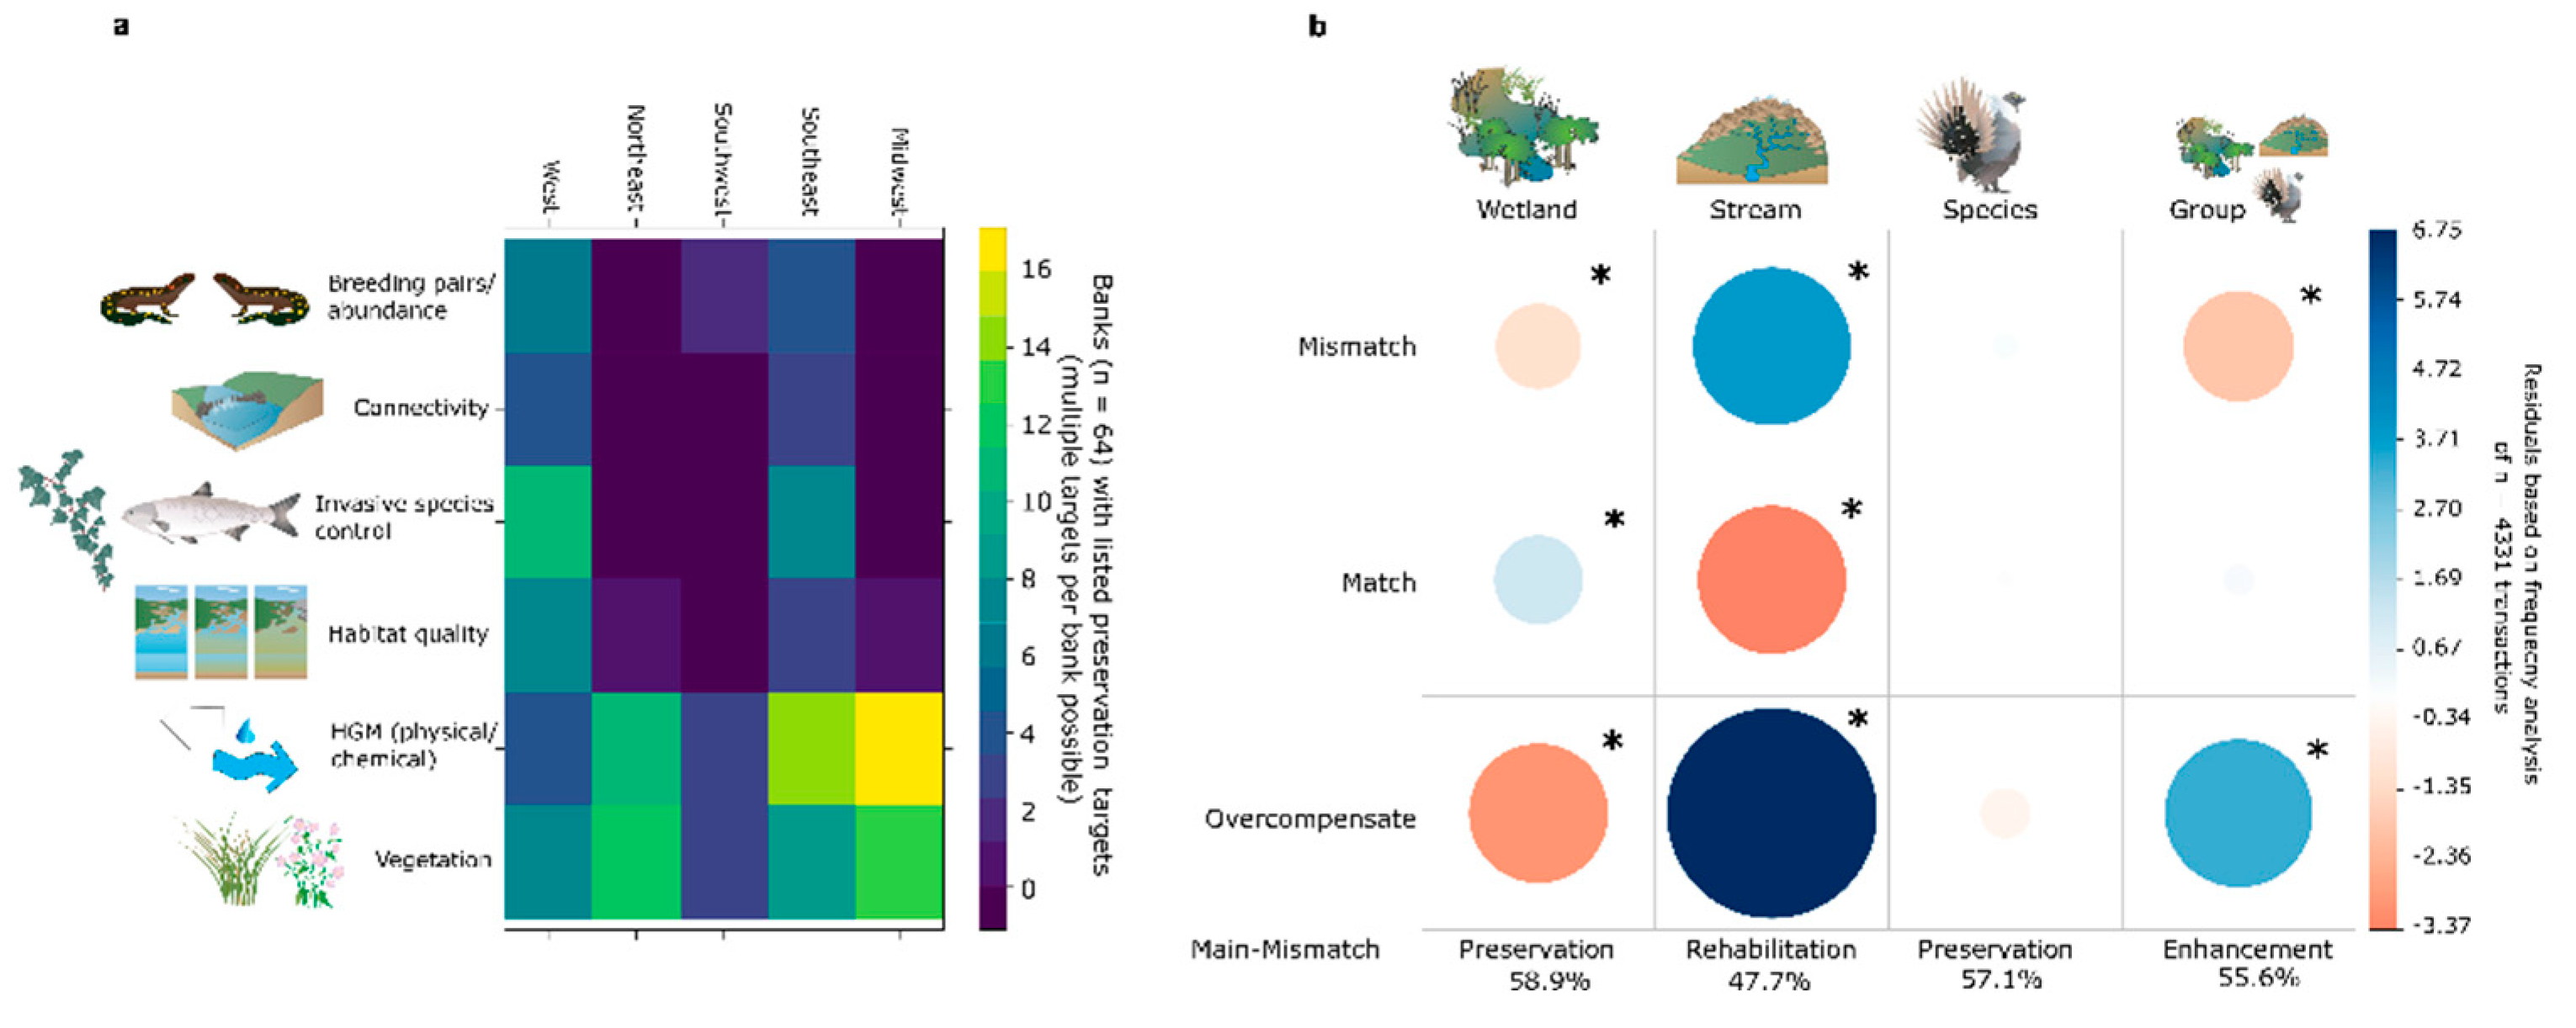
Publisher’s Note: MDPI stays neutral with regard to jurisdictional claims in published maps and institutional affiliations. |
© 2022 by the authors. Licensee MDPI, Basel, Switzerland. This article is an open access article distributed under the terms and conditions of the Creative Commons Attribution (CC BY) license (https://creativecommons.org/licenses/by/4.0/).