Article

Feasibility of Using Coal Ash for the Production of Sustainable Bricks

by
Ahmad Mukhtar
1,
Asad Ullah Qazi
1,
Qasim Shaukat Khan
1,
Muhammad Junaid Munir
2,*,
Syed Minhaj Saleem Kazmi
2 and
Asif Hameed
1
1
Civil Engineering Department, University of Engineering and Technology, Lahore 54890, Pakistan
2
School of Engineering, RMIT University, 376-392 Swanston St., Melbourne, VIC 3001, Australia
*
Author to whom correspondence should be addressed.
Sustainability 2022, 14(11), 6692; https://doi.org/10.3390/su14116692
Submission received: 22 April 2022 / Revised: 21 May 2022 / Accepted: 26 May 2022 / Published: 30 May 2022
(This article belongs to the Special Issue Sustainable Organic Materials Used in the Construction Sector)

Abstract

:
In this research study, environmentally friendly unburnt coal ash (CA) bricks were investigated as an alternative to conventional burnt clay bricks. In this research study, various physical and mechanical properties of unburnt CA bricks were investigated. The unburnt CA bricks were prepared by using 60% CA and 10% lime by weight. In these unburnt CA bricks, varying cement contents (5%, 10%, and 15%), sand contents (10% and 15%), and quarry dust contents (5% and 10%) by weight were used. A forming pressure of 29 MPa was applied through an automatic pressure control system either for 3 s or 6 s. The prepared bricks were moist cured for 28 days. The experimental results exhibited that unburnt CA bricks with 10% cement, 10% sand, and 10% quarry dust subjected to forming pressure for 3 s exhibited the highest compressive strength of 19 MPa and flexural strength of 2.1 MPa. The unburnt CA bricks exhibited reduced water absorption, reduced efflorescence, and lower weight per unit area than the conventional clay bricks. A cost comparison of unburnt CA bricks and clay bricks exhibited that unburnt CA bricks are cost-effective compared to clay bricks.

1. Introduction

Clay is one of the oldest construction materials and clay bricks has been extensively used in the construction industry. The use of clay bricks to build adobe houses dates back to 8000 BC [1,2]. In Pakistan, conventional burnt clay bricks are widely used in the construction industry. Pakistan is the third largest country in South Asia, producing about 45 billion burnt clay bricks per year. In Pakistan, approximately 18,000 brick kilns are functional of which about 7966 brick kilns are functional in Punjab, Pakistan [3,4,5].
The various steps involved in brick preparation are screening of clay to remove debris; manual mixing of clay, sand, and water to make a homogenous mix; molding of brick into the desired shape and size; the drying of brick in the open air; burning of brick in brick kilns at temperatures ranging between 850 and 950 °C to achieve the required hardness, color, and strength [6,7,8]. The production of burnt clay bricks involves the use of beneficial clayey soil, which is important for the cultivation of valuable crops [9,10,11]. In addition, the production of conventional burnt clay bricks releases harmful gases such as carbon dioxide (CO2), carbon monoxide (CO), and sulfur dioxide (SO2) into the environment, enhancing air pollution and negatively affecting human health and the economy [12]. CO2 is one of the main sources of greenhouse gases (GHG), which causes global warming [13,14,15]. Moreover, sulfur dioxide (SO2) and other carcinogenic dioxides and particulate matters (PM) released from the brick kilns have a negative impact on human health [16,17].
In Pakistan, particularly in metropolitan cities, the smog which is a combination of smoke and fog descends in the winter season. Smog has severe negative socio-economic impacts. Airports, motorways, and highways are required to be closed at night and early morning due to smog, which results in delays in the movement of transport goods and the public. Smog has a detrimental impact on the health of the people living in these metropolitan cities, which over burdens the government hospitals in these cities. In the winter season, brick kilns are shut down to reduce the negative impact of smog, which results in reduced production of burnt clay bricks and slowing down of the construction projects [18]. In China and India, the use of clay bricks in the construction work has been reduced to limit the excavation of top fertile clayey soil and to reduce the CO2 and other GHG emissions [19,20,21].
Coal ash (CA) is produced in huge amounts (0.16 billion tons per year) all over the world. However, CA has limited use in the construction industry, mainly in the cement industry [22,23]. CA is an industrial by-product obtained from coal power plants (CPP). In Pakistan, nine CPPs are functional and are producing large amounts of CA. The CA obtained from these CPP is pozzolanic in nature and can be used as a partial replacement for clay in the manufacturing of bricks [24,25,26]. The CA primarily comprises silicon dioxide (SiO2), alumina oxide (Al2O3), and iron oxide (Fe2O3), these oxides react with the calcium oxide in clay and form calcium alumino silicate hydrate (C-A-S-H) and calcium silicate hydrate (CSH) gels. These gels provide the required strength for the CA concrete mix [27].
The use of CA in the brick industry has substantially increased over the years. To reduce the use of clayey soil in burnt clay bricks and to reduce the CO2 emissions in the manufacturing of clay bricks, CA bricks have emerged as an environmentally friendly and cost-effective alternative to clay bricks. CA bricks are lightweight bricks with reduced thermal conductivity, lower water absorption, and improved durability compared with conventional burnt clay bricks [28,29]. CA bricks have up to 10% lesser weight than conventional burnt clay bricks [30,31]. CA bricks also reduce the landfill sites needed to dispose of waste CA [32,33].
In the available research investigations, numerous studies used lime and cement to produce CA bricks [34,35,36]. The lime and cement, rich in calcium oxide, react with silicon dioxide and alumina oxide in CA forming calcium silicate hydrate (C-A-S-H) gel, which develops the strength in CA bricks [27]. In general, gypsum and lime are commonly used in CA bricks to significantly enhance the compressive strength [37]. Prasad et al. [38] developed CA bricks by using calcium-gypsum (Cal-g) with varying percentages of fine aggregates and stone. The test results indicated that the mix with a water to Cal-g ratio of 0.2 attained the compressive strength of 9.14 MPa [38]. Turgut et al. [39] investigated the influence of varying lime content on the compressive strength of CA bricks. The 28-day compressive strength of CA bricks with 10%, 20%, and 30% replacement of lime with CA resulted in 14 MPa, 15 MPa, and 18 MPa compressive strength, respectively [39]. Chindaprasirt et al. [30] investigated the influence of varying percentage replacement levels of CA with hydrated lime on the compressive strength of CA bricks. The compressive strength of CA bricks was increased by 18% (51 MPa to 62.5 MPa) as the percentage replacement of lime with CA was increased from 5% to 10% [30]. Moghaddam et al. [40] investigated the influence of six varying particle sizes of CA. The study noted that the compressive strength was increased with increasing percentage fineness of CA due to the increased formation of needle shape crystalline structures in C-A-S-H gel [40].
In recent years, CA bricks prepared with lime made way for CA bricks prepared with cement. CA bricks prepared with cement require no special curing treatment. CA bricks prepared with a blend of sand and cement are the major step toward the production of eco-friendly durable bricks [20,36,41]. Sivakumar et al. [42] investigated the influence of cement content on self-compacted CA bricks comprising bottom CA, fly CA, and cement. The study noted that the optimum compressive strength of 17.4 MPa was achieved using a bottom CA, fly CA, and cement ratio of 1.25:1:0.45 [42]. Wang et al. [43] prepared CA bricks by applying forming pressure. The optimum compressive strength of 18.4 MPa was achieved with 63% CA, 15% gravel, 10% cement, and 12% sand [43]. Alam et al. [44] investigated the CA brick tiles comprising CA, fine sand, coarse sand, and cement. The optimum compressive strength of 4.5 MPa was achieved using a CA:fine sand:coarse sand:cement ratio of 70:15:5:10 [44].
Although the use of cement increases the compressive strength of CA bricks, the disadvantage of using cement in CA bricks is the increasing cost of CA brick. Hence, it is important to determine the optimized dosage of cement in CA bricks for the large-scale production of CA bricks. In Pakistan, numerous CPPs built under the China Pakistan Economic Corridor are operational, which are producing CA as industrial waste, and CA needs to be removed from the CPP sites for the continuous and effective running of these CPPs. The use of CA as a replacement for clay in bricks is a major step toward the production of environmentally friendly and cost-effective CA bricks as dumping CA in landfills is a hazardous and impractical solution. In addition, CA bricks will preserve the fertile clayey soil. This research investigates various physical and mechanical properties of CA bricks. The influence of the leaching effect on CA bricks is beyond the scope of this paper.

2. Experimental Program

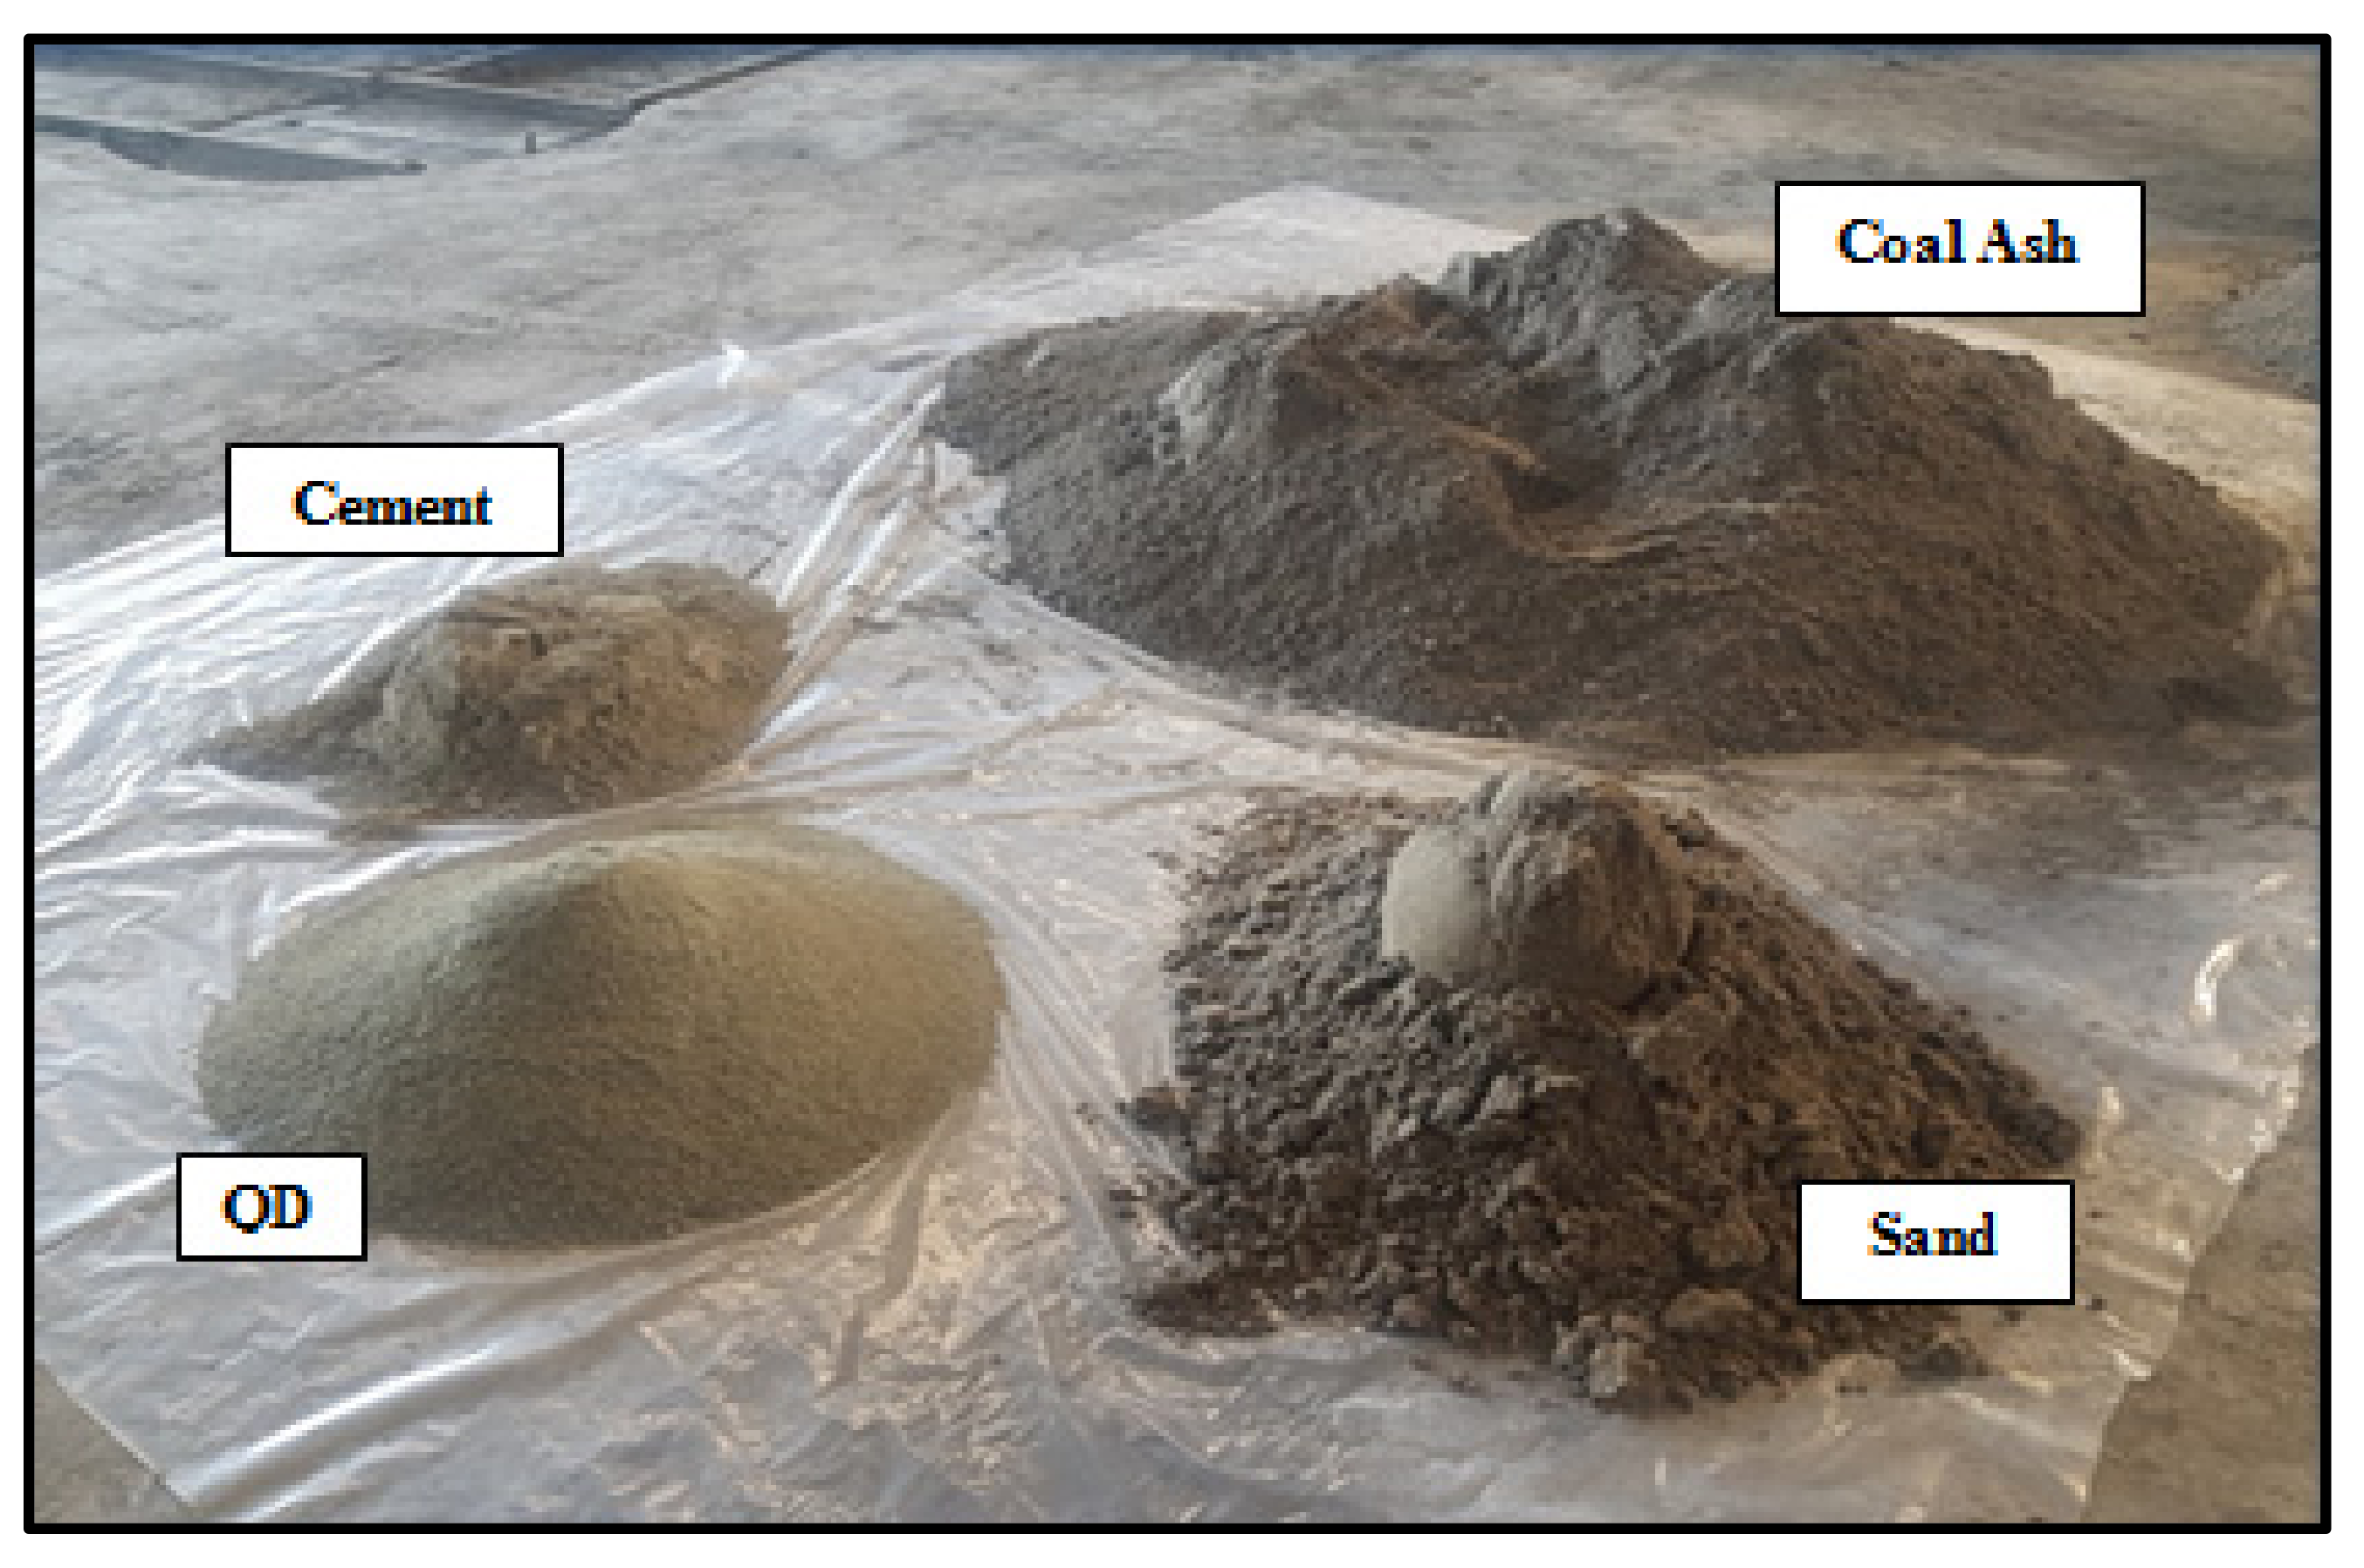
The experimental program was designed to investigate the influences of cement content, sand content, quarry dust content, and duration of application of forming pressure on the various physical and mechanical properties of unburnt CA bricks. The cement contents, sand, and quarry dust contents were selected based on an extensive review of the literature [43,44,45]. A total of six unburnt CA brick mixes were prepared. Mix 1 and Mix 2 comprise 60% CA, 10% lime, 5% cement, 15% sand and 10% quarry dust by weight. Mix 3 and Mix 4 comprise 60% CA, 10% lime, 10% cement, 10% sand, and 10% quarry dust by weight. Mix 5 and Mix 6 comprise 60% CA, 10% lime, 15% cement, 10% sand and 5% quarry dust by weight. In all the mixes, the water to binder ratio was 0.25. The unburnt CA bricks in Mix 1, Mix 3, and Mix 5 were subjected to a forming pressure of 29 MPa for 3 s whereas the unburnt CA bricks in Mix 2, Mix 4, and Mix 6 were subjected to a forming pressure of 29 MPa for 6 s (Table 1).
The unburnt CA bricks were prepared in four steps. In the first step, the required quantities of CA, cement, lime, sand, quarry dust, and water contents were weighed in the digital weighing balance. In the second step, all the weighed contents in the designed mix proportion were added to the concrete mixer to prepare a homogenous mix as per ASTM D6103-17e [46]. In the third step, the mix was poured into the brick molds in three layers. Each layer was properly compacted to minimize the air voids in the brick specimens. In the fourth step, the brick specimens were subjected to the forming pressure of 29 MPa for either 3 s or 6 s (Figure 1). A total of 240 CA bricks of 230 mm length, 114 mm width, and 70 mm thickness were cast. CA bricks were moist cured for 28 days.

3. Material Properties

The details of different materials such as coal ash (CA), cement (C), lime (L), and quarry dust (QD) (Figure 2) used in the preparation of unburnt CA bricks are as follows:

3.1. Coal Ash (CA)

CA was collected from the Sahiwal Coal Power Plant located in Sahiwal, Punjab, Pakistan. Any lumps of debris or large-sized particles in the collected CA samples were manually removed. The chemical composition of CA was carried out as per the guidelines outlined in ASTM C618-19 [47]. The chemical composition of CA is given in Table 2. The chemical composition exhibited that the sum of SiO2, Al2O3, and Fe2Q3 was greater than 70% of the total composition of CA. The CA was classified as Class F ash as per the guidelines of ASTM C618-19 [47]. The strength activity index of CA was carried out as per the guidelines outlined in ASTM C311-18 [48]. The measured strength activity index of CA (82%) was greater than 75%, which indicates that the CA has pozzolanic properties.

3.2. Cement

Ordinary Portland cement (OPC) of a local brand, i.e., Maple Leaf, was used in the preparation of the unburnt CA bricks. The chemical composition of OPC was carried out according to ASTM 618-19 [47] (Table 3). The chemical composition exhibited that OPC comprised SiO2 (19.11%), Al2O3 (5.2%), Fe2O3 (3.18%), CaO (62.51%), MgO (0.85%), and SO3 (2.34%). The LOI of the OPC was 4%. The various physical properties of the Maple Leaf cement were also measured. The percentage fineness of the OPC was 6% according to ASTM C184-94 [49]. The measured soundness of the OPC was 7.5 mm according to BS EN196-16 [50]. The measured standard consistency of the OPC was 29.5% according to ASTM C187-16 [51]. The measured initial and final setting times of the OPC were 125 min and 220 min, respectively, according to ASTM C191-19 [52].

3.3. Lime

Locally available hydrated lime was used in the preparation of brick specimens. The measured specific gravity of lime was 2.27 according to ASTM C110-20 [53]. The measured bulk density of lime was 487 kg/m3 according to ASTM C110-20 [53]. The chemical composition of lime was determined according to ASTM C25-11 [54]. The different constituents of lime included were CaO (89.43%), SiO2 (1.72%), MgO (2.04%), and Al2O3 (0.67%), which exhibited that lime has high Ca (OH)2 content (Table 3).

3.4. Sand

Natural sand collected from Chenab River, Pakistan was used in the preparation of CA brick specimens. The fineness modulus of Chenab River sand was 1.75 according to ASTM C136-19 [55]. The water content and dry density of Chenab River sand were 18.5% and 1619 kg/m3, respectively, according to ASTM D698-12 [56]. The sieve analysis of Chenab River sand was performed according to ASTM C33-18 [57]. The sieve analysis results exhibited that the Chenab River sand was uniformly graded as particle sizes varied from 0.08 mm to 0.30 mm.

3.5. Quarry Dust (QD)

Quarry dust was collected from the Sargodha quarry, Punjab, Pakistan. The quarry dust was a mixture of very fine dust particles and stone dust particles and was classified as gap graded (poorly graded). The bulk density and percentage voids of quarry dust were 1506 kg/m3 and 45.2% respectively, according to ASTM C29-17a [58]. The specific gravity and water absorption of quarry dust were 2.82 and 1.30% respectively. according to ASTM C127-15 [59]. The impact value and crushing value of quarry dust were 16% and 30% respectively, according to BS 812-09 [60].

4. Testing of CA Bricks

A total of 40 CA bricks were prepared for each mix comprising 10 CA bricks for weight per unit area, 5 bricks for compression testing, 5 bricks for modulus of rupture testing, 10 bricks for water absorption, and 10 bricks for efflorescence. The water absorption, efflorescence, and weight per unit area of CA bricks were determined according to ASTM C67-20 [61].
The CA bricks were tested under axial compression and modulus of rupture after 28 days of casting using a 2000 kN Shimadzu Universal Testing Machine according to specifications outlined in ASTM C67-20 [61]. The CA bricks were capped with gypsum to ensure uniform loading of the bricks under axial compression and modulus of rupture.

5. Results and Discussions

5.1. Measurement of Size

A total of 10 CA bricks for each mix were selected to measure the size of CA bricks i.e., length, width, and height. The dimensions of CA bricks were measured with the ruler having a least count of 0.5 mm. The average length, average width, and an average height of CA bricks are presented in Table 4. The average length, average width, and an average height of CA bricks for all six mixes varied between 230 and 231 mm, 113 and 115 mm, and 69 and 70 mm, respectively. The standard deviations in the measured average length, width, and height were 0.47 mm, 0.76 mm, and 0.47 mm, respectively.

5.2. Weight per Unit Area

CA bricks used to measure the dimensions were also used to measure the weight per unit area of CA bricks. The average weight per unit area of CA bricks of Mix 1, Mix 2, Mix 3, Mix 4, Mix 5, and Mix 6 were 10.49 g/cm2, 10.96 g/cm2, 11.24 g/cm2, 11.39 g/cm2, 11.40 g/cm2 and 11.73 g/cm2, respectively. The standard deviation in the average weight per unit area of CA bricks of Mix 1, Mix 2, Mix 3, Mix 4, Mix 5, and Mix 6 were 0.31 g/cm2, 0.29 g/cm2, 0.41 g/cm2, 0.37 g/cm2, 0.28 g/cm2 and 0.18 g/cm2, respectively (Table 5). The weight per unit area of CA bricks prepared with forming pressure of 29 MPa applied for 6 s was about 4% higher than the weight per unit area of CA bricks prepared with forming pressure of 29 MPa applied for 3 s. The increase in weight per unit area of CA bricks was also observed with increasing cement content due to the increased formation of C-A-S-H gel, which resulted in denser bricks (Figure 3). In the available research studies, numerous studies reported similar weight per unit area of bricks ranging between 8.76 g/cm2 and 13.8 g/cm2, as reported in this study [31,39,62].
It is noted from the review of available literature that the weight per unit area of CA bricks is lower than that of conventional burnt clay bricks [7,31,63,64]. These studies reported that CA bricks have up to 10% lower weight per unit area compared to conventional clay bricks. The reduced weight per unit area of CA bricks can reduce the overall dead weight of the structure. In addition, lightweight structures also exhibited improved structural performance against earthquake loadings [65].
The soundness of CA bricks was determined by lightly tapping two CA bricks against each other. CA bricks produced a bell ringing sound without breaking the bricks, which indicated that the CA bricks produced in this experimental study are good quality bricks. In addition, an attempt was made to mark a scratch on the surface of CA brick with the help of a nail; however, no permanent impression was made on the surface of CA brick, which indicated that the brick is hard.

5.3. Water Absorption

The water absorption of CA bricks was measured similarly to that of conventional burnt clay bricks. A total of 10 CA bricks for each mix were cast to measure the water absorption. To measure the water absorption, CA bricks were placed in the temperature-controlled kiln at 110 to 115 °C for 24 h. After 24 h, CA bricks were weighed in weighing balance to get the dry weight ( W d ) of CA bricks. Afterward, CA bricks were submerged in water tanks for 24 h at room temperature (23 ± 2 °C). After 24 h, CA bricks were taken out of the water tank and any moisture present on the surface of CA bricks was gently removed with the help of a cloth. In addition to this, the samples were air dried for 3 min, and then the saturated weight ( W s ) of CA bricks were measured. The water absorption (WA) of CA bricks was determined using Equation (1).
W A = W s W d W d
The percentages of water absorption of all six mixes are given in Table 6. The average percentage water absorption of CA bricks of Mix 1, Mix 2, Mix 3, Mix 4, Mix 5, and Mix 6 were 10.70%, 9.61%, 6.11%, 6.03%, 9.11% and 6.40%, respectively. The standard deviation in the water absorption of CA bricks of Mix 1, Mix 2, Mix 3, Mix 4, Mix 5, and Mix 6 were 1.04%, 1.10%, 0.92%, 0.925, 1.05% and 0.73%, respectively. The experimental results exhibited that the percentage of water absorption of CA bricks was significantly lower than the percentage of water absorption of conventional clay bricks i.e., 17% for severe weather resistance and 22% for moderate weather resistance in accordance with ASTM C20-15 [66].
The percentage of water absorptions of Mix 1 and Mix 2 comprising 5% cement contents were significantly higher than the percentage of water absorptions of Mix 3 and Mix 4 comprising 10% cement content, and Mix 5 and Mix 6 comprising 15% cement content (Figure 4). The mixes with 10% and 15% cement content exhibited reduced water absorptions probably due to an increase in the formation of C-A-S-H gel, which reduced the unfilled pores between particles. In addition, the percentage of water absorptions of Mixes 1, 3, and 5 were about 15% higher than that of Mixes 2, 4, and 6 as the forming pressure in Mixes 2, 4, and 6 was applied for two times the duration of the forming pressure applied in Mixes 1, 3, and 5.

5.4. Compressive Strength

A total of 5 CA bricks for each mix were cast to measure the compressive strength of CA bricks. CA bricks were tested in axial compression in 2000 kN Shimadzu Universal Testing Machine (Figure 5).The average compressive strengths of CA bricks of Mix 1, Mix 2, Mix 3, Mix 4, Mix 5, and Mix 6 were 10.40 MPa, 10.87 MPa, 18.83 MPa, 18.24 MPa, 12.39 MPa, and 13.15 MPa, respectively. The standard deviations in the average compressive strength of CA bricks of Mix 1, Mix Mix 2, Mix 3, Mix 4, Mix 5, and Mix 6 were 1.48 MPa, 0.74 MPa, 2.35 MPa, 1.36 MPa, 2.50 MPa, and 2.02 MPa, respectively (Table 7).
The average compressive strengths of CA bricks prepared in this experimental study were 5%, 61%, and 77% higher than the compressive strengths of CA bricks reported in the available literature studies [25,28,33]. Alam et al. [44] reported the average compressive strengths of CA bricks prepared using fine and coarse sands and stone dust cement composite ranged from 4.5 MPa to 7 MPa [44]. Naganathan et al. [28] reported the average compressive strengths of CA bricks prepared with fly CA, bottom CA, and cement ranged from 7.13 MPa to 17.36 MPa [28]. According to Pakistan Building Code (PBC) [8], the minimum compressive strength requirement of clay brick is 8.5 MPa [6]. CA bricks developed in this experimental study satisfied the minimum compressive strength outlined in the PBC [8]. The tested CA bricks also satisfied the minimum compressive strength limits for Class I clay bricks (moderate weather conditions) of 13.8 MPa and 17.20 MPa according to BS 3921-04 [67] and ASTM C62-17 [68], respectively.
The compressive strength of CA bricks increased with the increase in the cement content. The experimental results exhibited increasing compressive strength of CA bricks up to 10% of cement content, however, a further increase in the cement content to 15% resulted in the reduction in the compressive strengths of CA bricks. This is because an increase in the cement content resulted in the increase in the hydration process between CA and cement but the further increase in the cement content to 15% required controlled heat of hydration for the hydration process. Moreover, no significant change in the compressive strength was observed with the increase in the duration of the application of forming pressure (Figure 6).

5.5. Modulus of Rupture

A total of five CA bricks for each mix were cast to measure the modulus of rupture (MOR) of CA bricks. CA bricks were tested in 2000 kN Shimadzu Universal Testing Machine to determine MOR of CA bricks (Figure 7). The average MOR of CA bricks of Mix 1, Mix 2, Mix 3, Mix 4, Mix 5, and Mix 6 were 1.70 MPa, 1.42 MPa, 2.06 MPa, 1.93 MPa, 1.95 MPa, and 1.52 MPa, respectively. The standard deviations in the average MOR of CA bricks of Mix 1, Mix 2, Mix 3, Mix 4, Mix 5, and Mix 6 were 0.24 MPa, 0.27 MPa, 0.24 MPa, 0.30 MPa, 0.25 MPa, and 0.13 MPa, respectively (Table 8).
The average MOR of the CA bricks varied between 1.42 MPa and 2.06 MPa (Figure 8). CA bricks prepared in this experimental study exhibited higher MOR than the minimum MOR limit of 0.65 MPa for conventional clay bricks as specified in ASTM C67-20 [61]. CA bricks prepared with forming pressure applied for 6 s exhibited 14.9% lower MOR than CA bricks prepared with forming pressure applied for 3 s. The optimum MOR was obtained with 10% cement content, 10% sand content, and 10% quarry dust content.

5.6. Efflorescence

The efflorescence test of CA bricks was carried out to determine the quality of the bricks. In general, if the bricks contain soluble salts such as magnesium sulfate, sodium carbonate, sodium sulfate, and potassium sulfate, then these soluble salts cause disfigurement of the brick masonry surface after the dissolution of these salts in the water. The efflorescence causes the white deposits on the surface of the bricks. In accordance with ASTM C67-20 [61], CA bricks were tested to study the amount of salts present in the bricks. Five bricks from each mix were taken and vertically placed on the tray. The water was poured into the tray to a depth of 25 mm (1 inch) and samples in trays were placed at a room temperature of 23 ± 2 °C. When all the water was absorbed by CA bricks, the tray was refilled with water to the depth of 25 mm and this cycle was repeated for 7 days. After 7 days, CA bricks were taken out of the tray and the brick surfaces were carefully observed. A few minor white deposits were observed on CA bricks with 5% of cement, which was due to the presence of lime at the surface of brick which causes efflorescence [Figure 9]. Michael et al. [69] reported similar observations as reported in this experimental study. No white deposits were observed on the surface of CA bricks with 10% and 15% of cement contents. Hence in accordance with ASTM C67-20 [61], CA bricks have “No Efflorescence”. Similar result findings were reported by other research studies [65,70].

5.7. Cost Comparison of CA Bricks with Clay Bricks

A cost comparison of unburnt CA bricks with varying cement contents was carried out with the conventional burnt clay brick. A detailed cost breakup of different materials such as CA, lime, sand, quarry dust, and cement required for the manufacturing of CA bricks is presented in Table 9. The cost comparisons of unburnt CA bricks with 5%, 10%, and 15% cement contents were made and are presented in Table 10. It was noted that the cost of unburnt CA brick with 5% cement content was PKR 9 (5 cents) whereas the cost of unburnt CA bricks with 10% and 15% cement contents were PKR 10.8 (6 cents) and PKR 12.8 (7.1 cents), respectively. The costs of CA brick with 5% cement content and 10% cement contentwere 25% and 10% lower respectively than the cost of conventional clay brick i.e., PKR 12 (6.7 cents). However, the cost of CA brick with 15% cement content was 6.7% higher than conventional clay bricks.
The sustainable unburnt CA bricks with 5% and 10% cement contents having costs lower than conventional clay brick can be produced on a mass scale for wide use in the construction industry. In the available literature, the experimental studies also reported the reduced cost of sustainable CA bricks compared to clay bricks [32]. Gadling and Varma [32] reported that the cost of CA brick was 2% lower than the cost of conventional clay bricks.

6. Conclusions

In this experimental study, six coal ash (CA) brick mixes with CA content (60%), lime content (10%) and varying cement contents (5%, 10%, and 15%), sand contents (10% and 15%), and quarry dust contents (5% and 10%) subjected to the forming pressure of 29 MPa for either 3 s or 6 s were prepared. The various physical (weight per unit area, water absorption, efflorescence, soundness) and mechanical (compressive strength, modulus of rupture) tests were conducted on sustainable unburnt CA bricks. The following conclusions are drawn based on the test results presented in this research work.
The weight per unit area of CA bricks prepared with forming pressure applied for 6 s was about 4% higher than those of CA bricks prepared with forming pressure applied for 3 s. The average weight per unit area of CA bricks (11 g/cm2) was 31% lower than that of conventional clay bricks (15–17 g/cm2).
The experimental results exhibited that the percentage of water absorption of CA bricks (6–11%) was significantly lower than the percentage of water absorption of conventional clay bricks for severe weather resistance bricks (17%) and moderate weather resistance (22%).
CA bricks exhibited higher compressive strengths than conventional clay bricks. CA bricks with 60% CA, 10% lime, 10% cement, 10% sand, and 10% quarry dust exhibited the optimum average compressive strength of 19 MPa, which was greater than the minimum compressive strength limits of clay bricks as per Pakistan Building Code 2021 [8] (8.5 MPa) and BS 3921-04 [67] (13.8 MPa)
CA bricks with 60% CA, 10% lime, 10% cement, 10% sand, and 10% quarry dust exhibited the optimum modulus of rupture of 2.10 MPa, which was greater than the minimum modulus of rupture limit of clay bricks (0.65 MPa) as specified in ASTM C67-20 [61].
CA bricks with 5% cement content exhibited minimal efflorescence; however, CA bricks with 10% and 15% cement contents exhibited no efflorescence. This is the major advantage of CA bricks as conventional clay bricks exhibit significant efflorescence.
The CA bricks with 5% and 10% cement contents are 25% and 10% cheaper than the conventional clay bricks.
The unburnt CA bricks developed in this study are cost-effective and a sustainable alternative to conventional burnt clay bricks.

Author Contributions

Conceptualization, A.U.Q., Q.S.K. and A.H.; Investigation, A.M. and A.U.Q.; Writing—review & editing, A.M., Q.S.K., M.J.M. and S.M.S.K. All authors have read and agreed to the published version of the manuscript.

Funding

This research received no external funding.

Data Availability Statement

All the relevant data has been presented in the manuscript.

Conflicts of Interest

The authors declare no conflict of interest.

References

  1. Bui, Q.B.; Morel, J.C.; Reddy, B.V.V.; Ghayam, W. Durability of rammed earth walls exposed for 20 years to natural weathering. Build. Environ. 2009, 44, 912–919. [Google Scholar] [CrossRef]
  2. Calatan, G.; Hegyi, A.; Deco, C.; Szilagyi, H. Opportunities regarding the use of adobe-bricks within contemporary architecture. Procedia Manuf. 2020, 46, 150–157. [Google Scholar] [CrossRef]
  3. Pakistan, Building Sector Report; Report of Labor and human resource; Department of Punjab: Punjab, Pakistan, 2017.
  4. Shaikh, K.; Imran, U.; Bakhsh, H. Health risk assessment of emission from brick kilns in Tando Hyder, Sindh, Pakistan using the AERMOD dispersion model. Earth Environ. Sci. 2020, 2, 1290. [Google Scholar] [CrossRef]
  5. Ahmad, M.; Rashid, K.; Hameed, R.; Haq, E.U.; Farooq, H.; Ju, M. Physico-mechanical performance of fly ash based geopolymer brick: Influence of pressure-temperature-time. J. Build. Eng. 2022, 50, 104161. [Google Scholar] [CrossRef]
  6. Dalkilic, N.; Nabikoglu, A. Traditional manufacturing of clay brick used in historical buildings of Diyarbakir (Turkey). Front. Archit. Res. 2017, 6, 346–359. [Google Scholar] [CrossRef]
  7. Moyo, V.; Mguni, N.G.; Hlabangana, N.; Danha, G. Use of coal fly ash to manufacture a corrosion resistance brick. Procedia Manuf. 2019, 35, 500–512. [Google Scholar] [CrossRef]
  8. Building Code of Pakistan. Seismic Hazard Evaluation Studies, Ministry of Housing and Works; Government of Pakistan: Islamabad, Pakistan, 2021. [Google Scholar]
  9. Committee of China Economic. Tenth five-year program of building materials industry. China Build. Mater. 2001, 7, 7–10. [Google Scholar]
  10. Chen, Y.; Zhang, Y.; Chen, T.; Zhao, Y.; Bao, S. Preparation of eco-friendly construction bricks from hematite tailings. Constr. Build. Mater. 2011, 25, 2107–2111. [Google Scholar] [CrossRef]
  11. Akintola, G.O.; Dacosta, F.A.; Mhlongo, S.E. Geotechncal evaluation of clayey materials for quality burnt bricks. Heliyon 2020, 6, e05626. [Google Scholar] [CrossRef]
  12. Gupta, N.; Gedam, V.V.; Moghe, C.; Labhasetwar, P. Investigation of characteristics and leaching behavior of coal fly ash, coal fly ash bricks and clay bricks. Environ. Technol. Innov. 2017, 7, 152–159. [Google Scholar] [CrossRef]
  13. Prmraksa, K.; Wilhelm, M.; Wruss, W. A new approach to the production of bricks made of 100% fly ash II. In Proceedings of the International Ash Utilization Symposium, Lexington, KY, USA, 22–24 October 2001. [Google Scholar]
  14. Ghafoor, M.T.; Khan, Q.S.; Qazi, A.U.; Sheikh, M.N.; Hadi, M.N.S. Influence of alkaline activators on the on the mechanical properties of fly ash based geopolymer concrete cured at ambient temperature. Constr. Build. Mater. 2021, 273, 121752–121765. [Google Scholar] [CrossRef]
  15. Vilakazi, A.Q.; Ndlovu, S.; Chipise, L.; Shemi, A. The recycling of coal fly ash: A review on sustainable developments and economic considerations. Sustainability 2022, 14, 1958. [Google Scholar] [CrossRef]
  16. Khan, M.W.; Ali, Y.; de Felice, F.; Salman, A.; Petrillo, A. Impact of Brick Kiln industry on environment and human health in Pakistan. Sci. Total Environ. 2019, 678, 383–389. [Google Scholar] [CrossRef] [PubMed]
  17. US EPA (Environmental Protecting Agency). Sulfur Dioxide (SO2) Pollution. 2021. Available online: https://www.epa.gov/so2-pollution (accessed on 21 December 2021).
  18. EPA-Punjab. Report of the Smog Commission; Environmental Protection Department, Government of Punjab: Punjab, Pakistan, 2018. [Google Scholar]
  19. Chukkatur, P.; Sagar, A.D. Carbon mitigation in the India Coal-power sector: Options and recommendations. Energy Procedia 2009, 1, 3901–3907. [Google Scholar] [CrossRef] [Green Version]
  20. Islam, R.; Hassan, M.; Karim, R.; Zain, M.F.M. Properties of fly ash bricks prepared in local environment of Bangladesh. Int. J. Civ. Environ. Eng. 2015, 9, 12. [Google Scholar]
  21. Ashish, D.K.; Verma, S.K.; Singh, J.; Sharma, N. Strength and durability characteristics of bricks made using bottom and coal fly ash. Adv. Concr. Constr. 2018, 6, 407–422. [Google Scholar]
  22. Kumar, S. Fly Ash-lime-phosphogupsum hollow blocks for walls and partition. Build. Environ. 2003, 38, 291–295. [Google Scholar] [CrossRef]
  23. Al-Fakih, A.; Mohammed, B.; Liew, M.; Nikbakht, E. Incorporation of waste materials in the manufacture of masonry bricks: An updated review. J. Build. Eng. 2019, 21, 37–54. [Google Scholar] [CrossRef]
  24. Raut, S.P.; Ralegaonkar, R.V.; Mandavgane, S.A. Development of sustainable construction material using industrial and agricultural solid waste: A review of waste-created bricks. Constr. Build. Mater. 2011, 25, 4037–4040. [Google Scholar] [CrossRef]
  25. Piyadarshini, M.; Giri, J.P.; Patnaik, M. Variability in the compressive strength of non-conventional bricks containing agro and industrial waste. Case Study Constr. Mater. 2021, 14, e00506. [Google Scholar]
  26. Zhang, Z.; Wang, Y.; Arulrajah, A.; Horpibulsuk, S. A review of studies on bricks using alternative materials and approaches. Constr. Build. Mater. 2018, 188, 1101–1118. [Google Scholar] [CrossRef]
  27. Eliche-quesada, D.; Sandalio-Perez, J.A.; Martinez-Martinez, S.; Perez-Villarejo, L. Investigation of use of coal fly ash in ecofrirndly construction material: Fires clay bricks and silica-calcareous non fired bricks. Ceram. Int. 2018, 44, 4400–4412. [Google Scholar] [CrossRef]
  28. Hameed, A.; Haider, U.; Qazi, A.U.; Abbas, S. Effect of waste glass on properties of burnt clay bricks. Pak. J. Eng. Appl. Sci. 2018, 22, 56–63. [Google Scholar]
  29. Murugesan, T.; Sakthivel, S. Performance evaluation of Burnt Clay-Fly ash un-burnt bricks and precast paver blocks. Mater. Today Proc. 2017, 4, 9673–9679. [Google Scholar] [CrossRef]
  30. Chindaprasirt, P.K. Study of Fly Ash—Lime granule unfired bricks. Powder Technol. 2007, 182, 33–41. [Google Scholar] [CrossRef]
  31. Khan, Q.S.; Sheikh, M.N.; McCarthy, T.J.; Robati, M.; Allen, M. Experimental investigation on foam concrete without and with recycled glass powder: A sustainable solution for future construction. Constr. Build. Mater. 2019, 201, 369–379. [Google Scholar] [CrossRef]
  32. Gadling, P.P.; Varma, M.B. Comparative study on fly ash and normal clay bricks. Int. J. Sci. Res. Dev. 2016, 4, 673–676. [Google Scholar]
  33. Taki, K.; Gahlot, R.; Kumar, M. Utilization of fly ash amended sewage sludge as brick for sustainable building material with special emphasis on dimensional effect. J. Clean. Prod. 2020, 275, 123942. [Google Scholar] [CrossRef]
  34. Shinde, R.V. Study of Engineering Properties of Fly-Ash Bricks for Construction. Int. J. Innov. Res. Sci. Eng. Technol. 2016, 5. Available online: http://www.ijirset.com/upload/2016/may/104_4_Study.pdf (accessed on 21 April 2022).
  35. Toure, A.O.; Sambe, F.M.; Diop, C.G.M.; Ghantous, R.M. Manufacturing Unfired Bricks using coal fly ash, calcium fluoride and calcium silicate. Int. J. Civ. Environ. Eng. 2020, 20, 1–14. [Google Scholar]
  36. Balasubramaniam, T.; Karthik, P.M.S.; Sureshkumar, S.; Bharath, M.; Arun, M. Effectiveness of industrial waste materials in fly ash brick manufacturing. Mater. Today Proc. 2021, 45, 7850–7858. [Google Scholar] [CrossRef]
  37. Ahmad, T.U.; Ashikuzzaman, M.; Alam, Z. An Experimental study on mechanical properties of fly-ash gypsum bricks. In Proceedings of the 4th international conference on advances in Civil Engineering, Xi’an, China, 4–7 July 2018; pp. 386–391. [Google Scholar]
  38. Prasad, H.N.R.; Prasad, H.G.V.; Hamsagar, C.; Gowda, D.Y.; Lobo, N.M.; Gowda, S.P. An approach for alternative solution in brick manufacturing. Int. J. Sci. Environ. Technol. 2014, 3, 1105–1114. [Google Scholar]
  39. Turgut, P. Masonry composite materials made of limestone powder and fly ash. Powder Technol. 2010, 204, 42–47. [Google Scholar] [CrossRef]
  40. Moghaddam, F.; Sirivivatnanon, V.; Vessalas, K. The effect of fly ash fineness on heat of hydration, microstructures, flow and compressive strength of blended cement pastes. Case Stud. Constr. Mater. 2019, 10, e00218. [Google Scholar] [CrossRef]
  41. Vigneshwar, P.V.; Anuradha, B.; Guna, K.; Kumar, R.A. Sustainable eco-friendly fly ash brick using soil filled plastic bottles. Mater. Today Proc. 2021, in press. [Google Scholar] [CrossRef]
  42. Naganathan, S. Almamon Yousef Omer Mohamed, Kamal Nasharuddin Mustapha. Performance of bricks made using fly ash and bottom ash. Constr. Build. Mater. 2015, 96, 576–580. [Google Scholar] [CrossRef]
  43. Wang, L.; Sun, H.; Sun, Z.; Ma, E. New technology and application of brick making with coal fly ash. J. Mater. Cycles Waste Manag. 2016, 18, 763–770. [Google Scholar] [CrossRef]
  44. Alam, J.; Khan, M.A.; Akhtar, M.N. Fly ash based brick tiles: An experimental study. Int. J. Emerg. Trends Eng. Dev. 2013, 6, 35–44. [Google Scholar]
  45. Nguyen, M.H.; Huynh, T.-P. Turning incinerator waste fly ash into interlocking concrete bricks for sustainable development. Constr. Build. Mater. 2022, 321, 126385. [Google Scholar] [CrossRef]
  46. ASTM D6103-17; Standard Test Method for Flow Consistency of Controlled Low Strength Material (CLSM). ASTM International: West Conshohocken, PA, USA, 2017.
  47. ASTM C618-19; Standard Specification for Coal Fly Ash and Raw or Calcined Natural Pozzolan for Use in Concrete. ASTM International: West Conshohocken, PA, USA, 2019.
  48. ASTM C311-18 (ASTM 2018); Standard Test Methods for Sampling and Testing Fly Ash or Natural Pozzolans for Use in Portland-Cement Concrete. ASTM International: West Conshohocken, PA, USA, 2018.
  49. ASTM C184-94 (ASTM 1994); Standard Test Method for Fineness of Hydraulic Cement by the 150-µm (No. 100) and 75-µm (No. 200) Sieves. ASTM International: West Conshohocken, PA, USA, 1994.
  50. BS EN196-3-16 (BS 2016); Methods of Testing Cement: Determination of Setting Times and Soundness. British Standards Institution: London, UK, 2016.
  51. ASTM C187-16 (ASTM 2016); Standard Test Method for Amount of Water Required for Normal Consistency of Hydraulic Cement Paste. ASTM International: West Conshohocken, PA, USA, 2016.
  52. ASTM C191-19 (ASTM 2019); Standard Test Methods for Time of Setting of Hydraulic Cement by Vicat Needle. ASTM International: West Conshohocken, PA, USA, 2019.
  53. ASTM C110-20 (ASTM 2020); Standard Test Methods for Physical Testing of Quicklime, Hydrated Lime, and Limestone. ASTM International: West Conshohocken, PA, USA, 2020.
  54. ASTM C25-19 (ASTM 2019); Standard Test Methods for Chemical Analysis of Limestone, Quicklime, and Hydrated Lime. ASTM International: West Conshohocken, PA, USA, 2019.
  55. ASTM C136-19 (ASTM 2019); Standard Test Method for Sieve Analysis of Fine and Coarse Aggregates. ASTM International: West Conshohocken, PA, USA, 2019.
  56. ASTM D698-12; Standard Test Methods for Laboratory Compaction Characteristics of Soil Using Standard Effort. ASTM International: West Conshohocken, PA, USA, 2012.
  57. ASTM C33-18 (ASTM 2018); Standard Specification for Concrete Aggregates. ASTM International: West Conshohocken, PA, USA, 2018.
  58. ASTM C29-17 (ASTM 2017); Standard Test Method for Bulk Density (“Unit Weight”) and Voids in Aggregate. ASTM International: West Conshohocken, PA, USA, 2017.
  59. ASTM C127-15 (ASTM 2015); Standard Test Method for Relative Density (Specific Gravity) and Absorption of Coarse Aggregate. ASTM International: West Conshohocken, PA, USA, 2015.
  60. BS 812-09 (BS 2009); Testing Aggregates. British Standards Institution: London, UK, 2009.
  61. ASTM C67-20 (ASTM 2020); Standard Test Methods for Sampling and Testing Brick and Structural Clay Tile. ASTM International: West Conshohocken, PA, USA, 2020.
  62. Tayfun Cicek, Y.C. Use of fly ash in production of light-weight building bricks. Constr. Build. Mater. 2015, 94, 521–527. [Google Scholar] [CrossRef]
  63. Pawar, S.; Garud, D.B. Engineering properties of clay bricks with use of Fly Ash. Int. J. Res. Eng. Technol. 2014, 3, 75–80. [Google Scholar]
  64. Glamtimur, N.D.; Bilgil, A.; Nska-Hebda, M.S.; Parzych, S.; Hebda, M. Eco-friendly fired brick produced from industrial ash and natural clay: A study of waste reuse. Materials 2021, 14, 877. [Google Scholar] [CrossRef] [PubMed]
  65. Kazmi, S.M.S.; Munir, M.J.; Patnaikuni, I.; Wu, Y.-F. Pozzolanic reaction of sugarcane bagasse ash and its role in controlling alkali silica reaction. Constr. Build. Mater. 2017, 148, 231–240. [Google Scholar] [CrossRef]
  66. ASTM C20-22 (ASTM 2022); Standard Test Methods for Apparent Porosity, Water Absorption, Apparent Specific Gravity, and Bulk Density of Burned Refactory Brick and Shapes by Boiling Water. ASTM International: West Conshohocken, PA, USA, 2022.
  67. BS 3921-85 (BS 1985); Standard Specifications for Clay Bricks. British Standards Institution: London, UK, 1985.
  68. ASTM C62-17 (ASTM 2017); Standard Specifications for Building Bricks (Solid Masonry Units Made From Clay or Shale). ASTM International: West Conshohocken, PA, USA, 2017.
  69. Michael, K.; Stefan, I.; Nicoletta, Z. Efflorescence, Admixture Systems Europe; BASF Construction Chemicals: Winterthur, Switzerland, 2007. [Google Scholar]
  70. Munir, M.J.; Kazmi, S.M.S.; Khitab, A.; Hassan, M. Utilization of rice husk ash to mitigate alkali silica reaction in concrete. In Proceedings of the 2nd International Multi-Disciplinary Conference (IMDC 2016), Lahore, Pakistan, 19–20 December 2016. [Google Scholar]
Figure 1. Different stages in the preparation of CA bricks i.e., (a) weighing (by weight) of mixed materials, (b) pan mixing of mixed ingredients, (c) automatic pressure control system, and (d) and application of forming pressure on bricks.
Sustainability 14 06692 g001
Figure 2. Different materials used in the preparation of CA bricks.
Sustainability 14 06692 g002
Figure 3. Weight per unit area of CA bricks.
Sustainability 14 06692 g003
Figure 4. Percentage water absorption of CA bricks.
Sustainability 14 06692 g004
Figure 5. Compression Testing of CA bricks.
Sustainability 14 06692 g005
Figure 6. Compressive strength of tested CA bricks.
Sustainability 14 06692 g006
Figure 7. Modulus of rupture testing of CA bricks. (a) Sample placed in machine for flexure testing. and (b) sample after failure in flexure.
Sustainability 14 06692 g007
Figure 8. Modulus of rupture of tested CA bricks.
Sustainability 14 06692 g008
Figure 9. Efflorescence testing of CA bricks. (a) Sample placed for efflorescence, day 1. (b) Sample placed for efflorescence, day 7.
Sustainability 14 06692 g009
Table 1. Trial Mixes.
Mix No.Cement (%)Coal Ash (%)Lime (%)Sand (%)Quarry Dust (%)Application of Forming Pressure
Mix-15601015103 s
Mix-2515106 s
Mix-31010103 s
Mix-41010106 s
Mix 5151053 s
Mix 6151056 s
Table 2. Chemical Composition of Coal Ash.
SiO2Al2O3Fe2O3CaOMgOSO4LOI
70.0411.581.758.92.40.911.63
Table 3. Chemical Composition of Ordinary Portland cement.
SiO2Al2O3Fe2O3CaOMgOSO3LOI
19.115.23.1862.510.852.344
Table 4. Average dimensions of CA brick mixes.
Mix No.Average Length (mm)Average Width (mm)Average Height (mm)
Mix-123111370
Mix-223011569
Mix-323111470
Mix-423111370
Mix-523011369
Mix-623111370
Standard deviation0.47 mm0.76 mm0.47
Table 5. Weight per unit area of CA bricks.
Mix No.Weight per Unit Area (g/cm2)AverageStandard Deviation
Sp. 1Sp. 2Sp. 3Sp. 4Sp. 5Sp. 6Sp. 7Sp. 8Sp. 9Sp.10
Mix-19.8910.8510.4510.8110.4110.5210.6710.1210.2610.8810.490.31
Mix-211.4710.8911.0710.7410.4611.411.0410.7310.9710.8210.960.29
Mix-311.3711.9311.2810.5511.2611.3811.0811.2210.611.7511.240.41
Mix-412.0311.2411.8511.0111.4411.8111.2111.2511.1710.8711.390.37
Mix-511.3411.5611.9411.0511.4911.2210.9111.4611.4211.5811.400.28
Mix-611.7111.5111.3911.7511.911.8611.911.9911.5511.711.730.18
Table 6. Percentage Water Absorption of CA bricks.
Mix No.Sp. 1Sp. 2Sp. 3Sp. 4Sp. 5Sp. 6Sp. 7Sp. 8Sp. 9Sp.10AverageStandard Deviation
Mix-110.3411.2211.5510.9611.2810.4110.0411.2711.918.0410.701.04
Mix-210.9110.6510.0110.259.779.8610.019.547.27.949.611.10
Mix-35.377.585.594.625.746.725.137.256.676.436.110.92
Mix-46.535.887.577.075.185.826.964.635.25.416.030.92
Mix-59.3310.48.8110.917.098.897.959.478.729.499.111.05
Mix-65.225.126.566.736.777.337.256.626.595.776.400.73
Table 7. Compressive strength of CA brick mixes.
Mix No.Compressive Strengths (MPa)AverageStandard Deviation
Sp. 1Sp. 2Sp. 3Sp. 4Sp. 5
Mix-110.3111.059.6712.728.2710.401.48
Mix-210.8311.749.5111.1611.0910.870.74
Mix-318.2017.7222.2315.4520.5618.832.35
Mix-420.5917.2018.9517.0717.4018.241.36
Mix-58.0012.0012.4815.4114.0612.392.50
Mix-613.3413.0011.0011.6016.8013.152.02
Table 8. Modulus of Rupture of CA brick mixes.
Mix No.Modulus of Rupture (MPa)AverageStandard Deviation
Sp. 1Sp. 2Sp. 3Sp. 4Sp. 5
Mix-11.452.071.501.901.601.700.24
Mix-21.931.191.201.401.401.420.27
Mix-31.902.501.802.002.102.060.24
Mix-42.032.341.481.702.101.930.30
Mix-51.692.361.901.702.101.950.25
Mix-61.601.501.301.701.501.520.13
Table 9. Detailed material and brick plant cost of manufacturing CA bricks.
AMarket Rate of MaterialsQuantityUnitPKR
1Cost of coal ash1000kg2000
2Cost of lime50kg500
3Cost of sand100cft2800
4Cost of stone dust100cft2800
5Cement50kg720
BCost of brick plant/10001000No1500
Table 10. Cost comparison of CA bricks with 5%, 10%, and 15% cement content and conventional clay bricks.
Description (Materials)Mix 1 and 2
(5% Cement)
Mix 3 and 4
(10% Cement)
Mix 5 and 6
(15% Cement)
Clay Brick PKR
Coal ash3.133.133.1312
(6.7 cents)
Cement1.883.765.63
Lime2.092.092.09
Sand0.220.150.15
Quarry dust0.150.150.07
Labor and plant charges1.501.501.50
Cost PKR (approx.)910.812.6
Publisher’s Note: MDPI stays neutral with regard to jurisdictional claims in published maps and institutional affiliations.

