Review

State-of-the-Art of Factors Affecting the Adoption of Automated Vehicles

School of Engineering, RMIT University, Melbourne, VIC 3000, Australia
*
Author to whom correspondence should be addressed.
Sustainability 2022, 14(11), 6697; https://doi.org/10.3390/su14116697
Submission received: 23 March 2022 / Revised: 3 May 2022 / Accepted: 25 May 2022 / Published: 30 May 2022

Abstract

:
Around 90% of accidents stem from human error. Disruptive technology, especially automated vehicles (AVs), can respond to the problems by, for instance, eradicating human error when driving, thus increasing energy efficiency due to the platoon effect, and potentially giving more space to human activities by decreasing parking space; hence, with the introduction of the autonomous vehicle, the public attitude towards its adoption needs to be understood to develop appropriate strategies and policies to leverage the potential benefits. There is a lack of a systematic and comprehensive literature review on adoption attitudes toward AVs that considers various interlinked factors such as road traffic environment changes, AV transition, and policy impacts. This study aims to synthesize past research regarding public acceptance attitude toward AVs. More specifically, the study investigates driverless technology and uncertainty, road traffic environment changes, policy impact, and findings from AV adoption modelling approaches, to understand public attitudes towards AVs. The study points out critical problems and future directions for analysis of AV impacts, such as the uncertainty on AVs adoption experiment, policy implementation and action plans, the uncertainty of AV-related infrastructure, and demand modelling.

1. Introduction

Research on Automated Vehicles (AVs) has attracted lots of attention in the last decade. The most significant contributor to road accidents and fatalities is human error [1]. A transport system relying less on a human being, such as an AV, can help humans save time and reduce human-related road accidents.
The idea of AV was proposed almost a century ago [2], and the significant technological barriers regarding sensing and computing were not resolved until the 1980s, when it could be realistically implemented. The early research [3] concentrated on automated driving on automated highway systems—the California PATH program commencing in 1986 demonstrated automated driving on the I-15 in San Diego. During the most recent practice occurring in the USA, a Silicon Valley-based start-up is going to deploy thousands of self-driving vehicles for delivering groceries or pizza on US streets [4]. In Australia, the NSW government, partnering with Transurban [5], launched four trials in 2018, including ten automated cars on the major motorways in Sydney by conducting different urban scenarios [5]. In Asia, Baidu (a Chinese multinational technology company) reached a stage of testing driverless cars on public roads. Toyota announced an investment in artificial intelligence by setting up a research institute in the US [6].
Autonomous driving is expected to be part of everyday life with technological advancement in AVs and cutting edge research in this field conducted worldwide. After several years of research, the Society of Automotive Engineers [7] has categorized six levels of driving automation, from level 0 (human being dominated) to level 5 (full automation in any given driving scenario). Connected and Automated Vehicles (CAVs) will slowly become a reality by combining the AVs’ function and wireless technology so that they can communicate with other vehicles, infrastructure, and the road. CAVs can operate more safely and reliably by sharing and coordinating information with other road users and infrastructure. For example, CAVs will talk to other infrastructures located in a congested area to reroute earlier to avoid the congestion [8].
With the accelerated introduction of AVs in the coming decades, government authorities and private companies need to be aware of facing this disruptive technology and leveraging it to benefit the community; therefore, it is important to understand how an individual perceives an autonomous vehicle and how their feelings spread into other people. However, there is a lack of research concerning a comprehensive review of how people will adopt autonomous vehicles which considers a wide range of factors, including demographics, real interaction with AVs, trust, awareness of techniques, risks, level of automation, driving conditions, and penetration level. In addition, knowledge of how individuals feel about AVs, and how it can affect other people’s adoption levels, is also limited.
The article will explore state of the art of factors affecting the adoption of AVs. The paper is organized as follows: Section 3.1 extensively discusses previous research on autonomous vehicles regarding driverless technology and uncertainty, road traffic environment changes and policy impacts. Section 3.2 and Section 3.3 investigate AV adoption modelling approaches to understand public attitudes toward AVs and how AVs can impact our transport system quantitatively, such as willingness to pay and value of time. The last section presents the conclusions that summarise the knowledge gaps based on previous research. A list of the abbreviations used in this paper is provided in Table 1.

2. Materials and Methods

The literature was extracted from online archives, including Web of Science, Science Direct, and Google Scholar. Industry published reports and books were also utilized to strengthen the review. The keywords that were used to search the previous research include: “connected and/or autonomous vehicle/car(s)”, “automated vehicle/car(s)”, “electric vehicle/car(s)”, “driverless vehicle/car(s)”, “ in conjunction with “policy”, “transport behaviour”, “adoption”, “automation level”, “attitude(s)”, “perception (s)”, and “challenge(s)”. The literature search was augmented by forwards and backwards snowballing in related papers to conduct an in-depth analysis of the subject, assemble the content, and draw some pertinent conclusions for CAVs’ adaption. Only post-2010 papers were considered because the most dramatic increase in AV research occurred after 2010 [9].

3. Review of Existing Literature

Even before the 21st century, researchers and industrial partners had undertaken substantial research to develop a highly autonomous vehicle that is reliable and can adapt to different road conditions. Ref. [10] summarises 19 peer-reviewed articles about the roles of users in shared, automated, and electric mobility, including drivers, passengers, owners, pedestrians, planners, and policymakers. They cover individual functional perceptions (save money, convenience, etc.), practical societal perceptions (GHG emissions, traffic congestion, and safety), and societal–symbolic perceptions. The article briefs the benefits and problems that the emergence of AVs can bring; for example, the car share program can increase car accessibility, and adding automation for plug-in electric vehicles (PEV) can remove the customers’ concerns regarding charging inconvenience. However, the likelihood of widespread uptake and the direction of societal impact remains uncertain. In the present study, we examine the factors or uncertainties that can affect the public adoption of AVs. First, in Section 3.1, “Synthesis of factors affecting AVs adoption”, we present the synthesis of three major themes or factors (driverless technology and uncertainty, road traffic environment, and policy impact) that can affect the public adoption of AVs, as shown in Figure 1. This section is followed by Section 3.2, “Modeling approach”, which presents an analysis of modelling approaches where these factors have been explored along with the key findings. Finally, insights gleaned from the factors and the outcomes of the modelling approaches are discussed in detail under Section 3.3, “Factors that affect the public to adopt AVs”.

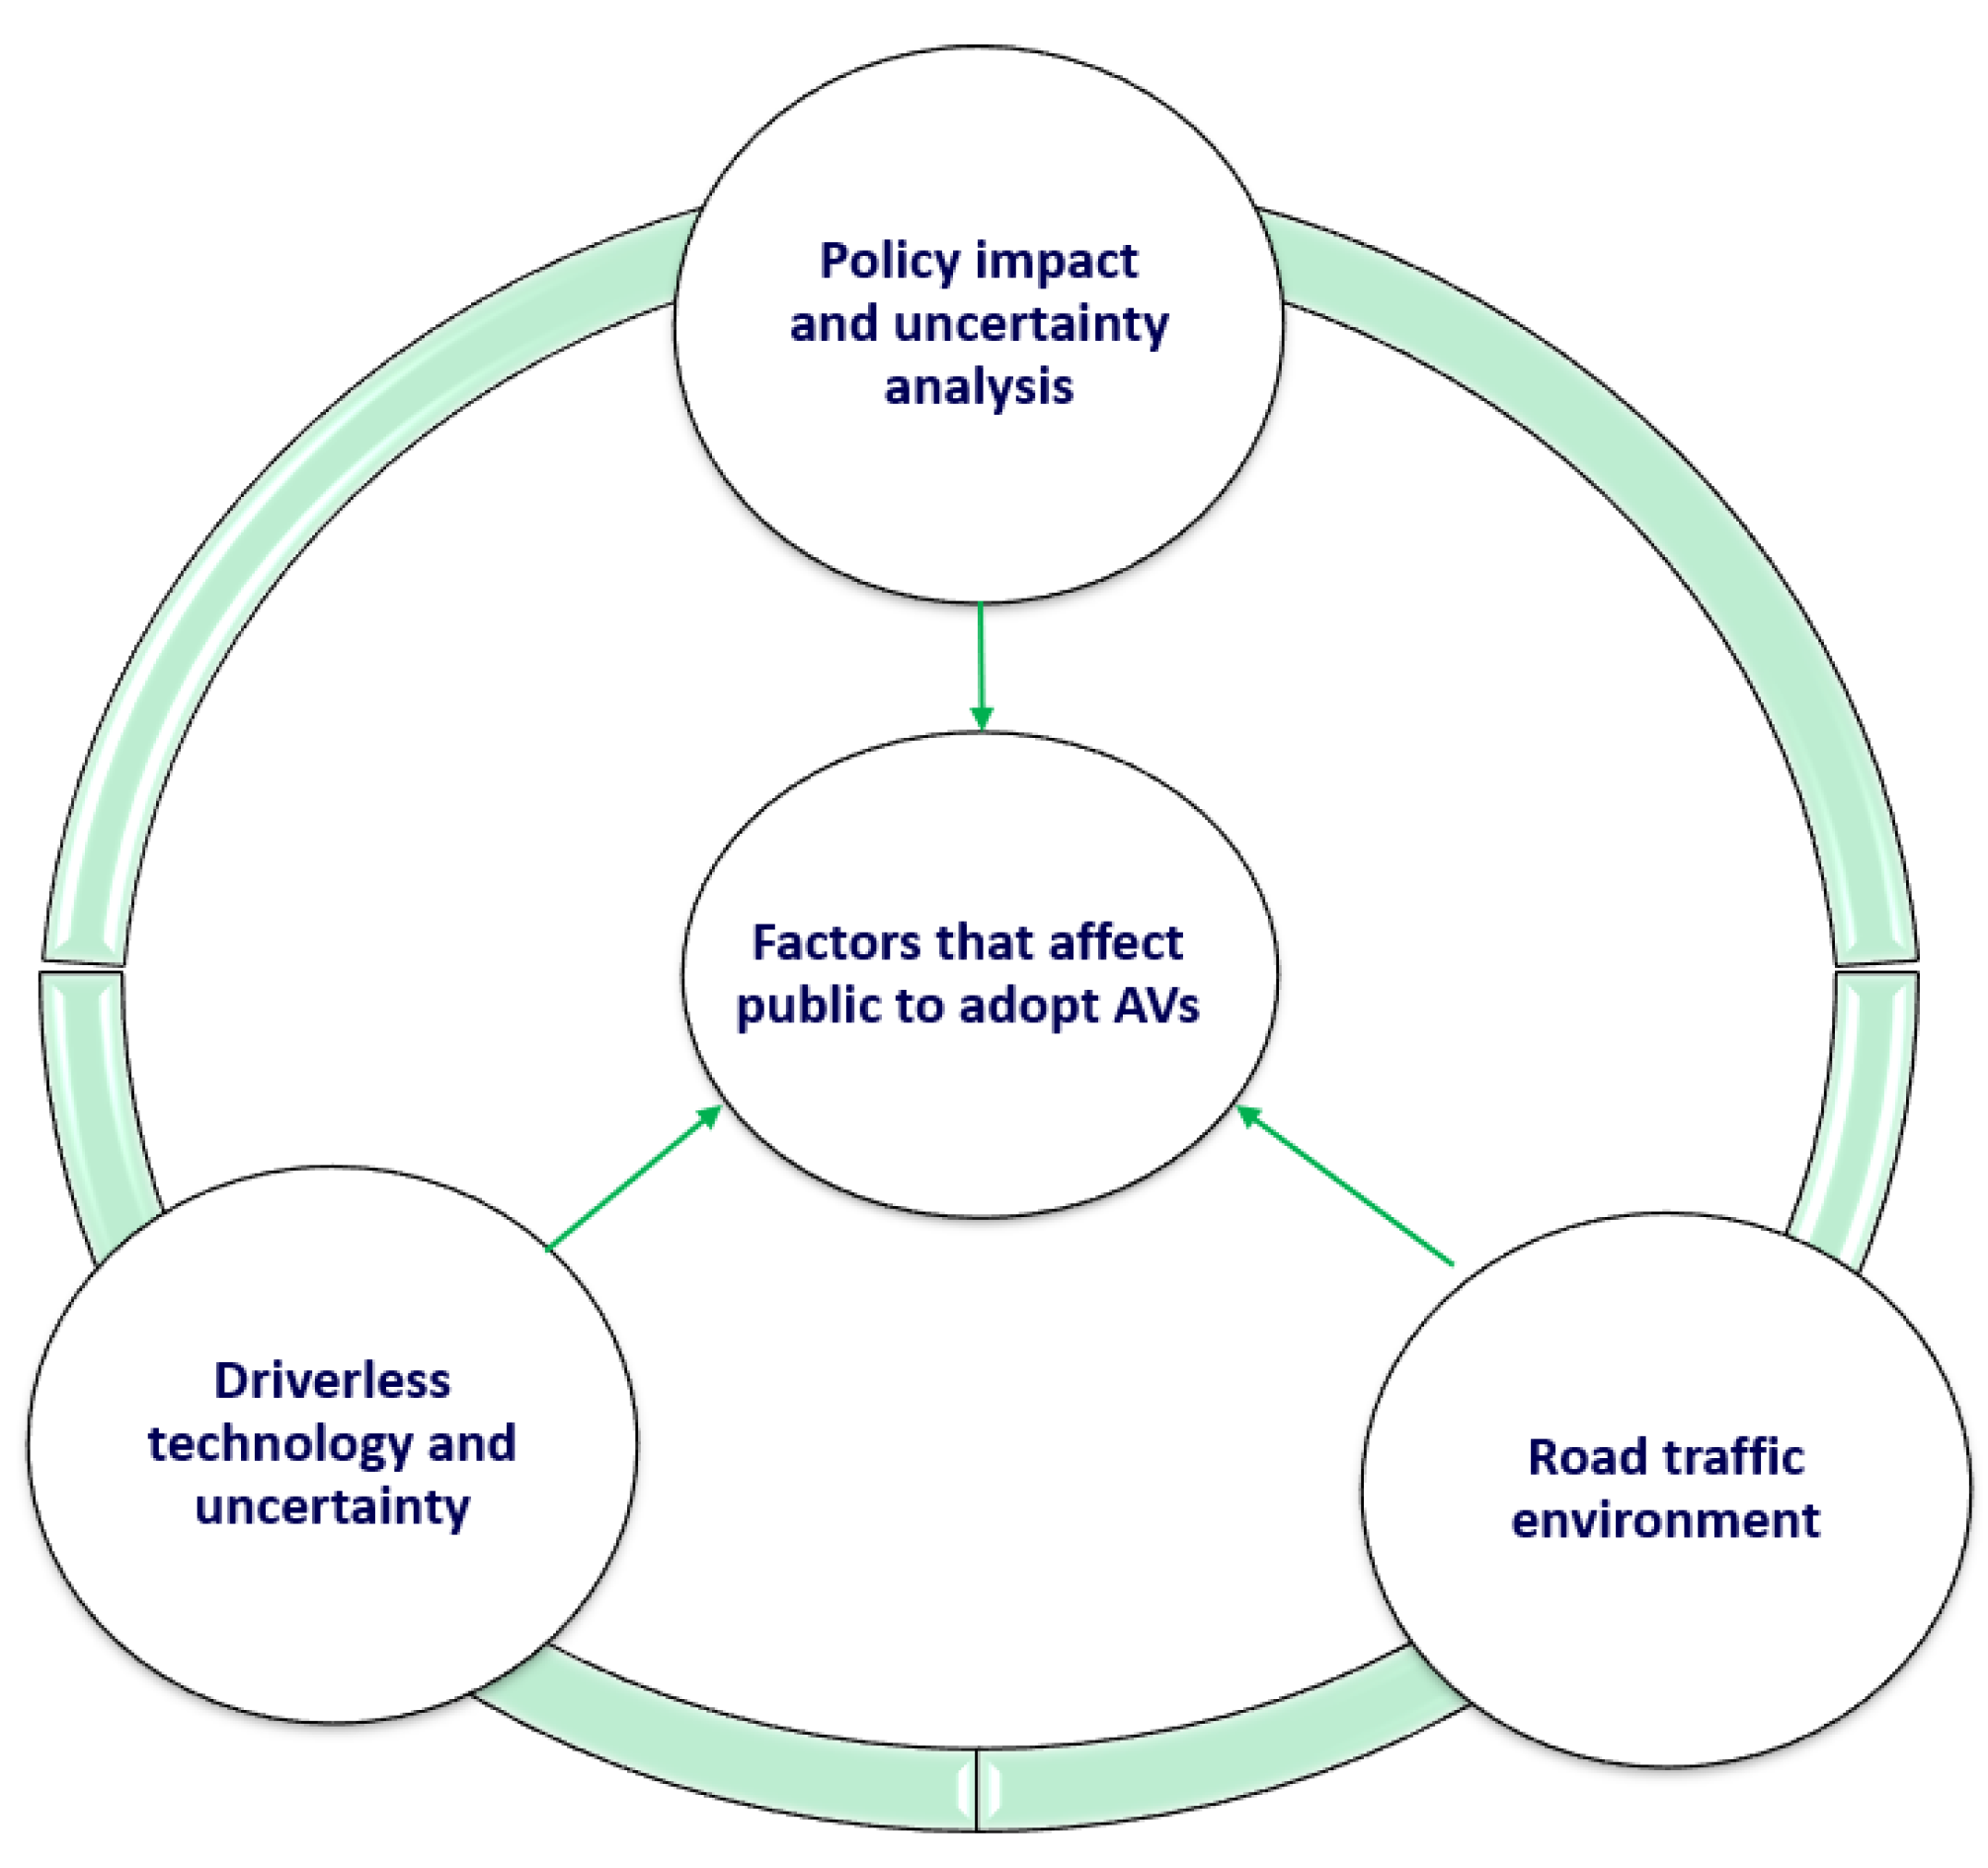
3.1. Synthesis of Factors Affecting AVs Adoption

In the following sections, we describe the factors affecting AVs adoption under three major themes: driverless technology and uncertainty, policy impact, and road traffic environment.

3.1.1. Driverless Technology and Uncertainty

Ref. [11] introduced AV sensor technology, the theory of localization, and mapping techniques for level 1 to level 3. Many aspects need to be improved, particularly the reduction of uncertainty for perception, cost reduction for perception systems, and operating safety for algorithms and sensors; therefore, the development of the AVs’ technique will focus more on increasing safety, driving safety, sustainability, and mobility in the coming future; however, accompanied by the advancement of technology, data security and privacy issues are put forward as barriers to adoption. Ref. [12] presented the CAV communication framework and provided all the interfaces of CAV related cyber attacks in the intelligent transport system. Integrated management framework for AV cybersecurity involving automotive manufacturers, equipment manufacturers, data aggregators, and data processors would adopt a shared problem-solving approach. Ref. [13] proposed several methodologies that can secure positioning vision, as well as sensing and network technologies in driverless vehicles. They also identified several aspects of data privacy, such as sensing technologies, positioning technologies, vehicular networks and vision technologies. Vehicular Ad Hoc Networks, known as VANETS, can be deployed to prevent these issues. Nevertheless, it has technical and socio-economic challenges, such as consistency of data, latency control, and high mobility. An automated driving system (ADS) will be commercially available in a decade; therefore, ref. [14] discussed the implication of ADS and the state of the art factors in the field of ADS. From the traffic operation side, ADS can have several advantages: reduced congestion from reduced incidents, more effective navigation, more accessibility, a reduced number of vehicles on the road due to the increased usage of ride-sharing, and less parking space. For vehicle users, it will make drivers feel less stressed, have fewer accidents, and be a more efficient mode of transportation. Apart from that, low speed and weight shuttle vehicles will be introduced into selected communities on a small scale, and driverless vehicles will be deployed on the highway with technologically viable conditions.
Ref. [15] discussed how traffic light control can be helpful for CAVs in terms of integrating with conventional traffic to smooth traffic flow and minimize energy emission. It only covers a small scale without researching at a network level. It proposes two optimal control frameworks, including a free driving mode, and CAV following non-CAV to achieve energy efficiency, as validated by a MATLAB and VISSIM simulation. During the simulation, four driving modes (free driving, approaching, following, and braking) and conflict areas are set up, and the energy impacts regarding different CAV penetration rates are compared. It concludes that the energy efficiency can be improved by integrating with CAVs until it reaches a certain threshold.
The implementation of AVs also needs preparation. Ref. [16] discussed the possibility of enacting AV certification, which will cause insurance and liability issues. For example, how can the AV minimize injuries towards their passengers or crash-involved parties when an AV hits another car? Another issue associated with implementation is market penetration evaluation. As [17] indicated, China has the largest percentage of people who have used ride-hailing services, whereas India, Japan, and Hungary have the lowest percentage; therefore, geographical location may greatly impact riding-hailing services when AVs are introduced.
The methodology of trip generation for AVs needs to be reassessed. Ref. [18] estimated the car trip generation for all age groups with regard to AVs by measuring gaps at different life stages for road users’ travel needs; however, it only covers level 4 automation, and it assumes a 100% penetration level of AVs. In reality, the number of people using AVs depends on various reasons, such as perceived safety, acceptance of innovation, and so on. Although [19] estimated that it would take 10 to 20 years for the public to adopt level 3 and level 5 AVs, respectively, it is necessary for manufacturers and policymakers to better educate the public about the benefits and drawbacks of AVs to address public’s opinions, beliefs, and consumer needs. By conducting surveys in Germany, ref. [19] observed that the participants were willing to pay 10.6% and 14.5% more for level 4 and level 5 automated vehicles, respectively. Although the study identified no significant main effect for gender, it was observed that age could be an important factor, with people under the age of 24 willing to pay significantly more than other age groups.

Mixed Traffic

Ref. [20] systematically reviewed the existing traffic flow models with various levels of detail, especially in mixed traffic conditions, and investigated the relationship between the management of transportation systems, AV based strategies, and traffic dynamics. The situation includes car-following models with AV-involved traffic, lane changing models, and the key differences between human-driving vehicle (HV) models and AV models. The study concluded that most of the existing models are too simple to capture AV traffic’s key features, and do not represent how human drivers act in the presence of AVs. One of the studies [21] conducted the impact of AVs on the uncertainty of HV behaviour with different penetration levels by using a stochastic Lagrangian model. The simulation shows the increase of the AV penetration rate from 5% to 50%, which can significantly reduce uncertainty and improve mixed traffic system stability, whereas the position of AVs does not impact uncertainty and stability. Another study [22] provided formulations regarding operational traffic capacity consisting of AVs and HVs by taking into account penetration rate, different lane policies, and vehicles’ characteristics. Strict segregation of AVs and HVs can result in a lower capacity, whereas mixed-use of both vehicles could increase the road capacity; however, the formulations were based on average speed as well as spacing features, and more research should pay attention to driver/vehicle characteristics. Moreover, the transportation infrastructure management plan should be revisited because of the interaction with mixed traffic flow [20].

3.1.2. Policy Impact and Uncertainty Analysis

Ref. [23] found that free public charging and access to bus lanes are the most functional incentive after subsidy due to China’s unique recurring congestion situation, with nearly one-third of people in China, stuck in congestion. It examined Chinese consumer preferences regarding electric vehicle policy incentives by doing a discrete choice survey, including cruise range, purchase price, road toll exemption, and access to the bus lane. Another article by [24] investigates the adoption of EV by examining perceived risk factors, consumers’ knowledge, and financial policy in China. Education can be the most efficient way to promote EV, although the experiment does not consider perceived cost, trust, and ease of use, which are critical factors for adoption in past studies.
Ref. [25] proposed a novel AV incentive program by considering the purchase price and deployment of AV lanes. It involved the first stage for deployment of AV lanes and the second stage for optimal purchase. In addition to that, with more AVs coming onto the road, the landscape of the parking infrastructure will be transformed due to AVs’ increasing ownership from operators. Ref. [26] suggested that policymakers need to adjust minimum parking requirements because more people will be adopting AVs or shared AVs, thus avoiding the necessity of large parking areas. Hence, planners may need to rearrange the landscape of parking infrastructure, such as introducing dynamic pricing for loading zones and unloading zones, and reducing on-street parking places.
Ref. [27] conducted a summary of all related shared vehicle policies. It discussed components of shared AVs modellings, including demand, fleet, traffic assignment, vehicle assignment, vehicle redistribution, pricing, and parking, and how the different components interact with each other; however, it did not address bike and scooter sharing systems. Street redesign strategies, economic instruments, and service provision can be focus areas from the government level. More research on the dynamic pricing structure and how they can impact the car-sharing system and fleet size elasticity need to be explored in future studies.
By comparing the US and Germany model results developed for 2035, ref. [28] suggested the following policy that can fully harness the advantages of AVs: stringent regulation of vehicles, leverage of AVs to facilitate public transport (PT) usage, land use planning and zoning, as well as transition to more sustainable vehicles.

3.1.3. Road Traffic Environment

The influence of the road traffic environment has been explored from various perspectives, as described in the following sub-sections.

Fuel Economy Testing of AVs

Ref. [29] assessed the impacts of AV technology on fuel economy levels by considering a range of automated driving cycles; however, it does not investigate the complex environment, such as traffic control systems and curves. The targeted AVs are for level 2 and 3 automation, not for level 4 and 5 automation.
Ref. [30] conducted different penetration levels in an urban scenario, with stop and go conditions. The study guides when to use battery power and gasoline for electric vehicles with AV technology.
Experiments by [31] on single-lane ring track demonstrate that the entire fleet can reduce approximately 15% CO2 with 5% of CAVs due to CAVs’ capability of dampening stop and go conditions. The vehicle trajectory data is obtained by a 360-degree camera. Ref. [32] proposed a framework with a 100% penetration level, considering VMT, travel demand, and historical speeds of road links that can predict fuel-savings of AVs. Results show a 45% reduction in the “optimistic” case and 30% in the “pessimistic” case; however, it does not provide details regarding the various automation levels.

AVs Driving Safety

Ref. [33] tested how many years (or miles) of AV travel can demonstrate reliability regarding injuries and fatalities by setting up different confidence levels. Typically, it will take 400 years to drive AVs in order to demonstrate their reliability; however, the study did not investigate other levels of automation. Ref. [34] summarised the past literature to identify AV safety quantification studies at a strategic level by using six approaches: traffic simulation, crash population, safety effectiveness estimation, road test analysis, and system failure risk assessment. A rigorous process has been conducted; for example, quantification of AVs’ impacts on traffic safety, AV as a vehicle for ground transportation, and safety of various levels of automation were listed as criteria for choosing the relevant studies. The research concluded that the existing methodologies for the AV safety evaluation have some shortcomings, such as potential AV passengers’ behaviour, AV safety from an AV implementation perspective, and emerging safety issues because of AV implementations.
Ref. [35] utilized a simulation-based approach to investigate the safety impact of AVs, and concluded that the number of crashes would be reduced by around 12% with AVs. In the simulation conducted using VISSIM (a traffic simulation software), time-to-collision, conflict points, and post-encroachment time were the considered three measures to evaluate the scenarios between conventional vehicles and full penetration of AVs. Another study [36] also addressed the same problem by developing an AV control algorithm in the VISSIM and implementing the algorithm in a motorway. The control algorithm considered adjacent vehicles, a rule-set associated with motorway operations, and lateral decisions. The research demonstrated improvements in road safety by reducing conflicts significantly. The conflicts could be reduced by 12% to 47%, 50% to 80%, 82% to 92% and 90% to 94%, for 25%, 50%, 75%, and 100% penetration of AVs, respectively.
Due to various driving styles, freeway on-ramp merging areas are at high risk for vehicle crashes. Ref. [37] proposed a conflict index, in theory, as the main indicator, and introduces a merging conflict model to estimate the safety impacts in different scenarios by considering main and ramp vehicles. The study shows clear benefits of AVs for improving safety, although several assumptions were postulated for the AVs’ merging conflict model because of a lack of data. An on-ramp cellular automata model proposed by [38] considered safe distance and traffic flow, and assessed traffic efficiency and safety under different penetration levels. The research showed that AVs positively impact traffic efficiency compared with human-driven vehicles, and traffic safety will be greatly improved with the increase of AVs’ penetration in the congested scenario; however, it is worthwhile considering building a dedicated lane for AVs, because AVs could travel faster than a human-driven vehicle.
Ref. [39] utilized the National Motor Vehicle Crash Causation Survey (NMVCCS) database to categorize human-related crashes into the following factors: sensing, predicting, planning, execution, and incapacitation. The research shows that even with the upcoming fully autonomous system, AVs will need to be programmed to avoid human-driven errors because of multiple types of factors leading to crashes. For example, speeding and illegal manoeuvres emphasize the necessity for specialists to program these issues into the safety protocols; therefore, regulators need to re-establish a framework that enforces AV design philosophies to replace default assumptions. Moreover, AVs would have superior performance against impairment by alcohol, incapacitation, and other impairments.

Cybersecurity

Ref. [40] studied 151 papers from 2008 to 2019 for comprehensive research into attacks and defences for AVs. The study classified attacks into the autonomous control system, vehicle to vehicle communications, driving system components and defence into intrusion detection, security architecture, and anomaly detection. As it is difficult to respond quickly to cyber attacks, artificial intelligence with big-data analysis can improve the specifications of electronic control units.
Ref. [11] analyzed, synthesized, and interpreted critical areas for the roll-out and progression of connected and automated vehicles (CAVs) in combating cyber-attacks. More specifically, the study described, in a structured way, a holistic view of six potentially critical avenues, which lies at the heart of CAV cybersecurity research (CAV communication framework, physcial/proximity access attacks, CAV supply chain, human factors, regulatory laws and policy framework, and integrated management framework). In a follow up study, ref. [41] developed a conceptual model to analyze cybersecurity in the deployment of CAVs by integrating six critical avenues and mapping their respective parameters which either trigger or mitigate cyber-attacks in operation.
Ref. [42] concluded that the attack models and defence strategies need further experiments under realistic environments by systematically investigating CAVs’ cyber security issues. The study also pointed out that the main approaches recommended by the industry to address security issues are “Secure development lifecycle” and “Machine learning models embedded in CAVs”. The first approach is to integrate security into the product development and maintenance processes, whereas the second approach involves selecting data for model training, model evaluation, deployment, and monitoring. Nevertheless, the security and privacy challenges that would be evident after the convergence of the cellular 5G and 6G networks in V2X-C architecture need to be addressed in good time [43].
An appropriate insurance scheme also plays a key role in reducing the impacts of cyber security issues. With the rolling out of the 5G network, software updates will be a critical component of deployment, and this could cause mass hacking. Ref. [44] pointed out two insurance models; one operates through a public guarantee fund whereas the other operates in an agreement between the state and the insurance industry body, which operates to decrease the negative impacts of uninsured drivers; therefore, the establishment insurance scheme will facilitate the advancement of the CAV industry.

Infrastructure Requirement

To better prepare a seamless integration of AVs and conventional vehicles, there is a need to do a systematic review and development of the policies and guidelines for road infrastructure [45]. The study generated a grading framework for assessing infrastructure plans from safety, efficiency, and accessibility perspectives by considering mixed traffic, autonomous corridors, and separated areas; however, the framework does not consider the advancement of automotive technology, which can impact AV operations, and more research should focus on cost (construction and maintenance), governance (operation management and responsibility), and interoperability (consistent with the adjacent area). Ref. [45] pointed out the proposed framework should also incorporate industrial and freight logistic space because these modes of transport will be one of the major beneficiaries.
The future of transportation will be a combination of vehicle automation, shared mobility, and vehicle electrification [46]; therefore, charging facilities are important to facilitate the public adopting AVs. Ref. [47] proposed a smart charging framework using an aggregator-based approach to optimize charging activities by shifting electricity demand from high-peak hours into other generation periods. The results suggest that EV battery capacity is essential for a flexible charging scheme. In addition to that, adding more charging infrastructure only can increase overall energy infrastructure expenses because of limited battery capacity under a real-time pricing scheme; however, ref. [47] do not consider the VMT induced by smart charging activities, therefore, new opportunities for the integration of the AV network into the energy network and telecommunication network are expected for the innovative design of urban infrastructure [48].
From an engineering perspective, less headway distance from AVs could result in high road capacity. In the shared-used AVs situation, ref. [48] concluded that the spare capacity from enhanced road capacity would free up the public space, which can be developed into other infrastructure for other active modes. In terms of car parking proximity, more flexibility for the allocation of car parking spaces was found in the shared-used AV situation because the passenger may use the nearest available vehicle [48].
From a planning perspective, ref. [49] utilized two-hybrid multi-criteria analysis models to assess an array of choices based on safety and sustainability, such as dynamic or stationary charging, plug-in or wireless charging, and mixed flow with HVs. By evaluating construction, operation, and maintenance costs, road safety, charging time, traffic congestion, impact on health due to radiation, and charging system energy efficiency, the optimal solution is “lanes dedicated to autonomous electric vehicles, with plug-in charging stations beside the roadway, along the route”. By analysing regional transportation plans from 52 metropolitan planning organizations in the US, ref. [50] concluded that maintaining and upgrading existing transportation infrastructure that accommodates the needs of AVs are the main policies. For example, Las Vegas, Dallas-Ft., Worth, and Philadelphia have policies to maintain the roads to a higher standard than the current standard. The policies include “making lanes narrower, providing clear lane markings and maximising pavement quality” to be compatible with AV testing and commissioning.

3.2. Modelling Approach

Ref. [51] summarised findings from the approach of spatial models and social-economic models, where the ultimate goal is to help operators and policymakers forecast future transportation systems with different AV scenarios. It does include model parameters (energy consumption, urban parking change, AV production cost, market penetration), modelling approaches (agent-based model, four steps model), and factors that can affect adoption levels; however, the focus of the research should be shifted to various stakeholders, such as transport authorities, transit operators, car manufacturers and insurance companies. The modelling approach of what factors can impact the adoption level of AVs is shown in Table A1 (in Appendix A), whereas Table A2 (in Appendix A) demonstrates the modelling approach of how factors, including policy, can affect the adoption level quantitatively and qualitatively.
Statistical methods have been mainly used to determine the factors that could influence AVs’ adoption (Table A1), such as logit regression, structural topic modelling, descriptive statistics, the ANOVAs method, the discrete choice model, and confirmatory factor analysis. These methods, including demographics, and psychological factors, particularly perceived safety, perceived benefits, and perceived ease of use, have been discussed in previous studies; however, there is a lack of research concerning how transport attributes can determine human adoption, such as congestion and public travel behaviour.
Table A2 summarises the modelling approaches for quantifying the impacts of factors towards AV adoption. The factors that have larger impacts on adoption are: being male, young, having a higher income, and psychological factors, including perceived ease of use, perceived safety, and perceived benefits. In addition to that, government policies and actions by manufacturers are also important, such as subsidy programs and learning sessions about AVs from manufacturers; however, there is a lack of knowledge about how and to what extent these policies could impact AV adoption, both quantitatively and qualitatively.
System dynamic modelling also plays an important role in modelling complex scenarios regarding AVs. It enables the development of various techniques for understanding problems, particularly in the case of CAVs. Ref. [41] presented a conceptual model based on System Dynamics (SD) to analyze cybersecurity in the complex and unpredictable deployment of CAVs. The authors investigated five dimensions: the framework for CAV communication, protected physical access, human aspects, CAV penetration, regulatory laws and policy framework, and trust, both inside the industry (OEMs) and amongst the general public. Ref. [52] discussed the potential outcomes for the adoption of AVs by using a SD approach for four different scenarios: no change in behaviour and ownership, change of behaviour, no change in ownership, and a complete change in ownership (all vehicles are shared AVs); however, the study did not consider the adoption process (penetration and level of service change over time), and the data was obtained by the workshop. Although the research [53] in the Netherlands conducted research with four scenarios (AV in bloom, demand, doubt and standby), using the SD modelling approach, by taking into account the adoption process and policy test, it did not involve the traffic congestion from the usage of AVs and its relevant policy impact (e.g., congestion charging policy). Another similar study [54] assessed the impacts of AVs on mode choice via the SD modelling approach, by focusing on levels 1 to 3. It was divided into two situations: autonomous vehicle and cooperative vehicle (can communicate to infrastructure and other vehicles); however, the base year data is from 2013, which may need updating given it is an earlier study and the technology may have advanced quickly.
Ref. [55] developed a model that could forecast Australia’s AV greenhouse gas emissions in the medium- and long-term by using a SD approach. The research has considered the technological intervention of AVs when gradually replacing conventional vehicles with AV adoption starting in 2030; however, the SD model did not consider the impacts of the dynamic fleets on GHG emissions. Similarly, ref. [56] also developed a SD model to analyze the impacts of different subsidy policies in Korea (the subsidy cliff, phase-out, phase-in 50%, and phase-in 350% subsidy scenarios) towards electric vehicle’s environmental benefits. VMT, coupled with a combination of subsidy scenarios, was assessed by using a life cycle assessment to gain insight into AV environmental impacts. Another study [57], using the SD approach, demonstrates the impacts of AVs using the following aspects: AV technology, law enforcement, infrastructure projects/improvements, fleet size, and vehicle density. Although the model does not consider the change of trip purpose, trip length, occupancy, business innovation, land-use change, and climate change, it proposes a framework for studying the usage of AV technology. The framework is useful in forecasting system performance based on different public policies and investment decisions.

AVs On-Demand System

Ref. [58] used an agent-based modelling tool called “Commuter” to simulate the on-demand AV impacts by choosing a small area in Melbourne and a shorter simulation period (7:00 to 9:00 a.m.). Although Avs’ on-demand system could decrease the current fleet size by 84% compared with the scenario of the conventional vehicle, it could lead to a 77% increase in VKT because of the empty vehicle relocation; therefore, more studies regarding first and last kilometre travel connecting to PT are worth exploring in detail by considering the land-use changes, such as fewer parking spaces and more lane capacities. The updated study [59] simulated a shorter period and focused on car-shared systems (impacts of ride-sharing are not explored). By considering the empty AV relocations for servicing customers, a fleet that is 58% to 84% smaller than the current fleet size will service the same demand, but it can result in a 47% to 77% increase in VKT; however, the study did not consider the other trips, such as AVs needing to recharge batteries, to be maintained, and to be cleaned.
Ref. [60] pointed out that shared AVs (SAVs) might become a preferable model choice for individuals, and SAVs could replace transit modes and release the car parking space. As a complementary mode, SAVs might be the solution for the first/last mile situation by enhancing the convenience of the mass transport system; therefore, integrated PT-SAVs systems, including demand sides, will become the future focus. Although AVs may encourage more people to use AVs instead of public transit, some US planning organizations have already established the policy of protecting the transit’s core strengths by funding projects to experiment with new approaches in terms of connecting people to public transit and promoting active and shared trips [50].
Ref. [61] had developed the integrated model by incorporating SAVs into the network by using Kuala Lumpur’s base traffic model in VISUM. By investigating waiting time, the operating cost of cars, and the cost of riding SAVs, SAVs could help passengers reduce walking time to the nearest PT station and reduce car’s VKT by 6% due to the mode shift from cars to PT. This study shows that SAVs can be used as traffic demand management, and the higher adoption of SAVs could decrease a car’s VKT through better SAVs-PT integration; however, extra VKT from charging activities should be considered in the future.

3.3. Factors That Affect Public to Adopt AVs

Ref. [62] discusses three key factors that cause people to accept AVs via a psychological model by testing driver behaviour and an online survey. These key factors are: perceived usefulness, perceived ease of use, and perceived safety. The experiment was conducted in China, and the candidates were testified in a level 3 automation vehicle, assuming that similar behaviour may be observed for the adoption of level 5 automation; however, only attitudinal acceptance was measured (not behavioural recognition), and it may not capture other factors, such as willingness to pay. A study in Switzerland [63] showed that different people have different views about the level of automated smart cars. Most people believe that smart cars have some assisted driving functionality. The differences in public perceptions could lead to different adoption levels. In addition to that, the participants are young students who may be skewed in terms of accepting AVs, as they are more familiar with the technology. More factors should be taken into account for acceptance, such as demographic factors, vehicle-related factors, and people’s cognitive as well as behavioural responses. Unlike [64], it states that unemployed, less educated, and older people are unlikely to accept AVs, particularly in the EU area; however, it does not consider the technological advancement and corresponding attitude change over time. Another article researched gender and age and how they can affect attitudes towards AVs. Ref. [65] declared that women are consistently less willing to ride in driverless vehicles than males. The factors including familiarity, fun, value, complexity, and awareness of technology need to be considered. Ref. [66] engaged with similar research, but it focused on plug-in electric vehicles. It demonstrates the first group of buyers who are likely to be highly educated, male, high income, and tech-savvy. Conversely, by conducting a short questionnaire of disabled residents in the UK, ref. [67] demonstrated that prior knowledge of AVs positively impacts adoption attitude, whereas age and income are not associated with the possibility of adopting AVs; however, the research has restricted a number of explanatory variables; for example, housing conditions are not covered in the study. The results are similar to those of a survey study in Finland by [68]; however, the study of [68] does not capture the view of the wider population due to the low response rate (20%), and Finland’s unique geographical factors, such as the fact that it is a sparsely populated and cold country. Ease of use, cost of technology, and perceived usefulness are the most critical factors that can determine the adoption of AVs. Another study was conducted in a European country, Norway [69], that used an online survey regarding the adoption of the driverless shuttle in a population that frequently uses a private vehicle. Unlike the other articles about driverless cars, the result indicates that better access to PT is not helpful in convincing people to adopt public transit, and that travel time with public transportation still remains a barrier to the adoption of driverless shuttles; however, the article does not address distrust issues towards driverless shuttles, as the public could perceive driverless vehicles as less risky than traditional buses.
Ref. [70] investigated how performance expectancy, reliability, security, piracy, and trust can impact adoption by distributing online questionnaires in Australia. A pre-test was conducted to represent key experts in the field. The experiment includes several situations regarding AVs adoption, such as running in a closed environment, finding a car park, and riding on highways where drivers could have full control. The study provided a unique insight into early test case environments for government agencies to evaluate the transport investments in the development of driverless technology.
Ref. [64] assumed public acceptance of AVs is related to the attitude of new technology, as well as socio-economic and demographic factors. The attitudes towards AVs were determined by general attitudes toward robots tested through a questionnaire survey across Europe; however, it did not address how the attitude could change as technology evolves. Another similar article [71] conducted face to face interviews and online surveys in Austin by asking questions about safety, short distance or long-distance trips, concern for data privacy, willingness to pay, residential location, mode of frequency, and so on. Although it presents some interesting results, such as the fact that only half of the respondents were likely to use AVs, there are some limitations. One of the limitations is that the participants were unaware of AVs’ future challenges and benefits, and how those factors can impact the transport network configuration. The factors are dynamic and cannot be answered by face to face interviews without experiencing the technology on the spot. Ref. [72] conducted a similar survey, which explores consumers’ attitudes towards autonomous, connected, and electric vehicles (ACEV). Consumers care more about financial cost and are less concerned about vehicle technology and data privacy. In addition to that, the reduction of driver fatigue is the biggest attraction, and accessibility of charging stations is the most critical reason for adoption.
Ref. [73] conducted a comprehensive study to investigate the factors affecting AVs purchase towards partial AV adoption and full AV adoption. Type of parking and housing, as well as socio-economic and demographic attributes, were found to significantly affect the likelihood of purchasing AVs. This observation will help policymakers devise policies to promote the adoption of AVs. Ref. [74] suggested that producing different AV models with different characteristics could match the personalities of products and consumers. For example, some people look for self-expression (quirky styling and a price premium). “Mini Cooper” could be a suitable design, and the design could facilitate the adoption of AVs.
It is to be noted that the studies discussed above do not investigate how the attitudes toward the adoption of AVs can impact travel patterns, VMT, and car ownership. Understanding those impacts may assist policymakers in developing strategies to promote the benefits of AVs as the technology evolves.
Another interesting study by [75] coupled the theory of “Diffusion of Innovation” (peer to peer communication) and agent-based modelling to predict the adoption of CAVs in the long term (25 year period) from 2025; however, the study does not cover market penetration change, multiple technology generations, and the interaction between AVs and human-controlled vehicles. A similar study [28] used the combination of a vehicle technology diffusion model and a spatial travel demand model to assess travel behaviour impacts, AV penetration rates, and vehicle mileage by comparing Germany and the USA. The most important factor affecting public behaviour is the new automobile group, particularly for people with mobility impairments, given that there is a lack of a PT system and lower cost of fuel in the US [28].
Ref. [76] studied the overtaking manoeuvre during the interaction of autonomous vehicles with conventional vehicles, and concluded that the acceptability of overtaking increases with a pull-in distance up to 28 m for both overtaking, and being overtaken. The interaction study did not categorize the level of automation when the experiment conducted trials between AVs and conventional vehicles.

3.3.1. Willingness to Pay

Ref. [77] undertook more detailed research on the adoption of AVs by using online surveys. Nevertheless, it only focuses on WTP by investigating its potential demographic determinants as well as psychological determinants. This research was conducted in two major cities in China; therefore, it is specific to the local Chinese context and may not be representative of other geographic regions. More research is needed on a real driving simulation with different automation levels, examining how demographic factors can impact adoption. By conducting surveys in Germany [19], a study showed that the participants were willing to pay 10.6% and 14.5% more for level 4 and level 5 automated vehicles, respectively. Although the study identified no significant main effect for gender, age could be an important factor, with people under the age of 24 willing to pay significantly more than other age groups.
Ref. [78] studied the no automation, partial automation, and full automation level of vehicles in terms of how households perceive the value of AV technology by using discrete choice experimental methodologies. It has been found that people from the US want to pay USD 3500 for partial automation, and USD 4900 for full automation; however, ref. [79] concludes that Indian people tend to adopt AVs more than American people. The article investigates the relationship between information type, willingness to ride, gender, and nationalities; therefore, the manufacturer should be concerned with developing the technology and focusing on promoting the technology in the media and among the public.

3.3.2. Value of Time

Ref. [80] compared the value of time of privately-owned vehicles and vehicles on demand by conducting stated choice approaches through the animation-based survey. The result shows that a privately-owned vehicle is more attractive than a shared one; however, as with other studies, it does not address the effect of the level of automation. Furthermore, the study is restricted to Germany. Ref. [81] compared the value of time for work and leisure activities between conventional vehicles and AVs by utilizing a stated choices experiment in conjunction with the discrete choice model, which involves socio-demographic variables and behavioural intents for sets of questions. Although the value of time for leisure activities stays the same between conventional vehicles and AVs, the value of time (VoT) concerning work-related activities is found to be lower than conventional vehicles. This may explain the reason why people want to pay less money to reduce their travel time compared with conventional vehicle travellers when they are going to work.
VoT can also impact willingness to share trips. Ride-sharing services could be a significant presence when AV technology matures. Ref. [82] utilized multivariate integrated choice, as well as the latent variable approach, to estimate individuals’ willingness to share AVs between commute trips and a leisure-activity trip. Privacy, time, and interest in better leveraging travel time are the three critical factors in this research. It concludes that people are less sensitive to commuting trips than leisure activities.
Compared with conventional vehicles, ref. [83] concluded that the value of travel time savings (VTTS) for SAVs has a strong impact on the modal split; the total trip share for SAV mode increases from 1% to 5.5% and from 2.8% to 8.5% (reduced fare situation); however, the analysis was based on an agent-based model, which needs to consider the transport system and the real environment. The most substantial impact for SAVs on long trips is to allow productive activities in the car.

3.3.3. Trust

Ref. [84] discussed how trust in AV technology could impact the adoption of autonomous vehicles by examining behaviour during automated and manual driving scenarios, and demographic factors. The experiments tested eight scenarios, transferring from automated to manual driving conditions by measuring human behaviour, such as hands-on wheel response time; however, there is no proper way to measure trust relating to automated vehicle technology, and the most significant limitation is considered to be not using real automated vehicles.

3.3.4. Cost Structure

Ref. [85] investigated three generic operational structures, including PT, pooled, or individual and private cars, and their corresponding automation impacts. Fixed cost, variable cost, and fleet effects are considered; for example, average operating hours, occupancy, speed, and passenger trip length are quantified. However, it does not consider the level of automation, the demand for infrastructure, such as parking, and how AVs can impact the ownership of private cars, thus impacting cost structure. The study concludes that private cars still stand as an attractive option for AVs, although fleets of shared AVs may become cheaper than other modes. Other factors, such as travel time, comfort, waiting times, can still substantially impact mode choice.

4. Discussion

This study conducted a comprehensive literature review of attitudes toward autonomous vehicles, including AV technological uncertainty, results from existing modelling approaches on factors influencing AV adoption, and AV policy implications regarding AV adoption. Based on those past studies, in the following sub-sections, some key observations and gaps in knowledge are discussed.

4.1. Attitudes towards Autonomous Vehicle

Modelling approaches to identify factors and quantify the impact of factors on the adoption of AVs have been investigated in this study; however, the study has identified some limitations which need to be addressed in future studies, such as penetration and automated level, driving conditions, and behavioural tests, as described in the following sub-sections.

4.1.1. Penetration and Automated Level

Most of the past research focuses on the public adoption attitude, but it neglects how the attitude changes over time, especially with the different automated levels of vehicles. For example, the attitude level can change when the automated level varies because the different automated level of vehicles relates to the difference in cost, technology, and safety level. Hence, it is worth investigating the attitude change with technological advancement over time.
Likewise, most past research conducted static research, mainly via distributing questionnaires or face to face interviews, which does not accurately replicate reality. For example, the attitude level may change when people become familiar with the automated vehicle (either through a test drive or in a simulator), or when autonomous vehicles interact with the conventional vehicle on the road.

4.1.2. Driving Conditions

Most of the research is based in a closed environment without interaction with other traffic, such as on campus or through a questionnaire survey; however, in reality, there are urban roads, interstate highways, and rural roads with different road traffic environments. Urban road networks are more complex, whereas rural road networks may be easier to navigate; therefore, the performance level of AVs needs to be tested in different driving conditions and road traffic environments. Future studies should investigate AV performance changes in different driving and road traffic conditions over time.

4.1.3. Behavioural Test

Online surveys and face to face interviews are the most popular methods to collect data that can demonstrate the public adoption level of autonomous vehicles; however, it may not represent realistic behaviour due to the limitations of the survey (i.e., the respondent may not have the opportunity to experience the autonomous vehicle). Behavioural tests and simulation labs can be introduced to respond to these limitations. The participant can stay on the autonomous vehicle that the lab simulates. Different scenarios can be tested, such as when the pedestrian crosses the road, the vehicle manoeuvre at the intersection, and the overtaking of conventional vehicles by autonomous vehicles.
In addition to that, one of the examples for the behavioural test is to test how quickly the participant puts his or her hands on the wheel and how the heartbeat changes in some risky driving situation or emergency. The data collected can be compared with the data collected from conventional vehicle settings; therefore, the behavioural test may represent human behaviour more accurately.

4.2. Policy Implementation

Proposed policy implementation can affect public behaviour. It can also assist in the transition to an AV fleet more smoothly through various policy interventions, such as a government subsidies program towards autonomous vehicles, an awareness program to promote the benefits of AVs, and congestion charging towards a single occupied conventional vehicle; however, before fully implementing the policies, policymakers should consider: (1) prioritizing the policy implementation for PT and ride-sharing services over private vehicles; (2) developing strategies and materials that could clearly demonstrate the limitation of various levels of AVs; (3) transparent sharing of AV data to help the government manage/coordinate the implementation more effectively; and (4) design a clear framework to build related infrastructure to accommodate AV implementation, such as charging stations and parking lots. Therefore, the legal, cyber security, and privacy issues can be reduced or mitigated if all the stakeholders (intelligence providers, regulators, end-users, AV manufacturers, and intelligent infrastructure providers) understand the risks and opportunities. A proposed national AV regulatory policy framework, including the development of related infrastructure, research and data transparent sharing, policy balancing innovation and safety, and current baseline legislation, needs to be formulated to prepare the policy implementation for maximizing the benefits of AVs.
All the policies should be evaluated quantitatively and qualitatively based on the research of attitudes towards autonomous vehicles by bridging the above gaps. These will help the government formulate the policy to leverage the benefits of an autonomous vehicle.

4.3. Transportation System

Most of the studies investigated the adoption of AVs towards private and shared-owned models. Nevertheless, few studies analyzed how to better integrate AVs into the public transportation system by providing a reliable connection to the major transportation hubs (such as bus, rail, and tram stations). By exploring more details on land-use changes (e.g., car parking spaces) and enhanced lane capacities, AVs could provide first and last-mile travel solutions to PT; however, this solution may not convince some people to shift away from car mode into PT mode because of the perceived high travel time and less comfortable experience. At this stage, it is unclear whether the mass transit will become less attractive or part of the solution due to the introduction of new autonomous services that may offer more comfortable user experiences; therefore, the government, manufacturers, researchers, and insurance companies should collaborate to find a balanced way to provide a sustainable, equitable and reliable transport network by leveraging the benefits of AVs’ on-demand system. In addition, extra VKT from charging activities for electric AVs and how to facilitate the shared AVs model should be further studied in different contexts.

4.4. Repurpose the Whole Street in Urban Settings

With the introduction of the autonomous vehicle, some questions regarding the design of urban settings need to be addressed as well. For example, “are people still willing to travel by using the conventional car?”, “will most people choose a shared service provided by AVs?”, “does ownership of the AVs belong to the government or the individual?” and “will current car parking spaces transform into entertainment zones or other functional areas due to AVs?”. All these combined questions will lead into one big question: “what does the future car look like?”, given the transformation of car park space into the pickup and drop off zone, the shared service waiting zone, and more spaces for recreational purposes.

4.5. Future Directions

There is a lack of a comprehensive study investigating the dynamic effects between ownership models, technological advancements (level of automation), and AV-related infrastructure. Furthermore, the interconnected influence of other factors such as AV purchase price, congestion due to high VMT, demographic and psychological factors, and policy intervention for long term benefits (such as VMT, safety and congestion) at the systemic level, needs to be investigated. Various policy interventions will be the key direction of future studies when investigating the changes in VMT, safety level, and congestion level due to the adoption and deployment of AVs.
In addition to that, most of the research focused on commuter trips and certain percentages of AV penetration, such as 0%, 50%, and 100%. Other trips such as entertainment-based, education-based, and shopping-based trips are also important, and AVs’ penetration levels may change with time as AV technology advances.
Psychological factors, such as perceived trust, perceived safety, and perceived benefits, may not be measured accurately because most researchers utilized questionnaires or video-based demonstrations instead of a real test drive of AVs to investigate attitudes toward adoption. Further research is required to better understand and quantify the relevant policy impacts of AVs by taking into consideration various factors, such as penetration rate, public adoption, technological advancements, traffic patterns, and business models (private-owned or public-owned). Table 2 summarises the critical issues, problems, and future directions.

Author Contributions

Conceptualization, Y.C. and N.S.; methodology, Y.C.; formal analysis, Y.C.; investigation, Y.C.; data curation, Y.C.; writing—original draft preparation, Y.C.; writing—review and editing, N.S., S.K.K. and P.S.; supervision, N.S. and P.S.; project administration, N.S.; funding acquisition, N.S. and P.S. All authors have read and agreed to the published version of the manuscript.

Funding

This research was funded by Australian Government, Department of Industry, Science, Energy and Resources grant number [AEGP000050].

Institutional Review Board Statement

Not applicable.

Informed Consent Statement

Not applicable.

Data Availability Statement

Not applicable.

Acknowledgments

We want to acknowledge the Australian Government, Department of Industry, Science, Energy and Resources for the financial support received for this study through the Automotive Engineering Graduate Program (GRANT NO: AEGP000050). The views expressed by us do not necessarily reflect those of the funding agency.

Conflicts of Interest

The authors declare no conflict of interest.

Appendix A

Table A1. A Summary of modelling approaches to determine factors that can affect AVs adoption level.
Modelling ApproachPurposeVariableStrengthLimitation
Ordered logit regression [72]Which factors affect the adoption of ACEVs?Demographical factors, gender, education level, past behaviour, recognition, benefits, concerns, and barriers.An online survey in China, including benefits and concerns. Respondents display a positive attitude towards AVs and also show concern about vehicle safety, legal liability and charing issues for AVs.Lack of factors, such as diffusion of adoption.
Cost-based analysis [85]Predict the cost of AV technology-enabled vehicle.Fixed cost (parking), variable cost (fuel, toll, cleaning), fleet (scale) effect, utilization factor (urban/regional, peak/non-peak, empty rides, passenger trip length).Includes public transport, taxi and private vehicles, comprehensive analysis including main factors (vehicle price, active time and overhead cost).It does not consider how the demand is changed; the policy (externalities), change in the capacity of the road for vehicles. Scenario-based framework needs to be investigated.
Based on the car technology acceptance model [71] and regression modelWhat factors can affect travel behaviour (intent to use AVs).A desire for control, technology use, technology acceptance, effort expectancy, social influence, perceived safety, anxiety, attitudes towards technology.Both the quantitative and qualitative methods are considered.It is one static estimation instead of conducting the influence of factors over time.
Structural topic modelling software followed by the estimation of structural equation model [67]Factors that can impact willingness to use AVs.Prior knowledge of AV, age, income, gender, the intensity of disability, generalized anxiety, internal locus of control were selected and inputted into regression analysis.Focus on mentally disabled people, which is a relatively new approach to qualitative research, information from manufacturers are also important as disabled people may distrust commercial advertisements.It does not consider the factors, such as comfort level, in-car amenities, shape, and type of car.
Descriptive statistics (IBM SPSS statistics 25 software) [69]Factors that can impact willingness to use public transport (driverless shuttles).Familiarity with DS, the usefulness of DS, likeliness to use PT, expected benefits of DS, trust in automation, worry about using DS, and trust in authorities.Speed ortravel time is still an important factor although autonomous shuttles can provide greater flexibility. Safety and security issues are key factors to prevent people from adopting driverless shuttles.It does not consider demographic factors. It also needs to be applied to a driverless vehicle.
One-way ANOVAs [76]The relationship between pull in the distance and five dependent variablesGas, brake, steering, land, and speed.Included video-based demonstration and electrodes attached to measure the body effect.The study is a video-based methodology that cannot fully reflect the actual scenario.
Cronbach’s alpha (WTR, reliability), three-way analysis of variance (inferential analysis) [79]investigate the factors that can affect the perception of consumer.Gender, nationality and type of information.It demonstrates an important point: how innovation can be delivered is very important.It only considers three main factors; it does not address how one factor can affect another factor.
Multinomial logit model (MNL model) [23]Investigate consumers’ preference for EV policy incentive by using discrete choice.The purchase price, cruise range, driving restriction rescission, access to the bus lane, parking fee exemption, insurance charge exemption, income level, awareness, parking fee exemption and road tolls exemption.It can turn into a money value, such as willingness to pay for EV purchase restriction and driving restriction which are the most effective policies.It only focuses on Chinese consumers’ preference for EV policy.
Confirmatory factor analysis (CFA), structural model analysis (AMOS software) [24]Investigate using those variables to affect consumers’ intentions to adopt EV.Knowledge of EV, perceived risks, financial incentive policy, perceived usefulness, demographic info.CFA is used to evaluate the validity and reliability of the model; AMOS is to test the research hypothesis.10 pilot cities in China, EV, confirmed the positive effects of knowledge about EVs and perceived usefulness. However, the current financial incentive has no significant effect on adoption.
Agent-based simulation modelling based on diffusion of innovation [75]Forecast long term adoption towards CAV.Socioeconomic, household income, household WTP, vehicle purchase behaviour, social ties, barriers, and motives.Consideration of mass communication, pre-introduction vehicle purchase and peer to peer communication.The 25-year period, starting from 2025
Conditional logit [78]Quantify willingness to pay.Discounted rate, expected length of ownership, expected amount of driving and cost per mile, fuel efficiency, level of automation, type of vehicle, driving range.The research uses discrete choice methods to quantify how much households are willing to pay for various levels of automation—full control over attributes, which helps to find consumers’ attitudes in the new vehicle market.It does not consider the level of adoption and is based on hypothetical choices.
Regression analysis, component-based structural equation modelling (r) [77]Quantify willingness to pay.Gender, age, education, occupation, income, driver, trust, perceived benefit, perceived risk, and perceived dread.The model was first checked for reliability.Participants from two cities in China, no direct experience in the self-driving mode
Pre-test, preliminary descriptive analysis, confirmatory factor analysis [70]To determine the influence of the factor regarding the adoption of AV.Performance expectancy, reliability, security, privacy, trust, adoption scenarios.Normality test (skewness), reliability test.Considers only a closed environment (a university campus), a diverse environment should be investigated.
Structural equation modelling (SEM), Goodness-of-fit criterion, ordinary regression analysis [62]Predict willingness to ride.Perceived usefulness and perceived ease of use, perceived safety, trust, behavioural intention.Three models were tested: technological acceptance model (TAM), complete structural model, mediation analysis.It does not consider demographic factors and real driving experiences.
Discrete choice model (multinomial logit, error-component mixed logit and hybrid discrete choice models) [81]Quantify Value of Travel Time (VOTT).Socio-demographic variable, travel time, travel cost, extra work or saving time, and time to walk from conventional car to destination.It includes VOTT (working in a vehicle) and VOTT (leisure), compared with a traditional car.It is a more static model instead of a dynamic model.
Discrete choice model, utility theory, and multinomial logit model [86]Investigate the factors that can affect the adoption of SEAVs.Socio-demographic characteristics, per km cost of transport, serious automotive accidents, increase in urban space, extra travel time as a result of congestion.It has compared groups including different percentages of sharing service and sensitivity analysis on price.It does not consider non-shared service.
Latent profile analysis, one-way ANOVAs, or chi-square tests [87]Investigate the factors that can affect the adoption of private and shared AVs.Socio-demographic characteristics, preferred forms of transport, attitudes, intentions to purchase, travelling time, and driving history.Five classes of diffusion of innovations are considered.It only considers the Australian market.
Descriptive statistics ([88]Investigate user acceptance, concerns and WTP.Socio-demographic characteristics, driving frequency, mileage, accident involvement, preference.It measures in which condition that AV is preferred. Individual and country level.Public opinion is diverse; a large number of people do not want to pay for it. People from high-income countries do not want their vehicle data to be shared with other organizations.
Scenario-analysis, conceptual system dynamics models [52]Investigate behavioural changes and thus impacting traffic volume, congestion, land use and mode choice.Causal loop diagrams (road capacity, travel time, traffic volume, cars in the region, average trip length, adequacy of public transit, fare increase).It considers urban density due to the reduced parking spaces. It has three scenarios (technology changes but we do not, new technology drives new behaviour, and new tech will drive new ownership models).It only discusses three scenarios. There is an opportunity for considering other realistic scenarios.
Univariate OP specifications (Stata 12 software) [89]Investigate the factors that can affect the adoption.Demographics (gender, age, education, household income), built environment (employment density, population density, area type), travel characteristics, WTP, technology-based predictors.Estimation of adoption under different pricings, the timing of AVs (50%, 10% and no of friends adopting AVs) and home location shifts.It only applies to Austin.
Stated preference, utility theory, nested logit kernel, factor analysis [90]Investigate the factors that can impact adoption under various scenarios.Individual (socio-economic, attitudes, behaviours, travel behaviour), system (ownership, control and cost).It compares the population group between US and Israelis.Technology can change so fast that it can be hard to predict.
Confirmatory factor analysis [91]Compare the four frameworks and detect the range of possible adoption behaviour.Socio-demographic, perceived benefits, perceived ease of use, public fears, perceived behavioural control, attitudinal factors and car ownership.It compares four frameworks of users’ adoption prediction and includes validity.It will help predict AV interest, adoption, sharing, ownership and public transport adoption decisions regarding self-driving vehicles.
Repeated measure analyses of variances (IBM SPSS, Version 25), MAXQDA for qualitative content analysis [19]Estimate years until acceptance and adoption, willingness to pay, investigate government contribution and internal design of AVs.Age and gender. The research does consider the question from governmental and internal design perspectives. The research is limited to the German public, and the findings are not applicable to sharing models.
A 3 M model using PLS-SEM and fuzzy set qualitative comparative analysis, ANOVA analysis, and confirmatory factor analysis [74]Investigate how personality traits can facilitate people to adopt level 5 AV podsSocial, functional, hedonic and cognitive innovativeness.Two minute video to illustrate the features of AV pods, a novel framework for investigating public adoption of the new technologies, new personality-based motivating mechanisms and suggestion of a design function to accommodate the preference of consumers. The research is limited in the US, and it does not focus on consumers’ perceptions, including safety, sustainability, the value of time, trust, etc.
Table A2. A summary of modelling approaches for quantifying the impacts of factors towards AV adoption.
Topic CategoryScope of the StudyData AnalysisLevel of AutomationKey FindingsLimitationFuture Work
Uncertainties of shared vehicles [10]Briefly discussed complexities of users, innovations and perception by synthesizing 19 peer-review articles.Summarise the research in a table.Not specifiedConceptualization of the benefits, private/societal, functional/symbolic.
Early adopter: male, younger, higher household income, cost-saving.
North American, Western European, China. No studies on freight, rail and marine travel.Lower travels induce a rebound effect that increases the overall trip (more vehicles).
Consumer attitudes/adoption level of ACEV [72]Understand consumer mindset containing concerns, barriers and benefits via an online survey, min response time, logic relationships between questions.Order logit model to explore the factors after WTP.No, partial, and full automation AV manufacturers can provide channels for the public to learn.
Barriers: vehicle performance, financial costs and infrastructure improvements. VMT will be increased due to more trips from AVs (cost decline), Less concerned with technology and data privacy.
Bias exists because people who tend to use online will be likely to adopt new technology.Infrastructure improvement, such as charging stations, would be a key driver for adoption.
Cost of AVs [85]Investigate the cost via price per KM, urban, regional and overall, validation with current services.R program with an input interface in Excel.Not specifiedConventional forms of PT may face fierce competition, shared of AV fleets may well depend on a factor (cleaning efforts), travel time, waiting times and perception will substantially impact mode choice.The external impact such as road pricing, special pricing strategies and the demand for infrastructure (parking) are not covered.Re-sized, line-based transit resulting from the automation of buses (smaller capacities and higher frequencies).
Consumer attitudes [71]Predict intention to use via CTAM (car technology acceptance model), two-part study (online survey and face to face interview).Two-stage data collectionNot specifiedHow likely are people to use AVs? (lack of trust), what are the factors that influence acceptance and intent to use? (physical conditions), why AVs? (safer, relieve stress, productive), How would people change their current travel behaviour?A small population (556 Austin residents), age and income are not covered, more and more fact to face interviews will be informative.Household car-sharing, new types of car-sharing fleets, or the challenges of mixed fleets on the road, large population.
Consumer attitudes for mentally disabled people [67]Investigate the factors that can impact people’s attitude via 177 intellectually disabled UK residents, anxiety, locus of control, prior knowledge, age, income (freedom, fear and curiosity).Structural topic modelling (STM) followed by the estimation of a structural equation regression model.Not specifiedPrior knowledge of AVs has a significant positive response falling on freedom and curiosity. Age and household income situation are not relevant to the three topics.Participants might interpret an open-ended question differently, single country, restricted number of explanatory variables (social norms or people’s housing situations).Best means for informing disabled people regarding the benefits of AVs.
Individuals’ views/attitudes on the usefulness of driverless shuttles [69]Investigate the views of individuals who do not often use PT, online survey, 5-point scale, choice of transit mode, familiarity, usefulness, likeliness, expected benefits, trust.IBM SPSS statistics 25.Not specifiedOf those studied, 48.9% think driverless shuttle (DS) not useful, DS expected benefits are to improve mobility of seniors and reduce car traffic and pollution, 54.9% preferred the presence of the driver, concerned with safety and security, and 48.1% had no trust or low trust for DS.Not representative for the whole population (use private vehicles more).Legislative framework; to clarify the responsibilities, the concern of distrust towards the adoption of DS should be addressed by bus operators and authorities.
Specific behaviours and interactions with conventional vehicles [76]Investigate how people behave when AVs overtake (twenty people paid 5 pounds, electrodermal activity for fingers, heart rate, video-based methodology).ANOVANot specifiedTwenty-eight metres (1s gap) is acceptable for pull-in distance; acceptability of overtaking manoeuvre increases linearly when pull-in distance up to 28 m (for both overtaking and being overtaken).Including acceptable behaviour between AVs and human-controlled vehicles and to occupants.A video-based approach could cause misinterpretation compared to a driving simulator.
Consumers’ willingness to adopt [79]Inspect how positive or negative information can affect consumer willingness to adopt (consumer perceptions, genders, nationalities, information type, WTR scale form).Cronbach’s alpha test (WTR, reliability of the data), three-way factorial analysis.Fully automatedIndians are more willing to drive AVs compared with Americans; how the innovation is covered in the media is very important.Including the relationship between WTR and information type, nationality, gender, and WTR, hypothetical scenarios, limited information (not comprehensive).Females are less willing to use AVs.
Policy evaluation [23]Investigate how policy can affect electric vehicle acceptance (Socio-psychologist determinants, EV-purchase/usage/infrastructure/production link, via a web-based snowballing method to conduct questionnaire, China, WTP changes in vehicle attributes and policy incentive).Discrete choice experiment, mixed logit model, random utility theory.Not specifiedPurchase restriction impact is significant; access to bus lanes, and free public charging can increase WTP, purchase price; people prefer a longer cruise range as they do not want to pay too much.Only China is covered.A further investigation into free public charging impacts on the adoption of AVs
Policy and consumers’ adoption of EV [24]Investigate factors that can affect adoption level (Perceived risk, perceived usefulness and financial incentive policy, questionnaire survey, basic demographic info and the latent constructs, ten pilot cities in China).Technology acceptance model (TAM), confirmatory factor analysis (CFA, reliability and validity of the measurement model), AMOS software (test the research hypotheses).Not specifiedFinancial incentive policy has no significant effect on intention; educating the consumers regarding knowledge is the most effective way; perceived high risk are the psychological barriers.Not considering ease of use/perceived cost/perceived trust, not considering actual adoption behaviour.The research focuses on anonymous cross-sectional data, however, a longitudinal design could be conducted to examine the relationship between the independent variable and dependent variables
Predict consumers’ attitude/adoption [75]Predict consumers’ adoption level of AVs via diffusion of innovations (WTP change because of peer to peer, resistance (functional barrier and psychological barrier), two factors (marketing and word of mouth, simulating 25-year horizon from 2025).Agent-based model (MATLAB)Not specifiedPre-introduction market campaign may have no significant impact on adoption, first to use a diffusion of innovations and agent-based modelling, the automobile fleet will be homogenous in around 2050.Not considering all car types, multiple technology generations, behavioural research (for barrier and incentive) is missed.CAV market penetrations should be considered.
Estimate willingness to pay for AVs [78]Predict willingness to pay (Discrete choice experiment, web-based experiment, participants discuss the pros and cons, Qualtric online platform to collect data, personal characteristics and vehicle choice experiment).Conditional logit with deterministic consumer heterogeneity.No, partial and full automation.WTP for household: USD 3500 for partial automation and USD 4900 for full automation, demand for automation split evenly between no demand, modest and high.Should offer more levels of automation, presents a more precise representation of automation, and hypothetical choice (cannot perfect simulate choices).What is the acceptance level when consumers learn about its advantages and disadvantages?
Consumers’ attitude/adoption [77]Analyze the factors that can affect the adoption of AV (800 surveys, Xi’an, based on age, gender, education, occupation, income, psychological determinants (perceived benefits, risk and trust), hypothetical assumption, description of technology).Regression on WTP, partial least squares, a component-based structural equation modelling (R package).Not specifiedOf those studied, 26.3% are unwilling to pay more, 39.3% willing to pay less than USD 2900, 34.3% willing to pay more than USD 2900, young, higher educated, high income (pay more).Only covers two cities in China, does not have direct experience for self-driving.Barriers for high WTP, and the reasons for cross-cultural differences, how demographic factors can impact WTP regarding technology.
Consumers’ adoption [70]Investigate key factors that can affect adoption (questionnaire, the context of a case study, ten questions, 5-point scales, exclude level of automation and include scenarios, hypothesis test, different environments but focus on the closed environment).Confirmatory factor analysis (determine the impacts of different factors).Not specifiedBenefits for early phase.Covering trust (reliability, security, privacy and performance expectancy), focus on the closed environment (university).Obtain the elderly, and disabled people view instead of making an assumption, how adoption can change over time.
Consumers’ adoption [62]Investigate key factors that can affect adoption (Perceived usefulness, trust, perceived safety, perceived ease of use, willingness to re-ride, Behavioural intention recorded, utilized level 3 to predict level 5, under different scenario (i.e., pedestrian collision, tunnel…), closed environment, Likert-type scales).Psychological model, TAM model as a base (before and after AV experience), structural equation modelling to test the measurement, ordinary least squares regression analysis for robustness.Level 3The biggest barrier for AVs is a psychological factor; the experiment can increase trust, PU and PEU.Only covers young college students, test drivers in the car (no directly manoeuvre the AV), only four determinants were investigated.Effects on additional socio-psychological factors on acceptance, how attitude changes over time.
Consumers’ adoption [81]Compare the value of time between work and leisure activities (500 respondents, choice set, 18 attitudinal statements, 7-point Likert scale).Stated choice experiment, discrete choice models, multinomial logit, nested logit models.Not specifiedVOTT of a work vehicle (AV) will be lower than today, whereas leisure could stay the same (maybe due to safety reasons).Only covering car commute trips, imagine being able to conduct work inside the car.Travel time reliability, the experience of being in traffic congestion.
Consumers’ attitude on ride-sharing and AVs [86]Investigate the key drivers that can affect people to adopt SEAVs regarding social and economic advantages (20 km of the CBD in Brisbane)Discrete choice model and multinomial logit model.Not specifiedCost is the biggest driver, although congestion induced travel time and serious accidents. Wealthy people, commuters, and young people are likely to adopt SEAVs.Some variables such as number of serious accidents, extra time spent and increasing urban space are fixed numbers, online surveyAge and gender are not revealed well in this study.
Consumers’ attitude between private ownership and shared use modes [87]Investigate the key drivers that can promote the uptake of AVs (1345 Australians aged 16+, 97% driver, online survey)Latent profile analysisNot specifiedGovernment plays a key role, ride sharing is more popular than private in Australia, knowledge of AVs is low, interest is moderate.It did not consider risk-taking and sensation-seeking factors.Attitudes and behavioural intentions are important areas for future research.
Consumers’ attitude on three levels of automation [88]Investigate the key factors that can affect adoption in the world level(63 questions internet-based surveys, 109 countries)Descriptive analysisPartially, highly and fully automationConcerned about software hacking, legal issues, and safety. Developed countries care more about vehicle transmitting data. Sixty-nine percent predicted the full automation. Manual driving is the most enjoyable mode.Online survey limitation, it does not consider perceived safety, trust and benefits.Further investigation of data privacy impacts towards adoption of AVs
Impacts on regional planning [52]Investigate the AVs effects at the system level, longer-term and indirect effects. (interviews and workshop)Scenario-analysis, conceptual system dynamics models,Not specifiedVMT is likely to increase; it may increase the congestion due to the increase in car usage. Policy suggestion: (a) road pricing, (b) road user charge, or (c) increase travel time.It does not consider psychological issues, such as trust, perceived safety.Public discussion about long-term.
Consumers’ adoption and attitude [89]Investigate WTP for AV, SAV adoption rates, WTP for CV, adoption timing of AVs and home shifts (347 Austinites, online via email)Univariate OP specificationsLevel 3, level 4Fewer crashes to be the main benefits, average WTP for level 4 (USD 7253) is much higher than level 3 (USD 3300), adoption mainly depends on friends’ adoption, people who drive more are likely to adopt.Tech-savvy males, high income, urban areas, those who experienced more crashes are likely to adopt AVs. Smart pricing, speed limitation, new demand on VMT, using GPS to avoid a bottleneck. It does not differentiate between the driver and passenger.
Consumers’ adoption and attitude [92]Understand potential benefits, barriers and opportunities by evaluating attitudinal components.Stated preference/choiceNot specifiedLevel of awareness, safety, trust of strangers, complexity are factors that can affect adoption. The widespread diffusion of AVs on roads can result in fewer crashes, lower emissions and better fuel economy. There is no consensus on travel demand impact.It only discusses previous stated preference/choice studies of AV.Travel demand of AVs, land-use change, innovative road pricing,
Consumers’ adoption [90]Understand the factor that can affect (1) private cars; (2) private AVs; and (3) shared AVs
(721 person who drive, Israel and North America, Qualtrics).
Utility models, Stated preferenceNot specifiedEarly adopters (young, educated, spend more time in vehicles). Decreased cost and awareness programs can encourage people to adopt AVs. Technology interest, environmental concern, driving joyfulness, pro-AV sentiment, and public transit attitude are the most important attitudes.It only focuses on a commuting trip. The hypothetical situation may not be representative of real situation. Longitudinal studies can investigate the choice at several different points.
Consumers’ adoption and decisions among modes [91]Test four conceptual frameworks to detect consumers’ adoption and decisions among different modes. (online surveys, Great Dublin AreaSynthesize existing models of consumers’ adoption, including social psychology, socioecology, technology, and innovation studies.Not specifiedHigher education level can lead to high adoption of AVs and high car ownership. Females tend to not adopt AVs, and perceived benefits are an important reason to affect adoption. It does not include all the situations, such as highway, level of automation, and real driving experiences. Further investigation of how AVs can impact ownership, sharing and public transport adoption decisions.
Perception of AV [93]Investigate safety (risk of collision) and acceptance of AV. (1000 participants, UK, online survey).CSGLM, ANOVANot specifiedAV is perceived as low risk; the passenger is less risky while the driver is riskier compared with a conventional vehicle. Males and younger people tend to accept AVs.It only analyzes the result by ANOVA and correlation test. More aspects should be investigated, such as how different factors combined can affect adoption.
Factors affecting willingness to buy AVs [73]Discuss safety, socio-economic, demographic, carsharing habits, types of housing and parking, and residential region and preferences for buying or leasing factors. Mixed logit modelLevel 3, 4 and 5 A significant difference for determinants regarding willingness to purchase partially AVs and fully AVs.The data is collected in California, where the people prefer using conventional cars. More policy sensitivity tests to be explored in detail.
CAVs’ cybersecurity assessment [41]CAVs communication framework, secured physical access, human factors; CAVs penetration, regulatory laws and policy framework; trust across the industry (OEMs) and among the public; system dynamic modelling.Conceptual SD model with Causal Loop Diagrams (CLDs)Not specifiedDevelops a conceptual System Dynamics (SD) model to analyze cybersecurity in the complex, uncertain deployment of CAVs. Considers the inter-avenue feedback, which emulates system archetypes. System archetypes provide leverage to enable effective system enhancements for cybersecurity.It lacks quantitative assessment but paves the future research direction for quantitative calibration and validation once the quantitative data are available in the near future.Calibration of the model will be investigated when more data is available.

References

  1. Sam, D.; Velanganni, C.; Evangelin, T.E. A vehicle control system using a time synchronized Hybrid VANET to re-duce road accidents caused by human error. Veh. Commun. 2016, 6, 17–28. [Google Scholar]
  2. Townsend, A. The 100-Year History of Self-Driving Cars. 2020. Available online: https://onezero.medium.com/the-100-year-history-of-self-driving-vehicles-10b8546a3318 (accessed on 21 March 2022).
  3. Yeo, H.; Shladover, S.E.; Krishnan, H.; Skabardonis, A. Modeling Driving Responses to Vehicle-to-Vehicle Hazard Alerts in Freeway Traffic. IFAC Proc. Vol. 2009, 42, 549–555. [Google Scholar] [CrossRef]
  4. Walz, E. 2020. Available online: https://www.futurecar.com/4249/Silicon-Valley-Startup-Nuro-Announces-$500-Million-in-New-Funding-for-its-Tiny-Autonomous-Delivery-Vehicles (accessed on 21 March 2022).
  5. Anonymous. NSW Partially Automated Vehicle Trials. 2018. Available online: https://www.transurban.com/content/dam/cavs/documents/nsw-trials-report.pdf (accessed on 21 March 2022).
  6. Markoff, J. 2015. Available online: https://www.nytimes.com/2015/11/06/technology/toyota-silicon-valley-artificial-intelligence-research-center.html (accessed on 8 April 2022).
  7. Anonymous. SAE International. 2021. Available online: https://www.sae.org/news/2021/06/sae-revises-levels-of-driving-automation (accessed on 21 March 2022).
  8. Guanetti, J.; Kim, Y.; Borrelli, F. Control of connected and automated vehicles: State of the art and future challenges. Annu. Rev. Control 2018, 45, 18–40. [Google Scholar] [CrossRef] [Green Version]
  9. Shiwakoti, N.; Stasinopoulos, P.; Fedele, F. Investigating the state of connected and autonomous vehicles: A literature Review. Transp. Res. Procedia 2020, 48, 870–882. [Google Scholar] [CrossRef]
  10. Axsen, J.; Sovacool, B.K. The roles of users in electric, shared and automated mobility transitions. Transp. Res. Part D Transp. Environ. 2019, 71, 1–21. [Google Scholar] [CrossRef]
  11. Van Brummelen, J.; O’Brien, M.; Gruyer, D.; Najjaran, H. Autonomous vehicle perception: The technology of today and tomorrow. Transp. Res. Part C 2018, 89, 384–406. [Google Scholar] [CrossRef]
  12. Khan, S.K.; Shiwakoti, N.; Stasinopoulos, P.; Chen, Y. Cyber-attacks in the next-generation cars, mitigation techniques, anticipated readiness and future directions. Accid. Anal. Prev. 2020, 148, 105837. [Google Scholar] [CrossRef]
  13. De La Torre, G.; Rad, P.; Choo, K.K.R. Driverless vehicle security: Challenges and future research opportunities. Future Gener. Comput. Syst. 2020, 108, 1092–1111. [Google Scholar] [CrossRef]
  14. Chan, C.-Y. Advancements, prospects, and impacts of automated driving systems. Int. J. Transp. Sci. Technol. 2017, 6, 208–216. [Google Scholar] [CrossRef]
  15. Zhang, Y.; Cassandras, C.G. An impact study of integrating connected automated vehicles with conventional traf-fic. Annu. Rev. Control 2019, 48, 347–356. [Google Scholar] [CrossRef]
  16. Fagnant, D.J.; Kockelman, K. Preparing a nation for autonomous vehicles: Opportunities, barriers and policy recommendations. Transp. Res. Part A Policy Pract. 2015, 77, 167–181. [Google Scholar] [CrossRef]
  17. Anonymous. Autonomous Vehicles Readiness Index (AVRI). 2019. Available online: kpmg.com/avri (accessed on 21 March 2022).
  18. Truong, L.T.; De Gruyter, C.; Currie, G.; Delbosc, A. Estimating the trip generation impacts of autonomous vehicles on car travel in Victoria, Australia. Transportation 2017, 44, 1279–1292. [Google Scholar] [CrossRef]
  19. Weigl, K.; Eisele, D.; Riener, A. Estimated years until the acceptance and adoption of automated vehicles and the willingness to pay for them in Germany: Focus on age and gender. Int. J. Transp. Sci. Technol. 2022. [Google Scholar] [CrossRef]
  20. Yu, H.; Jiang, R.; He, Z.; Zheng, Z.; Li, L.; Liu, R.; Chen, X. Automated vehicle-involved traffic flow studies: A survey of assumptions, models, speculations, and perspectives. Transp. Res. Part C Emerg. Technol. 2021, 127, 103101. [Google Scholar] [CrossRef]
  21. Zheng, F.; Liu, C.; Liu, X.; Jabari, S.E.; Lu, L. Analyzing the impact of automated vehicles on uncertainty and stability of the mixed traffic flow. Transp. Res. Part C Emerg. Technol. 2020, 112, 203–219. [Google Scholar] [CrossRef]
  22. Chen, D.; Ahn, S.; Chitturi, M.; Noyce, D.A. Towards vehicle automation: Roadway capacity formulation for traffic mixed with regular and automated vehicles. Transp. Res. Part B Methodol. 2017, 100, 196–221. [Google Scholar] [CrossRef] [Green Version]
  23. Wang, N.; Tang, L.; Pan, H. Effectiveness of policy incentives on electric vehicle acceptance in China: A discrete choice analysis. Transp. Res. Part A Policy Pract. 2017, 105, 210–218. [Google Scholar] [CrossRef]
  24. Wang, S.; Wang, J.; Li, J. Policy implications for promoting the adopting of electric vehicles: Do consumer’s knowledge, perceived risk and financial incentive policy matter? Transp. Res. Part A Policy Pract. 2018, 117, 58–69. [Google Scholar] [CrossRef]
  25. Chen, S.; Wang, H.; Meng, Q. Designing autonomous vehicle incentive program with uncertain vehicle purchase price. Transp. Res. Part C Emerg. Technol. 2019, 103, 226–245. [Google Scholar] [CrossRef]
  26. Zhang, W.; Wang, K. Parking futures: Shared automated vehicles and parking demand reduction trajectories in At-lanta. Land Use Policy 2020, 91, 103963. [Google Scholar] [CrossRef]
  27. Narayanan, S.; Chaniotakis, E.; Antoniou, C. Shared autonomous vehicle services: A comprehensive review. Transp. Res. Part C Emerg. Technol. 2020, 111, 255–293. [Google Scholar] [CrossRef]
  28. Kroger, L.; Kuhnimhof, T.; Trommer, S. Does context matter? A comparative study modelling autonomous vehicle impact on travel behaviour for Germany and the USA. Transp. Res. Part A 2019, 122, 146–161. [Google Scholar] [CrossRef]
  29. Mersky, A.; Samaras, C. Fuel economy testing of autonomous vehicles. Transp. Res. Part C Emerg. Technol. 2016, 65, 31–48. [Google Scholar] [CrossRef]
  30. Bhavsar, P.; He, Y.; Chowdhury, M.; Fries, R.; Shealy, A. Energy Consumption Reduction Strategies for Plug-In Hybrid Electric Vehicles with Connected Vehicle Technology in Urban Areas. Transp. Res. Rec. J. Transp. Res. Board 2014, 2424, 29–38. [Google Scholar] [CrossRef]
  31. Stern, R.E.; Chen, Y.; Churchill, M.; Wu, F.; Monache, M.L.D.; Piccoli, B.; Seibold, B.; Sprinkle, J.; Work, D.B. Quantifying air quality benefits resulting from few autonomous vehicles stabilizing traffic. Transp. Res. Part D Transp. Environ. 2018, 67, 351–365. [Google Scholar] [CrossRef] [Green Version]
  32. Chen, Y.; Gonder, J.; Young, S.; Wood, E. Quantifying autonomous vehicles national fuel consumption impacts: A data-rich approach. Transp. Res. Part A Policy Pract. 2019, 122, 134–145. [Google Scholar] [CrossRef]
  33. Kalra, N.; Paddock, S.M. Driving to safety: How many miles of driving would it take to demonstrate autonomous vehicle reliability? Transp. Res. Part A Policy Pract. 2016, 94, 182–193. [Google Scholar] [CrossRef]
  34. Sohrabi, S.; Khodadadi, A.; Mousavi, S.M.; Dadashova, B.; Lord, D. Quantifying the automated vehicle safety performance: A scoping review of the literature, evaluation of methods, and directions for future research. Accid. Anal. Prev. 2021, 152, 106003. [Google Scholar] [CrossRef]
  35. El-Hansali, Y.; Farrag, S.; Yasar, A.; Shakshuki, E.; Al-Abri, K. Using Surrogate Measures to Evaluate the Safety of Autonomous Vehicles. Procedia Comput. Sci. 2021, 191, 151–159. [Google Scholar] [CrossRef]
  36. Papadoulis, A.; Quddus, M.; Imprialou, M. Evaluating the safety impact of connected and autonomous vehicles on motorways. Accid. Anal. Prev. 2019, 124, 12–22. [Google Scholar] [CrossRef] [Green Version]
  37. Zhu, J.; Tasic, I. Safety analysis of freeway on-ramp merging with the presence of autonomous vehicles. Accid. Anal. Prev. 2021, 152, 105966. [Google Scholar] [CrossRef] [PubMed]
  38. Yang, S.; Du, M.; Chen, Q. Impact of connected and autonomous vehicles on traffic efficiency and safety of an on-ramp. Simul. Model. Pract. Theory 2021, 113, 102374. [Google Scholar] [CrossRef]
  39. Mueller, A.S.; Cicchino, J.B.; Zuby, D.S. What human-like errors do autonomous vehicles need to avoid to maxim-ize safety? J. Saf. Res. 2020, 75, 310–318. [Google Scholar] [CrossRef] [PubMed]
  40. Kim, K.; Kim, J.S.; Jeong, S.; Park, J.-H.; Kim, H.K. Cybersecurity for autonomous vehicles: Review of attacks and defense. Comput. Secur. 2021, 103, 102150. [Google Scholar] [CrossRef]
  41. Khan, S.K.; Shiwakoti, N.; Stasinopoulos, P. A conceptual system dynamics model for cybersecurity assessment of connected and autonomous vehicles. Accid. Anal. Prev. 2021, 165, 106515. [Google Scholar] [CrossRef]
  42. Pham, M.; Xiong, K. A Survey on Security Attacks and Defense Techniques for Connected and Autonomous Vehicles. Comput. Secur. 2021, 109, 102269. [Google Scholar] [CrossRef]
  43. Khan, S.K.; Shiwakoti, N.; Stasinopoulos, P.; Warren, M. Security assessment in Vehicle-to-Everything communica-tions with the integration of 5G and 6G networks. In Proceedings of the 2021 International Symposium on Computer Science and Intelligent Con-trols (ISCSIC), Rome, Italy, 12–14 November 2021; pp. 154–158. [Google Scholar]
  44. Channon, M.; Marson, J. THE liability for cybersecurity breaches of connected and autonomous vehicles. Comput. Law Secur. Rev. 2021, 43, 105628. [Google Scholar] [CrossRef]
  45. Manivasakan, H.; Kalra, R.; O’Hern, S.; Fang, Y.; Xi, Y.; Zheng, N. Infrastructure requirement for autonomous vehicle integration for future urban and suburban roads—Current practice and a case study of Melbourne, Australia. Transp. Res. Part A Policy Pract. 2021, 152, 36–53. [Google Scholar] [CrossRef]
  46. Sperling, D. Three Revolutions: Steering Automated, Shared, and Electric Vehicles to a Better Future; Island Press: Washington, DC, USA, 2018. [Google Scholar]
  47. Zhang, T.Z.; Chen, D. Smart charging management for shared autonomous electric vehicle fleets: A Puget Sound case study. Transp. Res. Part D 2020, 78, 102184. [Google Scholar] [CrossRef]
  48. Gavanas, N. Autonomous Road Vehicles: Challenges for Urban Planning in European Cities. Urban Sci. 2019, 3, 61. [Google Scholar] [CrossRef] [Green Version]
  49. Anastasiadou, K.; Gavanas, N.; Pitsiava-Latinopoulou, M.; Bekiaris, E. Infrastructure Planning for Autonomous Electric Vehicles, Integrating Safety and Sustainability Aspects: A Multi-Criteria Analysis Approach. Energies 2021, 14, 5269. [Google Scholar] [CrossRef]
  50. McAslan, D.; Gabriele, M.; Miller, T.R. Planning and Policy Directions for Autonomous Vehicles in Metropolitan Planning Organizations (MPOs) in the United States. J. Urban Technol. 2021, 28, 175–201. [Google Scholar] [CrossRef]
  51. Berrada, J.; Leurent, F. Modeling Transportation Systems involving Autonomous Vehicles: A State of the Art. Transp. Res. Procedia 2017, 27, 215–221. [Google Scholar] [CrossRef]
  52. Gruel, W.; Stanford, J.M. Assessing the Long-term Effects of Autonomous Vehicles: A Speculative Approach. Transp. Res. Procedia 2016, 13, 18–29. [Google Scholar] [CrossRef] [Green Version]
  53. Nieuwenhuijsen, J.; Correia, G.; Milakis, D.; van Arem, B.; van Daalen, E. Towards a quantitative method to analyze the long-term innovation diffusion of automated vehicles technology using system dynamics. Transp. Res. Part C Emerg. Technol. 2018, 86, 300–327. [Google Scholar] [CrossRef] [Green Version]
  54. Puylaert, S.; Snelder, M.; van Nes, R.; van Arem, B. Mobility impacts of early forms of automated driving—A system dynamic approach. Transp. Policy 2018, 72, 171–179. [Google Scholar] [CrossRef] [Green Version]
  55. Stasinopoulos, P.; Shiwakoti, N.; Beining, M. Use-stage life cycle greenhouse gas emissions of the transition to an autono-mous vehicle fleet: A System Dynamics approach. J. Clean. Prod. 2021, 278, 123447. [Google Scholar] [CrossRef]
  56. Kim, Y.; Kim, H.; Suh, K. Environmental performance of electric vehicles on regional effective factors using system dynamics. J. Clean. Prod. 2021, 320, 128892. [Google Scholar] [CrossRef]
  57. Yu, J.; Chen, A. Differentiating and modeling the installation and the usage of autonomous vehicle technologies: A system dynamics approach for policy impact studies. Transp. Res. Part C Emerg. Technol. 2021, 127, 103089. [Google Scholar] [CrossRef]
  58. Javanshour, F.; Dia, H.; Duncan, G. Exploring the performance of autonomous mobility on-demand systems under demand uncertainty. Transp. A Transp. Sci. 2019, 15, 698–721. [Google Scholar] [CrossRef]
  59. Javanshour, F.; Dia, H.; Duncan, G.; Abduljabbar, R.; Liyanage, S. Performance Evaluation of Station-Based Autonomous On-Demand Car-Sharing Systems. IEEE Trans. Intell. Transp. Syst. 2021, 13, 1–12. [Google Scholar] [CrossRef]
  60. Golbabaei, F.; Yigitcanlar, T.; Bunker, J. The role of shared autonomous vehicle systems in delivering smart urban mobility: A systematic review of the literature. Int. J. Sustain. Transp. 2021, 15, 731–748. [Google Scholar] [CrossRef]
  61. Lau, S.T.; Susilawati, S. Shared autonomous vehicles implementation for the first and last-mile services. Transp. Res. Interdiscip. Perspect. 2021, 11, 100440. [Google Scholar] [CrossRef]
  62. Xu, Z.; Zhang, K.; Min, H.; Wang, Z. What drives people to accept automated vehicles? Findings from a field ex-periment. Transp. Res. Part C Emerg. Technol. 2018, 95, 320–334. [Google Scholar] [CrossRef]
  63. Schneble, C.O.; Shaw, D.M. Driver’s views on driverless vehicles: Public perspectives on defining and using au-tonomous cars. Transp. Res. Interdiscip. Perspect. 2021, 11, 100446. [Google Scholar] [CrossRef]
  64. Hudson, J.; Orviska, M.; Hunady, J. People’s attitudes to autonomous vehicles. Transp. Res. Part A Policy Pract. 2019, 121, 164–176. [Google Scholar] [CrossRef]
  65. Rice, S.; Winter, S.R. Do gender and age affect willingness to ride in driverless vehicles: If so, then why? Technol. Soc. 2019, 58, 101145. [Google Scholar] [CrossRef]
  66. Hardman, S.; Berliner, R.; Tal, G. Who will be the early adopters of automated vehicles? Insights from a survey of electric vehicle owners in the United States. Transp. Res. Part D Transp. Environ. 2018, 71, 248–264. [Google Scholar] [CrossRef]
  67. Bennett, R.; Vijaygopal, R.; Kottasz, R. Willingness of people with mental health disabilities to travel in driverless vehicles. J. Transp. Health 2019, 12, 1–12. [Google Scholar] [CrossRef]
  68. Liljamo, T.; Liimatainen, H.; Pollanen, M. Attitudes and concerns on automated vehicles. Transp. Res. Part F Traffic Psychol. Behav. 2018, 59, 24–44. [Google Scholar] [CrossRef]
  69. Roche-Cerasi, I. Public acceptance of driverless shuttles in Norway. Transp. Res. Part F Traffic Psychol. Behav. 2019, 66, 162–183. [Google Scholar] [CrossRef]
  70. Kaur, K.; Rampersad, G. Trust in driverless cars: Investigating key factors influencing the adoption of driverless cars. J. Eng. Technol. Manag. 2018, 48, 87–96. [Google Scholar] [CrossRef]
  71. Zmud, J.P.; Sener, I.N. Towards an Understanding of the Travel Behavior Impact of Autonomous Vehicles. Transp. Res. Procedia 2017, 25, 2500–2519. [Google Scholar] [CrossRef]
  72. Wu, J.; Liao, H.; Wang, J.-W. Analysis of consumer attitudes towards autonomous, connected, and electric vehicles: A survey in China. Res. Transp. Econ. 2020, 80, 100828. [Google Scholar] [CrossRef]
  73. Behnood, A.; Haghani, M.; Golafshani, E.M. Determinants of purchase likelihood for partially and fully automated vehicles: Insights from mixed logit model with heterogeneity in means and variances. Transp. Res. Part A Policy Pract. 2022, 159, 119–139. [Google Scholar] [CrossRef]
  74. McLeay, F.; Olya, H.; Liu, H.; Jayawardhena, C.; Dennis, C. A multi-analytical approach to studying customers motivations to use innovative totally autonomous vehicles. Technol. Forecast. Soc. Chang. 2022, 174, 121252. [Google Scholar] [CrossRef]
  75. Talebian, A.; Mishra, S. Predicting the adoption of connected autonomous vehicles: A new approach based on the theory of diffusion of innovations. Transp. Res. Part C Emerg. Technol. 2018, 95, 363–380. [Google Scholar] [CrossRef]
  76. Ritchie, O.T.; Watson, D.G.; Griffiths, N. How should autonomous vehicles overtake other drivers? Transp. Res. Part F Traffic Psychol. Behav. 2019, 66, 406–418. [Google Scholar] [CrossRef]
  77. Liu, P.; Guo, Q.; Ren, F.; Wang, L.; Xu, Z. Willingness to pay for self-driving vehicles: Influences of demographic and psychological factors. Transp. Res. Part C Emerg. Technol. 2019, 100, 306–317. [Google Scholar] [CrossRef]
  78. Daziano, R.A.; Sarrias, M.; Leard, B. Are consumers willing to pay to let cars drive for them? Analyzing response to autonomous vehicles. Transp. Res. Part C Emerg. Technol. 2017, 78, 150–164. [Google Scholar] [CrossRef] [Green Version]
  79. Anania, E.C.; Rice, S.; Walters, N.W.; Pierce, M.; Winter, S.R.; Milner, M.N. The effects of positive and negative information on consumers’ willingness to ride in a driverless vehicle. Transp. Policy 2018, 72, 218–224. [Google Scholar] [CrossRef]
  80. Kolarova, V.; Steck, F.; Cyganski, R.; Trommer, S. Estimation of the value of time for automated driving using revealed and stated preference methods. Transp. Res. Procedia 2018, 31, 35–46. [Google Scholar] [CrossRef]
  81. de Almeida Correia, G.H.; Looff, E.; van Cranenburgh, S.; Snelder, M.; van Arem, B. On the impact of vehicle automation on the value of travel time while performing work and leisure activities in a car: Theoretical insights and results from a stated preference survey. Transp. Res. Part A Policy Pract. 2019, 119, 359–382. [Google Scholar] [CrossRef] [Green Version]
  82. Lavieri, P.S.; Bhat, C.R. Modeling individuals’ willingness to share trips with strangers in an autonomous vehicle future. Transp. Res. Part A Policy Pract. 2019, 124, 242–261. [Google Scholar] [CrossRef]
  83. Lécureux, B.; Kaddoura, I. Sensitivity of the urban transport system to the value of travel time savings for shared autonomous vehicles: A simulation study. Procedia Comput. Sci. 2021, 184, 686–691. [Google Scholar] [CrossRef]
  84. Molnar, L.J.; Ryan, L.H.; Pradhan, A.K. Understanding trust and acceptance of automated vehicles. An explora-tory simulator study of transfer of control between automated and manual driving. Transp. Res. Part F 2018, 58, 319–328. [Google Scholar] [CrossRef]
  85. Bosch, P.M.; Becker, F.; Becker, H.; Axhausen, K.W. Cost-based analysis of autonomous mobility services. Transp. Policy 2018, 64, 76–91. [Google Scholar] [CrossRef]
  86. Webb, J.; Wilson, C.; Kularatne, T. Will people accept shared autonomous electric vehicles? A survey before and after receipt of the costs and benefits. Econ. Anal. Policy 2019, 61, 118–135. [Google Scholar] [CrossRef]
  87. Pettigrew, S.; Dana, L.M.; Norman, R. Clusters of potential autonomous vehicles users according to propensity to use individual versus shared vehicles. Transp. Policy 2019, 76, 13–20. [Google Scholar] [CrossRef]
  88. Kyriakidis, M.; Happee, R.; de Winter, J.C.F. Public opinion on automated driving: Results of an international questionnaire among 5000 respondents. Transp. Res. Part F Traffic Psychol. Behav. 2015, 32, 127–140. [Google Scholar] [CrossRef]
  89. Bansal, P.; Kockelman, K.M.; Singh, A. Assessing public opinions of and interest in new vehicle technologies: An Austin perspective. Transp. Res. Part C Emerg. Technol. 2016, 67, 1–14. [Google Scholar] [CrossRef]
  90. Haboucha, C.J.; Ishaq, R.; Yoram, S. User preferences regarding autonomous vehicles. Transp. Res. Part C Emerg. Technol. 2017, 78, 37–49. [Google Scholar] [CrossRef]
  91. Acheampong, R.A.; Cugurullo, F. Capturing the behavioural determinants behind the adoption of autonomous ve-hicles: Conceptual frameworks and measurement models to predict public transport, sharing and ownership trends of self-driving cars. Transp. Res. Part F 2019, 62, 349–375. [Google Scholar] [CrossRef] [Green Version]
  92. Gkartzonikas, C.; Gkritza, K. What have we learned? A review of stated preference and choice studies on autono-mous vehicles. Transp. Res. Part C 2019, 98, 323–337. [Google Scholar] [CrossRef]
  93. Hulse, L.M.; Xie, H.; Galea, E.R. Perceptions of autonomous vehicle: Relationships with road users, risk, gender and age. Saf. Sci. 2018, 102, 1–13. [Google Scholar] [CrossRef]
Figure 1. AVs Adoption Factors.
Sustainability 14 06697 g001
Table 1. A list of abbreviations used in this study.
AbbreviationExplanation
ADASAdvanced Driver Assistance System
AVsAutomated Vehicles
CAVConnected and Automated Vehicles
DVsDriverless Vehicles
DSDriverless Shuttle
EVsElectric Vehicles
HVsHuman-driving Vehicles
LoSLevel of Service
PTPublic Transport
PRPerceived Risk
PSPerceived Safety
SEAVsShared Electric Autonomous Vehicles
SAVsShared Autonomous Vehicles
V2IVehicle to Infrastructure
VMTVehicle Meters Travelled
VoTValue of Time
WTPWillingness to Pay
WTRWillingness to Ride
Table 2. Critical problems and future directions.
Critical IssuesKnowledge GapsFuture Directions
Uncertainty on external experiment variables (automation, driving condition, and penetration level).
  • Previous research did not consider the automation level of AVs, especially level 4, thus biasing the estimation of adoption.
  • How driving conditions (urban, regional, and highway) can affect the level of adoption needs investigation.
  • The AVs’ penetration level and the relationship with human behaviour and the adoption level is not well understood.
Future research could leverage the benefits of virtual reality, which makes the experiments closer to reality. Combined with technology/automation prediction, the experiment can be implemented with the known automation and penetration levels, and then the estimation could be predicted more accurately in reference years.
Uncertainty on the transferability of results from online survey to real behaviour.
  • Previous research was mostly based on online surveys and face to face interviews, which may not represent real AVs driving behaviour.
Future research could conduct more naturalistic behaviour tests, such as monitoring heartbeat rate when interacting with different challenging driving conditions. These driving conditions could be emergency brakes when encountering passengers, changing lanes, and following cars.
Policy implementation and action plan
  • Although previous research focused on how policy intervention can affect public adoption of AVs, few researchers investigated the impact of shared service usage and ownership, thus impacting the whole transport landscape.
  • What does AV mean to the whole community? Few studies analyzed how the adoption of AVs could impact the community, such as the repurposing and redesigning of the urban setting.
Future research can analyze how regulation can impact the ownership, change of shared services, and the adoption level of AVs. The impact of policy intervention such as congestion charging for single occupied AVs could be explored.Future research could focus on the action plan, such as redesigning the function area in urban settings with the introduction of AVs. Some of the examples could be replacing on-street parking with a pick up and drop off area.
Uncertainty of EV related infrastructure impacts on autonomous electric vehicles
  • What does electric autonomous vehicle-related infrastructure demand look like in the future? Few studies look into the demand for electric AV infrastructure in the future, such as the location of charging stations and charging behaviour.
Future research could analyze the global trend on EVs by understanding technological advancement, the interdependency of electric power, and electric AV traffic. regarding the development of charging infrastructures and electric power stability. This will impact the adoption level of AVs because AVs will be most likely electric in the future.
Demand modelling of AVs at the network level
  • What does transport demand look like when AVs are gradually introduced? What percentage of trips are generated by AVs?
Future research could analyze the trip generation from AVs at the network level and identify the trip generation changes brought by AVs.
Publisher’s Note: MDPI stays neutral with regard to jurisdictional claims in published maps and institutional affiliations.

