Abstract
We performed a screening evaluation of the human health risk posed by nanocarbon materials at the lifecycle stages of manufacturing and the use of the solid carbon generated in hydrogen manufacture by methane decomposition. We first estimated the atmospheric emission volumes of the solid carbon produced by small-, medium-, and large-scale hydrogen manufacturing plants. We then estimated the atmospheric emission due to tire wear, which largely contributes to the emission of solid carbon usage. Next, we estimated the atmospheric concentration of solid carbon in an atmospheric simulation using the METI–LIS model, which estimates the atmospheric distribution of a pollutant’s concentration near methane decomposition factories. We also used the AIST–ADMER model that estimated the regional atmospheric distributions around central Tokyo, where the traffic volume is the highest nationally. Finally, we performed a screening evaluation of human health risk in the surrounding areas, considering the permissible exposure concentrations of solid carbon. Our study identified no risk concerns at small- and medium-scale factory locations equipped with high-efficiency particulate air (HEPA) filtration facilities. At large-scale factories installed with HEPA filters, these emissions likely remain within the factory site. Furthermore, we determined that emissions from tire wear pose no risk to human health. The surroundings of small- and medium-scale factory sites installed with HEPA filters posed no risk to human health.
1. Introduction
Processing technologies that decompose methane into hydrogen and solid carbon without emitting carbon dioxide are being developed, and are expected to contribute to the reduction in greenhouse gas emissions in the energy field [1,2,3]. However, hydrogen manufacturing by methane decomposition also produces solid carbon nanoparticles as a by-product [4,5,6,7]. Such solid nanocarbon materials are expected to be recovered, processed, and utilized, but their nanoscale sizes and long tubes and fibers [6,7] might trigger unique biological effects unknown in previous chemical substances. To introduce hydrogen manufacturing technologies by methane decomposition into society, the development of these technologies should be accompanied by timely safety evaluations of solid carbon.
Although legally binding regulatory values for nanocarbon materials have not yet been established in many countries, the permissible exposure concentrations of carbon nanotubes (CNTs) and carbon nanofibers (CNFs) have been stipulated by several institutions and organizations [8,9]. CNTs and CNFs are generally recognized as analogous to inhalable dust. Although there are no extant hazard analyses of solid carbon sourced from methane decomposition, the human health risks in the recovery, processing, and use of solid carbon should be evaluated based on the existing hazard data of CNTs and CNFs [10,11,12,13].
Some multimedia models have been developed to conduct an evaluation of the environmental mass distribution and concentrations of nanomaterials, such as SimpleBox4nano [14] and MendNano [15]. However, these models are not able to simulate the spatial distribution of atmospheric concentrations. Using these models, it is difficult to conduct a human health risk assessment of inhalant exposure to nanomaterials in the air.
To this end, we conduct a simulation of nanocarbon materials using existing atmospheric dispersion models such as METI–LIS [16] and AIST–ADMER [17], and evaluate the risk to human health posed by nanocarbon materials in the lifecycle stages of manufacture (methane decomposition) and use (see Figure 1).
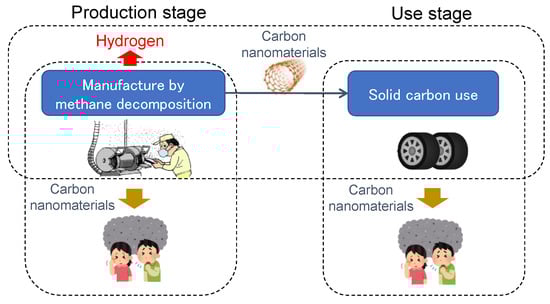
Figure 1.
Boundary of screening risk assessment of carbon nanomaterials.
The atmospheric transfer volume of nanocarbon sourced from the dispersion of particulate matter (treated as a powder) was estimated from the existing data. We estimated the atmospheric concentration of solid carbon in an atmospheric simulation, and thereby the exposure concentrations in the community surrounding the methane decomposition factory were estimated. We then performed a screening evaluation of human health risk in the surrounding areas, considering the permissible exposure concentrations of nanocarbon materials.
In addition, we considered the alternative use of this solid carbon, estimated the atmospheric transfer volume during the use of tires containing solid carbon composite materials, estimated the atmospheric concentration of solid carbon in the atmospheric simulation, and evaluated the health risks to humans in the surrounding area.
2. Materials and Methods
2.1. Emissions from Production
We conducted atmospheric dispersion analysis of solid carbon nanoparticles emitted from one methane decomposition factory at the manufacturing stage. The formula below shows the calculation method used for each stage of the life cycle, which calculated the emission quantity into the air:
where Em,i,air is air emission quantity (kg/y) of chemical m at life cycle stage i, Em,i,air is air emission factor (no measurement unit) of chemical m at life cycle stage i, re,m is extraction ratio (no measurement unit) of chemical m in postprocessing equipment e, and Qm,i is annual quantity of production or use (kg/y) of chemical m at life cycle stage i.
Em,i,air = Fm,i,air × (1 − re,m) × Qm,i,
Based on the existing literature on nanocarbon materials, we discussed the parameters in Equation (1) as follows:
First, in the work environment, dust emissions are likely to occur during soot recovery, weighing and packaging, and equipment maintenance and cleaning [18,19]. After monitoring the synthesizing, weighing, bagging, and distributing of multiwalled CNTs (MWCNTs) at a facility, Lee et al. [20] reported an airborne CNT concentration of 30–120 µg/m3. Furthermore, CNT concentrations reportedly increased during CNT container closure, transfer, and filter cleaning [21]. Keller et al. [22] estimated an atmospheric emission factor of 0.01–0.8% through on-site measurements at CNT manufacturing work sites. In the present study, we, thus, set the atmospheric emission factor not only to an intermediate value of 0.1%, but also to the maximum value of 0.8% as a worst-case scenario.
Next, emissions can be released into the general environment through exhaust ports. The emission volume from this source can be reduced by installing high-efficiency particulate air (HEPA) filters [21]. This type of air filter can, theoretically, remove at least 99.97% of airborne particles with a size of 0.3 µm [23].
The Ministry of the Environment in Japan has released guidelines for businesses regarding industrial nanomaterials [24], which recommend the use of filters capable of preventing environmental release in the exhaust components considering nanomaterial properties. Therefore, as the evaluation scenario, we set the presence/absence of a filter that prevents environmental release into the exhaust section by the method of air exchange control of the workplace. The extraction ratio was set to ≥99.97%, as the diameter specification of 0.3 µm responds to the worst-case scenario.
We also set three scales of the methane decomposition facility: small-scale manufacturing, medium-scale manufacturing, and large-scale manufacturing (with manufacturing volumes of solid carbon totaling 1000, 53,000, and 1,000,000 t/year, respectively). We set the emission scenarios, which were independent of each other (see Table 1), and simultaneously calculated the atmospheric emission volumes of solid carbon at the manufacturing stage from the manufacturing methane decomposition worksite using Equation (1).

Table 1.
Emissions of solid carbon by methane decomposition.
2.2. Emissions from Usage
The possible environmental emissions from alternative end uses of solid carbon were discussed as follows: First, the use of tires and general rubber can lead to carbon black replacement. The usage of tires is potentially large, while that of rubber is smaller. The emission volumes of solid carbon by tire wear and rubber usage should be greater and lesser, respectively. Second, the use of resins reinforced with pyrolytic carbon is emerging, but the amount of use and volume of emissions from these new materials should be less. Third, the use of solid carbon on road, concrete, and cement as reinforcement material for civil engineering structures is potentially great, although the volume of waste transfer should be much greater than the volume of emission into the environment. Emission by road wear should be lesser than that by tire wear.
The above results indicated that emissions into the atmosphere or soil due to tire wear during automotive travel may exceed those of other uses. Therefore, atmospheric emission of solid carbon due to tire wear was treated as the subject of the human health risk screening evaluation. We further assumed complete replacement of the demand for carbon black in domestic tires.
To estimate the domestic emissions volume of solid carbon into the atmosphere, we multiplied the atmospheric contribution of the tire wear rate of each vehicle type by the solid carbon content and the domestic travel volume. The data for the tire wear rates were obtained in a field survey of the Japan Environmental Sanitation Center [25]. The emission coefficients for the model input were set by unit conversion and are listed in Table 2.
Table 2.
Atmospheric emission volumes and emission coefficients due to tire wear.
2.3. Model Calculation
The solid carbon concentration near a methane decomposition factory was simulated in METI–LIS version 3.4.2, a Gaussian dispersion model that simulates particle matter emitted from the point sources of industrial facilities [16,28]. A yearly average atmospheric concentration can be estimated with this model when hourly meteorological datasets are prepared by the users [29].
First, we determined the physical properties of solid carbon (see Table 3 for the input values of the METI–LIS model). The molecular weight of solid carbon was set to 6 × 10⁶ g/mol of MWCNTs supplied by Basell Ltd., Houston, TX, USA [30]. Yeheskel et al. [7] indicated that solid carbon particles produced by solar thermolysis of methane are typically 5–10 µm long with an approximate internal diameter of 10 nm. Wei et al. [31] and Son et al. [32] reported that CNTs produced by methane cracking agglomerate into black granular particles. Dahm et al., 2015 [33], collected inhalable samples at fourteen sites of CNT and CNF manufacturers and users in the US, and found that the most common CNT structure counts were agglomerates in the 2–5 µm size, followed by sizes of 5–10 µm, >10 µm, <1 µm, and 1–2 µm.
Table 3.
Physical properties of solid carbon.
In the METI–LIS model, the effect of gravitational precipitation can be considered not less than 10 μm particles, and 2–4 classes of particle size range including no gravitational precipitation (<10 μm) can be set [34]. Therefore, by converting the data of counting ratio [33] to mass ratio, we set the particle diameters and mass ratios as follows: under 10 µm and 20 mass percent (w/w%); 10–50 µm and 80 w/w%. The particle shape, which also affects the gravitational precipitation, was set to cylindrical with an axial-to-length ratio of 4 and a resistance correction coefficient of 1.32 [34]. The bulk density of solid carbon was set to 40 kg/m3 [31].
The calculation conditions of the METI–LIS model were set as follows (see Table 4): The stack emission was set to the volume data (kg/h) in Table 1. The actual smokestack height was set to 5.0 m, because emissions into the air were assumed to be vented from the top of the building. The simulation area was the heavy industrial district in the area of the Seto Inland Sea of Western Japan, and the study period ranged from 1 January 2015 to 31 December 2015. The hourly meteorological datasets in this area in 2015 were used. Stack chip/down wash and increased buoyancy were ignored, because the exhaust gas dose was not emitted from a chimney outlet upward with high temperatures. The calculation point height was set to 1.5 m, the typical height of human respiration.
Table 4.
METI–LIS model calculation conditions.
When analyzing the atmospheric dispersion of solid carbon due to tire wear, we employed one of the Gaussian plume and puff formula atmospheric dispersion models called the Atmospheric Dispersion Model for Exposure and Risk Assessment (AIST–ADMER version 3.5), which can calculate the atmospheric concentration distributions of chemical substances emitted from nonpoint sources over a 5 × 5 km spatial grid averaged over one month to one year [17]. A yearly average distribution of chemical concentrations in a relatively wide region can be estimated with this model [29] when meteorological datasets of every four hours are prepared by the users.
The calculation conditions of the AIST–ADMER model were set as follows (see Table 5): To create a worst–case scenario, we set a 15 km2 grid around central Tokyo, where the traffic volume is the highest nationally, and obtained the 100 m grid data of traffic volume in 2005, the year of peak traffic volume. The meteorological datasets in central Tokyo in 2005 were used. The interior of the 5 × 5 km grid was divided into 100 m sided subgrids. We calculated the emission volume of each vehicle type by multiplying the 100 m grid traffic volume (weekday, gasoline/diesel) by the emission coefficient of the vehicle type. The exhaust height was set to 1 m considering the upward dust movement during travel.
Table 5.
AIST–ADMER model calculation conditions.
The ADMER model can estimate the particle deposition rate from the degradation rate, background concentration, dry deposition velocity, and scavenging ratio, which were set as input parameters [35]. The calculation was given as follows: Wet Deposition Rate (/s) = Scavenging Ratio × Rainfall Intensity (m/s)/Vertical Mixing Height (m). Given the carbon black wet deposition rate (1.64 × 10⁻⁵/s [36]) and assuming atmospheric stability class D (a mixed-layer height of 200 m) and a rainfall intensity of 2.7 × 10⁻⁷ m/s (based on the average rainfall rate of 0.958 mm/h) [36], the carbon black scavenging ratio was calculated as 1.23 × 10⁴. Because the wet deposition rate is lowest for particles of size 0.1–1 µm [37], the wet deposition rate of solid nanocarbon was assumed to be one order of magnitude higher than that of carbon black. The dry deposition rate was ignored in the model using the tire wear rate [25] of just the atmospheric contribution, which had already taken the dry deposition into consideration. The degradation rate was set to 0 /sec because no breakdown due to carbon was observed. Similarly, the background concentration was set to 0 µg/m3, because other generation sources were not considered.
2.4. Toxicity and Screening Assessment
The permissible exposure concentrations (mass concentrations) in work environments have been decided by multiple bodies, as shown in Table 6, but are not legally binding. The inhalant dust values in Table 6 were determined after removing large particulates (values that exclude large particles that do not reach the lungs; according to the ISO7708 definition, 4 μm particles are reduced by 50%) and considering exposure time, respiration rate, deposition rate in the lungs, and uncertainty of extrapolation from rats to human [8]. Most animal tests have been performed on aggregated particles, but Nakanishi [8] reported the results of animal tests on CNTs dispersed to some degree.
Table 6.
Permissible exposure concentrations to nanocarbon materials in work environments.
If we set the permissible CNT concentration in the work environment to 30 µg/m3 [8], the general environmental concentration threshold could be set to approximately 1 µg/m3 with an uncertainly factor of 10 to allow for individual differences and the conversion of exposure time from 8 h/d to 24 h/d. This threshold is the same as the recommended exposure limit (REL) set by the US National Institute for Occupational Safety and Health (NIOSH). The REL is set at the optimal limit of quantification of the analytical method carbon (NIOSH method 5040) recommended by NIOSH [9]. In the present study, the general environmental concentration threshold was set to approximately 1 µg/m3 as the limit of quantification in the air.
3. Result
3.1. Production Stage
Table 7 shows the result of the atmospheric dispersion analysis in the METI–LIS model of solid carbon produced by the methane decomposition factory. The maximum concentration of solid carbon in the air was eight times larger at an emission factor of 0.8% than at an emission factor of 0.1%. Without the HEPA filters, the maximum concentration of carbon emitted from all three factories exceeded the general environmental concentration threshold of 1 µg/m3. When filters were installed, the maximum concentrations of carbon emitted from the small- and medium-scale factories were below the threshold, but that from the large-scale factory exceeded the threshold.
Table 7.
Airborne concentrations of solid carbon emitted by the methane decomposition factories.
3.2. Use Stage
Table 8 shows the results of the atmospheric dispersion analysis by the AIST–ADMER model of solid carbon sourced from tire usages of different vehicle types. The maximum airborne concentration was less than 0.09 µg/m3. Panko et al. [38] collected roadside samples in Tokyo, and determined the average concentration of the tire and road wear particles as 0.095 µg/m3 using the same order as our calculation result. Clearly, the solid carbon concentrations emitted by the use of road tires did not exceed the general environmental threshold of 1 µg/m3. Passenger vehicles and general cargo trucks exhibited the highest contribution rates of emissions from tire usage.
Table 8.
Atmospheric concentrations of solid carbon emitted by tire wear.
4. Discussion
At the production stage of solid carbon, Figure 2 and Figure 3 show the results of the atmospheric dispersion analysis of solid carbon at emission factors of 0.1% and 0.8%, respectively. At small-, medium-, and large-scale factories installed without HEPA filters, the solid carbon concentrations exceeded the 1 µg/m3 general environmental threshold with an area exceeding 1 km of the smoke sources. On the other hand, at small- and medium-scale factories installed with HEPA filters, there was no area which exceeded the threshold. At large-scale factories, the solid carbon concentrations may have exceeded the 1 µg/m3 general environmental threshold within 200 m of the smoke sources.
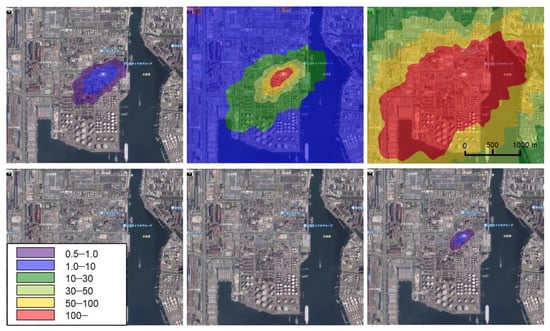
Figure 2.
Airborne concentration distributions of solid carbon emitted from methane decomposition factories. (Unit: µg/m3; emission factor: 0.1%. From left to right: small-scale, medium-scale, and large-scale factory locations. Top: no filter; bottom: with HEPA filter).
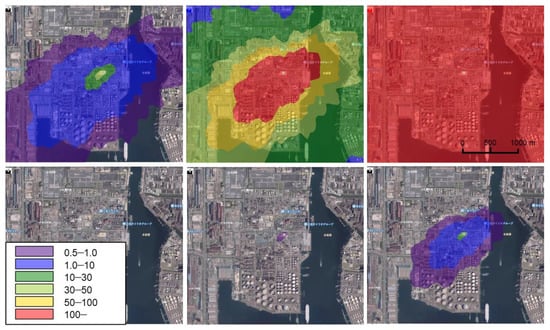
Figure 3.
Airborne concentration distributions of solid carbon emitted from methane decomposition factories. (Unit: µg/m3; emission factor: 0.1%. From left to right: small-scale, medium-scale, and large-scale factory locations. Top: no filter; bottom: with HEPA filter).
The screening evaluation based on these results identified no risk concerns at small- and medium-scale factory locations with HEPA filtration facilities. The likelihood of concentrations exceeding the threshold but remaining within the large-scale factory site could be estimated from Figure 2 and Figure 3. We determined that local exhaust countermeasures such as HEPA filtration equipment can sufficiently mitigate the health risk of solid carbon emissions.
The above result was obtained setting the molecular weight of MWCNTs (see Table 3). We also conducted a simulation setting the SWCNTs molecular weight of 3.4 × 10⁵ g/mol calculated by Kanto Chemical Co., Inc., Tokyo, Japan [39]. As a result, the maximum concentration of SWCNTs in the air and airborne concentration distribution were almost the same as those of MWCNTs. The parameters of particle diameter/mass ratio, resistance correction coefficient, and bulk density were set considering the agglomeration of CNTs; thus, SWCNTs and MWCNTs have the same parameter values, which led to the same result of airborne concentration.
At the usage stage of solid carbon, Figure 4 shows the spatial distributions of the mean airborne concentrations of solid carbon on weekdays emitted by all vehicle types, including passenger vehicles and general cargo trucks with large concentration contribution rates. Consequently, the concentrations were highest along the large trunk roads where passenger vehicles and general cargo trucks are typically found in large volumes; however, the solid carbon concentrations did not exceed the 1 µg/m3 general environmental threshold. We determined that solid carbon from tire usage posed no risk concerns to humans around central Tokyo.
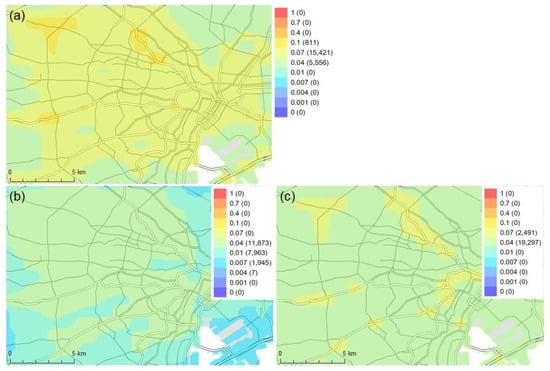
Figure 4.
Atmospheric concentration distribution of solid carbon due to tire wear by weekday traffic around central Tokyo. (Unit: µg/m3; (a): all vehicle types; (b): passenger vehicles; (c): general cargo trucks. Values in parentheses are the number of 100 m2 grids).
We also considered the emission of solid carbon from the recycling/recovery/disposal of end-of-life tires (ELTs) as follows: Reclaimed rubber produced from ELTs is used for, e.g., artificial turf, road paving material, etc., as material recycling. The emission volume of solid carbon contained in reclaimed rubber should be small, because the rubber remains on the ground. ELTs are used for boiler combustion or used in the cement and iron industries for thermal recovery. The emissions are negligible, because solid carbon is broken down at high temperature in industrial equipment. The emission of solid carbon after the final disposal of ELTs as industrial waste should be small under the appropriate control of landfill sites.
5. Conclusions
We performed a screening evaluation of the human health risk posed by nanocarbon materials at the lifecycle stages of the manufacturing and use of solid carbon generated in hydrogen manufacturing by methane decomposition. In an atmospheric dispersion simulation of methane decomposition factory sites in the METI–LIS model (a low-rise industrial source dispersion model), we found that the surroundings of small- and medium-scale factory sites installed with HEPA filters posed no risk to human health. Meanwhile, at large-scale factories, the emissions may have exceeded the general environmental threshold within 200 m of the smoke sources. However, these emissions likely remained within the factory site. We also simulated the atmospheric dispersion of solid carbon due to tire use over a wide district scale (using the AIST–ADMER model). We found no risks from tire use around the center of Tokyo, where the traffic volume is highest nationally.
In emission scenarios of solid carbon, we had to also assume the use of steel blast furnaces, which are large usage destinations of solid carbon that cannot be separated by catalysts. Both the risk assessment and lifecycle evaluation of these facilities were necessary, including greenhouse gas emissions from the iron and steel industries.
An exposure analysis of solid carbon requires a detailed examination of the input parameters pertaining to physical properties and transfer. Nanomaterial dispersions were analyzed with atmospheric dispersion models for general chemical substances, which cannot reproduce phenomena such as nanoparticle agglomeration. We expect that atmospheric chemistry experts and model developers will ameliorate this situation. Furthermore, when box models for nanomaterials are used, a re-examination by risk analysis is needed for human/biological phenomena and exposure pathways, because most of the solid carbon transfers to the soil and sediment. Future hazard evaluations of solid carbon require animal tests of the actual solid carbon generated from methane decomposition.
Author Contributions
Conceptualization, K.T.; methodology, K.T.; software, M.Y. and A.K.; validation, K.T, M.Y. and A.K.; formal analysis, K.T.; investigation, K.T.; resources, K.T.; data curation, M.Y. and A.K.; writing—original draft preparation, K.T.; writing—review and editing, K.T.; visualization, A.K.; supervision, K.T.; project administration, K.T.; funding acquisition, K.T. All authors have read and agreed to the published version of the manuscript.
Funding
This research was funded by the New Energy and Industrial Technology Development Organization (NEDO), Advancement of Hydrogen Technologies and Utilization Project, JPNP14021.
Institutional Review Board Statement
Not applicable.
Informed Consent Statement
Not applicable.
Data Availability Statement
The data presented in this study are available on request from the corresponding author.
Conflicts of Interest
The authors declare no conflict of interest.
References
- Abbas, H.F.; Daud, W.M.A.W. Hydrogen production by methane decomposition: A review. Int. J. Hydrogen Energy 2010, 35, 1160–1190. [Google Scholar] [CrossRef]
- Amin, A.M.; Croiset, E.; Epling, W. Review of methane catalytic cracking for hydrogen production. Int. J. Hydrogen Energy 2010, 36, 2904–2935. [Google Scholar] [CrossRef]
- Abánades, A.; Rubbia, C.; Salmieri, D. Technological challenges for industrial development of hydrogen production based on methane cracking. Energy 2012, 46, 359–363. [Google Scholar] [CrossRef]
- Zhou, L.; Enakonda, L.R.; Harb, M.; Saih, Y.; Aguilar-Tapia, A.; Ould-Chikh, S.; Hazemann, J.L.; Li, J.; Wei, N.; Gary, D.; et al. Fe catalysts for methane decomposition to produce hydrogen and carbon nano materials. Appl. Catal. B Environ. 2017, 208, 44–59. [Google Scholar] [CrossRef]
- Zhou, L.; Enakonda, L.R.; Li, S.; Gary, D.; Del-Gallo, P.; Mennemann, C.; Basset, J.M. Iron ore catalysts for methane decomposition to make CO x free hydrogen and carbon nano material. J. Taiwan Inst. Chem. Eng. 2018, 87, 54–63. [Google Scholar] [CrossRef]
- Pinilla, J.L.; Moliner, R.; Suelves, I.; Lazaro, M.J.; Echegoyen, Y.; Palasios, J.M. Production of hydrogen and carbon nanofibers by decomposition of methane using metal catalysts in a fluidized bed reactor. Int. J. Hydrogen Energy 2007, 32, 4821–4829. [Google Scholar] [CrossRef]
- Yeheskel, J.; Epstein, M. Thermolysis of methane in a solar reactor for mass-production of hydrogen and carbon nano-materials. Carbon 2011, 49, 4695–4703. [Google Scholar] [CrossRef]
- Nakanishi, J. (Ed.) Risk Assessment of Manufactured Nanomaterials—Carbon Nanotubes (CNT)—Final Report, Executive Summary, Research and Development of Nanoparticle Characterization Methods (P06041). Available online: https://riss.aist.go.jp/en/research-outcomes/339/ (accessed on 12 April 2022).
- NIOSH. Occupational Exposure to Carbon Nanotubes and Nanofibers. In Current Intelligence Bulletin; National Institute for Occupational Safety and Health: Washington, DC, USA, 2013; Volume 65. Available online: https://www.cdc.gov/niosh/docs/2013-145/pdfs/2013-145.pdf?id=10.26616/NIOSHPUB2013145 (accessed on 12 April 2022).
- Stone, V.; Hankin, S.; Aitken, R.; Aschberger, K.; Baun, A.; Christensen, F.; Fernandes, T.; Hansen, S.F.; Hartmann, N.B.; Hutchinson, G.; et al. Engineered Nanoparticles: Review of Health and Environmental Safety (ENRHES) 2009. Available online: https://www.safenano.org/media/109923/ENRHES-Final%20version.pdf (accessed on 12 April 2022).
- Pauluhn, J. Multi-walled carbon nanotubes (Baytubes): Approach for derivation of occupational exposure limit. Regul. Toxicol. Pharmacol. 2010, 57, 78–89. [Google Scholar] [CrossRef]
- Luizi, F. Responsible Care and Nanomaterials—Case Study Nanocyl. In Proceedings of the European Responsible Care Conference, Prague, Czech Republic, 21–23 October 2009. [Google Scholar]
- Aschberger, K.; Micheletti, C.; Sokull-Klüttgen, B.; Christensen, F.M. Analysis of currently available data for characterizing the risk of engineered nanomaterials to the environment and human health—Lessons learned from four case studies. Environ. Int. 2011, 37, 1143–1156. [Google Scholar] [CrossRef]
- Meesters, J.A.; Koelmans, A.A.; Quik, J.T.K.; Hendriks, A.J.; Meent, D.V.D. Multimedia modeling of engineered nanoparticles with SimpleBox4nano: Model definition and evaluation. Environ. Sci. Technol. 2014, 48, 5726–5736. [Google Scholar] [CrossRef]
- Liu, H.H.; Cohen, Y. Multimedia environmental distribution of engineered nanomaterials. Environ. Sci. Technol. 2014, 48, 3281–3292. [Google Scholar] [CrossRef]
- Kouchi, A.; Okabayashi, K.; Okamoto, S.; Yoshikado, H.; Yamamoto, S.; Kobayashi, K.; Ono, N.; Koizumi, M. Development of a low-rise industrial source dispersion model (METI-LIS model). Int. J. Environ. Pollut. 2004, 21, 325–338. [Google Scholar] [CrossRef]
- Higashino, H.; Kitabayashi, K.; Inoue, K.; Mita, K.; Yonezawa, Y. Development of an atmospheric dispersion model for exposure and risk assessment (AIST-ADMER). J. Jpn. Soc. Atmos. Environ. 2003, 38, 100–115. (In Japanese) [Google Scholar]
- Fujitani, Y.; Kobayashi, T.; Arashidani, K.; Kunugita, N.; Suemura, K. Measurement of the physical properties of aerosols in a fullerene factory for inhalation exposure assessment. J. Occup. Environ. Hyg. 2008, 5, 380–389. [Google Scholar] [CrossRef]
- Yeganeh, B.; Kull, C.M.; Hull, M.S.; Marr, L.C. Characterization of airborne particles during production of carbonaceous nanomaterials. Environ. Sci. Technol. 2008, 42, 4600–4606. [Google Scholar] [CrossRef]
- Lee, J.H.; Lee, S.-B.; Bae, G.N.; Jeon, K.S.; Yoon, J.U.; Ji, J.H.; Sung, J.H.; Lee, B.G.; Lee, J.H.; Yang, J.S.; et al. Exposure assessment of carbon nanotube manufacturing workplaces. Inhal. Toxicol. 2010, 22, 369–381. [Google Scholar] [CrossRef]
- Shinohara, N. (Ed.) Risk Assessment of Manufactured Nanomaterials—Fullerene (C60)—Final Report, Executive Summary, Research and Development of Nanoparticle Characterization Methods (P06041). Available online: https://riss.aist.go.jp/en/research-outcomes/339/ (accessed on 12 April 2022).
- Keller, A.A.; McFerran, S.; Lazareva, A.; Suh, S. Global life cycle releases of engineered nanomaterials. J. Nanoparticle Res. 2013, 15, 1692. [Google Scholar] [CrossRef]
- U.S. EPA. What Is a HEPA Filter? Available online: https://www.epa.gov/indoor-air-quality-iaq/what-hepa-filter-1 (accessed on 12 April 2022).
- Ministry of the Environment. Environmental Effect Prevention Guidelines Pertaining to Industrial Nanomaterials, March 2009 Nanomaterials Environmental Impact Basic Investigation Study Group. Available online: https://www.env.go.jp/chemi/nanomaterial/eibs-conf/guideline_0903_enab.pdf (accessed on 12 April 2022).
- Japan Environmental Sanitation Center. Report of Results of Contract Work Investigations of the MoE in 2005, Investigation of Pollution Contribution of Road Dust, etc., March 2006; Japan Environmental Sanitation Center: Kawasaki, Kanagawa, Japan, 2006. (In Japanese) [Google Scholar]
- The Japan Automobile Tyre Manufacturers Association, Inc. Tyre LCCO2 Calculation Guidelines Ver. 2.0; The Japan Automobile Tyre Manufacturers Association, Inc.: Tokyo, Japan, 2012; Available online: https://www.jatma.or.jp/english/tyrerecycling/pdf/lcco2guideline_en.pdf (accessed on 12 April 2022).
- Ministry of the Economy, Trade and Industry/Ministry of the Environment. Details of 2007 Estimation Method for PRTR Non-Reported Emissions. Available online: https://www.env.go.jp/chemi/prtr/result/todokedegaiH19/syosai.html (accessed on 12 April 2022). (In Japanese)
- Florea, A.; Lorint, C.; Danciu, C. Particulate matters generated by caprisoara tailing pond and their impact on air quality. Environ. Eng. Manag. J. 2019, 18, 803–810. [Google Scholar] [CrossRef]
- Khandadakar, M.; Moritomi, H. Modeling of atmospheric dispersion of mercury from coal–fired power plants in Japan. Atmos. Pollut. Res. 2012, 3, 226–237. [Google Scholar] [CrossRef][Green Version]
- Ruan, S.L.; Gao, P.; Yang, X.G.; Yu, T.X. Toughening high performance ultrahigh molecular weight polyethylene using multiwalled carbon nanotubes. Polymer 2003, 44, 5643–5654. [Google Scholar] [CrossRef]
- Wei, F.; Zhang, Q.; Qian, W.Z.; Yu, H.; Wang, Y.; Luo, G.H.; Xu, G.H.; Wang, D.Z. The mass production of carbon nanotubes using a nano-agglomerate. Powder Technol. 2008, 183, 10–20. [Google Scholar] [CrossRef]
- Son, S.Y.; Lee, Y.; Won, S.; Lee, D.H. High-quality multiwalled carbon nanotubes from catalytic decomposition of carboneous materials in gas-solid fluidized beds. Ind. Eng. Chem. Res. 2008, 47, 2166–2175. [Google Scholar] [CrossRef]
- Dahm, M.M.; Schubauer-Berigan, M.K.; Evans, D.E.; Birch, M.E.; Fernback, J.E.; Deddens, J.A. Carbon Nanotube and Nanofiber Exposure Assessments: An Analysis of 14 Site Visits. Ann. Occup. Hyg. 2015, 59, 705–723. [Google Scholar] [CrossRef]
- National Institute of Advanced Industrial Science and Technology. Technical Guidance for Detailed Risk Assessment, Part 3, February 2006. Available online: https://unit.aist.go.jp/riss/crm/mainmenu/tech_guidance03.pdf (accessed on 12 April 2022). (In Japanese)
- Lan, B.N.T.; Kobayashi, T.; Suetsugu, A.; Tian, X.; Kameya, T. Estimating the possibility of surface soil pollution with atmospheric lead deposits using the ADMER model. Sustainability 2018, 10, 720. [Google Scholar]
- Latha, K.M.; Badarinath, K.V.S.; Reddy, P.M. Scavenging efficiency of rainfall on black carbon aerosols over an urban environment. Atmos. Sci. Lett. 2005, 6, 148–151. [Google Scholar] [CrossRef]
- Andronache, C. Estimated variability of below-cloud aerosol removal by rainfall for observed aerosol size distributions. Atmos. Chem. Phys. 2003, 3, 131–143. [Google Scholar] [CrossRef]
- Panko, J.M.; Hitchcock, K.M.; Fuller, G.W.; Green, D. Evaluation of tire wear contribution to PM2.5 in urban environments. Atmosphere 2019, 10, 99. [Google Scholar] [CrossRef]
- Kanto Chemical Co., Inc. Single-Walled Carbon Nanotube. Available online: https://products.kanto.co.jp/products/siyaku/pdf/s_nanointegris_ODA-01.pdf (accessed on 24 May 2022). (In Japanese).


Publisher’s Note: MDPI stays neutral with regard to jurisdictional claims in published maps and institutional affiliations. |
© 2022 by the authors. Licensee MDPI, Basel, Switzerland. This article is an open access article distributed under the terms and conditions of the Creative Commons Attribution (CC BY) license (https://creativecommons.org/licenses/by/4.0/).