Abstract
Urban parks can offer a variety of ecosystem services such as beautifying the landscape, ecological regulation, leisure and recreation, and maintaining biodiversity. Understanding how urban parks affect people’s lives can help guide the construction and planning of parks in a direction that is more beneficial to the public. Therefore, it is worth studying the extent to which different urban parks with different characteristics affect public behaviour and preferences. This paper takes five typical urban parks in Chengdu and analyses the relationship between characteristics of the park ecosystem and public behaviour and preferences. The characteristics include the park scale, blue-green space ratio, plant diversity, and degree of re-wilding. Visit frequency, stay time, and park preference characterise public behaviour and preferences. The results show: (1) There are obvious differences in the ecosystem characteristics of the five parks: Qinglong Lake Wetland Park is the largest; the proportion of blue-green space in Jiangjiayiyuan Garden is the highest; the degree of re-wilding in Bailuwan Wetland Park is the highest; the proportion of green space and plant diversity in Guixi Ecological Park is the highest; and the proportion of blue space in Jincheng Lake Wetland Park is the highest. (2) There are differences in public behaviour and preferences for different parks. Tourists visit Qinglong Lake Wetland Park the most in spring and autumn and they choose Guixi Ecological Park instead in summer and winter. The public stays longer in Qinglong Lake Wetland Park and shorter in Jincheng Lake Wetland Park. (3) The scale of urban parks, the proportion of blue-green space, and the degree of re-wilding, especially the proportion of blue space, have a positive impact on the public’s evaluation and promote public visits. The results of the study could help improve public awareness of the relationship between park characteristics and ecological services and well-being.
1. Introduction
Urban parks are an important part of urban ecosystems and urban landscapes [1]. They serve ecological functions such as water conservation, climate regulation, environmental purification, and biodiversity maintenance. They can provide urban residents with scenery, leisure, exercise, entertainment, social networking, and other ecosystem services [2,3] that ensure urban ecological security and promote the sustainable development of human and natural systems [4]. Disturbed by different degrees of human activity, urban parks have dual attributes of both natural and artificial ecosystems. There are also great differences in the characteristics of different types of park ecosystems. Parks dominated by natural ecosystems are larger in scale, with high vegetation coverage and rich biodiversity [5], while parks dominated by artificial ecosystems are smaller in scale, with fragmented landscapes and more infrastructure [6].
Urban parks can affect people’s emotions and perceptions [7] and change public behaviour [8]. These effects may be associated with park features such as flowers [9], dense trees [10], and convenient leisure facilities [11]. Parks with the above characteristics are more popular among tourists. Natural landscapes are generally more attractive to the elderly, while young people prefer artificial facilities [12]. Most researchers study the influence of urban park characteristics on public behaviour through the relationship between spatial structure characteristics of parks and visitors’ behaviour. Greg et al. [13] used the public participatory geographic information system (PPGIS) to study the relationship between urban park types and public participation in sports activities. They found that linear parks provide the most significant overall physical benefit. Hou et al. [14] obtained data such as morning exercise types and space allocation using the behavioural annotation method. Long et al. [15] used space syntax theory to quantify the characteristics of urban spatial organisation, obtaining differential characteristics of walking and non-walking spaces and walking space preference in the elderly. They found that people tend to choose parks with high accessibility and large open spaces for morning exercises, especially those who use group dance as a morning exercise program. Research into the relationship between urban park characteristics and public preferences is based on public physiological and psychological indicators. Song et al. [16] measured tourists’ heart rates to obtain heart rate variability and tested the influence of urban parks on people’s minds and bodies through the semantic differential (SD), Profile of Mood States (POMS), and State-Trait Anxiety Inventory (STAI). This research shows that heart rate was significantly lower while walking in the urban park than in the city street. Furthermore, the urban park walk led to higher parasympathetic nervous activity and lower sympathetic nervous activity. Wu et al. [17] explored the influence of colour characteristics on tourists’ perception through 11 evaluation factors of the three spatial dimensions of the South Part of Minjiang Park. The factors included ambient color characteristics (coordination, color, richness, memory, and attractiveness) and tourist perception (comfort, pleasure, security, dullness, annoyance, and depression). Their results showed that factors correlated with tourist perception are all related to coordination. At present, research on ecosystem services of urban parks mainly adopts computer technology and network technology, including social media, geographic information technology, and modeling, as research methods [12,18,19]. They demonstrate that urban parks have an impact on the public and provide a theoretical basis for this study.
People are the main beneficiaries of urban parks. The comprehensive evaluation of physiology, psychology, and geographic information systems are used to obtain public behaviour trajectories. The differences in public behaviour and preferences among different parks can be revealed in this way but the relationship between park characteristic factors and the public is not intuitive. The current research aims to study the degree of influence of urban park characteristics on public behaviour and preferences and reveal which characteristic factor has which influence. It will make the construction of future urban parks better meet public needs; in this way, the government will improve the quality and quantity of urban parks. Urban parks are an important provider of ecosystem services [2,3,4], so they will enhance park ecosystem services and promote sustainable urban development. Therefore, this paper combines field research with participatory questionnaires (Appendix A) to identify the ecosystem characteristics of typical parks in Chengdu, reveal the differences in public behaviour and preferences for different types of parks, and explain the relationship between important characteristic factors and public behaviour. It also provides a scientific basis for park construction and management.
2. Materials and Methods
2.1. Study Area
Chengdu (102°54′ E~104°53′ E, 30°05′ N~31°26′ N) was the first place to propose the concept of the “Park City” in China. It is also the national demonstration area of China’s park cities, showing a rapid increase in the number and area of its parks [20]. This study selected five urban parks (Figure 1), namely Jincheng Lake Wetland Park, Qinglong Lake Wetland Park, Guixi Ecological Park, Bailuwan Wetland Park, and Jiangjiayiyuan Garden (Figure 1). The above parks are all parts of Chengdu Huancheng Ecological Park. The construction of Chengdu Huancheng Ecological Park is a project in progress. These five parks are relatively complete (Figure 2), while most others are still under construction. Their construction time, distance from the main urban area, infrastructure, and management levels are similar; however, the park scale, ecosystem composition and structure, and biodiversity are different. As the park conditions are similar or identical except for the few characteristics to be studied, they offer the representativeness and typicality needed for this research. Moreover, these five parks are the most popular in Chengdu, which is beneficial for sending out questionnaires.
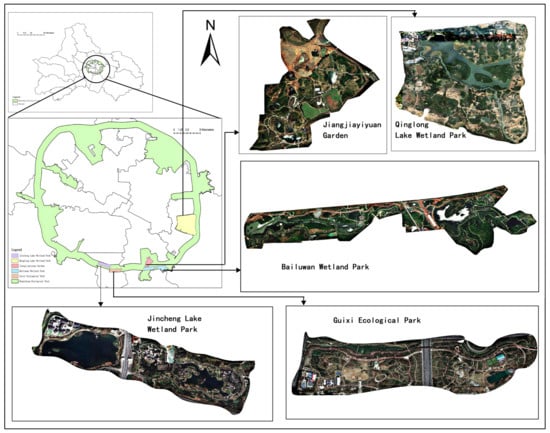
Figure 1.
Location of study area against the background of Chengdu Huancheng Ecological Park, Chengdu, China.
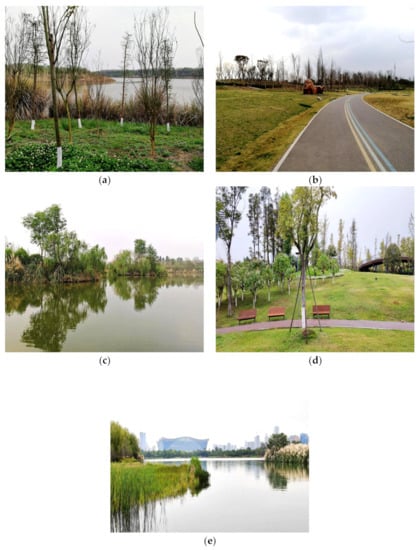
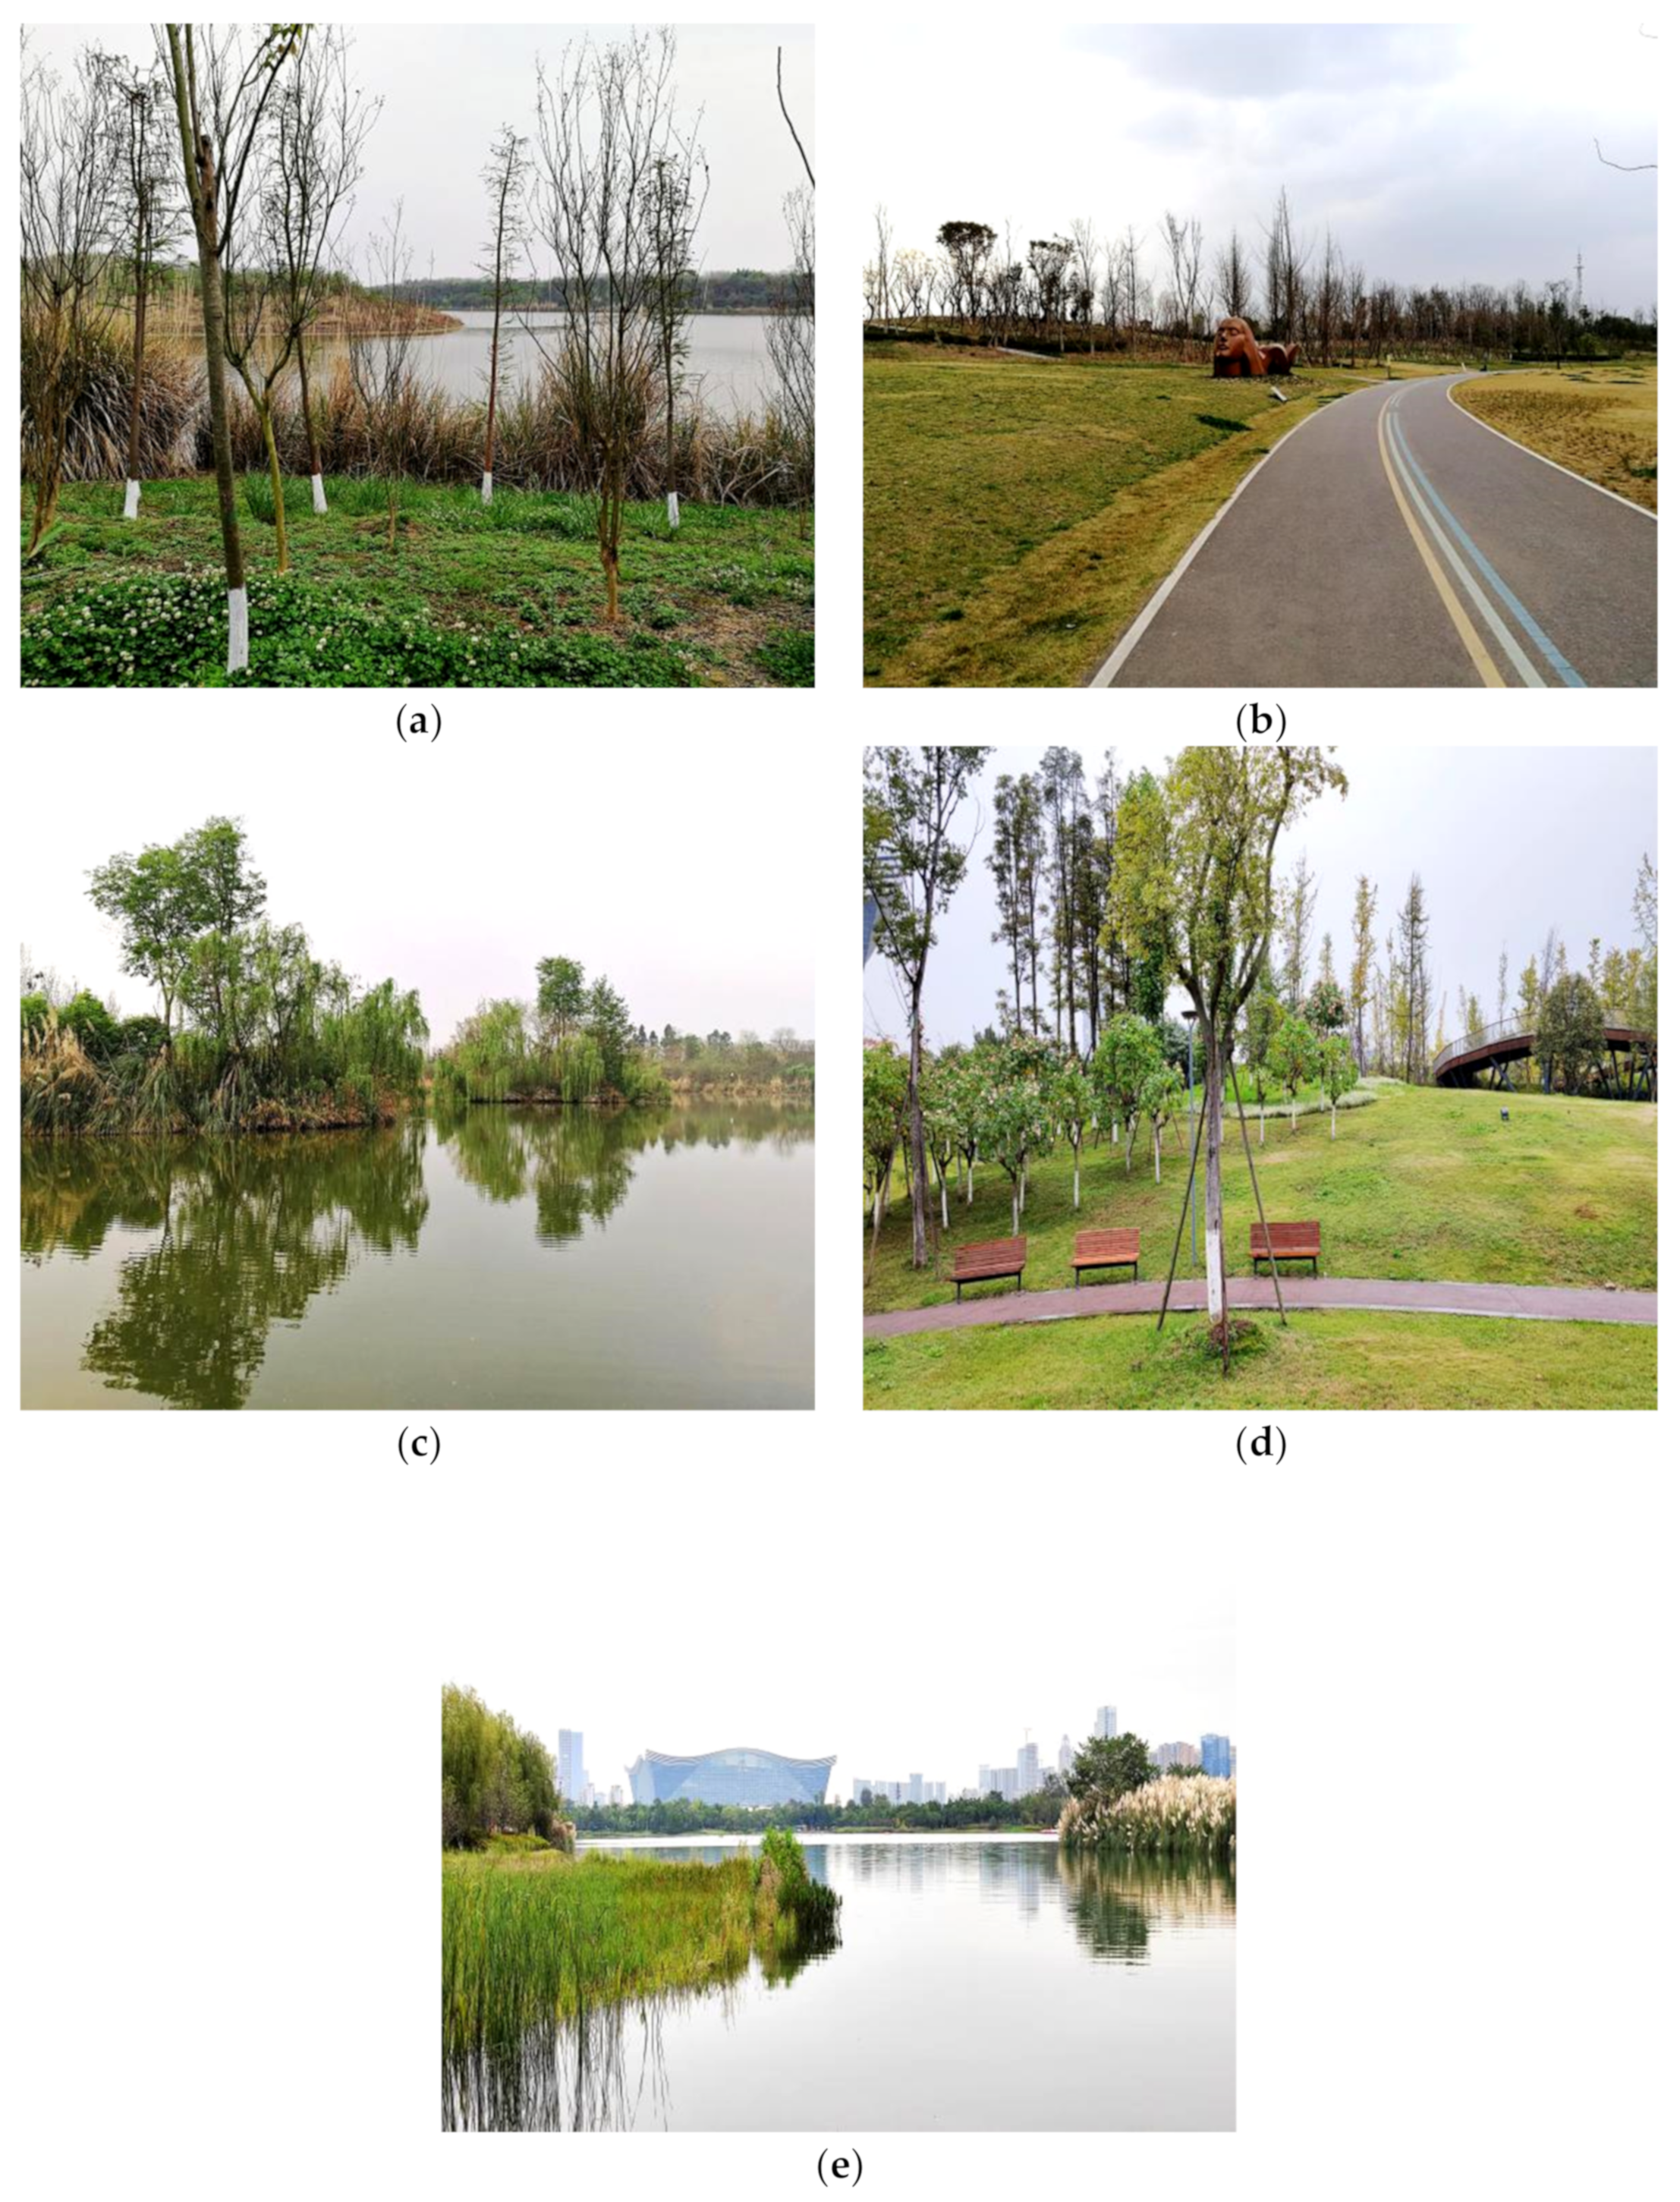
Figure 2.
Five research target parks (credit: Qin Liu). (a) Qinglong Lake Wetland Park; (b) Jiangjiayiyuan Garden; (c) Bailuwan Wetland Park; (d) Guixi Ecological Park (e) Jingcheng Lake Wetland Park.
2.2. Investigation and Analysis of Park Ecosystem Characteristics
Park characteristics are mainly divided into three categories: ecological characteristics, service characteristics, and aesthetic characteristics [21]. Usually, the diversity and spatial distribution of green plants have a greater impact on public behaviour and preferences [22]; therefore, this study analysed the characteristics of urban parks from the scale of the parks, their proportion of blue-green space [23], plant diversity [24], and degree of re-wilding [25]. This study used ArcGIS 10.8 software to obtain the total scale of the study area. The proportion of blue-green space was calculated based on land use data [26]. Green space was divided into “parks and green spaces”, “bushland”, “orchards”, “adjustable orchards”, “woodland”, “bamboo forest”, “other grassland”, “other woodland”, and “other gardens”. Blue space was divided into “dry canal”, “ditch”, “river surface”, “pond water surface”, “reservoir water surface”, and “aquaculture fish pond”. The area of land which belongs to the blue-green space was first calculated and then the obtained value was divided by the total area to obtain the proportion of blue-green space. Richness is used as an evaluation index of plant diversity [27]. The average and standard deviation can represent the level of diversity. In this study, a total of 37 quadrat surveys (10 × 10 m quadrat) were conducted in the five parks. The number of plant species in each quadrat was calculated, and the average and standard deviation were calculated among quadrats in each park. The area occupied by native plants [28] and the number of native species [29] are the keys to re-wilding; the degree of re-wilding was calculated using the following formula: The degree of re-wilding = the proportion of native plant distribution area × 0.5 + the proportion of native species × 0.5. The native plant land includes “bushland”, “woodland”, and “bamboo forest”. We calculated the area of native plant land and divided the obtained value by the green space area to obtain the proportion of native plant distribution area. Then, we counted the number of native species in each park and divided it by the number of all species in the same park to obtain the proportion of native species.
2.3. Participatory Questionnaire Survey and Analysis
From March to April 2021, a participatory questionnaire survey was carried out in the five city parks. A total of 400 questionnaires were sent out, and 377 valid completed questionnaires were collected, resulting in a response rate of 94.25%. The 377 questionnaires consisted of 160 from Qinglong Lake Wetland Park, 104 from Jiangjiayiyuan Garden, 40 from Bailuwan Wetland Park, 22 from Guixi Ecological Park, and 51 from Jincheng Lake Wetland Park. We arrived at the parks and stratified respondents by gender and age. Then, we had conversations with the respondents face to face and provided them with questionnaires which they returned as soon as they completed. In order to motivate people to participate in the survey, respondents who completed the questionnaires were each given a bottle of water.
This survey adopted stratified random sampling [30]. Stratified random sampling is to divide the units of the population into various categories according to specific standards, and then select samples from each category according to the random principle. The categories in this research included basic demographic information (gender, age, occupation, education, and accommodation), public behaviour (visit frequency and length of stay), and public preferences (behavioural activity preferences, landscape preferences, bio-aesthetic preferences, and functional value preferences). The research used a five-point Likert scale (from “1 = very dislike” to “5 = very much like”) [31] to assign scores to respondents’ preferences in a positive order. Besides this, a descriptive statistical analysis was carried out after summarising the results. According to the results, we calculated the average , standard deviation SD, coefficient of variation CV [32], and median M in order to study the differences in public preferences in different parks.
2.4. Data Analysis
This study used IBM SPSS Statistics (IBM SPSS Statistics for Windows. Version 26.0.0.0, IBM corp, Chicago, IL, USA, released 2019) to test the significance and undertake correlation analyses of the survey results. The public preferences (behavioural activity preferences, landscape preferences, bio-aesthetic preferences, and functional value preferences) of this survey were characterised and compared using a non-parametric test (e.g., Chi-square tests). A canonical correlation analysis (CCA) [33,34] was used to study the relationship between the independent variables (different park characteristics) and the dependent variables (public preferences).
3. Results
3.1. Differences in the Characteristics of Urban Park Ecosystems
The characteristic factors of different park ecosystems were different (Table 1). The area of Qinglong Lake Wetland Park was the largest (9.42 km2), while the area of Guixi Ecological Park was only 1.02 km2. In terms of the proportion of blue-green space in the park, the proportion of all five parks was more than 75%. The proportion of blue space in Jincheng Lake Wetland Park and Bailuwan Wetland Park was relatively high, while the proportion of green space in Jiangjiayiyuan Garden and Guixi Ecological Park was relatively high. There were also differences in plant diversity among the parks. The abundance of Guixi Ecological Park was the highest (11.00 ± 3.52), while the value of Qinglong Lake Wetland Park was relatively low (6.71 ± 2.50). The re-wilding degree of Bailuwan Wetland Park was the highest, reaching 0.61; the re-wilding degree of Jincheng Lake Wetland Park was the lowest, at only 0.33.

Table 1.
The Characteristics of Urban Park Ecosystems.
3.2. Analysis of Public Behaviour and Preferences
3.2.1. Public Demographic Information
The proportion of males and females among the respondents was 48.54% and 51.46%, respectively. The 21–40 age group accounted for the highest proportion, at 50.93%. The proportion of those with a bachelor’s degree or above was highest, at 37.67%, and the largest proportion of the population was employed, at 41.64%. A total of 61.01% of the respondents lived in the central city of Chengdu (see Appendix B Table A1).
3.2.2. Analysis of Public Behaviour
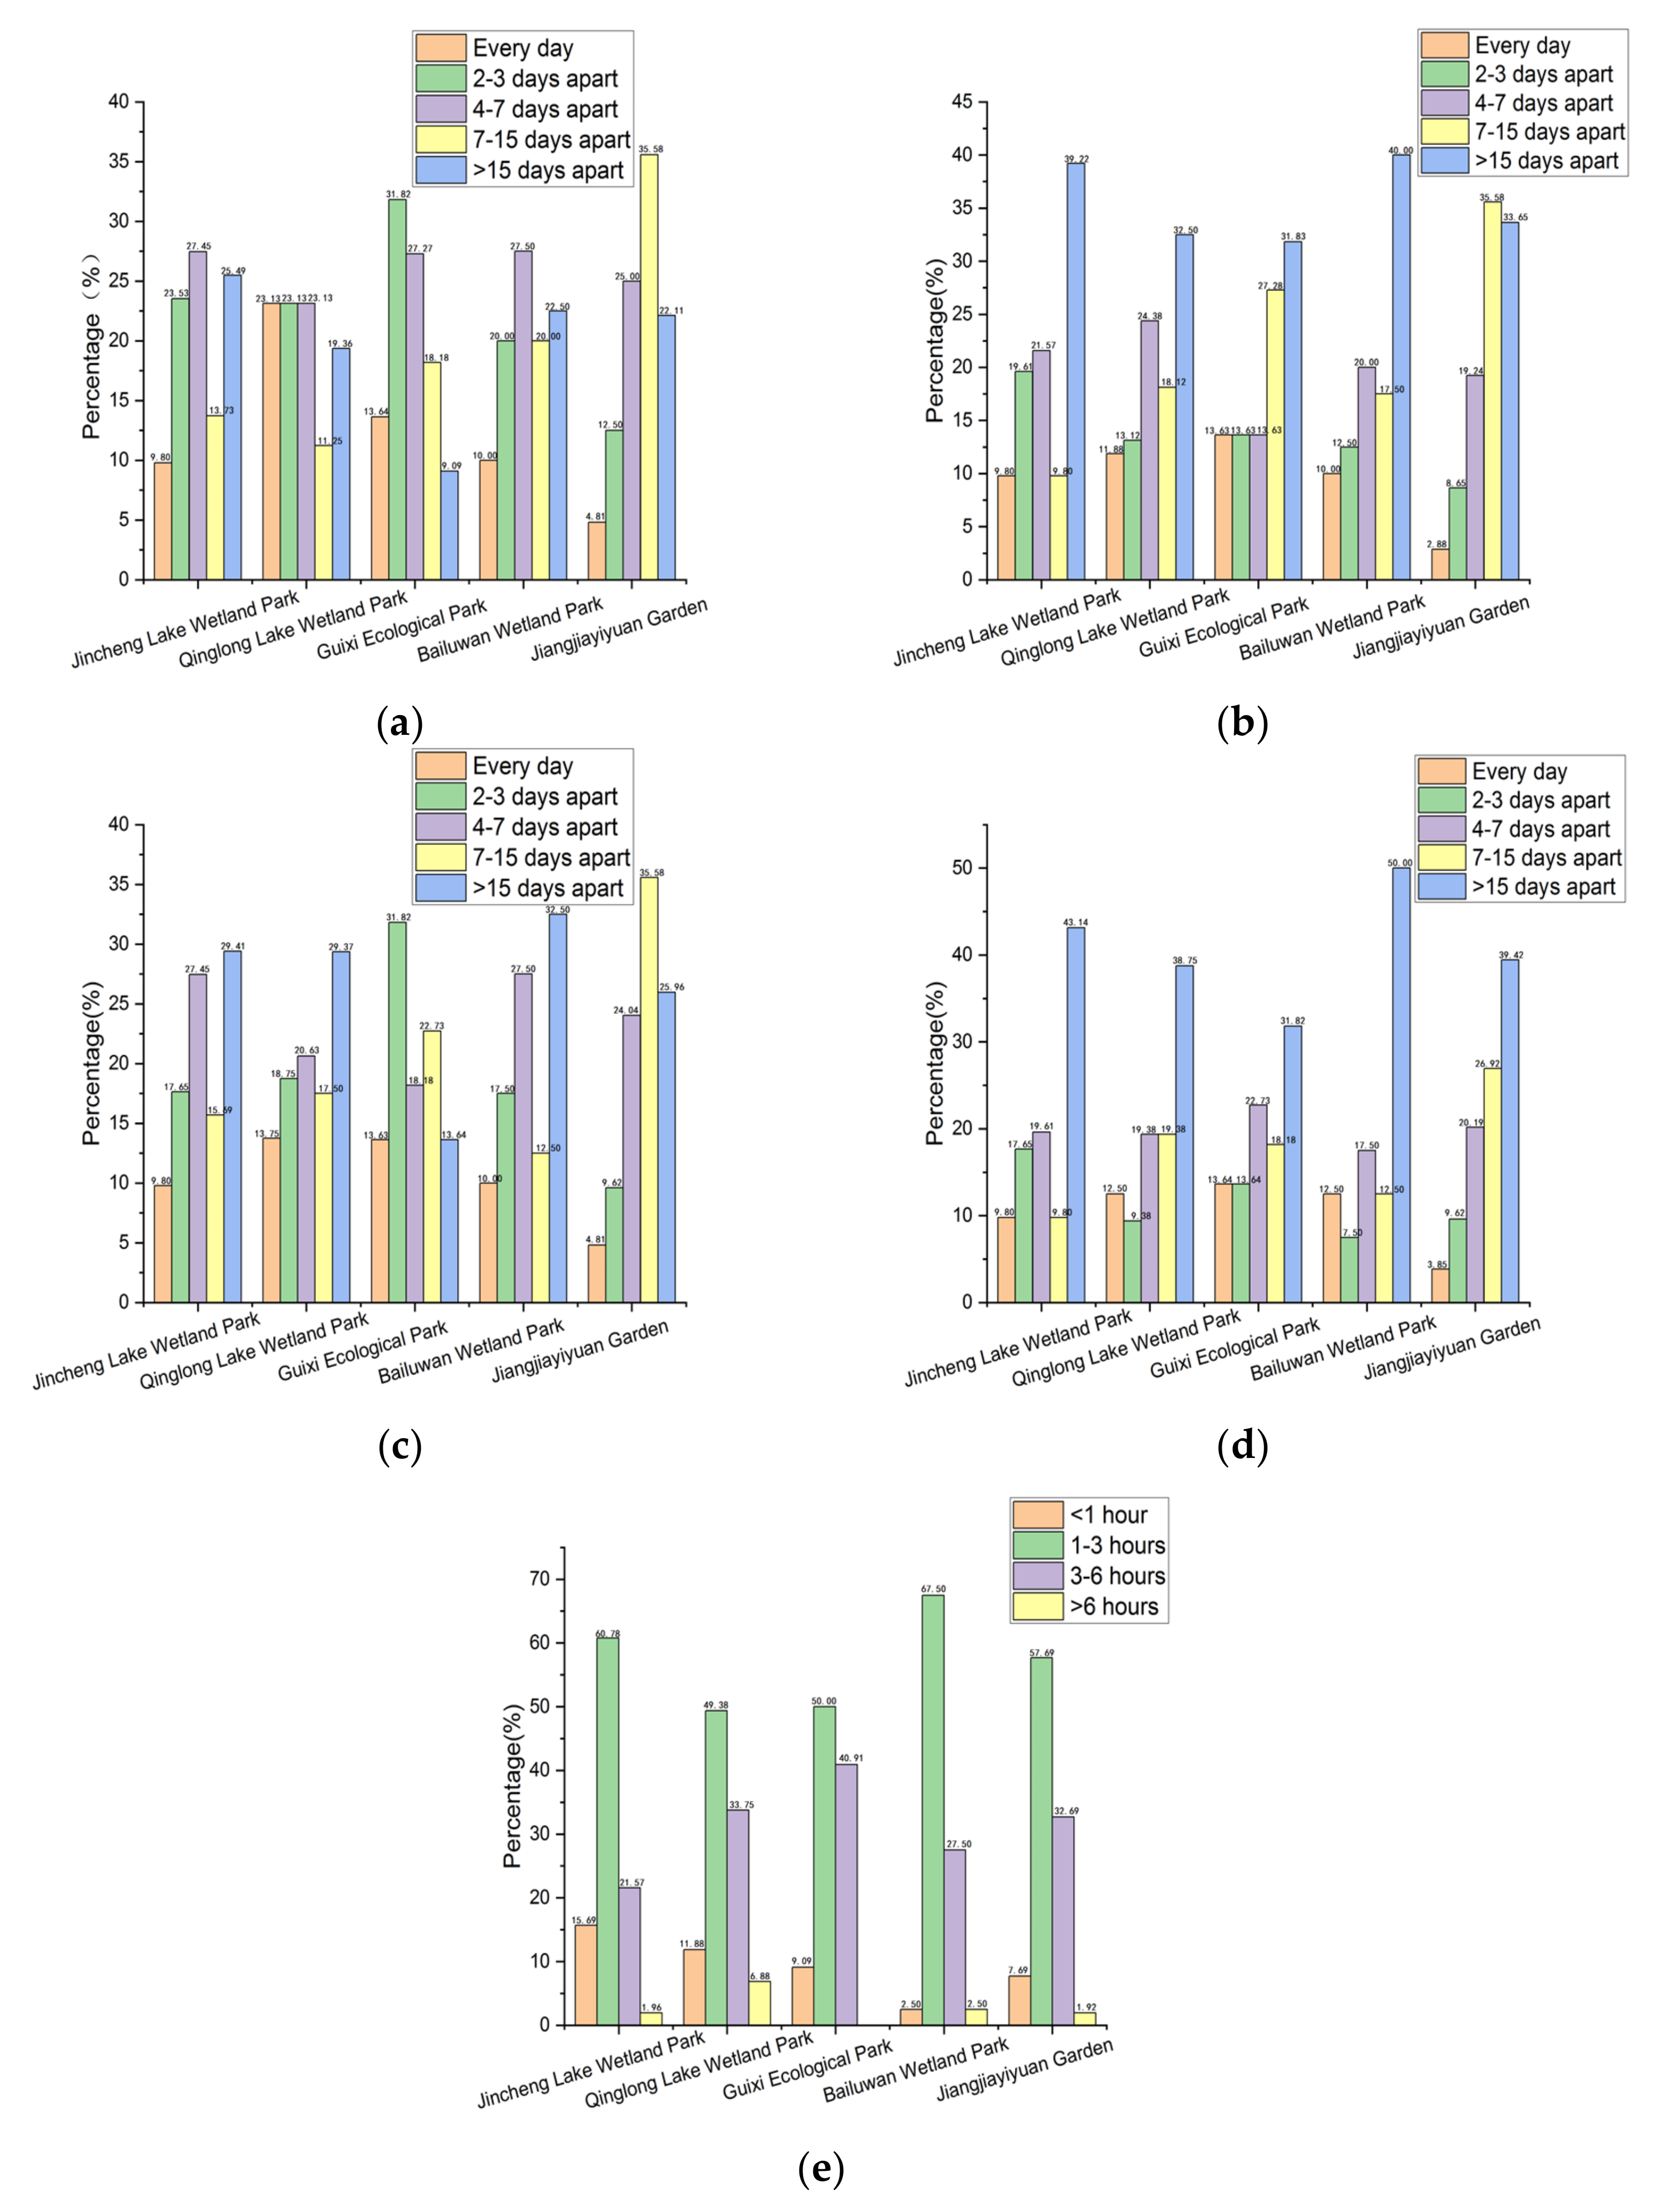
There was little difference in the frequency of public visits and the length of stay among the five study areas. The respondents tended to visit the park in spring and autumn and the length of stay was generally 1–6 h. In spring and summer, the proportion of visitors who travelled to the study area with more than a 15-day interval between visits accounted for 19.63% and 35.28%, respectively, while the proportion in autumn and winter was 26.26% and 40.59%, respectively (Figure 3). Qinglong Lake Wetland Park accounted for 23.13% and 13.75% of the daily visits to the park in spring and autumn, respectively. In summer and winter, Guixi Ecological Park accounted for 13.63% and 13.64%, respectively (Figure 3). Visitors who stayed for 1–3 h accounted for most of the visits, at 56.76%, and visitors who stayed for more than 6 h accounted for the least, at 2.65% (Figure 3). A total of 6.88% of the respondents stayed in Qinglong Lake Wetland Park for more than 6 h, while 15.69% of visitors stayed in Jincheng Lake Wetland Park for less than 1 h (Figure 3).

Figure 3.
Visit Frequency and Length of Stay. Frequency of visits to the five parks in (a) spring; (b) summer; (c) autumn; (d) winter; (e) Length of stay in the five parks.
3.2.3. Analysis of Public Preferences
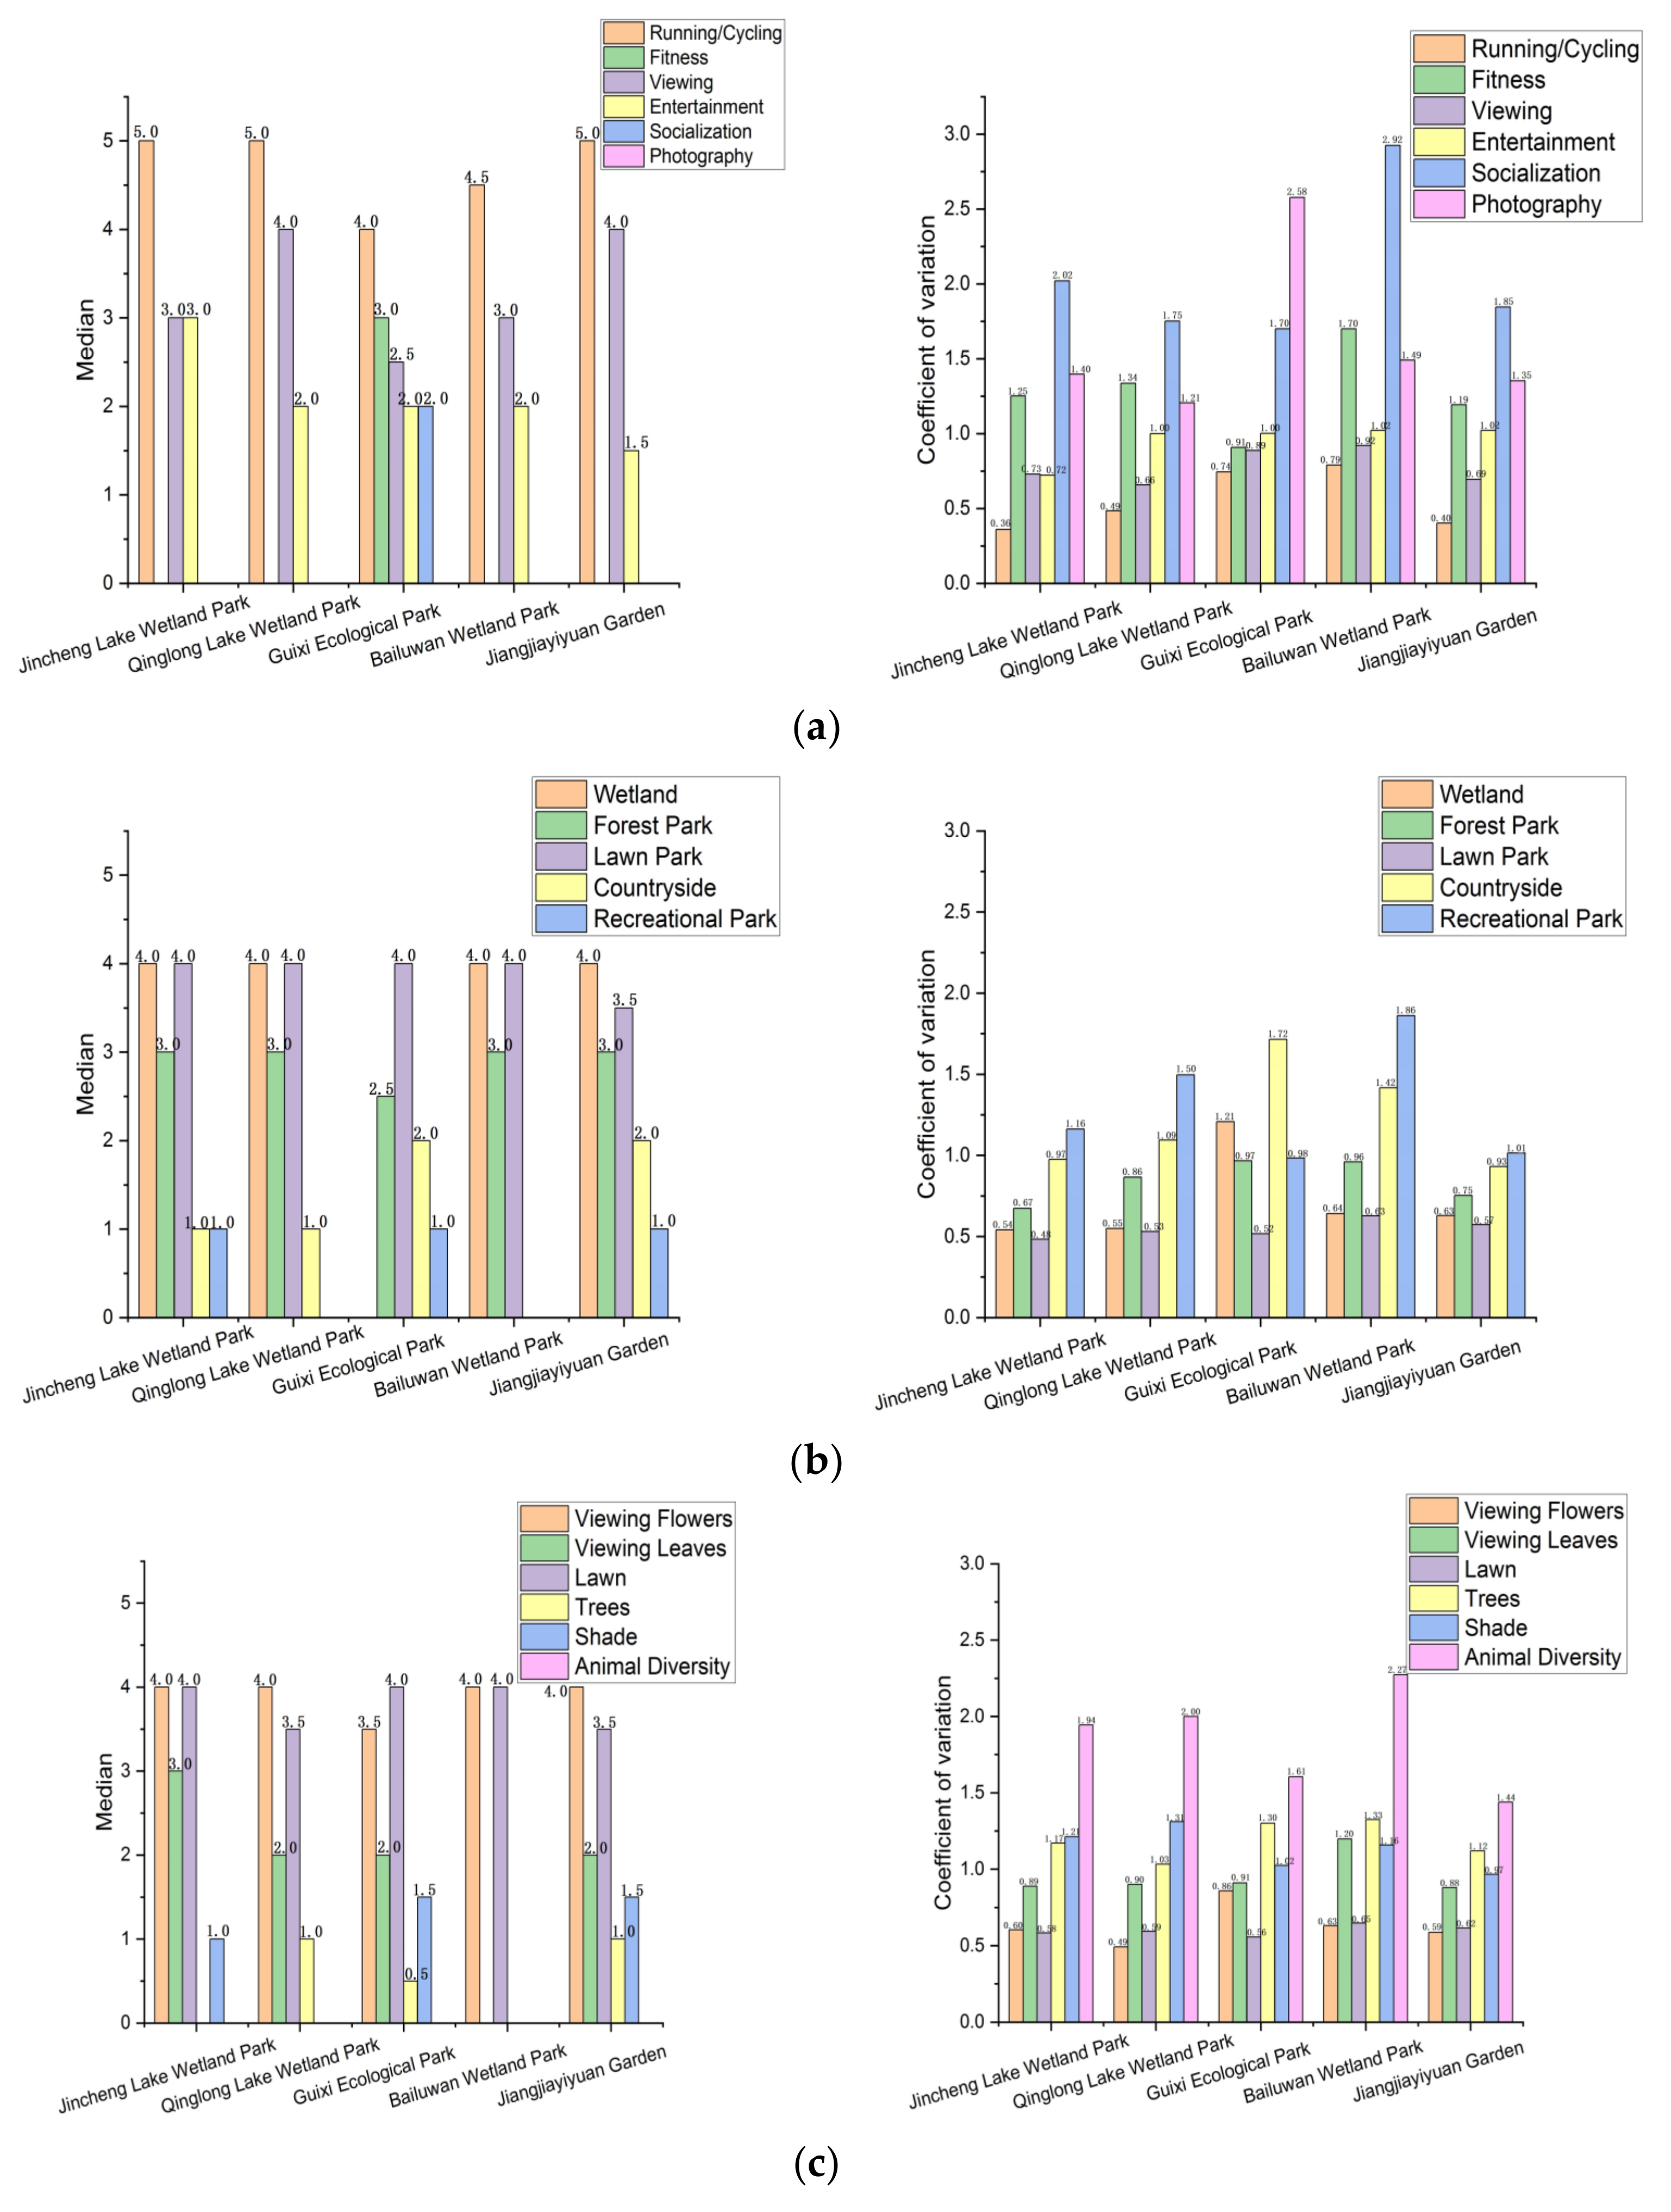
By calculating the medians and coefficients of variation of all visitors’ preferences, which were divided into “behavioural activity preferences”, “landscape preferences”, “bio-aesthetic preferences”, and “functional value preferences” (Figure 4), the visiting motivation and preferences of the respondents could be studied. The medians of behavioural activity preferences were lowest for “Socialisation” in Jincheng Lake Wetland Park, Qinglong Lake Wetland Park, Bailuwan Wetland Park, and Jiangjiayiyuan Garden and the coefficients of variation were highest; however, in Guixi Ecological Park it was “Photography”. In terms of landscape preferences, the median of “Recreational Park” was lowest and the coefficient of variation was highest in Jincheng Lake Wetland Park, Qinglong Lake Wetland Park, Bailuwan Wetland Park, and Jiangjiayiyuan Garden. In Guixi Ecological Park, the lowest median was for “Wetland”, and “Countryside” had the highest coefficient of variation. The five parks had the highest median score and the lowest coefficient of variation for visitors’ bio-aesthetic preferences in “Viewing Flowers” or “Lawn”. The medians of “Animal Diversity” in the five parks were the lowest and the coefficients of variation were the highest. The medians of “Landscaping” or “Protecting Environment” were the highest of the functional value preferences in Jincheng Lake Wetland Park, Qinglong Lake Wetland Park, Bailuwan Wetland Park, and Jiangjiayiyuan Garden and their coefficients of variation were the lowest. The median of “Enhancing City Image” was the lowest and the coefficient of variation was highest in Jincheng Lake Wetland Park, Qinglong Lake Wetland Park, Guixi Ecological Park, and Jiangjiayiyuan Garden. There are certain differences in public preferences between Guixi Ecological Park and the other four parks.
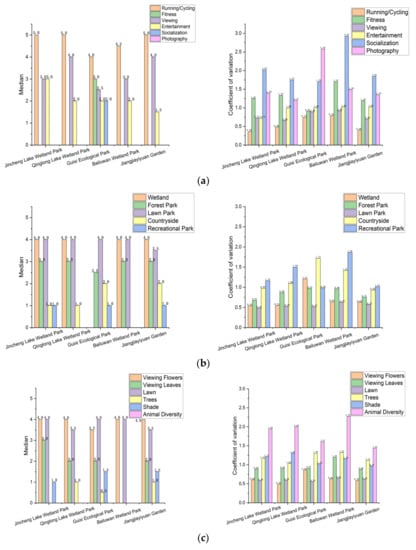
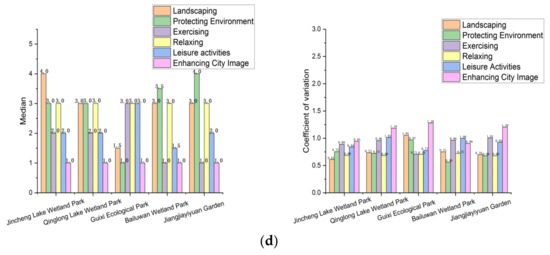
Figure 4.
The medians and coefficients of variation of visitors’ preferences in the five study areas for (a) “behavioural activity preferences”; (b) “landscape preferences”; (c) “bio-aesthetic preferences”; and (d) “functional value preferences”.
In this study, Chi-square tests were performed on visitors’ scores for “Behavioural Activity Preferences”, “Landscape Preferences”, “Bio-aesthetic Preferences”, and “Functional Value Preferences” in the five study areas. “Socialisation”, “Recreational Parks”, “Animal Diversity”, and “Enhancing City Image” were the categories most affected by different parks, while “Viewing”, “Lawn Park”, “Lawn”, and “Relaxing” were the least affected (Table 2). This result illustrated that differences in public preferences were affected by park characteristics. The greater the coefficient of variation, the higher the level of influence.
Table 2.
Differences in Public Preferences on Behavioural Activity, Landscape, Bio-aesthetic, and Functional Value Preferences.
3.3. Correlation Analysis
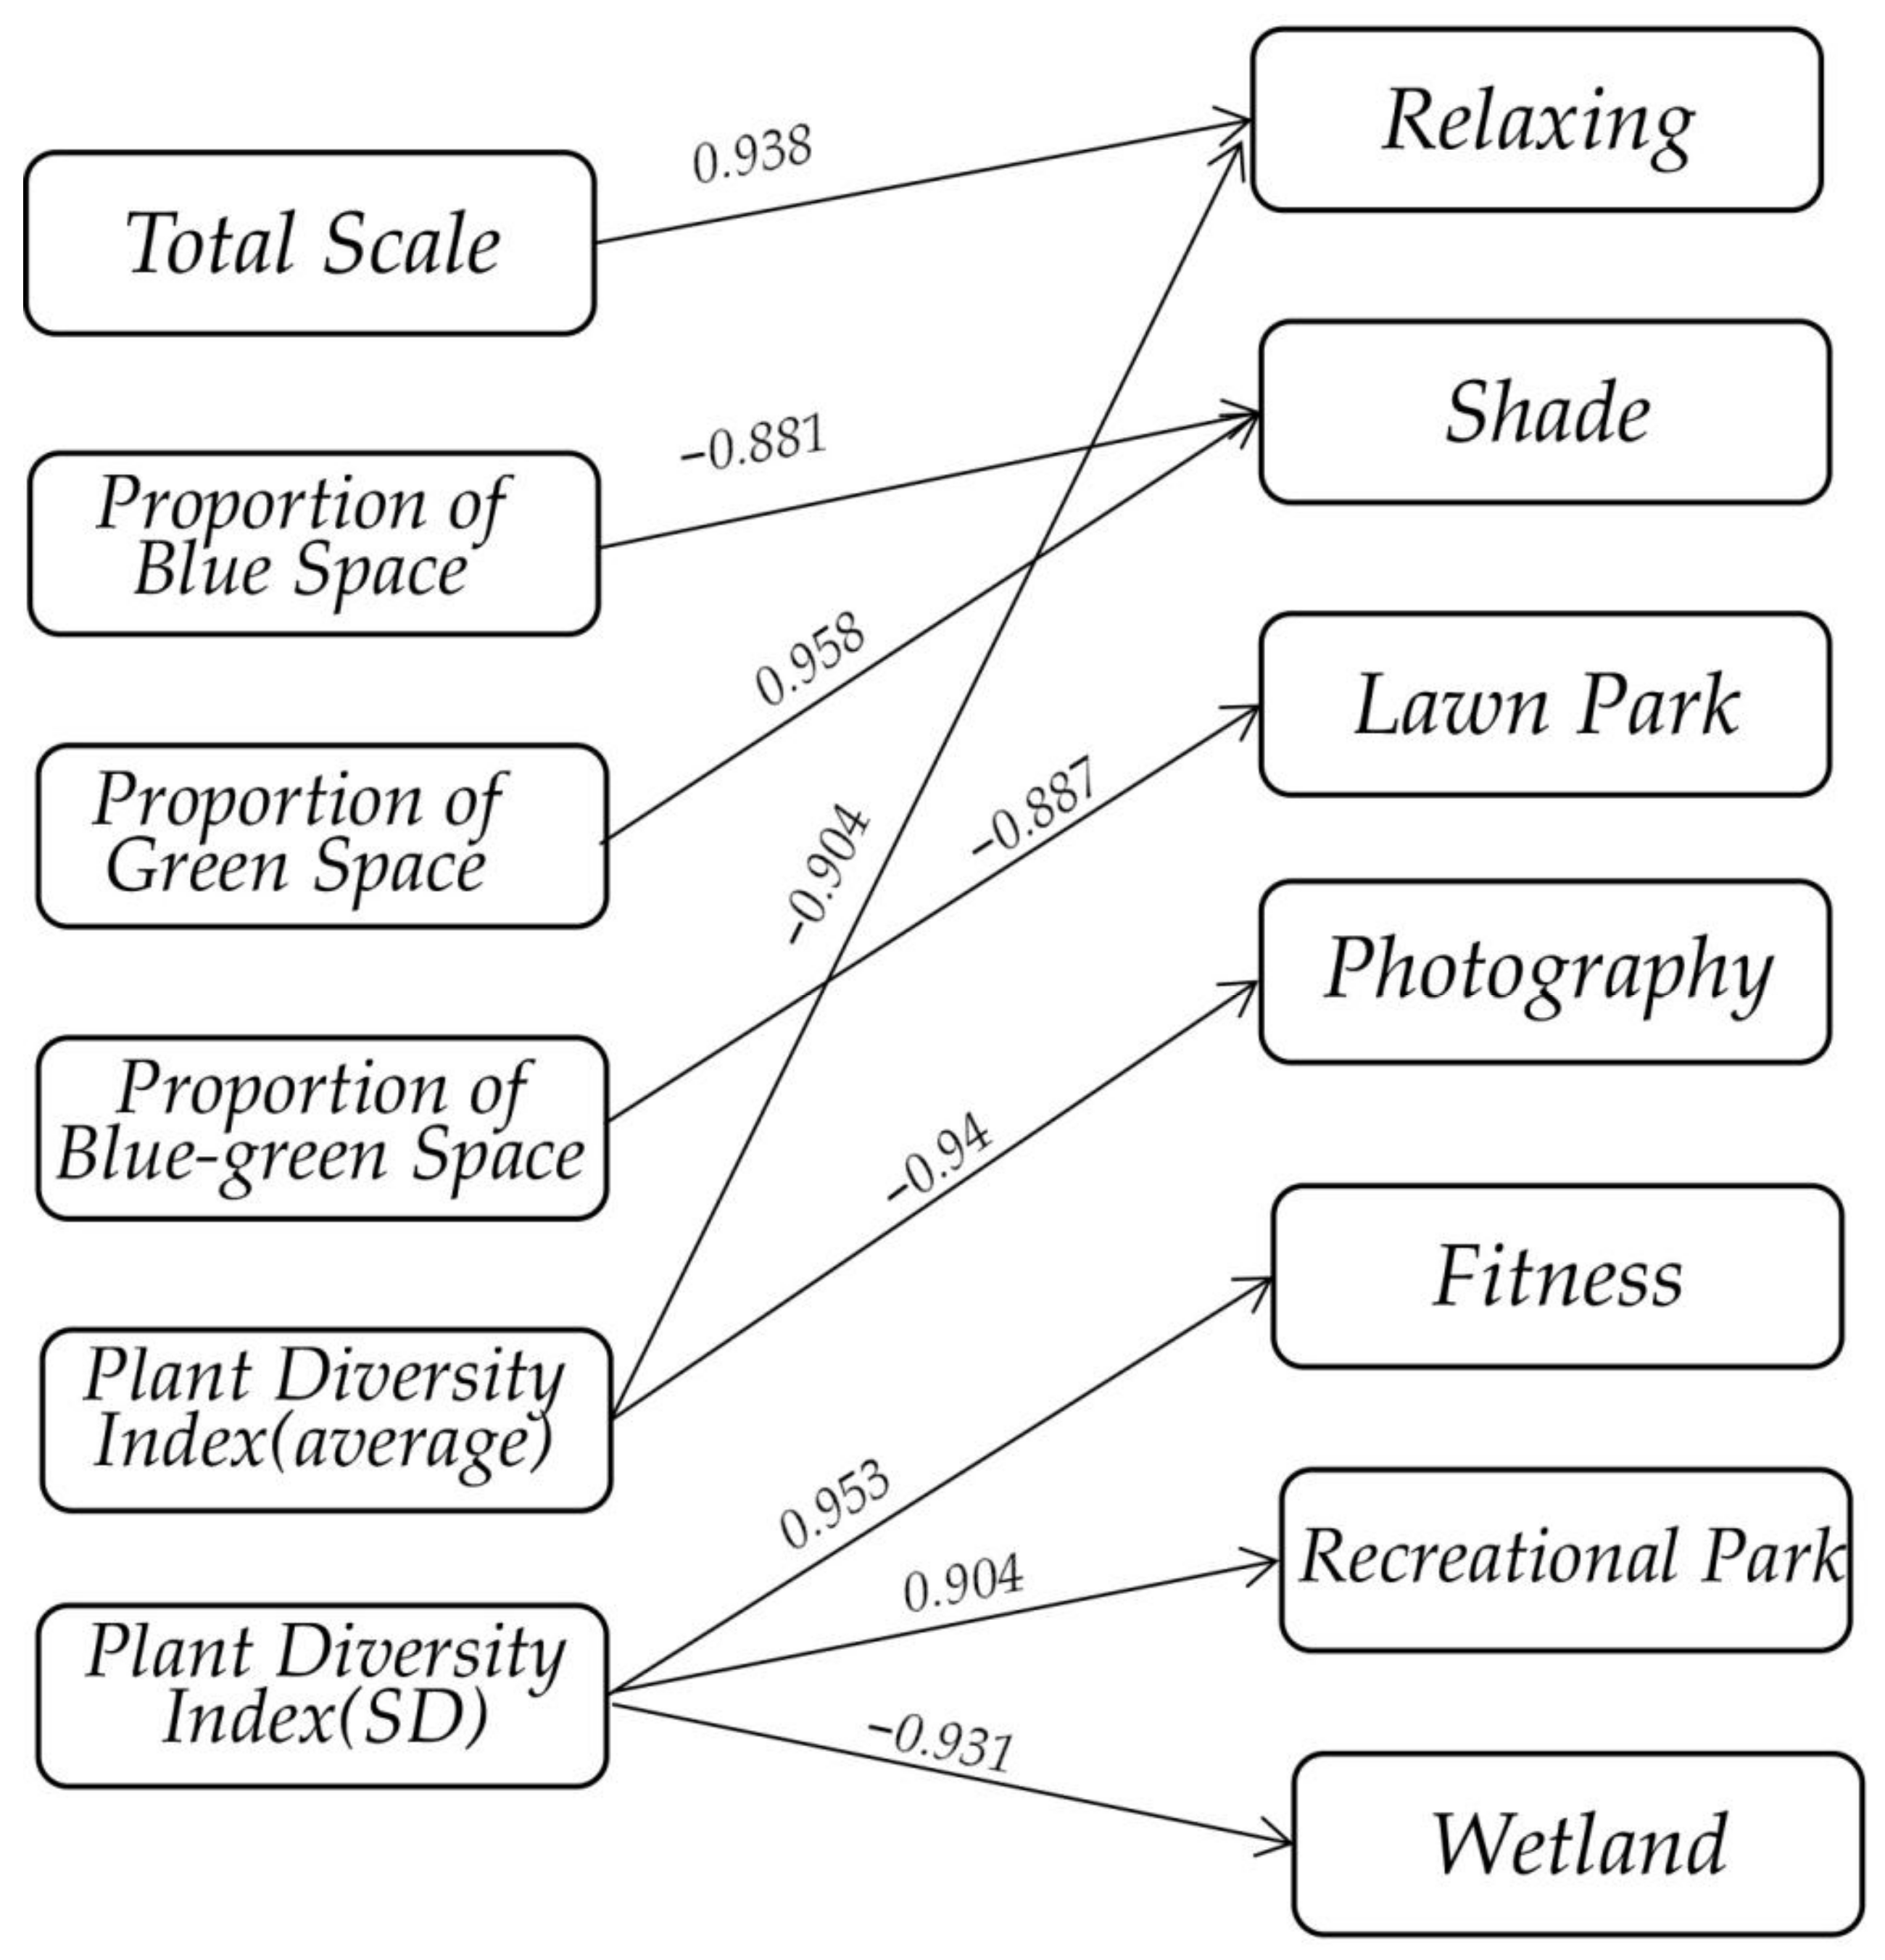
The parks’ characteristic factors are closely related to some public preferences and less related to others (Table 3). The public’s evaluation of “Shade” was negatively correlated with the proportion of blue space in the park (r = −0.881, p = 0.048 < 0.05) and positively correlated with the proportion of green space (r = 0.958, p = 0.01 < 0.05). The public believed that the larger the total scale of urban parks, the stronger the function of regulating relaxation (r = 0.938, p = 0.018 < 0.05). Besides this, they believed that the richer the biodiversity, the less conducive to relaxation (r = −0.904, p = 0.035 < 0.05). Rich biodiversity led to a decrease in visitors’ interest in taking pictures (r = −0.94, p = 0.017 < 0.05), while the greater the difference in the biodiversity, the more visitors preferred fitness (r = 0.953, p = 0.012 < 0.05) and visiting recreational parks (r = 0.904, p = 0.035 < 0.05). The wetland area’s correlation was smaller (r = −0.931, p = 0.022 < 0.05) under these circumstances. A park with a higher proportion of blue-green space had a worse public evaluation of lawn parks (r = −0.887, p = 0.045 < 0.05) (Figure 5). The correlations between other public preferences and park characteristic factors were insignificant, indicating a loose relationship.
Table 3.
Canonical correlation analysis of park characteristics and public preferences.

Figure 5.
Correlations between park characteristics and public preferences which are significant at the 0.05 level (p < 0.05).
4. Discussion
The results show that the frequency of visitors visiting five different types of urban parks varied by season. Extreme weather is more likely in both summer and winter and will affect public visits to urban parks; therefore, in order to control for the impact of climate variables when studying the effect of park characteristics on the frequency of public visits, the results in spring were compared with those in autumn, and the results in summer were compared with those in winter. The results show that visitors visit more frequently in spring and summer than in autumn and winter, indicating that plant growth promotes public visits to urban parks [35]. Some studies have shown that excessive vegetation can make tourists feel insecure because it may provide hiding spaces. Whether visitors have negative feelings about dense vegetation may depend on the level of safety in the area where the park is located [36,37]. The motivations of people visiting the parks are relatively similar. Walking, running, cycling, and other physical activities, as well as viewing the scenery, are the main reasons the public visit these five urban parks. Lawns and flowers are the most popular urban park landscapes, while wetlands and lawn parks are the most popular forms of urban park space utilisation among visitors. This survey has raised public awareness of the high-level value of urban parks (such as beautifying and protecting the ecological environment or relaxing) which will help urban park managers to further build and plan spaces that are beneficial to urban populations.
The findings also highlight the differences among urban parks and the different effects of urban park characteristics on public perception and behaviour. Although Qinglong Lake Wetland Park occupies the smallest proportion of blue-green space, its area of blue-green space is the largest because of its largest total scale. According to the results of canonical correlation analysis, visitors can relax more in larger parks, indicating that the overall scale of urban parks has a positive effect on public perception and behaviour. Research in Chongqing, China, shows that several small parks promote urban park equity, while large urban parks are conducive to improving quality [38]. In general, the area of blue-green space and the number of biological species increases with the park area, which can provide better ecosystem services; thus, visitors prefer large parks. Guixi Ecological Park occupies the smallest proportion of blue space, with high plant diversity but a low degree of re-wilding. It lacks wetlands which are popular with visitors, so few people associate Guixi Ecological Park with the function of beautifying and protecting the ecological environment. The blue space in Jincheng Lake Wetland Park accounts for the largest proportion and the rest of its features are similar to Guixi Ecological Park. Many visitors believe that its role in beautifying the environment is obvious, indicating that the blue space has a high ornamental value from the perspective of public perception. In addition, people prefer blue spaces, valuing them more than green spaces in Beijing, China. Thus, citizens are more willing to pay for cultural ecosystem services associated with blue space [39]. People are more likely to use the functions of blue space, such as having picnics along rivers or lakes, fishing, and having a boat trip. Therefore, the blue areas are more highly valued. However, the shading function of parks has a close positive relationship with the proportion of green space [40]. The increase in the proportion of blue space leads to a decrease in the proportion of green space and the function of shading decreases.
Bailuwan Wetland Park has the highest degree of re-wilding and Jiangjiayiyuan Garden has the highest proportion of blue-green space. Most visitors in the two places think that their role in protecting the ecological environment is significant (Table 3), indicating that the degree of re-wilding and the total proportion of blue-green space are important indicators of the public’s evaluation of their ecological protection capacity. According to other research results, the higher the degree of re-wilding, the stronger the ecological stability and the less susceptible it is to external disturbances [41]; the higher the proportion of blue-green space, the stronger the ecological restoration [42]. Therefore, the two are the influencing factors of the park’s ability to protect the ecological environment. Qinglong Lake Wetland Park and Bailuwan Wetland Park have the highest degree of re-wilding and the lowest plant diversity, indicating that plant introduction and cultivation [43] increase the plant diversity of parks after the artificial disturbance [44]. Plant introduction and cultivation are based on human behaviour, which can bring in species that cannot enter Chengdu under natural conditions. However, it is necessary to introduce exotic species in a reasonable way in order to reduce the risk of biological invasion [45]. Plant diversity is inversely proportional to visitors’ willingness to take pictures and their degree of relaxation, indicating that visitors are less fond of green spaces that are over-planned and transplanted with lots of non-native plants [46].
5. Conclusions
Based on a field investigation and survey of five different types of parks in Chengdu, this paper calculated and obtained the characteristic factors of these ecosystems. Combined with questionnaires on public behaviour and preferences, our analysis draws the following conclusions: (1) The scale of urban parks has a positive impact on the public’s evaluation and promotes public visits. (2) From the public perspective, the area and proportion of blue space is proportional to its aesthetic value. (3) The degree of re-wilding and the total proportion of blue-green space are important indicators for the public to evaluate the ability of parks to protect the environment. (4) The characteristics of urban parks are closely related to some public behaviour and preferences (“Fitness”, “Photography”, “Wetland”, “Lawn Park”, “Recreational Park”, “Shade”, and “Relaxing”) and linked less to the others. Park ecosystem is a popular form of space utilisation in cities. Revealing the relationship between park characteristics and public behaviour and preferences is conducive to designing and managing urban parks accordingly and thus better meeting public needs.
Author Contributions
Conceptualization, Z.L. and Q.L.; methodology, Z.L. and Q.L.; validation, Q.L. and K.Y.; formal analysis, Z.L.; investigation, Q.L., K.Y., Y.Y. and Z.L.; resources, Q.L., Y.Z., K.Y. and Y.Y.; data curation, Z.L.; writing—original draft preparation, Z.L.; writing—review and editing, Q.L.; visualization, Z.L.; supervision, P.X.; project administration, Q.L.; funding acquisition, Q.L. and Y.Z. All authors have read and agreed to the published version of the manuscript.
Funding
This research was funded by the Youth Innovation Promotion Association of the Chinese Academy of Sciences, grant number 2021375; Evaluation of Ecosystem Services and its Value Realization in Ecological Belt Surrounding the Chengdu City, grant number JCJQ-21170; and Technology Program of China Quality Certification Centre, grant number 2021CQC21-stzx.
Institutional Review Board Statement
For this study, ethical approval was not required. The study was conducted with visitors of urban parks. All participants were informed in advance that participation is voluntarily and that data collection takes place anonymously.
Informed Consent Statement
Informed consent was obtained from all subjects involved in the study.
Data Availability Statement
Not applicable.
Acknowledgments
The authors would like to thank Chengdu Municipal Bureau of Planning and Natural Resources and Chengdu Tianfu Greenway Construction Investment Group Co., Ltd. for their support and assistance with this study.
Conflicts of Interest
The authors declare no conflict of interest.
Appendix A. Questionnaire
The original version of the questionnaire was in Chinese. We have translated it for the convenience of readers of this journal.
Public Behaviour and Preferences in (Name of a park)
Name of Investigator:
Number:
You are: Male/Female
Your age is:
Your educational background is:
Your career is:
Where do you live:
1. Multiple choice questions:
- a.
- How often do you visit this park in spring?
- (1)
- Every day
- (2)
- 2–3 days apart
- (3)
- 4–7 days apart
- (4)
- 7–15 days apart
- (5)
- >15 days apart
- b.
- How often do you visit this park in summer?
- (1)
- Every day
- (2)
- 2–3 days apart
- (3)
- 4–7 days apart
- (4)
- 7–15 days apart
- (5)
- >15 days apart
- c.
- How often do you visit this park in autumn?
- (1)
- Every day
- (2)
- 2–3 days apart
- (3)
- 4–7 days apart
- (4)
- 7–15 days apart
- (5)
- >15 days apart
- d.
- How often do you visit this park in winter?
- (1)
- Every day
- (2)
- 2–3 days apart
- (3)
- 4–7 days apart
- (4)
- 7–15 days apart
- (5)
- >15 days apart
- e.
- How long do you stay during every visit?
- (1)
- <1 hour
- (2)
- 1–3 hours
- (3)
- 3–6 hours
- (4)
- >6 hours
2. Sorting questions:
Please sort the options below by preference.
- a.
- Behavioural Activity Preferences
- (1)
- Running/Cycling
- (2)
- Fitness
- (3)
- Viewing
- (4)
- Entertainment
- (5)
- Socialisation
- (6)
- Photography
- b.
- Landscape Preferences
- (1)
- Wetland
- (2)
- Forest Park
- (3)
- Lawn Park
- (4)
- Countryside
- (5)
- Recreational Park
- c.
- Bio-aesthetic Preferences
- (1)
- Viewing Flowers
- (2)
- Viewing Leaves
- (3)
- Lawn
- (4)
- Trees
- (5)
- Shade
- (6)
- Animal Diversity
- d.
- Functional value preferences
- (1)
- Landscaping
- (2)
- Protecting Environment
- (3)
- Exercising
- (4)
- Relaxing
- (5)
- Leisure Activities
- (6)
- Enhancing City Image
Appendix B. Basic Information on the Survey Respondents
Table A1.
Demographic Information about Park Visitors.
Table A1.
Demographic Information about Park Visitors.
| Item | Classification | Number | Percentage |
|---|---|---|---|
| Gender | Male | 183 | 48.54% |
| Female | 194 | 51.46% | |
| Age Group | <20 | 49 | 13.00% |
| 21–40 | 192 | 50.93% | |
| 41–60 | 85 | 22.55% | |
| >61 | 51 | 13.52% | |
| Education | Primary School or less | 56 | 14.85% |
| Junior and Senior School | 133 | 35.28% | |
| Technical School | 46 | 12.20% | |
| Bachelor’s or more | 142 | 37.67% | |
| Occupation | Student | 54 | 14.32% |
| On-the-job | 157 | 41.64% | |
| Free-lancer | 98 | 26.00% | |
| Retired | 68 | 18.04% | |
| Accommodation | Central City | 230 | 61.01% |
| Suburbs | 145 | 38.46% | |
| Other Cities | 2 | 0.53% |
References
- Priess, J.; Pinto, L.V.; Misiune, I.; Palliwoda, J. Ecosystem Service Use and the Motivations for Use in Central Parks in Three European Cities. Land 2021, 10, 154. [Google Scholar] [CrossRef]
- Tao, X.; Chen, M.; Zhang, W.; Bai, Y. Classification and its relationship with the functional analysis of urban parks: Taking Beijing as an example. Geogr. Res. Aust. 2013, 32, 1964–1976. (In Chinese) [Google Scholar]
- Jim, C.Y.; Chen, W.Y. Recreation-amenity use and contingent valuation of urban greenspaces in Guangzhou, China. Landsc. Urban Plan. 2006, 75, 81–96. [Google Scholar] [CrossRef]
- Keith, S.J.; Larson, L.R.; Shafer, C.S.; Hallo, J.C.; Fernandez, M. Greenway use and preferences in diverse urban communities: Implications for trail design and management. Landsc. Urban Plan. 2018, 172, 47–59. [Google Scholar] [CrossRef]
- Talal, M.L.; Santelmann, M.V. Vegetation management for urban park visitors: A mixed methods approach in Portland, Oregon. Ecol. Appl. 2020, 30, e02079. [Google Scholar] [CrossRef] [Green Version]
- Wang, K. Research on Feature Analysis and Optimization Strategy of Children’s Site in Xi’an Urban Parks. Master’s Thesis, Northwest A&F University, Xianyang, China, 29 May 2021. (In Chinese). [Google Scholar]
- Rahnema, S.; Sedaghathoor, S.; Allahyari, M.S.; Damalas, C.A.; El Bilali, H. Preferences and emotion perceptions of ornamental plant species for green space designing among urban park users in Iran. Urban For. Urban Green. 2019, 39, 98–108. [Google Scholar] [CrossRef]
- Goker, P.; Hergul, O.C.C.; Kahveci, H. A research on the function and usability of historical urban parks: Case study of Shah Goli Park, Tabriz, Iran. Appl. Ecol. Environ. Res. 2019, 17, 3147–3163. [Google Scholar] [CrossRef]
- Typhina, E. Urban park design plus love for nature: Interventions for visitor experiences and social networking. Environ. Educ. Res. 2017, 23, 1169–1181. [Google Scholar] [CrossRef]
- Talal, M.L.; Santelmann, M.V.; Tilt, J.H. Urban park visitor preferences for vegetation—An on-site qualitative research study. Plants People Planet 2021, 3, 375–388. [Google Scholar] [CrossRef]
- Mu, B.; Liu, C.; Mu, T.; Xu, X.N.; Tian, G.H.; Zhang, Y.L.; Kim, G.W. Spatiotemporal fluctuations in urban park spatial vitality determined by on-site observation and behavior mapping: A case study of three parks in Zhengzhou City, China. Urban For. Urban Green. 2021, 64, 127246. [Google Scholar] [CrossRef]
- Zhang, K.L.; Tang, X.H.; Zhao, Y.T.; Huang, B.W.; Huang, L.J.; Liu, M.Y.; Luo, E.D.; Li, Y.X.; Jiang, T.; Zhang, L.Q.; et al. Differing perceptions of the youth and the elderly regarding cultural ecosystem services in urban parks: An exploration of the tour experience. Sci. Total Environ. 2022, 821, 153388. [Google Scholar] [CrossRef]
- Brown, G.; Schebella, M.F.; Weber, D. Using participatory GIS to measure physical activity and urban park benefits. Landsc. Urban Plan. 2014, 121, 34–44. [Google Scholar] [CrossRef]
- Hou, Y.-J.; Zhao, X.-L.; Zhang, B. Significance Analysis between Morning Exercise and Spatial Organization Characteristics of Urban Park—Taking 4 Urban Parks in Harbin for Example. Landsc. Archit. 2017, 109–116. (In Chinese) [Google Scholar] [CrossRef]
- Long, C.; Sun, Z.; Wang, Y. Study on the Walking Behavior of the Elderly and the Spatial Organization Characters of Urban Parks—Based on Space Syntax Theory. Archit. Cult. 2018, 148–149. (In Chinese) [Google Scholar] [CrossRef]
- Song, C.; Ikei, H.; Igarashi, M.; Miwa, M.; Takagaki, M.; Miyazaki, Y. Physiological and psychological responses of young males during spring-time walks in urban parks. J. Physiol. Anthropol. 2014, 33, 8. [Google Scholar] [CrossRef] [Green Version]
- Wu, S.; Hong, X.; Dai, Z.; Zheng, Y.; Jiang, Y.; Yan, C.; Lan, S. A Study of the Relationship between Color Characteristics of Urban Parks and Tourists’ Perception Psychology: A Case Study of South Part of Minjiang Park, Fuzhou City. J. Chin. Urban For. 2019, 17, 37–41+72. (In Chinese) [Google Scholar]
- Menconi, M.E.; Sipone, A.; Grohmann, D. Complex Systems Thinking Approach to Urban Greenery to Provide Community-Tailored Solutions and Enhance the Provision of Cultural Ecosystem Services. Sustainability 2021, 13, 11787. [Google Scholar] [CrossRef]
- Wang, Z.F.; Miao, Y.L.; Xu, M.; Zhu, Z.W.; Qureshi, S.; Chang, Q. Revealing the differences of urban parks’ services to human wellbeing based upon social media data. Urban For. Urban Green. 2021, 63, 127233. [Google Scholar] [CrossRef]
- Xiong, Y. 2020 Chengdu Yearbook; Xinhua Publishing House: Beijing, China, 2020. (In Chinese) [Google Scholar]
- Wang, Z.; Wang, W.; Xing, S. A study on the relationship between the characteristics and usage of urban park green space and population health. J. Nanjing For. Univ. Nat. Sci. Ed. 2021, 45, 223–231. (In Chinese) [Google Scholar]
- Hoyle, H.; Hitchmough, J.; Jorgensen, A. All about the ‘wow factor’? The relationships between aesthetics, restorative effect and perceived biodiversity in designed urban planting. Landsc. Urban Plan. 2017, 164, 109–123. [Google Scholar] [CrossRef]
- Ioja, I.C.; Osaci-Costache, G.; Breuste, J.; Hossu, C.A.; Gradinaru, S.R.; Onose, D.A.; Nita, M.R.; Skokanova, H. Integrating urban blue and green areas based on historical evidence. Urban For. Urban Green. 2018, 34, 217–225. [Google Scholar] [CrossRef]
- Li, W.F.; Ouyang, Z.Y.; Meng, X.S.; Wang, X.K. Plant species composition in relation to green cover configuration and function of urban parks in Beijing, China. Ecol. Res. 2006, 21, 221–237. [Google Scholar] [CrossRef]
- Zhang, F.; Jia, X.; Zheng, S.; Dai, X. Research on Plant Diversity and Plant Community Structure of Wildness in Urban Industrial Area—Taking the Rewilding of Shanghai Solvent Factory as an Example. Chin. Landsc. Archit. 2021, 37, 14–19. (In Chinese) [Google Scholar]
- Wang, H.Y.; Hu, Y.F.; Tang, L.; Zhuo, Q. Distribution of Urban Blue and Green Space in Beijing and Its Influence Factors. Sustainability 2020, 12, 2252. [Google Scholar] [CrossRef] [Green Version]
- Liu, X.F.; Liu, X.H.; Shao, X.M.; Songer, M.; He, B.S.; He, X.B.; Zhu, Y. Plant diversity patterns of temperate forests with logging and restoration practices in northwest China. Ecol. Eng. 2018, 124, 116–122. [Google Scholar] [CrossRef]
- Figueroa, J.A.; Castro, S.A.; Reyes, M.; Teillier, S. Urban park area and age determine the richness of native and exotic plants in parks of a Latin American city: Santiago as a case study. Urban Ecosyst. 2018, 21, 645–655. [Google Scholar] [CrossRef]
- Peng, S.; Xiang, Y. The invasion of exotic plants and effects of ecosystems. Acta Ecol. Sin. 1999, 19, 560–569. (In Chinese) [Google Scholar]
- Maniruzzaman, K.M.; Alqahtany, A.; Abou-Korin, A.; Al-Shihri, F.S. An analysis of residents’ satisfaction with attributes of urban parks in Dammam city, Saudi Arabia. Ain Shams Eng. J. 2021, 12, 3365–3374. [Google Scholar] [CrossRef]
- Larson, L.; Whiting, J.W.; Green, G.T.; Bowker, J.M. Physical Activity Levels and Preferences of Ethnically Diverse Visitors to Georgia State Parks. J. Leis. Res. 2014, 46, 540–562. [Google Scholar] [CrossRef]
- Xiang, L.Y.; Tian, Y.Q.; Pan, Y.C. Study on landscape evaluation and optimization strategy of Central Park in Qingkou Town. Sci. Rep. 2022, 12, 1978. [Google Scholar] [CrossRef]
- Chen, Y.; Xu, Z.K.; Byrne, J.; Xu, T.T.; Wang, S.W.; Wu, J.Y. Can smaller parks limit green gentrification? Insights from Hangzhou, China. Urban For. Urban Green. 2021, 59, 127009. [Google Scholar] [CrossRef]
- Yeh, C.T.; Cheng, Y.Y.; Liu, T.Y. Spatial Characteristics of Urban Green Spaces and Human Health: An Exploratory Analysis of Canonical Correlation. Int. J. Environ. Res. Public Health 2020, 17, 3227. [Google Scholar] [CrossRef] [PubMed]
- Jorgensen, A.; Hitchmough, J.; Calvert, T. Woodland spaces and edges: Their impact on perception of safety and preference. Landsc. Urban Plan. 2002, 60, 135–150. [Google Scholar] [CrossRef]
- Lis, A.; Pardela, Ł.; Can, W.; Katlapa, A.; Rąbalski, Ł. Perceived Danger and Landscape Preferences of Walking Paths with Trees and Shrubs by Women. Sustainability 2019, 11, 4565. [Google Scholar] [CrossRef] [Green Version]
- Lis, A.; Pardela, Ł.; Iwankowski, P. Impact of Vegetation on Perceived Safety and Preference in City Parks. Sustainability 2019, 11, 6324. [Google Scholar] [CrossRef] [Green Version]
- Diao, Y.Y.; Hu, W.; He, B.J. Analysis of the Impact of Park Scale on Urban Park Equity Based on 21 Incremental Scenarios in the Urban Core Area of Chongqing, China. Adv. Sustain. Syst. 2021, 5, 2100171. [Google Scholar] [CrossRef]
- Dou, Y.H.; Zhen, L.; De Groot, R.; Du, B.Z.; Yu, X.B. Assessing the importance of cultural ecosystem services in urban areas of Beijing municipality. Ecosyst. Serv. 2017, 24, 79–90. [Google Scholar] [CrossRef]
- Chan, S.Y.; Chau, C.K.; Leung, T.M. On the study of thermal comfort and perceptions of environmental features in urban parks: A structural equation modeling approach. Build Environ. 2017, 122, 171–183. [Google Scholar] [CrossRef]
- Iknayan, K.J.; Wheeler, M.M.; Safran, S.M.; Young, J.S.; Spotswood, E.N. What makes urban parks good for California quail? Evaluating park suitability, species persistence, and the potential for reintroduction into a large urban national park. J. Appl. Ecol. 2022, 59, 199–209. [Google Scholar] [CrossRef]
- Fisher, J.C.; Irvine, K.N.; Bicknell, J.E.; Hayes, W.M.; Fernandes, D.; Mistry, J.; Davies, Z.G. Perceived biodiversity, sound, naturalness and safety enhance the restorative quality and wellbeing benefits of green and blue space in a neotropical city. Sci. Total Environ. 2021, 755, 143095. [Google Scholar] [CrossRef]
- Wilsey, B.J.; Barber, K.; Martin, L.M. Exotic grassland species have stronger priority effects than natives regardless of whether they are cultivated or wild genotypes. New Phytol. 2015, 205, 928–937. [Google Scholar] [CrossRef]
- Chang, C.R.; Chen, M.C.; Su, M.H. Natural versus human drivers of plant diversity in urban parks and the anthropogenic species-area hypotheses. Landsc. Urban Plan. 2021, 208, 104023. [Google Scholar] [CrossRef]
- Nguyen, N.A.; Eskelson, B.N.I.; Gergel, S.E.; Murray, T. The occurrence of invasive plant species differed significantly across three urban greenspace types of Metro Vancouver, Canada. Urban For. Urban Green. 2021, 59, 126999. [Google Scholar] [CrossRef]
- Li, X.P.; Fan, S.X.; Kuhn, N.; Dong, L.; Hao, P.Y. Residents’ ecological and aesthetical perceptions toward spontaneous vegetation in urban parks in China. Urban For. Urban Green. 2019, 44, 126397. [Google Scholar] [CrossRef]


Publisher’s Note: MDPI stays neutral with regard to jurisdictional claims in published maps and institutional affiliations. |
© 2022 by the authors. Licensee MDPI, Basel, Switzerland. This article is an open access article distributed under the terms and conditions of the Creative Commons Attribution (CC BY) license (https://creativecommons.org/licenses/by/4.0/).