Article

Investigating Drivers of Native Plant Production in the United States Green Industry

1
Department of Agricultural and Resource Economics, The University of Tennessee Institute of Agriculture, Knoxville, TN 37996, USA
2
Department of Horticultural Science, North Carolina State University, Raleigh, NC 27695, USA
3
School of Food and Agriculture, University of Maine, Orono, ME 04469, USA
4
Departments of Horticulture & Landscape Architecture and Agricultural Economics, Purdue University, West Lafayette, IN 47907, USA
5
Department of Horticulture, University of Georgia, Athens, GA 30602, USA
6
Department of Horticulture and Natural Resources, Kansas State University, Manhattan, KS 66506, USA
7
Department of Agricultural Economics, Texas A&M University, College Station, TX 77843, USA
8
Food and Resource Economics Department, Mid-Florida Research and Education Center, University of Florida, Apopka, FL 32703, USA
*
Author to whom correspondence should be addressed.
Sustainability 2022, 14(11), 6774; https://doi.org/10.3390/su14116774
Submission received: 30 April 2022 / Revised: 22 May 2022 / Accepted: 25 May 2022 / Published: 1 June 2022

Abstract

:
Native plant use in United States (U.S.) ornamental landscapes is expected to increase in upcoming years. Various market, production, and economic factors may influence a nursery firm’s likelihood of growing and selling native plants. The objective of this study was to investigate production-related factors (e.g., integrated pest management (IPM) strategies, firm characteristics, and plant types sold) that impact commercial native plant sales in the U.S. The research questions included the following: (a) What production factors drive growers to produce native plants? (b) What production factors increase native plant sales? Insights on production-related factors that influence native plant production can be used to understand the decision-making process of native plant growers and encourage additional production of native plants to meet expected increases in demand. Data from the 2014 and 2019 Green Industry Research Consortium’s National Green Industry Survey were used to address this research objective. Green industry firms were categorized by their annual native plant sales, and an ordered probit model was used to assess differences in IPM strategies, firm characteristics, number of plant types grown, sales attributed to different plant types, and actions to address labor issues. In general, firms selling native plants participated in more IPM strategies, sold a more diverse array of plants, and used more sales avenues than non-native plant firms. IPM strategies varied by native plant sales, with firms generating higher native plant sales exhibiting a higher likelihood of removing infested plants, circulating air, managing irrigation, using beneficial insects, and planting pest resistant varieties as part of their IPM strategy than non-native plant firms. Annual native sales and paying higher wages were impacted by plant types sold. Understanding current production and business practices can help identify practices resulting in market success for native plants, the use of which can enhance sustainable landscapes by increasing biodiversity and ecosystem services.

1. Introduction

The ornamental plant sectors of the United States (U.S.) horticulture industry are often referred to as the “green industry” in reference to the general color of plants in the landscape. The green industry is an economically important sector of the U.S. economy and consists of growers, wholesalers, landscapers, and other stakeholders involved with the ornamental horticulture industry. In 2018, the U.S. green industry’s total economic output was estimated at USD 348.1 billion, and the industry employed nearly 1.6 million people [1]. The top contributing sectors were the service industry (landscaping and horticultural services) at USD 221.9 billion and 1.5 million jobs and the production sector (greenhouse, nursery, floriculture) at USD 28.7 billion and 217,574 jobs.
Native plants, a product selection within the green industry, have received limited attention in previous literature. Native plants are typically defined as “indigenous terrestrial and aquatic species that have evolved and occur naturally in a particular region, ecosystem, and habitat” and, in North America, were present before European settlement [2]. Plants native to the U.S. may exhibit propagation or commercial production challenges [3] that increase production costs [4,5]. Additionally, they may not compete well with non-native varieties in their floral displays or “finished plant” uniformities [4,5]. However, native plants offer many benefits in the landscape, including regional adaptability and ecosystem services such as pollinator support. To date, very few studies address factors that impact the production and sales of native plants by green industry firms. Insights on production-related factors that impact native plant sales can aid growers as they consider future product offerings and opportunities (i.e., native plants).
Understanding factors that impact native plant production is important, given that demand for native plants is expected to increase in the upcoming years [5,6]. Relatedly, the U.S. housing market has recently grown with double-digit increases, by percentage, in home prices in most regions [7]. This is important because the demand for ornamental plants closely aligns with the housing market as new landscape installations occur or existing landscapes are updated [8]. Increasing demand for plants with the rising housing market creates an opportunity to encourage more sustainable plantings in residential and commercial settings. Native plants are often considered more sustainable than introduced (i.e., non-native or exotic) species, given that native plants have co-evolved in local ecosystems, may be more resistant to environmental and pest challenges, and may require fewer inputs (i.e., fertilizer, irrigation, and pesticides) than non-native species [9].
The overall objective of this study is to investigate drivers of native plant production by identifying production factors that impact native plant sales. To date, native plant production research has not addressed the overall production practices used by native plant growers. We seek to address this knowledge gap by addressing two research questions: (a) What production factors drive growers to produce native plants? (b) What production factors increase native plant sales? In turn, these results can aid growers interested in starting or expanding their native plant offerings through identifying production-related factors commonly used by firms with native plant sales. These insights may impact native plant offerings in the U.S. green industry through increased availability. National online and mail industry surveys with a large number of growers collected in 2014 and 2019 are used to address this research objective. Participants indicated their firms’ integrated pest management (IPM) practices, types of plants produced, retail market outlets, and actions to address labor issues. The results can be used to identify factors that may encourage or discourage the production of native plants. The findings can help researchers and Extension specialists design and deliver programs that better serve the production and sales of native plants. Increased supply of native plants in the retail environment may positively impact their use in residential and commercial landscapes. In turn, increasing use of native plants in landscapes can aid in sustainability by reducing input requirements while aiding biodiversity and supporting native pollinators.
The next section summarizes relevant literature related to native plant production followed by the study methods, the results, and a brief conclusion and discussion.

2. Literature Review

2.1. Native Plant Benefits

The benefits of using native plants in urban and rural landscapes are plentiful, though perhaps less well documented than those of non-native species. Currently, literature on the use of native plants for landscaping can be categorized as benefits, production methods, and marketplace acceptance. Native plants have many benefits for the built environment, including environmental benefits and benefits to humans. Environmental benefits of using native plants in landscapes include reduced introduction of harmful invasive, non-native species [10,11], enhanced biodiversity that minimizes ecological risks inherent to low-diversity landscapes (e.g., disease and insect issues) [12], and improved soil health [13,14]. Regarding biodiversity, invasive species are second only to habitat loss as a threat to native plant diversity in the U.S. [15]. Previous literature identified water management, nutrition management, environmental pollinator, bio-protection from pests, and crop diversity as management practices in agriculture to aid local ecosystems [16]. In general, the inclusion of plants in landscapes improves soil health, biodiversity, rainwater management, etc. [17]. Additionally, native plants support greater abundance and diversity of lepidopterans compared to introduced plants [18,19,20]. A six-year survey of bee foraging in California urban environments found that native plants support bee taxa that do not interact with introduced plants [21]. Nurseries who grow native plants exhibit more specialized bee species and fewer generalist pollinator species [22]. Supporting evidence by Zaninotto et al. [23] found that exotic pests had more generalist pollinator interactions but were less attractive to diverse pollinators. Additionally, native plants were visited more often than exotic species. Native plants also support non-insect biodiversity. In a recent literature review, Berthon et al. [24] found that three-quarters of studies assessing the biodiversity impacts of native and non-native plants showed positive effects of native plants on animal biodiversity, including native insectivorous birds [25] and caterpillars [26]. Furthermore, native plants may be better adapted to regional climates than non-native species [27,28]. Native wildlife that relies on plants is better adapted to use native plant species [24]. Both abiotic conditions and microbial diversity of soils may be modified as non-native plants invade natural plant communities [13]. This can influence the functional diversity of microbial communities [14].
Beyond biodiversity, plants provide other benefits to humans. The restoration of urban patches to native or mixed plant communities offers benefits to residents, including ecosystem services [29], improved self-reported health and wellbeing [30], and enhanced emotional and mental health [31]. Moreover, plants contribute to a wide range of physiological health indicators and outcomes as well as social benefits and community well-being [32,33]. Other studies indicate that native trees and vines improve the visual appeal of urban environments [34]. Even where landscape fragmentation and urbanization preclude the full range of ecosystem processes, residents may plant native species to satisfy their values or evoke a sense of place beyond the city [35,36].
Together, the literature on the benefits of native plants highlights the potential value of encouraging native plant production and integration into landscapes. However, for native plants to be integrated into landscapes, they must be grown and made available to potential customer groups.

2.2. Native Plant Production and Demand

Current literature addressing the production of native plants is scarce and frequently focuses on availability, market drivers, and barriers. In 2018, White et al. [37] determined that the availability of native plants is limited, with approximately one-fourth of the vascular plants native to North America being commercially available. However, this varies by geographical area and species. For instance, 74% of species native to the Midwestern tallgrass prairie were commercially available in 2017 [37]. To enter the market, a plant must be amenable to propagation and production and be desired by consumers (e.g., ornamental attributes, and adaptability). Some plants may be in high demand relative to production volumes, but they are difficult to propagate (e.g., Comptonia peregrina) [38]. Others are absent from the horticulture industry because they are challenging to cultivate (e.g., Carya spp.) or propagate (e.g., Viburnum lantanoides) [39,40].
In 2010, native plants accounted for 13% of all U.S. nursery sales [41] with demand being impacted by availability, consumer preferences, and knowledge related to natives [20]. Several studies highlighted the barriers to producing native plants, including small markets, low seed supply, low availability of desirable species, limited production and capital capacity, higher prices associated with native plant materials, low familiarity with natives in the industry and among customers, and perceptions that natives are less aesthetically appealing than non-native species [6,42,43]. Brzuszek and Harkess [44] identified consumer education as the primary means of increasing demand for native plants.
Demand for native plants has been increasing [6] and may be partially driven by consumers’ interest in sustainable production methods [45,46]. In turn, there may be a connection between the commercial production of native plants and growers’ use of different production practices amenable to the needs of native plants and their consumers. For example, nurseries that produce native plants for restoration purposes or ecologically conscious consumers might place a high value on sustainable pest control, irrigation, and fertilizer choices. While research on the comparative input needs of native and introduced nursery and landscape plants are scarce, some practices common to native landscaping likely offer sustainability benefits. For example, landscapes with reduced turfgrass area may use less fertilizer, retain more nutrients, reduce fossil fuel use during management, and use less water and pest-control resources [47,48]. It is not known to what extent these benefits are derived from the use of native plants versus the design and management decisions associated with landscapes where native plants have been specified. Regardless, the ecological attitudes that draw consumers to native plants plausibly correspond to more sustainable landscape management practices.
Marketing native plants entails several challenges, many of which are related to consumer perceptions that native plants do not fit into societal definitions of aesthetically pleasing landscapes [42,49]. However, landscapes frequently consist of a mixture of native and non-native species that provide both an aesthetically pleasing design and biodiversity [50,51,52,53]. Additionally, the environmental benefits associated with native plants could be treated as value-added traits and encourage consumers to make environmentally friendly choices [20]. Experimental evidence indicates that consumers are willing to pay a 14% premium for plants marketed as native and non-invasive [54]. A 2006 study by Helfand et al. [53] suggested that consumers are willing to pay more for yards that include native plants than for lawns. The increased willingness to pay exceeds increased costs associated with using native plants in the design.
Another challenge associated with marketing native plants is a lack of knowledge among retail garden center employees. Westerhold et al. [55] investigated knowledge of horticulture retail associates related to pollinator conservation. While overall knowledge level was adequate, uncertified and part-time employees had significantly lower scores. When asked to provide landscape management practices to recommend to customers who wished to conserve pollinators, only 10% recommended using native plants, yet 62% were more likely to recommend a native plant than a non-native plant with similar requirements. Among the common customer questions reported by respondents was, “Do native plants attract more pollinators?” (5% reported receiving this question as a retail garden center employee). Additionally, some consumers perceived that their purchases from independent garden centers resulted in more purchases of local, native, pollinator-friendly and organic plants compared with their purchases from home improvement centers and mass merchandisers [56]. Given the potential increased marketplace valuation and demand for native ornamental plants, it is important to understand the relationship between current production methods used by native plant growers and native plant sales to aid in future business decisions.

3. Materials and Methods

The data used in this analysis are from the Green Industry Research Consortium’s National Green Industry Surveys. Of particular interest were data from U.S. green industry firms in 2014 and 2019 for the prior fiscal or production year (i.e., 2013 and 2018). Survey questions elicited information about the firms’ characteristics (e.g., location, and business activities), employment numbers, plant types produced, percentage of total plant sales attributed to native plants, production and management practices (e.g., IPM strategies), marketing practices and outlets, regional trade information, and factors impacting business strategies. Data were collected using a mixed-mode method where online and mail survey formats were used to reach a broad sample of green industry firms. Survey procedures and methods were approved by the respective institutional review boards [57,58]. Surveys from the two data collection events were pooled, and firms with duplicate entrees in the same year were removed from the sample. A total of 4641 firms were included in the analysis.
In this analysis, variables related to production methods and native plant sales were the main interest. The variables are defined in the online supplementary materials (Table S1). Participants stated the percentage of their annual sales attributed to native plants and their estimated annual sales. These variables were used to estimate the firms’ native plant sales. The annual native plant sales were used to identify firms currently selling native plants and coded as 1 if native plants were sold and 0 otherwise. Approximately 51% of the sample (n = 2382) were classified as not selling native plants, while 49% (n = 2259) indicated some level of native plant sales.
The native plants sales information was used to categorize firms based upon total native plant sales. Categories included “no native plant sales” indicating that USD 0 in annual sales was attributed to native plant sales, “low native plant sales” (<USD 9000 in annual sales attributed to native plant sales), “medium native plant sales” (USD 9000–90,000 in annual sales attributed to native plant sales), and “high native plants sales” (>USD 90,000 in annual sales attributed to native plant sales). These thresholds were determined based on the distribution of the reported annual native plant sales. Of the 2259 firms that indicated they sold native plants, 2003 completed the survey questions and were used in three native plant categories. Of the 2003 firms in the native plant sales categories, 32.5% were in the “low native plant sales” category, 36.4% were in the “medium native plant sales” category, and 31.1% were in the “high native plant sales” category.
Beyond the annual sales of native plants, the firms’ current use of IPM strategies was of interest, given the perception that native plants may be less susceptible to pests and diseases than non-native plants [12]. Participants were given a list of 22 IPM strategies and selected those that were used by their firms. The IPM strategies were coded to equal 1 if selected and 0 otherwise. Firm characteristics were measured, including the U.S. region where the firm was located, the type of firm (i.e., wholesale, retail, landscape, and other), types of plants grown, and diversity of sales avenues used to sell plants. U.S. regions included the Appalachian, Great Plains, Mountain, Midwest, Northeast, Pacific, Southcentral, and Southeast regions. They were coded to equal 1 if the firm was located in that region and 0 otherwise. Participants indicated their type of firm, which was coded to equal 1 if selected and 0 otherwise. For the types of plants grown and sales by plant type, participants were provided a list of 16 plants and an “other plants” option and reported the percentage of annual sales attributed to each plant type. For the types of plants grown, if they indicated >0% of annual sales were attributed to that type of plant, they were coded to equal 1 and 0 otherwise. The sum of the types of plants grown was used in the “plant_index” variable to demonstrate the variety of plants grown by each firm. Sales avenue diversity used (termed “sales avenues”) reflected the total number of sales avenues used by the firm, meaning it reflected diversity in sales avenues. The sales avenue categories included mass merchandisers, home centers, single location garden centers, multiple location garden centers, landscape firms, re-wholesalers, and direct-to-consumer retail.
Lastly, given that labor concerns are becoming increasingly important in the green industry [59], participants were given a list of six actions to address labor challenges and selected those actions that their firms were currently implementing. Actions included adopting labor-saving technologies, paying higher wages, training employees, adding employee benefits, nothing, and other actions. If the action was selected, it was coded to equal 1 and 0 otherwise.
Each of these variables was summarized for the total sample and for firms selling native plants and not selling native plants (discussed shortly). Pairwise t-tests were used to determine statistically significant differences between firms selling native plants and those not selling native plants. The exploratory variables were then used in the econometric analysis to determine key differences between firms selling native plants and not selling native plants, and to identify factors that improved the likelihood of increased native plant sales. The experimental design is diagramed in the online supplementary materials (Figure S1).

Econometric Models

We used two models to investigate the factors influencing the sales of native plants. Using a standard probit, Model 1 used the binary dependent variable sell native plants equals 1 if the business reported sales of native plants, and zero otherwise. A firm will sell native plants if the anticipated profits ( E [ U ( π N a t ) ] ) of selling native plants are greater than the profits of not selling native plants ( E [ U ( π N o N a t ) ] ) . If the firm is currently selling native plants, this can be expressed as
Y i * = E [ U ( π N a t ) ]   E [ U ( π N o N a t ) ] > 0
where Y i * is an unobservable random index of grower i’s propensity to sell native plants. The random index is a function of various factors, specifically,
Y i * = x i α + A v e n u e i α A + P l t i n d e x i α P + I P M i α I P M + P l t T y p e i α P T + L a b o r i α L
where x i is a vector of firm i, which includes the firm characteristics of survey year, region, and firm type. The Avenue variable is the sales venues index capturing the number of market channels utilized by the firm. The Pltindex variable is the plant index capturing the number of different plant types sold. The IPM variable symbolizes the different IPM strategies used by firms (1 = used, 0 = otherwise). The PltType variable represents the percentage of annual sales from the different plant types listed. The Labor variable indicates the different labor-related actions firm i takes to address labor issues. The α is a vector of coefficients associated with the explanatory variables in x i . The α A , α P , α I P M , α P T , and α L parameters are associated with the independent variables, including sales avenues, plant index, IPM strategies, percentage of annual sales by plant type, and actions to address labor issues.
Given Equation (2), the probit model can be expressed as
              Pr [ Y i = 1 ] = Pr [ Y i * > 0 ]
= P r [ e i < x i α + R e t a i l i α A + P l t i n d e x i α P + I P M i α I P M + P l t T y p e i α P T + L a b o r i α L   ]
= Φ [ α + R e t a i l i α A + P l t i n d e x i α P + I P M i α I P M + P l t T y p e i α P T + L a b o r i α L ]
where e i is assumed to be normally distributed with a mean zero and standard deviation of σ e 2 ( N ( 0 ,   σ e 2 ) ). The Φ ( . ) indicates the cumulative normal distribution.
Model 2 used an ordered probit model to assess the influence of the explanatory variables on different levels of native plants sales. The dependent variable of the ordered probit took the value of y = 1 if the business did not report native plant sales, y = 2 if the business sold <USD 9000 in native plant sales (low native plant sales), y = 3 if native plant sales fell between USD 9000 and USD 90,000 (medium native plant sales), and y = 4 if business plant sales were >USD 90,000 (high native plant sales). Explanatory variables included the summary firm characteristics, IPM strategies, survey year, percentage of sales by types of plants produced, and actions taken by the firm to address labor issues from Equation (2). The latent variable ( y i * ) in an ordered probit ranges from −∞ to ∞ and is expressed by
y i * = x i β + ε i
where i indicates an observation and ε i is the random error term [60]. The latent variable is the annual native sales, which is connected to the observed response category by
y i = { 1   i f   k 0 = y i * < k 1 2   i f   k 1 y i * < k 2                           3   i f   k 2 y i * < k 3                           4   i f   k 3 y i * < k 4 =      
where the crossing threshold (k) results in a category change. As a result, the probability of observing y = j for x values can be expressed as
Pr ( y = j | x ) = Pr ( k j 1 y * k j | x )
where j = 1 to J (annual native plant sales category). The probability of a specific rating can be estimated by replacing y * with xβ + ε:
  Pr ( y = j | x ) = F ( k j x β ) F ( k j 1 x β )
where F indicates the cumulative distribution function of ε (i.e., V a r ( ε ) = 1 ).

4. Results

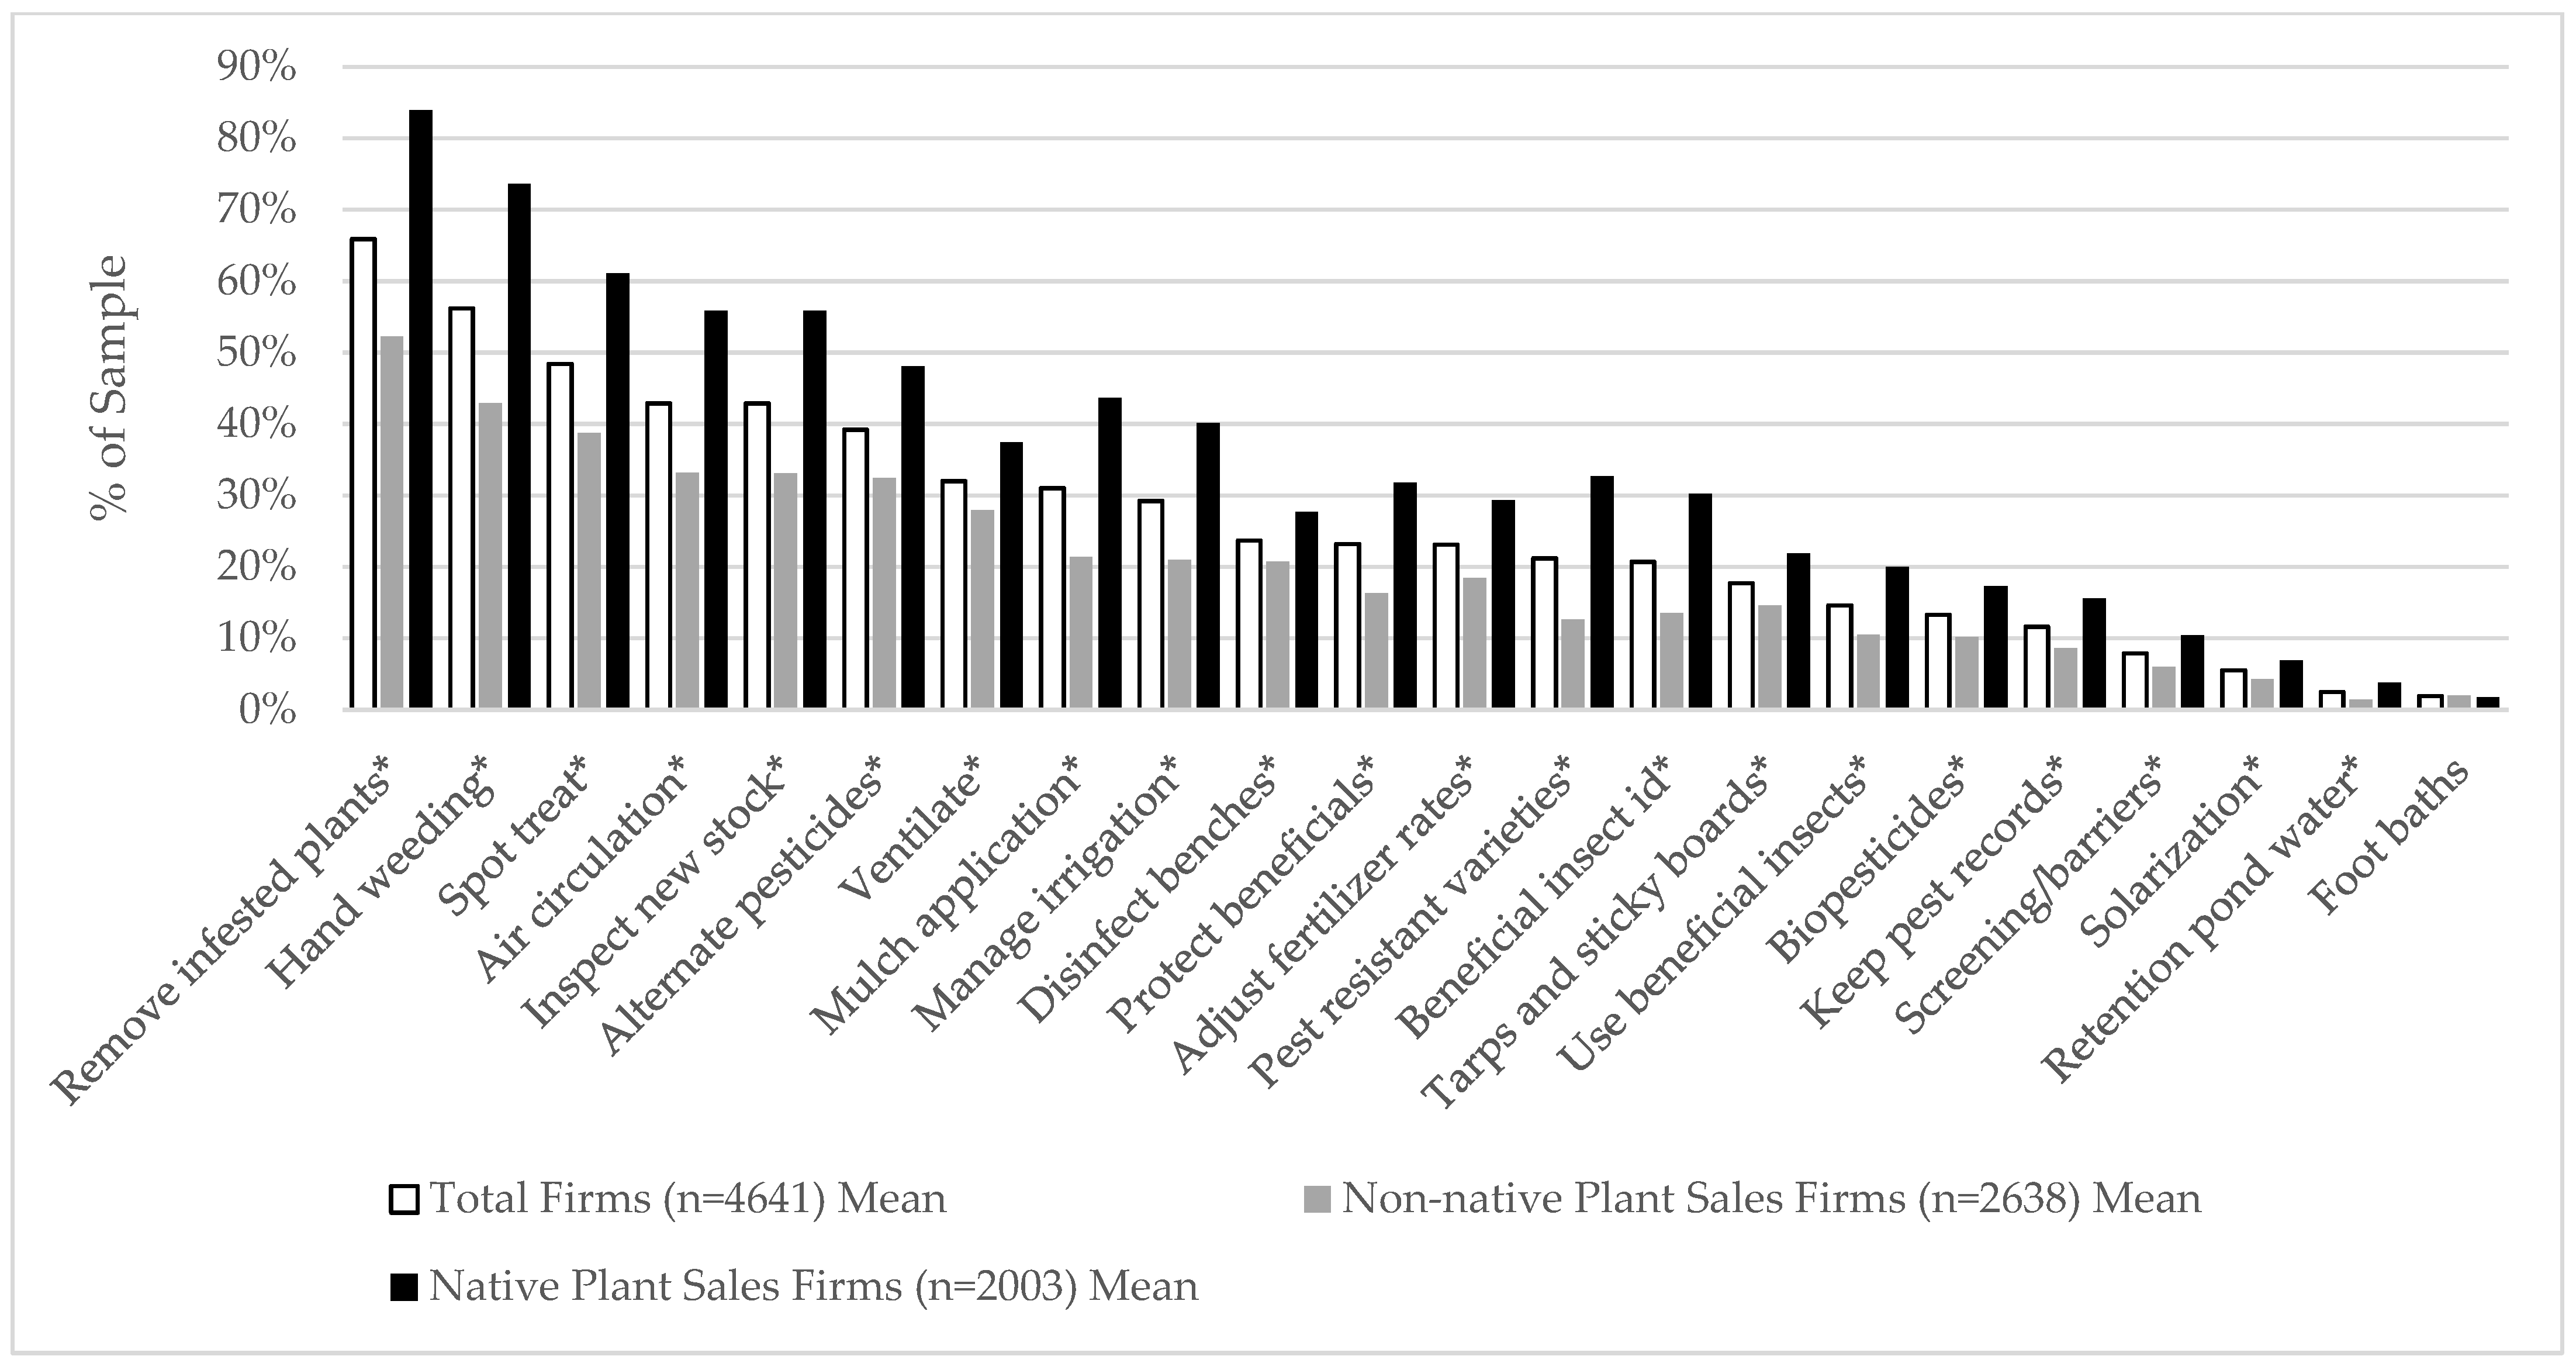
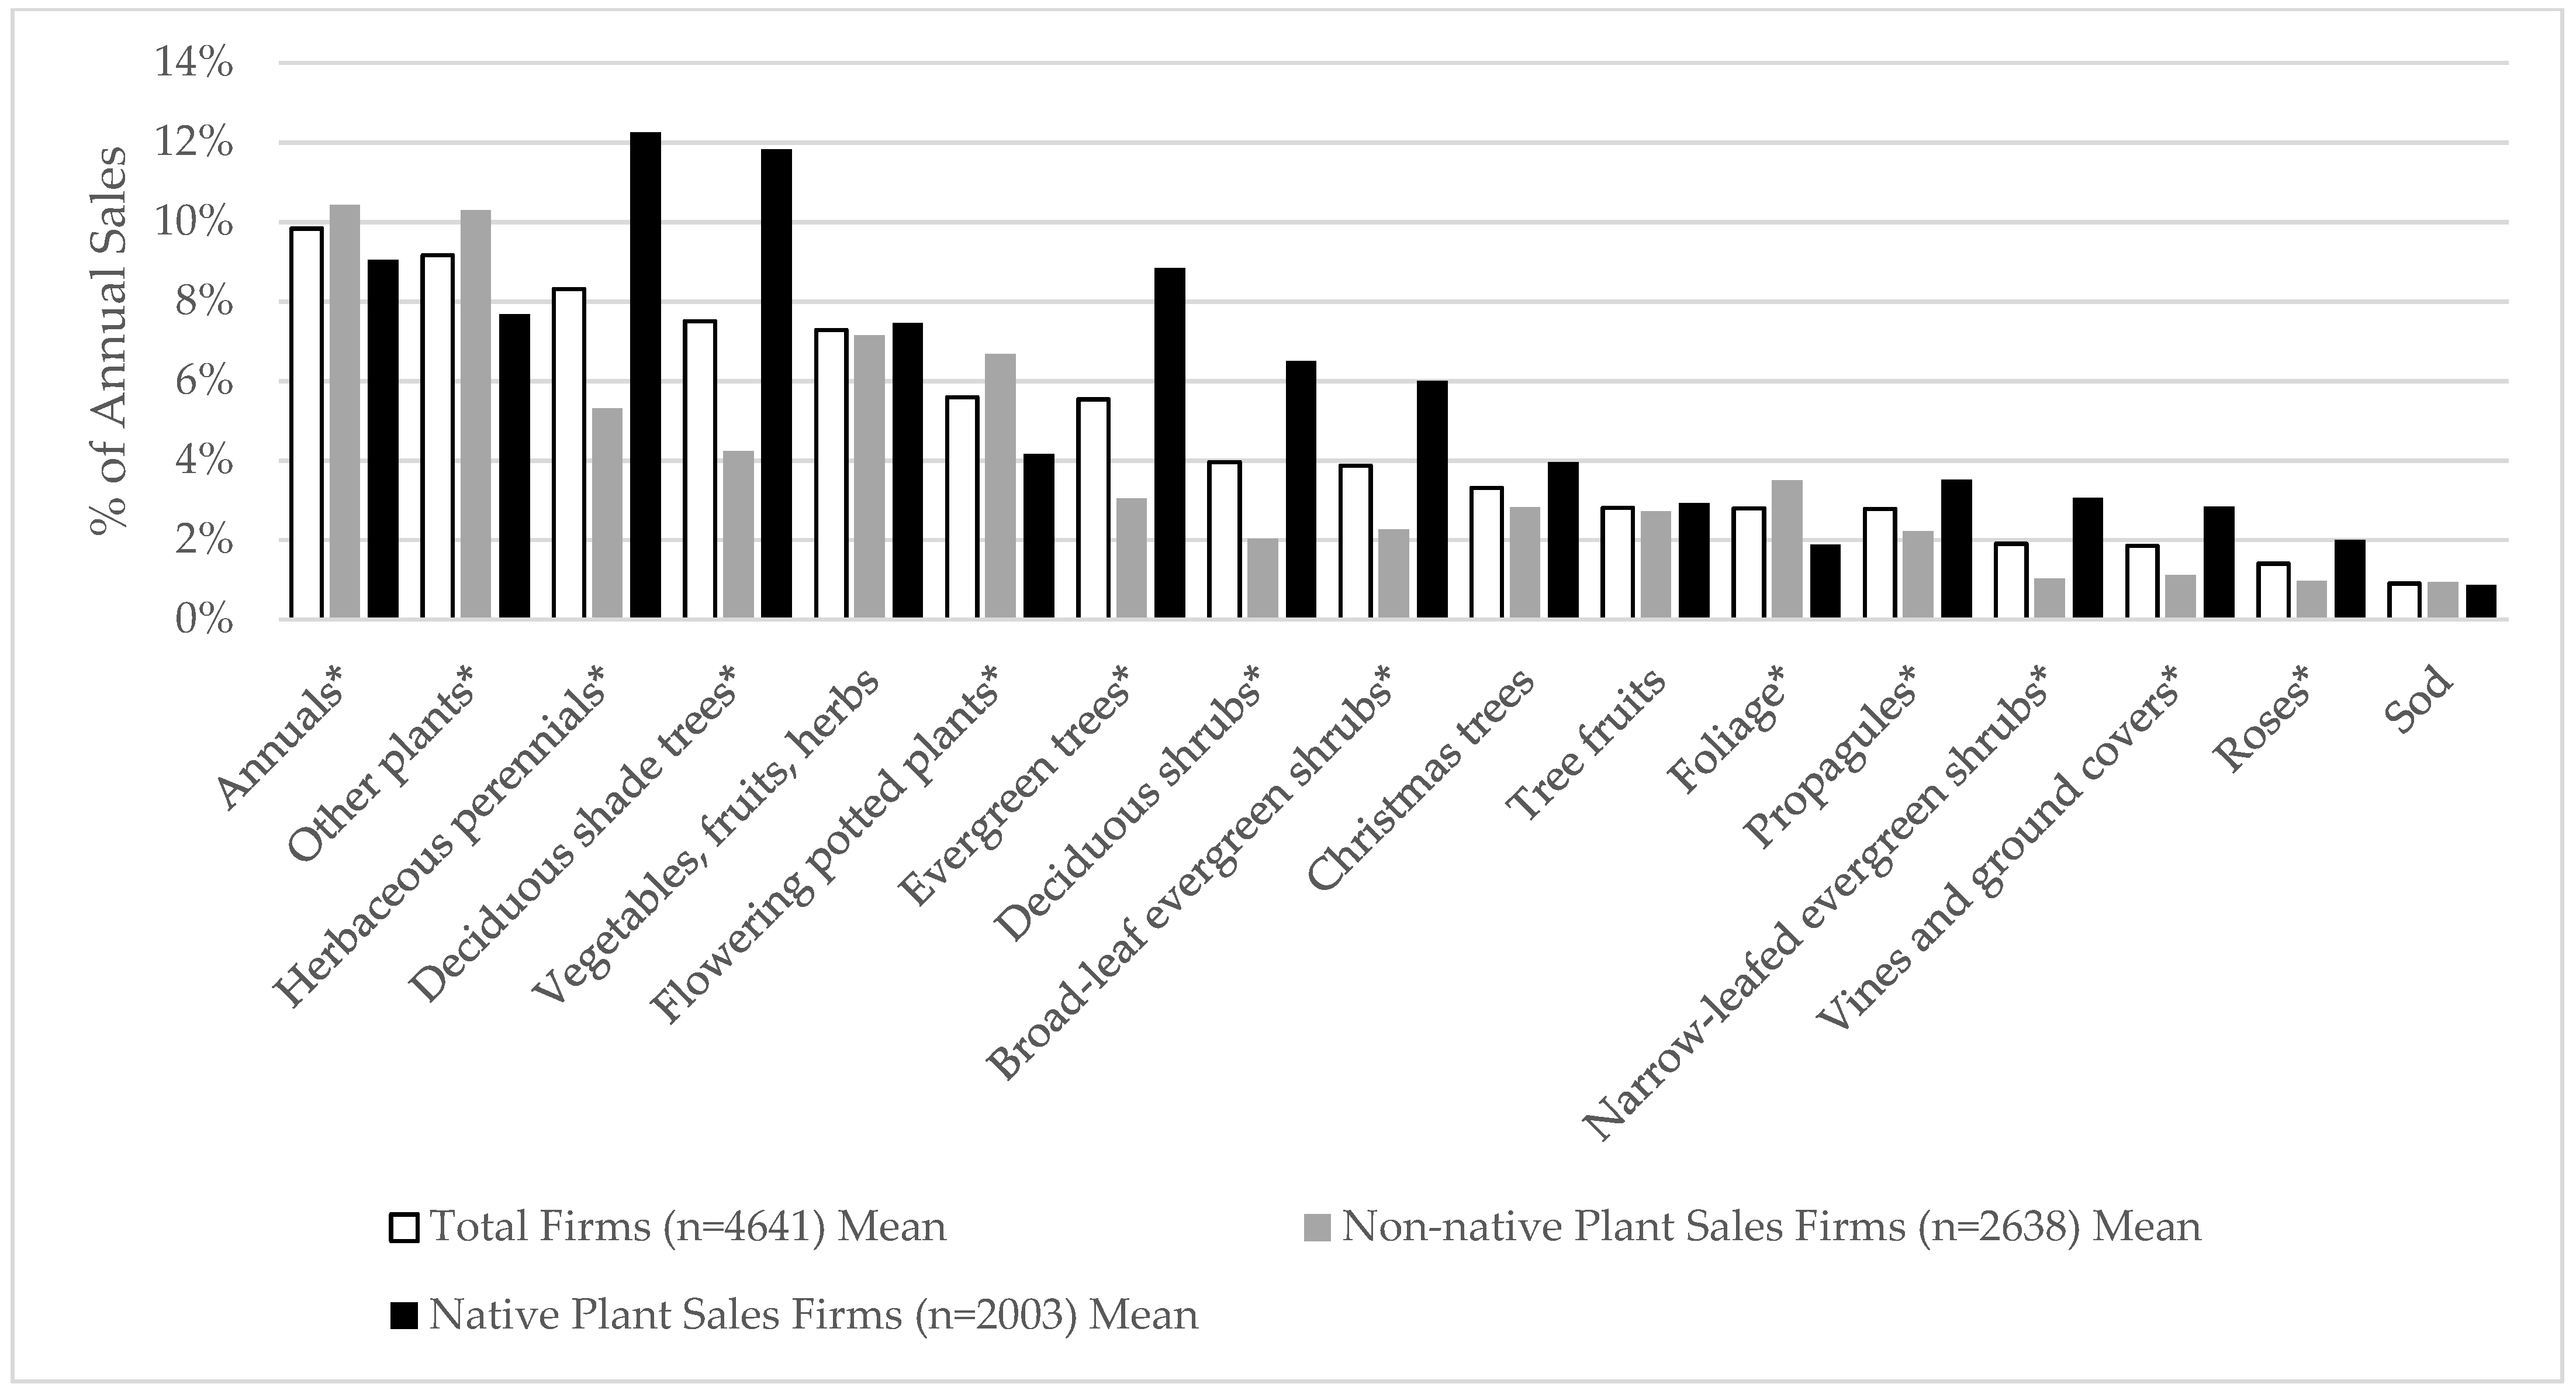
4.1. Descriptive Statistics

Table 1 summarizes the firm characteristics of the sample for the total sample (n = 4641), firms who do not grow native plants (“non-native plant firms”; n = 2638), and firms that do grow native plants (“native plant firms”; n = 2003). Sampled businesses reported selling through at least one sales avenue, with native plant firms reporting a slightly higher average (1.3 locations) than non-native plant firms (0.7) (p < 0.01). On average, firms in the sample reported producing on average 3.1 different plant types, with native plant firms producing 4.6 and non-native plant firms producing 2.0 different types of plants (p < 0.01). More than one quarter of the businesses surveyed are in the Southeast region (27%), followed by the Northeast (19%), Mountain (19%), Appalachian (11%), Pacific (10%), Southcentral (7%), Midwest (4%), and Great Plains (3%) regions. A similar trend was observed among native and non-native plant firms. Almost 40% of all firms are wholesalers of plants, with a higher proportion of native plant firms (42%) than non-native plant firms (37%) being wholesalers (p < 0.01). About 25% of firms are retailers, with a higher proportion of native plant firms (27%) than non-native plant firms (24%) reporting retail sales (p < 0.01). Only 19% of businesses in the sample are landscaping operations, with more non-native plant firms (21%) being landscapers than native plant firms (16%; p < 0.01). The percentage of firms selecting “other business type” is not significantly different between native and non-native plant firms.
IPM strategies employed by different firms are presented in Figure 1. The most common IPM strategy used by all sampled firms was removing infested plants (66% of all businesses), with 84% of native firms and 52% of non-native firms reporting use of this IPM practice (p < 0.01). Other common IPM practices reported by all firms were hand weeding (56% of all businesses), spot treating (48% of all businesses), inspecting new stock (43% of all businesses), air circulation (43% of all businesses), alternating pesticides (39% of all businesses), ventilation (32% of all businesses), mulch application (31% of all businesses), managing irrigation (29% of all businesses), disinfecting benches in production areas (24% of all businesses), adjusting fertilizer rates (23% of all businesses), protecting beneficial insects (23% of all businesses), planting pest resistant varieties (21% of all businesses), and identifying beneficial insects (21% of all businesses). The remaining IPM strategies were used by less than 20% of all businesses and included foot baths, solarization, tarps and sticky boards, beneficial insect use, pest records, screening/barriers, biopesticides, and retention pond water treatments. A significantly higher percentage of native plant firms reported using most of the IPM strategies than non-native plant firms (p < 0.01). The use of foot baths to reduce pathogen spread was not significantly different between native and non-native plant firms.
The percent of annual sales attributed to different plant types is presented in Figure 2. The plant type generating the highest percentage of annual sales across all firms was annuals (10% of annual sales), followed by other plants (9%), herbaceous perennials (8%), deciduous shade trees (8%), vegetables, fruits and herbs (7%), evergreen trees (6%), flowering potted plants (6%), deciduous shrubs (4%), broad-leaf evergreen shrubs (4%), Christmas trees (3%), tree fruits (3%), foliage (3%), propagules (3%), narrow-leaf evergreen shrubs (2%), vines and ground covers (2%), roses (1%), and sod (1%). Native plant firms reported higher portions of annuals sales from selling most types of plants when compared to non-native plant firms, except for annuals, flowering potted, foliage, and other plant types which accounted for a larger portion of non-native plant firms’ annual sales (p < 0.01).
Among the actions taken to address labor challenges (Figure 3), the most common strategy reported by all firms was paying higher wages (15.7% of firms), followed by doing nothing (15.6% of firms), training employees for better skills (9.1% of firms), adopting labor-saving technologies (9.0% of firms), other (6.1% of firms), and adding employee benefits (4.0% of firms). A higher proportion of non-native plant firms reported doing nothing compared to native plant firms (p < 0.05).
Table 2 illustrates that businesses who did not report any native plant sales had an estimated USD 2.1 million dollars in annual sales. Firms in the low native plant sales category reported an average of USD 2972.7 in annual sales of native plants, with 23.7% of all annual sales (which averaged USD 119,091.1) coming from native plants. Businesses in the medium native plant sales had on average USD 36,217.7 in annual sales of native plants, with 27.3% of all annual sales (which averaged USD 427,983.0) coming from native plants. Lastly, businesses in the high native plant sales had, on average, USD 1,354,767.0 in annual sales of native plants, with 58.7% of all annual sales (which averaged USD 4,250,971.0) coming from native plants.

4.2. Standard Probit Model Results

A standard probit model was used to assess how different production-related factors impacted firms’ probability of growing native plants. Results are shown in Model 1 in Table 3. Employing IPM strategies of infested plant removal, air circulation, hand weeding, mulch application, beneficial insect identification, beneficial insect use, and pest resistant varieties use improved a firm’s probability of selling native plants by 34.2%, 15.9%, 14.2%, 12.7%, 14.7%, 15.9% and 19.9%, respectively. The probability of selling native plants also increased when additional sales avenues were used (12.2%), more plant types were produced (10.9%), or the firms were primarily located in the Appalachian (25.1%) or Northeast (15.8%) regions of the U.S. The firm type did not significantly impact the probability of selling native plants. Firms with a portion of their annual sales attributed to deciduous shade trees, deciduous shrubs, broad-leaf evergreen shrubs, evergreen trees, vines and ground covers, herbaceous perennials, vegetables/fruits/herbs, Christmas trees, propagules, or other plants were more likely to sell native plants. Several factors decreased the firms’ probability of selling native plants. Reporting the use of the IPM strategies of foot baths and ventilation decreased a firm’s probability of selling native plants by 46.7% and 11.9%, respectively. If the firm participated in the 2019 survey, they were 20.6% less likely to sell native plants relative to the 2014 participants. Firms selling foliage plants or flowering potted plants were 0.4% less likely to sell native plants. None of the labor-related variables significantly impacted firms’ probabilities of selling native plants.

4.3. Ordered Probit Model Results

We further categorized the dependent variable by the volume of native plant sales (no sales, low, medium, and high native) for additional analysis. Table 3 Model 2 shows the coefficients and marginal effects of the ordered probit model. In other words, Model 2 shows the impact of the explanatory variables on the probability of businesses having high native plant sales (y = 4).
IPM strategies that increased a firm’s probability of being in the high native plant sales category included removing infested plants (4.16%; p < 0.01), circulating air (1.86%; p < 0.01), hand weeding (1.21%, p < 0.10), managing irrigation scheduling (1.32%; p < 0.05), using beneficial insects (2.30%; p < 0.01), and growing pest resistant varieties (1.15%; p < 0.05). Conversely, ventilation (−1.95%; p < 0.01) and using biopesticides (−1.43%; p < 0.10) decreased the probability of a business being in one of the high native plant sales categories.
Firm characteristics influenced the probability of a firm being in the high native plant sales category. Increasing the number of sales avenues (1.95%; p < 0.01) or selling a broader variety of plant types (1.14%; p < 0.01) increased the probability of being in the high native plant sales category. Firms located in the Appalachian (2.93%; p < 0.01), Northeast (1.87%; p < 0.05), Southcentral (2.50%; p < 0.05), or Southeastern U.S. (2.04%; p < 0.05) had an increased probability of being in the high native plant sales category. Conversely, participation in the 2019 survey (relative to the 2014 survey) decreased the probability of high native plant sales by 5.36%. Selling in wholesale or retail markets increased the probability of falling in the high native plant sales categories by 1.63% and 1.15%, respectively.
The percentage of different types of plants sold also influenced the probability of having high native plant sales. Increasing the percentage of sales attributed to deciduous shade trees (0.14%; p < 0.01), deciduous shrubs (0.11%; p < 0.01), broad-leaf evergreen shrubs (0.07%; p < 0.01), evergreen trees (0.17%; p < 0.01), vines and ground covers (0.11%; p < 0.01), herbaceous perennials (0.12%; p < 0.01), vegetables, fruits and herbs (0.04%; p < 0.05), Christmas trees (0.09%; p < 0.01), sod (0.08%; p < 0.05), propagules (0.10%; p < 0.01), and other plants (0.04; p < 0.01) increased the probability that a firm was in the high native plant sales category. Firms reporting a higher percentage of annual sales from annuals (−0.03%; p < 0.10), flowering potted plants (−0.08%; p < 0.01), and foliage plants (−0.07%; p < 0.01) had a lower probability of selling a higher proportion of native plants. Firms who were paying higher wages or taking other actions to address labor issues were 3.52% (p < 0.01) and 2.36% more likely to fall into the high native plants sales category.

5. Discussion

Interest and demand for native plants across several categories has steadily increased in the last decade as awareness of sustainable landscaping and sustainably produced plants has amplified their demand in the marketplace [61]. Consumers interest has generated a noteworthy niche market for native plants, resulting in a profitable industry despite challenges in production, marketing, and sales channels [4,62]. Some growers have capitalized on this consumer interest and increased native plant production, becoming experts in navigating the complexities of growing native plants, while others have remained out of the market perhaps due to the challenges of growing and commercializing native plants. Yet, lack of native plant availability is a continued barrier to widespread landscape use [61]. As green industry firms look for ways to diversify their plant offerings or expand into new markets, native plants could be a good fit. However, little is known about the competitive market for native plants, notably which types of nurseries are producing native plants and the types of production and business practices they implement. To date, research on native plants have focused on their benefits (e.g., environmental, ecosystem services, biodiversity) [10,12,18,19,21,26], production challenges [37,38,39,40], and market potential [4,5,35,53,54]. The production literature highlights challenges related to producing native plants; however, to date, a comprehensive assessment of current production methods used by native plant firms and how those differ from non-native plant growers has not been conducted. The current study addressed this research gap. Understanding production practice drivers for native plants supports the development of sustainable ecosystems in the built environment.
Survey results indicated production characteristics vary by native versus non-native plant firms and ultimately impact the native plant sales of firms. Firms growing native plants exhibited a greater use of IPM strategies (in general) relative to firms that did not grow native plants. This result may reflect both a more thoughtful approach to sustainable plant production practices as well as a greater diversity of plant offerings by native plant firms. Greater diversity of plants grown in any given operation increases the complexity of IPM strategies used to address a broader array of pest and disease challenges, and the specialized labor to implement them. Current research suggest that native species serve to enhance biodiversity, which can reduce disease and pest pressure [12,13,14,63,64]. Several of the IPM strategies (e.g., water and nutrition management, bio-protection) were previously identified as strategies to improve biodiversity in agricultural systems [16]. The IPM results of the current study indicate that native plant growers use a diverse array of strategies to manage pests. This may be derived from the various types of plants grown, or it may align with the firms’ commitment to sustainability. Specifically, the firms who use a more diverse IPM portfolio are invested in minimizing loss due to pests and disease but are also working to minimize pest and disease resistance to current treatment options [12,13,14,63,64]. The results of this study add to the discussion around native plant production and commonly utilized IPM strategies. IPM strategies of removing infested plants, air circulation, beneficial insects, irrigation management, and using pest-resistant varieties were more likely to be used by firms selling native plants than non-native plant firms. However, footbaths were more likely to be used by firms not selling native plants, which may reflect that this strategy is primarily used in greenhouse operations that produce fast-growing crops such as annual bedding plants and flowering potted plants.
When considering firms’ use of different marketing channels and plants produced, native plant firms exhibited a greater diversity of sales avenues used and product portfolios. Supporting evidence highlights the potential benefits to biodiversity of pollinator insects when growing native plants [22]. Furthermore, as previously discussed in the IPM section, increasing biodiversity decreases disease and pest pressure and measures taken to control these issues [12,13,14,16,63,64]. Consequently, producing multiple species may aid in reducing production costs associated with pests and disease. Firms selling more native plants displayed greater diversity in the plant types sold, while non-native firms sold more annuals, flowering potted plants, foliage plants, and other plants. Although not specifically addressed in this study, the greater diversity generally exhibited by native plant growers may help define native plant firms in that they are not benefiting from economies of scale (i.e., mass producing a single species or type of plant), but rather are fitting niche markets and specializing in filling a variety of gardeners’ needs. Many native plant firms are smaller than mainstream commercial nurseries (as highlighted by the results in Table 2). Thus, they carry a wider variety of plants and cast a wider retailer net to reach a larger portion of native niche markets.

6. Conclusions

Firms selling native plants had characteristics that differed from other green industry firms. These characteristics are notable for their progressive nature: they implemented more IPM practices than non-native nurseries, grew a greater variety of plant species, and sold plant products to a greater diversity of outlets. In short, they paid attention to the many ways to cause their firm to be more profitable by examining and adopting differentiation strategies that resulted in higher quality crops available for greater market prices.
Establishing progressive production and business practices related to native nursery crop production provides exclusive opportunities for firms to specialize in difficult-to-grow species. Specializing as a firm allows employees to gain unique skills, making them highly valuable in the industry and justifying the labor-saving tactic of increasing wages to retain employees. Each of these choices can result in greater economic security for firms engaging in the somewhat risky practice of growing difficult-to-produce native plant species to a marketable finished product. Not only can native plants be challenging to propagate (find seeds, navigate dormancy requirements, determine best practices for cloning, etc.), but many native plants have long production times, resulting in less frequent crop turnover in available production space. Finished products must be uniform and of high quality to draw a price sufficient to warrant production. Limited production quantities are another challenge, which often results in the substitution of plants specified in a landscape design with alternative choices that may not be native or may not provide the same ecological functions.
Firms growing native plants vary in how and what they grow, but the reason for these differences is less clear. Available markets and sales strategies likely influence a firm’s willingness to compete in the native plant marketplace. As such, firms considering growing or increasing their production of native plants should conduct a market analysis to determine if producing native plants is right for their business. Implementing more IPM practices at nursery facilities may enhance firms’ ability to produce high-quality native plants.
With consumer interest in native plants increasing, determining appropriate, regionally specific native plant species suited to production and sales will be key to broadening the available native plant palettes. In addition to delivering high quality native plants to retail outlets, providing informative retail signage and seasonal employee education may enhance sales volume and landscape use of sustainable native plants.
While challenges abound, opportunities for growth are widespread in the native plants market. Changes in nursery practices, as examined in this study, could result in a greater number and diversity of native plants available for use in sustainable landscapes, supporting biodiversity and pollination.

Supplementary Materials

The following supporting information can be downloaded at: https://www.mdpi.com/article/10.3390/su14116774/s1, Figure S1: Research question diagram; Table S1: Variable and variable descriptions generated from a U.S. green industry firm survey conducted in 2014 and 2019.

Author Contributions

Conceptualization, A.L.R. and M.J.K.; methodology, A.L.R., M.J.K., A.P.T., H.K. and M.A.P.; validation, A.L.R., M.J.K., A.P.T. and M.A.P.; formal analysis, A.L.R., M.J.K. and A.P.T.; resources, A.L.R. and H.K.; data curation, A.L.R. and H.K.; writing—original draft preparation, A.L.R., M.J.K., B.J.P. and J.H.C.; writing—review and editing, C.R.B., B.J.P., M.A.P. and H.K.; visualization, A.L.R. and M.J.K.; supervision, A.L.R.; project administration, H.K.; funding acquisition, H.K. All authors have read and agreed to the published version of the manuscript.

Funding

This project was supported by a grant from The Horticulture Research Institute, 1200 G Street NW, Suite 800, Washington DC 20005 (project #5927314), and cost sharing provided by the University of Florida and Texas A&M University. The National Green Industry Survey is conducted by the Green Industry Research Consortium of horticulturists and agricultural economists at U.S. land grant univer- sities, organized as the S-1065 Multi-state project under the USDA-National Institute for Food and Agriculture (NIFA).

Institutional Review Board Statement

The study was conducted in accordance with the Declaration of Helsinki, and approved by the Institutional Review Board of University of Florida, protocol code IRB201900829, 4/18/2019.

Informed Consent Statement

Written informed consent was obtained from all subjects involved in the study.

Data Availability Statement

Not applicable.

Conflicts of Interest

The authors declare no conflict of interest. The funders had no role in the design of the study; in the collection, analyses, or interpretation of data; in the writing of the manuscript; or in the decision to publish the results.

References

  1. Hall, C.R.; Hodges, A.W.; Khachatryan, H.; Palma, M.A. Economic contributions of the green industry in the United States in 2018. J. Environ. Hortic. 2020, 38, 73–79. [Google Scholar] [CrossRef]
  2. U.S. Forest Service, United States Department of Agriculture. Native Plant Materials. Available online: https://www.fs.fed.us/wildflowers/Native_Plant_Materials/ (accessed on 4 June 2021).
  3. Griffin, J.J. IBA formulation, concentration, and stock plant growth stage affect rooting of stem cuttings of Viburnum rufidulum. J. Environ. Hortic. 2008, 26, 1–3. [Google Scholar] [CrossRef]
  4. Rupp, L.A.; Anderson, R.M.; Klett, J.; Love, S.L.; Goodspeed, J.; Gunnell, J. Native and adapted plant introduction for low-water landscaping. HortTechnology 2018, 28, 431–435. [Google Scholar] [CrossRef] [Green Version]
  5. Zadegan, Y.R.; Behe, B.K.; Gough, R. Consumer preferences for native plants in Montana residential landscapes and perceptions for naturalistic designs. J. Environ. Hortic. 2008, 26, 109–114. [Google Scholar] [CrossRef]
  6. Kauth, P.J.; Pérez, H.E. Industry survey of the native wildflower market in Florida. HortTechnology 2011, 21, 779–788. [Google Scholar] [CrossRef] [Green Version]
  7. U.S. Census Bureau. Quarterly Starts and Completions by Purpose and Design. Available online: https://www.census.gov/construction/nrc/pdf/quarterly_starts_completions.pdf (accessed on 4 June 2021).
  8. Daly, J. Nursery & Garden Stores in the U.S. IBISWorld, US Industry (NAICS) Report 44422. Available online: https://www.ibisworld.com/united-states/market-research-reports/nursery-garden-stores-industry/ (accessed on 19 April 2022).
  9. Natural Resources Conservation Service, United States Department of Agriculture. Native Plants. Available online: https://www.nrcs.usda.gov/wps/portal/nrcs/detail/national/newsroom/features/?cid=nrcs143_023590 (accessed on 4 June 2021).
  10. Reichard, S.H.; White, P. Horticulture as a pathway of invasive plant introductions in the United States. BioScience 2001, 51, 103–113. [Google Scholar] [CrossRef]
  11. Pimentel, D.; Zuniga, R.; Morrison, D. Update on the environmental and economic costs associated with alien-invasive species in the United States. Ecol. Econ. 2005, 52, 273–288. [Google Scholar] [CrossRef]
  12. Raupp, M.J.; Cumming, A.B.; Raupp, E.C. Street tree diversity in eastern North America and its potential for tree loss to exotic borers. Aboric. Urban For. 2006, 32, 297–304. [Google Scholar] [CrossRef]
  13. Gibbons, S.M.; Lekberg, Y.; Mummey, D.L.; Sangwan, N.; Ramsey, P.W.; Gilbert, J.A. Invasive plants rapidly reshape soil properties in a grassland ecosystem. mSystems 2017, 2, e00178-16. [Google Scholar] [CrossRef] [Green Version]
  14. Kourtev, P.S.; Ehrenfeld, J.G.; Häggblom, M. Experimental analysis of the effect of exotic and native plant species on the structure and function of soil microbial communities. Soil Biol. Biochem. 2003, 35, 895–905. [Google Scholar] [CrossRef]
  15. Wilcove, D.S.; Rothstein, D.; Dubow, J.; Phillips, A.; Losos, E. Quantifying threats to imperiled species in the United States. BioScience 1998, 48, 607–615. [Google Scholar] [CrossRef] [Green Version]
  16. Luty, L.; Musiał, K.; Zioło, M. The role of selected ecosystem services in different farming systems in Poland regarding the differentiation of agricultural land structure. Sustainability 2021, 13, 6673. [Google Scholar] [CrossRef]
  17. Minixhofer, P.; Stangl, R. Green infrastructures and the consideration of their soil-related ecosystem services in urban areas—a systematic literature review. Sustainability 2021, 13, 3322. [Google Scholar] [CrossRef]
  18. Burghardt, K.T.; Tallamy, D.W.; Philips, C.; Shropshire, K.J. Non-native plants reduce abundance, richness, and host specialization in lepidopteran communities. Ecosphere 2010, 1, 1–22. [Google Scholar] [CrossRef]
  19. Seitz, N.; van Engelsdorp, D.; Leonhardt, S.D. Are native and non-native pollinator friendly plants equally valuable for native wild bee communities? Ecol. Evol. 2020, 10, 12838–12850. [Google Scholar] [CrossRef] [PubMed]
  20. Wilde, H.D.; Gandhi, K.J.K.; Colson, G. State of the science and challenges of breeding landscape plants with ecological function. Hortic. Res. 2015, 2, 14069. [Google Scholar] [CrossRef] [Green Version]
  21. Frankie, G.; Pawelek, J.; Chase, M.H.; Jadallah, C.C.; Feng, I.; Rizzardi, M.; Thorp, R. Native and non-native plants attract diverse bees to urban gardens in California. J. Pollinat. Ecol. 2019, 25, 16–23. [Google Scholar] [CrossRef]
  22. Cecala, J.M.; Wilson Rankin, E.E. Wild bee functional diversity and plant associations in native and conventional plant nurseries. Ecol. Entomol. 2021, 46, 1283–1292. [Google Scholar] [CrossRef]
  23. Zaninotto, V.; Thébault, E.; Dajoz, I. Native and exotic plants play different roles in urban pollination networks across seasons. Res. Sq. 2022, Preprint. [Google Scholar] [CrossRef]
  24. Berthon, K.; Thomas, F.; Bekessy, S. The role of ‘nativeness’ in urban greening to support animal biodiversity. Landsc. Urban Plan. 2021, 205, 103959. [Google Scholar] [CrossRef]
  25. Narango, D.L.; Tallamy, D.W.; Marra, P.P. Native plants improve breeding and foraging habitat for an insectivorous bird. Biol. Conserv. 2017, 213, 42–50. [Google Scholar] [CrossRef]
  26. Burghardt, K.T.; Tallamy, D.W.; Shriver, W.G. Impact of native plants on bird and butterfly biodiversity in suburban landscapes. Conserv. Biol. 2009, 23, 219–224. [Google Scholar] [CrossRef] [PubMed]
  27. Kermath, B. Why go native? Landscaping for biodiversity and sustainability education. Int. J. Sustain. High. Educ. 2007, 8, 210–223. [Google Scholar] [CrossRef]
  28. Phondani, P.C.; Bhatt, A.; Elsarrag, E.; Alhorr, Y.M. Seed germination and growth performance of Aerva javanica (Burm.f.) Juss ex Schult. J. Appl. Res. Med. Aromat. Plants 2015, 2, 195–199. [Google Scholar] [CrossRef]
  29. Gómez-Baggethun, E.; Gren, Å.; Barton, D.N.; Langemeyer, J.; McPhearson, T.; O’Farrell, P.; Andersson, E.; Hamstead, Z.; Kremer, P. Urban ecosystem services. In Urbanization, Biodiversity and Ecosystem Services: Challenges and Opportunities; Elmqvist, T., Fragkias, M., Goodness, J., Güneralp, B., Marcotullio, P.J., McDonald, R.I., Parnell, S., Schewenius, M., Sendstad, M., Seto, K.C., et al., Eds.; Springer: Dordrecht, The Netherlands, 2013. [Google Scholar] [CrossRef] [Green Version]
  30. White, M.P.; Alcock, I.; Grellier, J.; Wheeler, B.W.; Hartig, T.; Warber, S.L.; Bone, A.; Depledge, M.H.; Fleming, L.E. Spending at least 120 minutes a week in nature is associated with good health and wellbeing. Sci. Rep. 2019, 9, 7730. [Google Scholar] [CrossRef] [Green Version]
  31. Hall, C.; Knuth, M. An update of the literature supporting the well-being benefits of plants: A review of the emotional and mental health benefits of plants. J. Environ. Hortic. 2019, 37, 30–38. [Google Scholar] [CrossRef]
  32. Hall, C.; Knuth, M. An update of the literature supporting the well-being benefits of plants: Part 2—Physiological health benefits. J. Environ. Hortic. 2019, 37, 63–73. [Google Scholar] [CrossRef]
  33. Hall, C.; Knuth, M. An update of the literature supporting the well-being benefits of plants: Part 3—Social benefits. J. Environ. Hortic. 2019, 37, 136–142. [Google Scholar] [CrossRef]
  34. Velarde, J.G.; Parejo, M.J.M.; Blanco, J.H.; Moruno, L.G. Using native vegetation screen to lessen the visual impact of rural buildings in the Sierras de Béjar and Francia Biosphere Reserve: Case studies and public survey. Sustainability 2019, 11, 2595. [Google Scholar] [CrossRef] [Green Version]
  35. Gillis, A.J.; Swim, J.K. Adding native plants to home landscapes: The roles of attitudes, social norms, and situational strengths. J. Environ. Psychol. 2020, 72, 101519. [Google Scholar] [CrossRef]
  36. Standish, R.J.; Hobbs, R.J.; Miller, J.R. Improving city life: Options for ecological restoration in urban landscapes and how these might influence interactions between people and nature. Landsc. Ecol. 2013, 28, 1213–1221. [Google Scholar] [CrossRef] [Green Version]
  37. White, A.; Fant, J.B.; Havens, K.; Skinner, M.; Kramer, A.T. Restoring species diversity: Assessing capacity in the U.S. native plant industry. Restor. Ecol. 2018, 26, 605–611. [Google Scholar] [CrossRef]
  38. Griffith-Gardner, J.; Lubell, J.D.; Brand, M.H. Propagation of Comptonia peregrina L. from stem cuttings. HortScience 2019, 54, 511–513. [Google Scholar] [CrossRef] [Green Version]
  39. Miller, B.M.; Graves, W.R. Root pruning and auxin alter root morphology of hickories. HortScience 2019, 54, 1517–1520. [Google Scholar] [CrossRef]
  40. Lubell, J.D.; Gardner, J.A.G. Production of three eastern U.S. native shrubs: Effects of auxin concentration on rooting and shade level on container plant growth. HortTechnology 2017, 27, 375–381. [Google Scholar] [CrossRef]
  41. Hall, C.R.; Hodges, A.W.; Palma, M.A. Sales, trade flows and marketing practices within the US nursery industry. J Environ. Hortic. 2011, 29, 14–24. [Google Scholar] [CrossRef]
  42. Beck, T.B.; Heimlich, J.E.; Quigley, M.F. Gardeners’ perceptions of the aesthetics, manageability, and sustainability of residential landscapes. Appl. Environ. Educ. Commun. 2002, 1, 163–172. [Google Scholar] [CrossRef]
  43. Norcini, J. Native Plants: An Overview. Environmental Horticulture Department, UF/IFAS Extension Publication ENH1045. Available online: https://edis.ifas.ufl.edu/publication/EP297 (accessed on 4 June 2021).
  44. Brzuszek, R.F.; Harkess, R.L. A green industry survey of native plant marketing in the southeastern United States. HortTechnology 2009, 19, 168–172. [Google Scholar] [CrossRef] [Green Version]
  45. Behe, B.K.; Campbell, B.L.; Khachatryan, H.; Dennis, J.H.; Yue, C. Consumer preferences for local and sustainable plant production characteristics. HortScience 2013, 48, 200–208. [Google Scholar] [CrossRef] [Green Version]
  46. Isaak, M.; Lentz, W. Consumer preferences for sustainability in food and non-good horticulture production. Sustainability 2020, 12, 7004. [Google Scholar] [CrossRef]
  47. Potts, L.E.; Roll, M.J.; Wallner, S.J. Colorado native plant survey—Voices of the green industry. Nativ. Plants J. 2002, 3, 121–125. [Google Scholar]
  48. U.S. Forest Service. Native Gardening. Available online: https://www.fs.fed.us/wildflowers/Native_Plant_Materials/Native_Gardening/index.shtml (accessed on 4 June 2021).
  49. Nassauer, J.I. Messy ecosystems, orderly frames. Landsc. J. 1995, 14, 161–170. [Google Scholar] [CrossRef] [Green Version]
  50. Berkowitz, B.N.; Medley, K.E. Home gardenscapes as sustainable landscape management on St. Eustatius, Dutch Caribbean. Sustainability 2017, 9, 1310. [Google Scholar] [CrossRef] [Green Version]
  51. Davis, B.E.; Chappell, M.R.; Schwevens, J.D. Using native plants in traditional design contexts: Smilax smallii provides an example. Nativ. Plants J. 2012, 13, 27–34. [Google Scholar] [CrossRef]
  52. Fischer, A.; Selge, S.; van der Wal, R.; Larson, B.M.H. The public and professionals reason similarly about the management of non-native invasive species: A quantitative investigation of the relationship between beliefs and attitudes. PLoS ONE 2014, 9, e105495. [Google Scholar] [CrossRef] [Green Version]
  53. Helfand, G.E.; Park, J.S.; Nassauer, J.I.; Kosek, S. The economics of native plants in residential landscape designs. Landsc. Urban Plan. 2006, 78, 229–240. [Google Scholar] [CrossRef] [Green Version]
  54. Yue, C.; Hurley, T.M.; Anderson, N. Do native and invasive labels affect consumer willingness to pay for plants? Evidence from experimental auctions. Agric. Econ. 2010, 42, 195–205. [Google Scholar] [CrossRef]
  55. Westerhold, C.M.; Wortman, S.; Todd, K.; Golick, D. Knowledge of pollinator conservation and associated plant recommendations in the horticultural retail industry. HortTechnology 2018, 28, 529–538. [Google Scholar] [CrossRef]
  56. Campbell, B.; Khachatryan, H.; Rihn, A. Pollinator-friendly plants: Reasons for and barriers to purchase. HortTechnology 2017, 27, 831–839. [Google Scholar] [CrossRef]
  57. Hodges, A.W.; Khachatryan, H.; Hall, C.R.; Palma, M.A. Production and marketing practices and trade flows in the United States green industry, 2013. J. Environ. Hortic. 2015, 33, 125–136. [Google Scholar] [CrossRef]
  58. Khachatryan, H.; Hodges, A.W.; Hall, C.R.; Palma, M.A. Production and marketing practices and trade flows in the United States green industry, 2018. South. Coop. Ser. Bull. 2020, 421, 2020. [Google Scholar]
  59. Caplan, S.; Tilt, B.; Hoheisel, G.; Baugher, T.A. Specialty crop growers’ perspective on adopting new technologies. HortTechnology 2014, 24, 81–87. [Google Scholar] [CrossRef] [Green Version]
  60. Long, J.S.; Freese, J. Regression Models for Categorical Dependent Variables Using Stata, 2nd ed.; Stata Press: College Station, TX, USA, 2006; pp. 184–187. [Google Scholar]
  61. Kramer, A.T.; Crane, B.; Downing, J.; Hamrick, J.L.; Havens, K.; Highland, A.; Jacobi, S.K.; Kaye, T.N.; Lonsdorf, E.V.; Ramp Neale, J.; et al. Sourcing native plants to support ecosystem function in different planting contexts. Restor. Ecol. 2019, 27, 470–476. [Google Scholar] [CrossRef]
  62. Thomas, M.; Jensen, K.; Velandia, M.; Clark, C.; English, B.; Lambert, D.; Walker, F. Outdoor home gardener preferences for environmental attributes in gardening supplies and use of ecofriendly gardening practices. HortTechnology 2020, 30, 552–563. [Google Scholar] [CrossRef]
  63. Simon, S.; Bouvier, J.-C.; Debras, J.-F.; Sauphanor, B. Biodiversity and pest management in orchard systems. Agron. Sustain. Dev. 2010, 30, 139–152. [Google Scholar] [CrossRef] [Green Version]
  64. Barrios, E.; Valencia, V.; Jonsson, M.; Brauman, A.; Hairiah, K.; Mortimer, P.E.; Okubo, S. Contribution of trees to the conservation of biodiversity and ecosystem services in agricultural landscapes. Int. J. Biodivers. Sci. Ecosyst. Serv. Manag. 2018, 14, 1–16. [Google Scholar] [CrossRef] [Green Version]
Figure 1. Integrated pest management (IPM) strategies employed by U.S. green industry firms from a survey conducted in 2014 and 2019. * Indicates significance at the 5% level between non-native plant sales firms and native plant sales firms. Pairwise t-tests were used to estimate significance between the firms.
Sustainability 14 06774 g001
Figure 2. Percent of annual sales attributed to different plant types reported by U.S. green industry firms from a survey conducted in 2014 and 2019. * Indicates significance at the 5% level between non-native plant sales firms and native plant sales firms. Pairwise t-tests were used to estimate significance between the firms.
Sustainability 14 06774 g002
Figure 3. Percent of sample taking different actions to address labor issues as reported by U.S. green industry firms from a survey conducted in 2014 and 2019. * Indicates significance at the 5% level between non-native plant sales firms and native plant sales firms. Pairwise t-tests were used to estimate significance between the firms.
Sustainability 14 06774 g003
Table 1. Firm summary statistics from U.S. green industry firm surveys conducted in 2014 and 2019.
VariablesTotal Firms (n = 4641) Non-Native Plant Sales Firms (n = 2638) a Native Plant Sales Firms (n = 2003) a
MeanSDMeanSDMeanSDp-value b
Survey Year 2019 (% of sample)0.4510.4980.4940.5000.3950.4890.000
Native Plant Annual Sales (USD 1000)207.7541711.0160.0000.000435.5262458.558---
Sales Avenues0.9501.1860.7151.0771.2601.2500.000
Plant_index3.1163.3021.9632.5224.6363.5830.000
Appalachian0.1080.3100.0920.2890.1280.3340.000
Great Plains0.0270.1630.0280.1650.0260.1590.664
Mountain0.1920.3940.0390.1930.0340.1810.397
Midwest0.0370.1880.1980.3990.1830.3870.183
Northeast0.1920.3940.1800.3840.2090.4070.012
Pacific0.1020.3030.1050.3070.0970.2970.371
Southcentral0.0710.2570.0690.2530.0740.2620.448
Southeast0.2720.4450.2890.4530.2490.4320.002
Wholesale0.3920.4880.3680.4820.4220.4940.000
Retail0.2510.4340.2350.4240.2720.4450.004
Landscape0.1890.3910.2120.4090.1580.3650.000
Other business type0.0350.1840.0370.1880.0320.1770.427
a Native production was determined by the percentage of annual sales attributed to native plants. Firms indicating any of their sales were due to native plants were classified as “native firms” (1 = native firms; 0 = otherwise). Firms who did not have any of their sales attributed to native plants were classified as “non-native firms”. b Pairwise t-tests were used to estimate significance between native and non-native firms.
Table 2. Annual plant sales: information for native plant firms divided by reported native plant sales.
Native Sales Categories aNEstimated Annual SalesSales of Natives% Natives Sold b
MeanSDMeanSDMeanSD
No Native Plant Sales2639USD 2,144,203.001,040,000.0----
Low Native Plant Sales651USD 119,091.10160,040.10USD 2972.712596.1223.6732.40
Medium Native Plant Sales729USD 427,983.20772,336.6USD 36,217.6823,034.1527.3328.32
High Native Plant Sales623USD 4,250,971.009,118,406.0USD 1,354,767.004,267,275.0058.5037.54
a Categories were based on annual native plant sales estimates. The “no native plant sales” group did not indicate having native plant sales (either through blank or 0 responses). The “low” group had less than $9000 in native plant sales annually. The “medium” group had USD 9000–USD 90,000 in native plant sales annually. The “high” group had >USD 90,000 in native plant sales annually. b % Natives Sold indicates the reported percent of annual sales attributed to native plant sales by the firms.
Table 3. Estimates showing impact of firm-related variables on probability of selling native plants and having high native plant sales.
Model 1—Standard Probit ModelModel 2—Ordered Probit Model
Integrated Pest Management (IPM) StrategiesCoefficientSEp-ValueCoefficientMarginal Effectsp-Value
Remove infested plants0.3420.0600.0000.2904.160.000
Alternate pesticides−0.0340.0550.5330.0220.310.637
Air circulation0.1590.0530.0030.1291.860.004
Hand weeding0.1420.0530.0080.0841.210.069
Disinfect benches−0.0370.0610.542−0.028−0.400.592
Foot baths−0.4670.1720.006−0.268−3.840.053
Solarization0.0710.0950.4540.0520.750.505
Tarps and sticky boards−0.0610.0640.340−0.047−0.670.393
Protect beneficials0.0130.0600.8240.0851.220.088
Mulch application0.1270.0530.0170.0701.010.112
Beneficial insect id0.1470.0630.0200.0520.750.311
Inspect new stock0.0120.0520.8210.0090.120.845
Manage irrigation0.0750.0550.1720.0921.320.045
Spot treat0.0050.0520.9270.0220.320.621
Ventilate−0.1190.0590.043−0.136−1.950.006
Use beneficial insects0.1590.0710.0250.1602.300.005
Keep pest records0.0300.0730.6850.0991.420.104
Adjust fertilizer rates−0.0210.0590.7170.0270.390.577
Screening/barriers0.0570.0850.5040.0350.500.609
Biopesticides−0.0880.0680.199−0.100−1.430.080
Retention pond water−0.0560.1490.7060.1331.910.243
Pest resistant varieties0.1990.0570.0000.0801.150.085
Firm Characteristics
Survey Year 2019−0.2060.0910.023−0.374−5.360.000
Sales Avenues0.1220.0220.0000.1361.950.000
Plant_index0.1090.0090.0000.0801.140.000
Appalachian0.2510.0840.0030.2042.930.004
Greatplain−0.0810.1380.555−0.186−2.670.122
Mountain−0.0030.1250.983−0.007−0.100.947
Northeast0.1580.0710.0260.1301.870.031
Pacific−0.0100.0860.905−0.041−0.590.579
Southcentral0.1180.0980.2290.1752.500.034
Southeast0.1300.0710.0670.1432.040.021
Wholesale0.0510.0610.4030.1131.630.036
Retail0.0920.0520.0760.0801.150.079
Landscape−0.0970.0660.143−0.080−1.150.163
Other business type0.0150.1180.902−0.010−0.140.926
% of Sales by Plant Type
Deciduous shade trees0.0100.0010.0000.0100.140.000
Deciduous shrubs0.0090.0020.0000.0080.110.000
Broad-leaf evergreen shrubs0.0050.0020.0080.0050.070.002
Narrow-leafed evergreen shrubs0.0050.0030.0820.0040.050.147
Evergreen trees0.0120.0010.0000.0120.170.000
Vines and ground covers0.0080.0030.0010.0080.110.000
Roses0.0010.0030.6610.0010.010.761
Herbaceous perennials0.0090.0010.0000.0080.120.000
Annuals−0.0010.0010.342−0.002−0.030.054
Vegetables, fruits, herbs0.0040.0010.0050.0020.040.029
Flowering potted plants−0.0040.0010.011−0.005−0.080.000
Christmas trees0.0070.0010.0000.0070.090.000
Tree fruits0.0020.0020.1350.0010.020.443
Foliage−0.0040.0020.040−0.005−0.070.007
Sod0.0030.0030.2690.0050.080.028
Propagules0.0080.0020.0000.0070.100.000
Other plants0.0030.0010.0010.0030.040.001
Actions to Address Labor Issues
Adopting labor-saving technology−0.0490.0890.587−0.055−0.790.486
Paying higher wages0.1200.0890.1770.2453.520.003
Training employees for better skills0.0660.0940.4820.0971.390.244
Adding employee benefits−0.0990.1290.4460.0590.840.599
Nothing0.0880.0920.3410.0831.200.328
Other actions0.1360.1070.2040.1652.360.075
Constant−1.5950.0840.000---
Threshold_1 a--- 1.3560.14
Threshold_2 a--- 1.8500.14
Threshold_3 a --- 2.5410.15
Log Pseudolikelihood−2353.31 −4538.67
LR Chi21427.48 1658.60
Prob F0.000 0.000
R-squared0.258 0.155
N4641 4641
a Threshold parameters are the estimated latent variable cut point used to differentiate the annual native sales categories in the ordered probit model (Model 2).
Publisher’s Note: MDPI stays neutral with regard to jurisdictional claims in published maps and institutional affiliations.

