Article

Molecular Dynamics Simulation and Experiment on the Microscopic Mechanism of the Effect of Wax Crystals on the Burst and Drainage of Foams

National Engineering Laboratory for Pipeline Safety, MOE Key Laboratory of Petroleum Engineering, Beijing Key Laboratory of Urban Oil and Gas Distribution Technology, China University of Petroleum (Beijing), Beijing 102249, China
*
Author to whom correspondence should be addressed.
Sustainability 2022, 14(11), 6778; https://doi.org/10.3390/su14116778
Submission received: 5 May 2022 / Revised: 25 May 2022 / Accepted: 30 May 2022 / Published: 1 June 2022

Abstract

:
In recent years, with the goal of “carbon peaking and carbon neutralization”, the CO2 flooding technology in carbon capture, utilization, and storage (CCUs) has been paid great attention to the oil fields. However, the CO2 flooding of crude oil may produce foams in the oil and gas separation process. In addition, the precipitation of wax components in crude oil might enhance the stability characteristics of these foams and lower the separator’s efficiency. Based on a crude oil depressurization foaming device, the influence of wax crystals on the bursting of oil foam was studied using simulated oil, and the microstructure of the wax crystal and foam liquid film was observed using freeze-etching and microscopic observation. In addition, the gas–liquid interface model of the wax oil was established by a molecular dynamics (MD) simulation to analyze the influence mechanism of wax crystals on foam drainage and gas diffusion among foams in the microlayer. The results show that the precipitation of wax crystals overall reduces the rate of defoaming and drainage and increases the grain diameter of the foam. The formation and growth of the wax crystal-shaped network impede the flow of liquid in the drainage channel and stabilize the foam. Moreover, it impedes the diffusion of CO2 among foams, inhibiting the bursting of the foams. The results of the combined experiments and MD simulation verify the accuracy and applicability of the molecular model, which further clarifies the effect of wax crystals on foam stability and its mechanism of action on foam film. These findings are a benchmark for the enhancement of defoaming and separation efficiency and a theoretical framework for future study and modeling.

1. Introduction

Foam has been widely applied in many fields, including the food, cosmetics, firefighting, mineral flotation, and petroleum industries [1]. The existence of foams may cause problems in the oil and gas industry [2]. In the separation process at a gathering and transmission station, a large amount of gas may be dissolved in the crude oil flooded by CO2 and was released from crude oil due to depressurization, generating foams. A large accumulation of foams causes the low efficiency of the separator. In addition, a large number of natural surfactants, including resins, asphaltenes, and wax crystals in crude oil, stabilizes the foams even more, potentially causing damage to downstream equipment [3]. The wax crystals are a complicated yet crucial component of these. They are composed of straight-chain alkanes with carbon numbers ranging from 16 to 70 [4]. The dissolved wax molecules precipitate into solid particles when the temperature and pressure change through phase transformations. The wax crystals diffuse in the plateau border (PB) and adsorb onto the foam films of crude oil foams, affecting the stability of the foam [2]. Therefore, to provide a theoretical basis for the defoaming of crude oil and a guarantee of the efficient operation of the separator, it is necessary to deeply understand the movement of wax crystals in foams and the intrinsic mechanism of the effect of wax crystals on the foam characteristics.
The bubble of crude oil foam is spherical and composed of separated gas and continuous crude oil. The gas is dispersed in a network composed of liquid film, PB, and node [5]. The bursting mechanism of foam is mainly due to drainage, coarsening, and coalescence [6,7]. The drainage is the flow of liquid in the network formed by the film, PB, and node under gravity and capillary forces. The foam spacing decreases until it leaves only a layer of film, and the foams distort from spherical to polygonal. Coarsening is when the difference in curvature radius between foams causes the pressure difference between a large bubble and a small bubble, resulting in the gas diffusing through the liquid film. When drainage is completed and the critical liquid holdup of foams is reached, the liquid film of foams become thin and ruptured, leading to foam coalescence and bursting [8,9].
The wax crystals in crude oil precipitate into solid particles only at temperatures below the wax appearance temperature (WAT). Research on the effect of wax crystals on the decay mechanism of crude oil foam is quite limited. Shrestha and other researchers [10,11] concluded that the wax content in crude oil determined the rheological properties and that the precipitation of wax crystals interfered with the surface rheological properties of crude oil, affecting foaming features. Binks et al. [12] demonstrated that wax crystals increased the viscosity and reduced the flow of crude oil. Blázquez et al. [1] considered wax crystals as solid particles, affecting the stability of foams.
The influence of solid particles on foams and emulsions has been widely studied compared to wax crystals [13]. The solid particles are found to be attached to interfaces to reduce the gas diffusion between bubbles, causing less coalescence and thus stabilized foams [14]. Binks et al. [15] found that a large number of particles increased the viscosity of the liquid phase in foam, resulting in a lower drainage rate. In various studies, the shape and size of particles have played a significant role in the stabilization of foams and emulsions. Smaller particles stabilize emulsion much more efficiently than large ones because of their better surface coverage in the interfaces and the large particles flocculating freely in the continuous phase. Kaptay [16] concluded that particles below 3 µm were effectively stabilized foam. However, some researchers [17,18] found that only particles with a certain size range are effectively stabilizing air foams, which were more affected by particle size than emulsions. Sethumadhavan et al. [19] found that flaky crystals generally stabilized foams because of the flat surface attached to liquid film. Furthermore, the spherical particles stabilized the foam sheet better than sharp-edged particles that destroyed the foam film faster. On the other hand, Madivala et al. [20] revealed that spherical particles could not stabilize due to a low aspect ratio, which is defined as the ratio of major to minor dimensions. In addition, many studies have clearly shown that the unique network is critical for the stability of oil foams. Even needle-shaped particles may aid in the stabilization of oil foams by forming a more robust network efficiently [21].
In addition to experiments, molecular dynamics (MD) simulations have been widely used to explore the effect of wax crystals on the characteristics of crude oil. The MD simulation method can analyze the microscopic characteristics and the mechanism of wax crystals from the molecular level. Gan et al. [22] studied the effect of temperature, pressure, water, and asphaltene on the wax precipitation processes with paraffin molecules simulated by nhexacosane (C26H54) and noctatriacontane (C38H78), which found that the increase in temperature and water decreased the wax precipitation, and the asphaltene also enhanced the wax precipitation. Chen et al. [23] investigated the effect of a magnetic field on waxy oil using the same paraffin molecule model. In addition, Wu et al. [24] utilized the n-alkane of C18H38 to simulate the wax crystal, and Samieadel et al. [25] employed n-C11H24 to simulate paraffin. In Jang’s work [26], n-C32 was used to simplify wax compound for MD simulation. However, few researchers have paid attention to the influence of wax crystals on the interfacial properties of crude oil foam through MD, let alone the combination of MD simulations and experiments.
Thus, in the experiment, the effect of wax crystals on non-aqueous foam characteristics was studied using simulated oil without asphaltene and resin. The effect of wax crystals on the defoaming and structural characteristics of oil-based foam was analyzed to reseal the mechanism of influence of wax crystals on foam drainage from a microscopic perspective. In addition, by using an MD simulation system, a model of foam film was created to study the spatial arrangement of wax crystals on the foam liquid film and determine the impediment to gas diffusion and the reduction in wax crystal interfacial tension. The study of experiment and MD simulation was aimed at deepening the understanding of the mechanism of foam bursting and provides a reference for crude oil defoaming and the safe and efficient operation of the separator.

2. Materials and Methods

2.1. Experimental Section

2.1.1. Materials

N2 with a purity of 99.9% and CO2 with a purity of 99.99% were purchased from Beijing Yongsheng Gas Technology Company (Beijing, China). White oil was supplied by Shenzhen Zhongruntong Chemical Co., Ltd. (Shenzhen, China) (mass fraction purity > 99.5%). Wax was separated from the JL crude oil, which came from the Jilin Oilfield in Jilin Province. In this study, the two simulated oils with wax contents of 10% and 20% were composed of wax and white oil, and a pure white oil with a wax content of 0% was used as a comparison, as shown in Table 1.

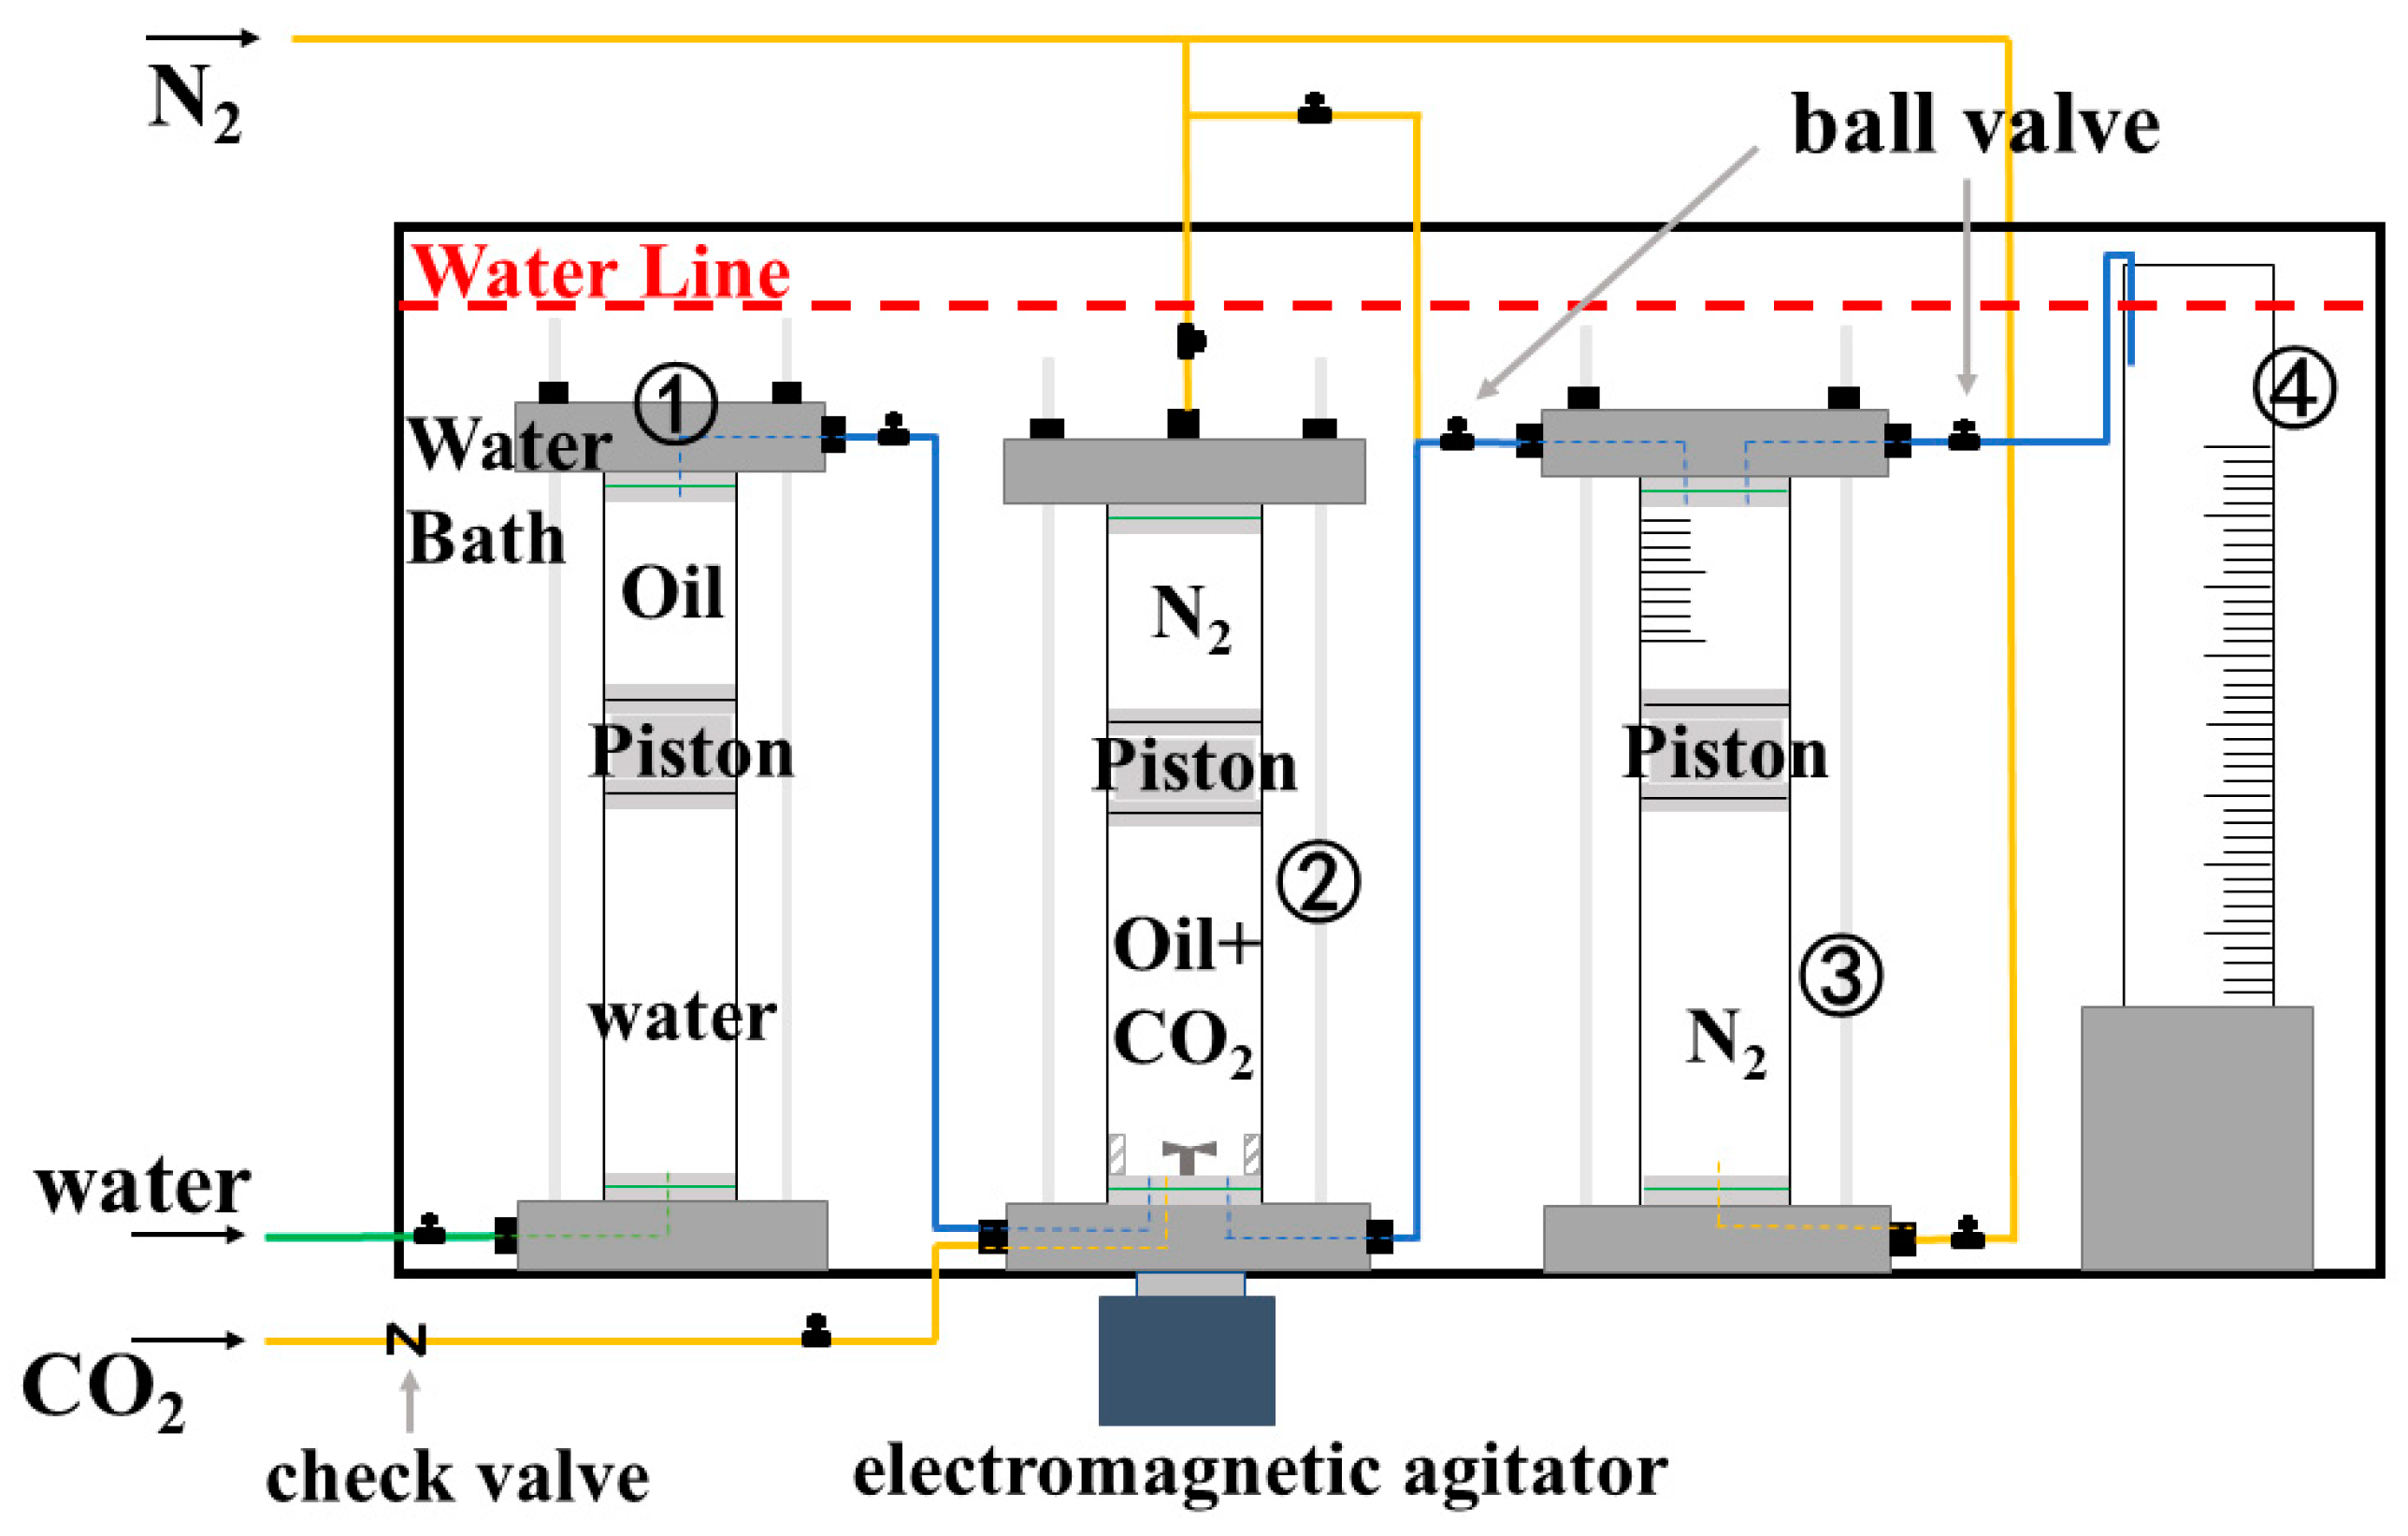
2.1.2. Foam Preparation and Performance Tests

In this work, foams were generated utilizing a crude oil foam characteristic testing device, as shown in Figure 1. The principle of the device is based on the saturated crude oil releasing gas and generating foams after depressurization. First, the excessive CO2 and simulated oil were injected into vessel ➁ (shown in Figure 1) under 0.8 MPa to mix. Then, 200 mL simulated oil with dissolved saturated CO2 was pushed into vessel ➂ (shown in Figure 1) with 0.3 MPa under depressurization and stood for 2 h to ensure excess gas escape. Finally, the saturated simulated oil was pushed into vessel ➃ (shown in Figure 1) after turning on the ball valve, generating abundant foams. The detailed process has been described in previous articles [2,27]. The generating and bursting processes of the foams were recorded with a digital camera and edited and processed to obtain batch data, including the evolution of foam or drainage liquid volume to lifetime. ImageJ software was employed to measure the bubble diameter of the foams [28]. The wax precipitation characteristics were obtained by differential scanning calorimetry (DSC) to determine the wax crystal content at different temperatures. The foam performances of simulated oils with different wax crystal contents were compared by analyzing defoaming rate, drainage rate, and bubble diameter.
In addition, the precipitation of wax crystals in the simulated oil was observed through a Nikon OPTIPHOT2-POL microscope to reveal the mechanism of action of wax crystals on foam drainage. The foam film was observed through cryo-SEM to demonstrate the spatial distribution of wax crystals on the oil foam film.

2.2. Simulation Section

2.2.1. Model Construction

In most MD simulations for waxy crude oil studies, the oil and wax have always been simplified using corresponding molecules. C11H24, C18H38, C26H54, C28H58, C36H74, and C38H78 molecules have been chosen as wax crystals to simplify the oil components in different works [22,24,29]. To determine the wax crystal model and establish the foam film model, Figure 2 shows the process of establishing a foam film model with wax clusters.
First, the carbon numbers of wax extracted from JL crude oil were found to be between C20 and C38 according to the carbon number distribution analysis [23], as shown in Figure 2a. The C26 and C30 were selected by calculating the weighted average of carbon numbers as simulated numbers. Therefore, the cluster of waxy crystals (the mixture of C26H54 and C30H62) was built according to Gan’s method [22], as shown in Figure 2b. Referencing the sandwich model structure [30,31,32,33], some wax clusters and 200 n-decane molecules formed liquid phase with wax content of 10% or 20%, and a CO2 layer was added to both sides of it along the Z-axis, forming a cubic box, as shown in Figure 2c. The size of the model with the wax content of 20% was 37.76 Å × 37.76 Å × 540 Å (X × Y × Z), with the final configurations shown in Figure 2d. The detailed analysis of the model’s parameters is discussed in Section 3.2 below.

2.2.2. Simulation Methods

To identify the effect of wax crystal on the characteristics of film in simulated oil foam, MD simulations were performed in Materials Studio [31] with COMPASS force field. First, the energies of the models were geometrically optimized using a smart algorithm to avoid possible molecular overlap. Second, each system was annealed for 500 ps, which means being heated from 300 K to 400 K and then cooled to 300 K for 5 cycles. After annealing, an MD simulation lasting 4 ns was performed with a time step of 1 fs to reach equilibrium under the NVT ensemble (keeping the atomic number N, volume V and temperature T of the system constant) [34]. The simulation was set to a constant volume and temperature equilibrium state, which was controlled using a Nose thermostat. In the system, the van der Waals (vdW) interactions were treated by the atom-based summation method with a cutoff distance of 15.5 Å, and the long-range electrostatic interactions were calculated by the Ewald algorithm [31]. Finally, each system was analyzed using the last 1 ns data [22].

2.2.3. Parameters Analysis

To study the dissolution characteristics of wax molecules, the solubility parameter δ is calculated from the cohesive energy densities (CED) analysis via MD. The close of the solubility parameters of the two materials is consistent with the efficient blend. If the D-value (Δδ) between the two materials exceeds 0.5, it is generally difficult to blend evenly [24].
The diffusion coefficient D of gas was obtained indirectly from the mean square displacement (MSD) [33,34], which can be described as D = (dMSD/dt)/6.

3. Results and Discussion

3.1. The Effect of Wax Crystals on the Simulated Oil Foam

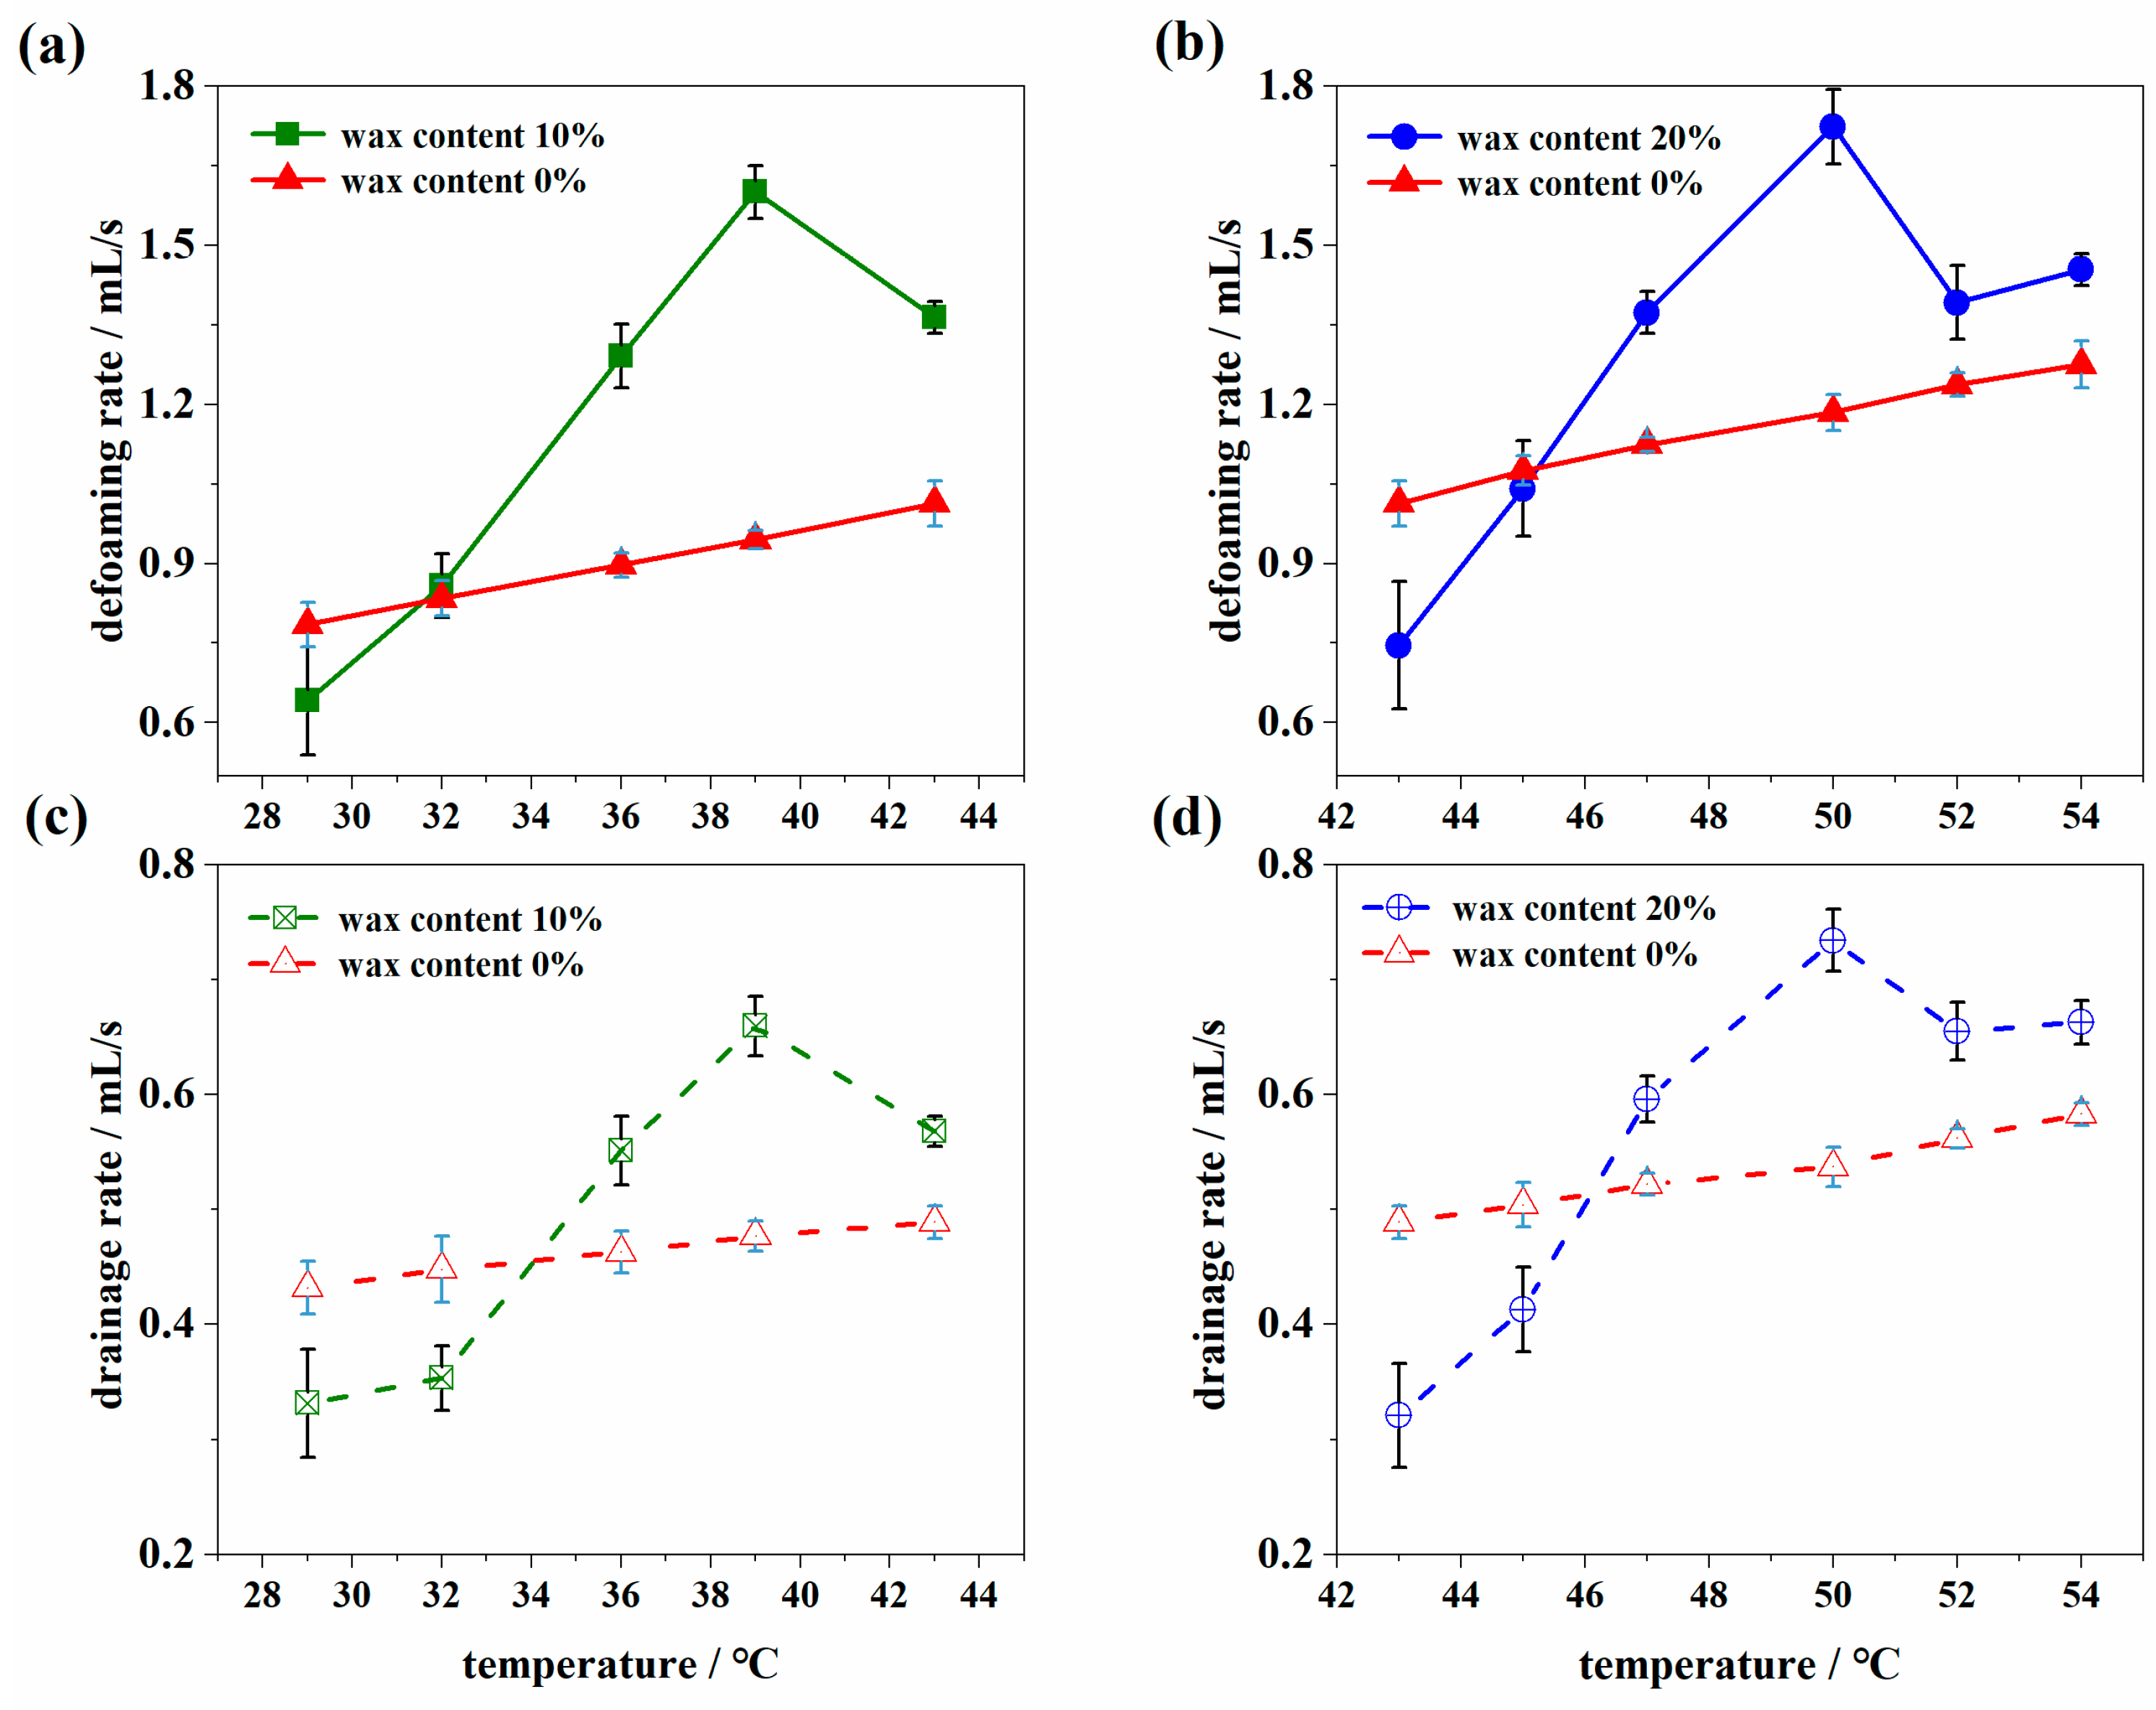
3.1.1. The Evolution of Defoaming and Drainage

Wax in crude oil crystallizes at temperatures below WAT, which is correlated with the wax content. Thus, the wax crystal content and viscosity of the simulated oils at temperatures near the WAT were measured, as shown in Figure 3. Because the viscosity of pure molten wax is lower than that of white oil, the viscosity of waxy simulated oil mixed with wax and white oil is lower than that of pure white oil at temperatures above the WAT. With a decrease in temperature, the viscosity of the simulated oils increased. The viscosity of the simulated oil with 0% wax content increased slowly. The higher wax content of waxy simulated oils correlated with a higher WAT temperature with a considerable influence of the precipitated wax crystal on viscosity.
Based on the above-simulated oil properties, the relationship between the defoaming and drainage characteristics of the simulated oil foam and wax crystals was analyzed. The experiments were conducted with depressurization of 0.3–0 MPa (gauge pressure) at different temperatures. As shown in Figure 4, the curves demonstrate the evolution of the overall defoaming and drainage rates of the simulated oils with temperature.
Both the defoaming and drainage rates decreased with decreasing temperature for all simulated oils. For pure white oil, the defoaming and drainage rates decreased slightly with decreasing temperature because of the viscosity increase. However, for waxy simulated oils, both the defoaming and drainage rates increased slightly as the temperature was lower than WAT and then decreased faster than that of pure white oil with a continuous decrease in temperature. The inflection point of the defoaming rate of the two simulated oils corresponds to the wax crystal content of about 0.2%. This is because the precipitation of wax crystals affects the characteristics of defoaming and drainage of the oil foam [2,27]. The wax crystal precipitated from the simulated oil decreased the stability of the foam liquid film when the temperature was lower than WAT, which accelerated the burst and drainage of the simulated oil foam. As the temperature decreased further, the wax crystal content increased, and a network of wax crystals formed, which impeded the drainage in the foam drainage channel and the diffusion of gas through liquid films of foam, as well as the rapid increase in the viscosity of the simulated oils, leading to a decrease in the defoaming and drainage rates.

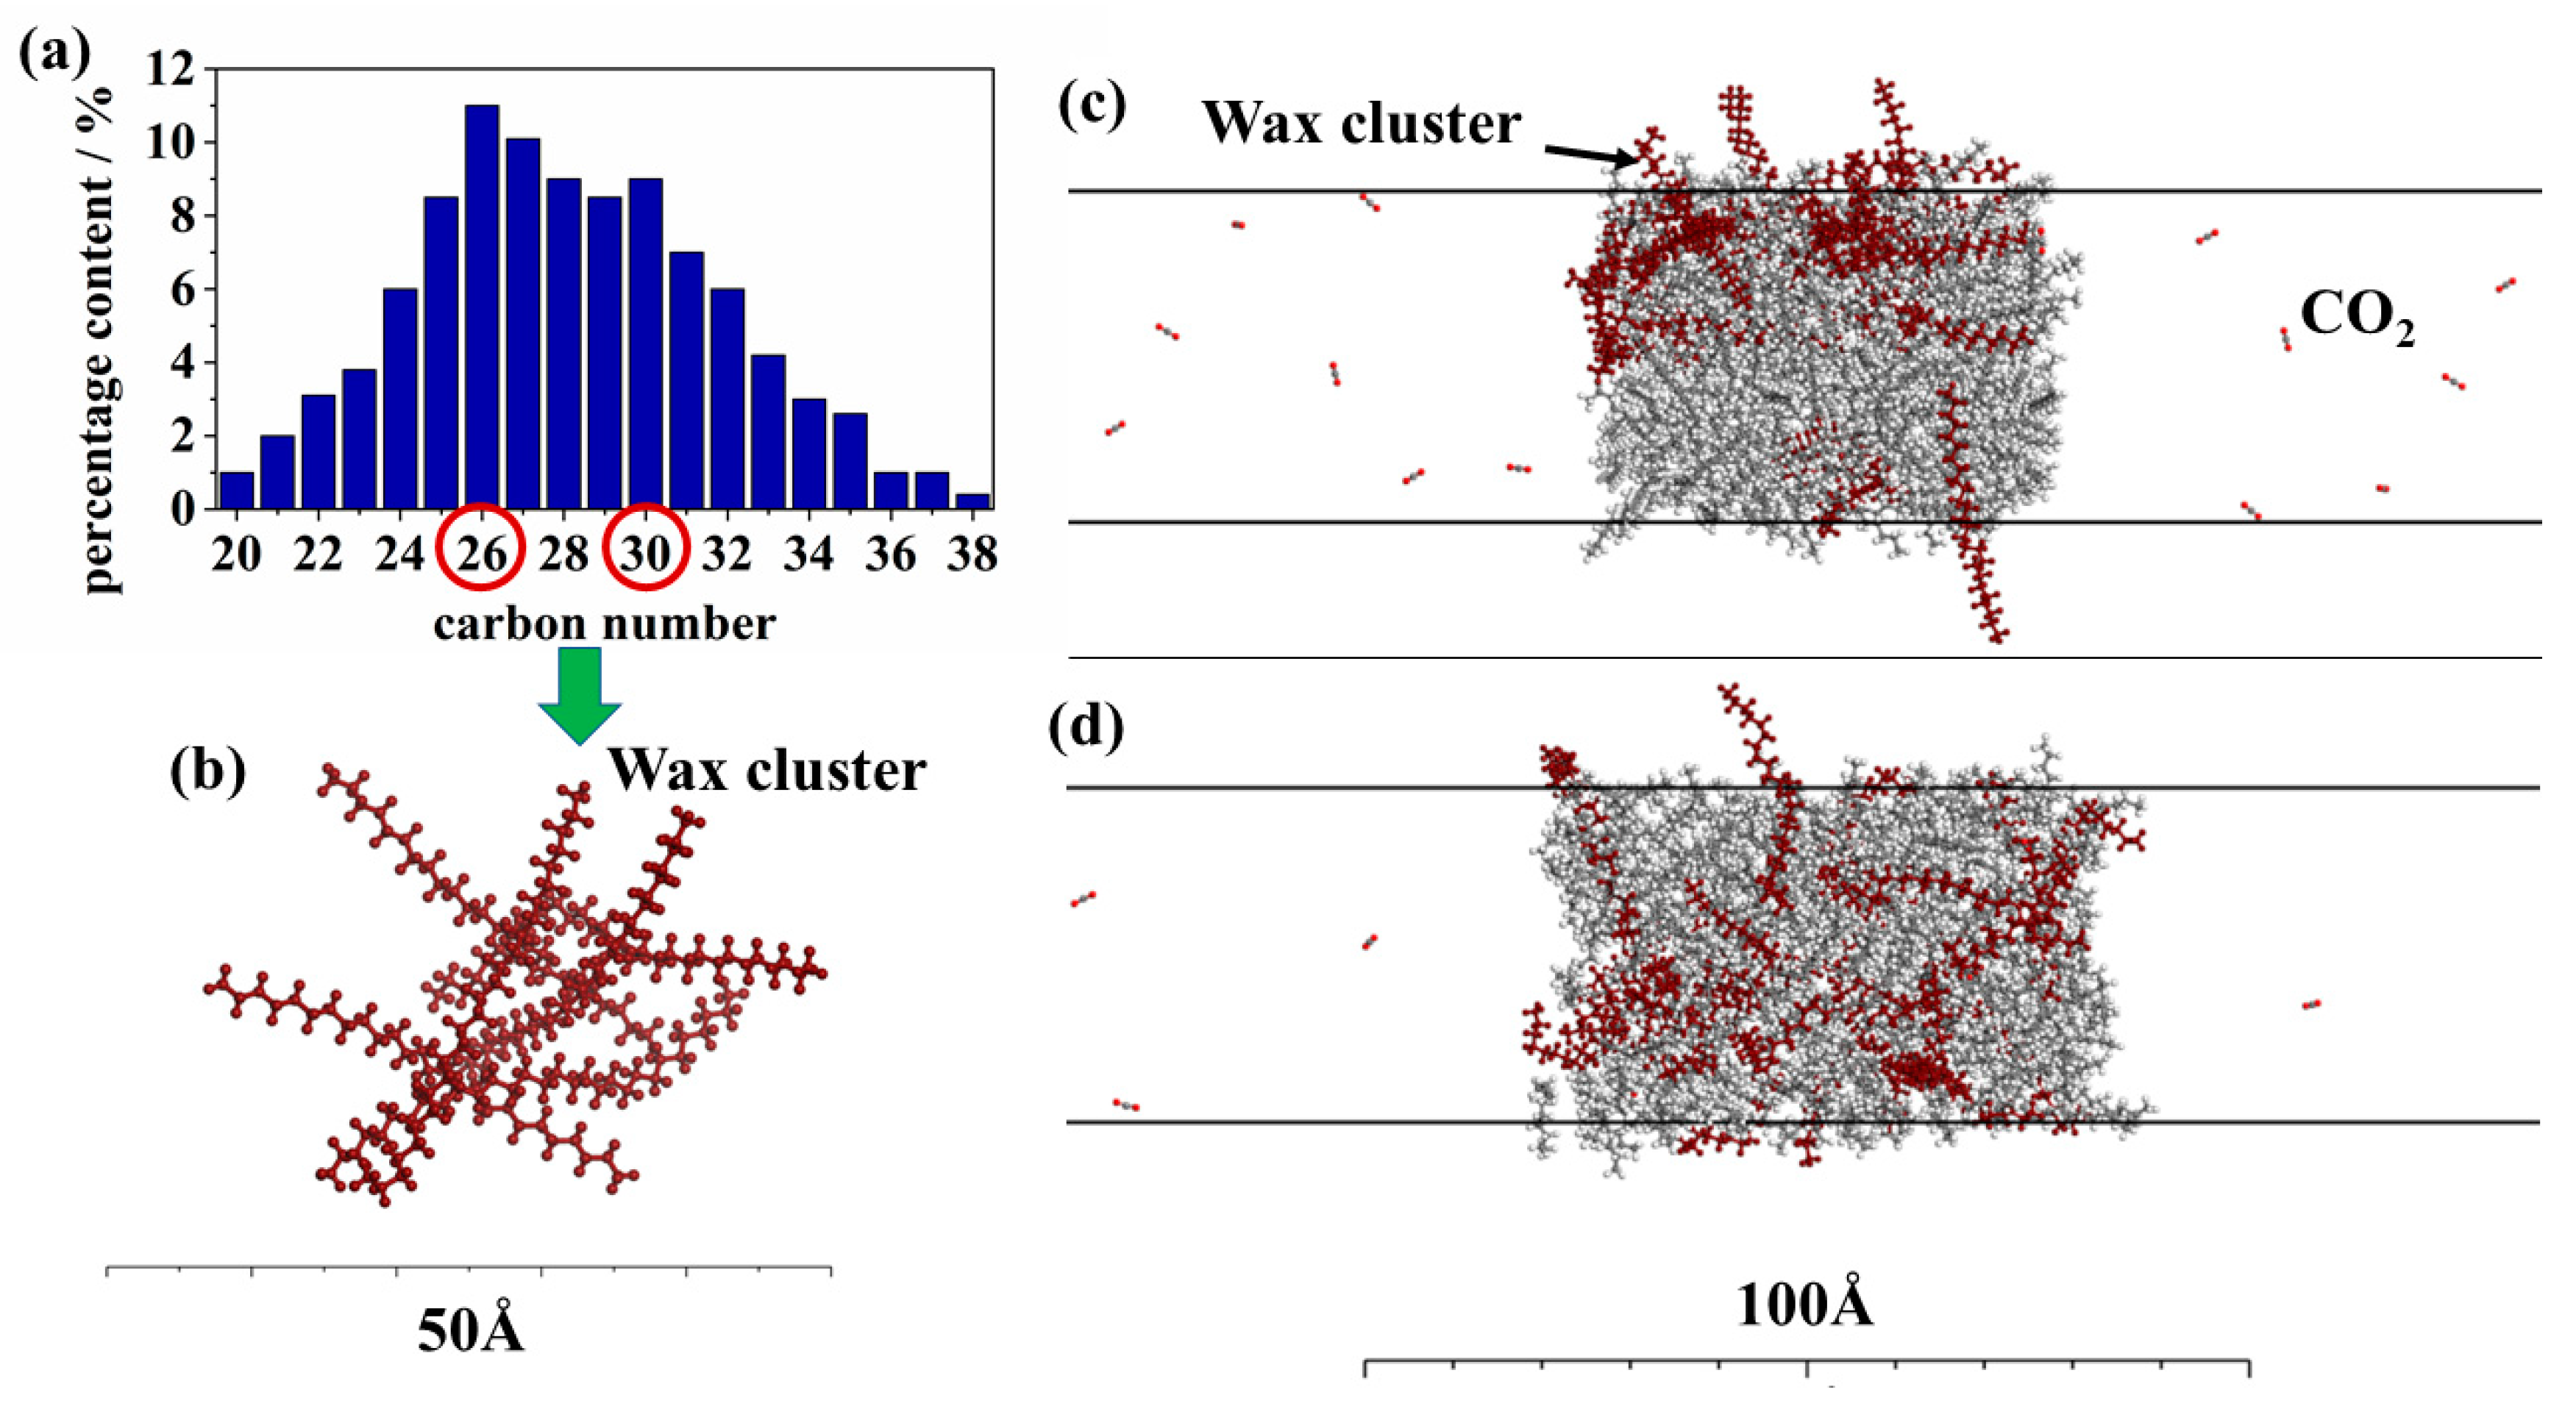
3.1.2. Microscopic Structure of Wax Crystals

To further analyze the effect mechanism of wax crystals on the burst characteristics of crude oil foam, the evolution of the distribution of wax crystals with temperature was observed using an OPTIPHOT2-POL microscope. Figure 5 shows the distribution and flow characteristics of the wax crystals at different temperatures.
As shown in Figure 5a–d, the wax crystals continuously precipitated and aggregated with decreasing temperature (×200). Some small wax crystal particles formed and flowed with drainage when the temperature decreased to 39 °C, and needle-like wax crystals were observed at the same temperature with the microscope (×400), as shown in Figure 5g, which indicates that needle-like wax crystals flow with drainage in the drainage channel, as described in Figure 5e. With decreasing temperature, the wax crystals grow large and form a network to reduce the drainage area, as shown in Figure 5b,c. As the temperature further decreases, the network expands to almost the entire area, leaving only a few of the flow channels until stable network foaming occurs, as shown in Figure 5d. Figure 5f shows the wax crystal network arrangement in the drainage channel.
Combined with the experimental analysis, research on the microscopic structure of the wax crystals further verified the mechanism of wax crystals on the defoaming and drainage characteristics of the simulated oil. Although an increasing viscosity improves foam stability, the needle-like wax crystals that precipitate from the simulated oil with a wax crystal content of 0.2% can destroy the stability of the foam liquid film at a temperature lower than WAT. In addition, the generation of a network with the wax crystal aggregation can reduce the drainage area, slow the drainage in the foam drainage channel and impede the diffusion of gas through liquid films of foam, leading to a decrease in the defoaming and drainage rates.

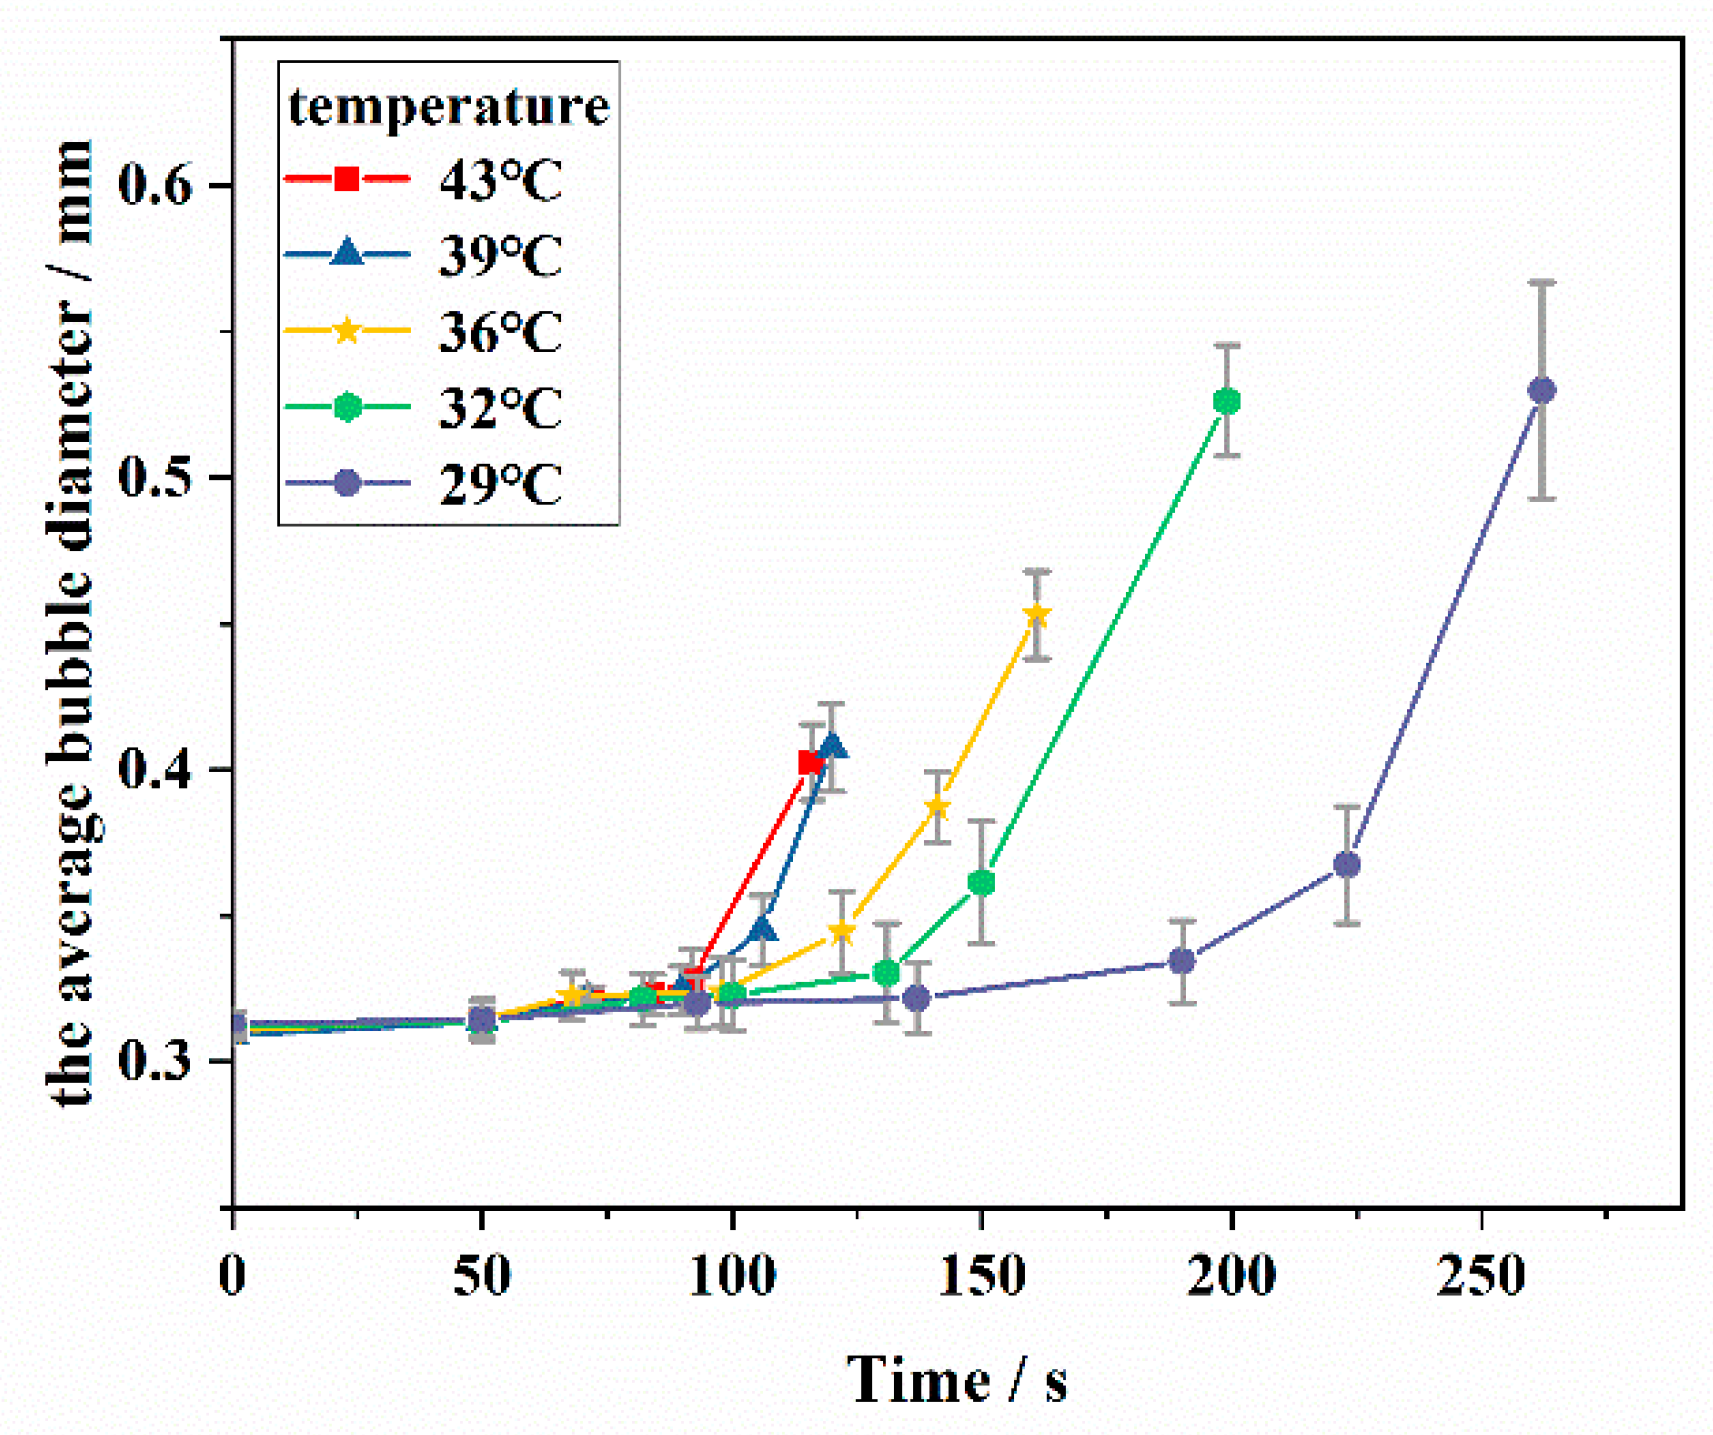
3.1.3. Bubble Diameter of the Simulated Oil Foam

Liquid drainage and gas diffusion are the most important mechanisms of foam burst. The stable foam is bound up with a slow drainage rate and gas diffusion between the bubbles, which are affected by wax crystals. To analyze the bubble diameter distribution of the simulated oil foam and the effect of wax crystals on it, the average bubble diameters of the simulated oil with a wax content of 10% during the defoaming process at different temperatures were measured, as shown in Figure 6.
The average bubble diameters of the simulated oils were all approximately 0.31 mm at the beginning of the defoaming process, and the average bubble diameter gradually increased at the late stage. Under different temperatures, the maximum average bubble diameter at the end stage increased with decreasing temperature. However, the maximum average bubble diameter at 39 °C was similar to that at 43 °C without obvious enlargement, both of which were 0.4 mm. It indicates that the needle-like wax crystals destroyed the foam film and led to foam bursting before reaching the maximum bubble diameter. Moreover, the maximum average bubble diameter at 29 °C was similar to that at 32 °C, both of which were approximately 0.53 mm, which is because of the impediment of the wax crystal network on gas diffusion from smaller to larger bubbles. The wax crystal network slows the rate of drainage and gas diffusion, thus allowing the foam to last longer.

3.2. The Effect of Wax Crystals on the Foam Film According to the MD Simulation

An MD simulation was employed to further analyze the effect of wax crystals on the characteristics of the oil foam to verify the accuracy of the above experimental results. The established MD model was adopted to simulate the distribution of wax clusters, CO2, and n-decane molecules at temperatures of 303.15 K, 308.15 K, 313.15 K, 318.15 K, and 323.15 K.

3.2.1. The Distribution of Wax Crystals

First, the dissolution characteristics of wax molecules at different temperatures were analyzed to verify the mutual insolubility between wax and n-decane, which demonstrated the wax crystal presented in the oil phase. Hence, the solubility parameters of wax and n-decane were calculated, and then, the D-value between them was determined, as shown in Figure 7.
This indicates that the D-values of solubility parameters between wax and n-decane in both models with the wax contents of 10% and 20% decreased with increasing temperature. All of them were above 0.5 (J/cm3)0.5, while the double increase in wax content cannot correspond to the double increase of D-values of solubility parameters in both models. As for the model with a wax content of 10%, the D-values of solubility parameters at 323.15 K are very close to 0.5. This phenomenon is similar to the dissolution and precipitation of wax crystals, and the critical value of 0.5 (J/cm3)0.5 corresponds to the WAT of wax crystals. The graphic demonstrates that the wax and n-decane were insolubility under experimental temperatures. For the model with a wax content of 10%, the WAT of it is close to 323.15 K and inconsistent with that of the experimental simulated oil with wax content of 10%, which is considered to be the result of simplification of the wax and oil molecules. Overall, the insolubility between wax and n-decane verifies the precipitation of wax crystals in the experiment and ensures the authenticity and accuracy of subsequent calculations.
In addition, the distribution of wax crystals is demonstrated by the density field of wax molecules, which reflects the aggregation of wax crystals in oils. Taking the model with a wax content of 20% as an example, Figure 8 shows the density field of wax crystals at different temperatures. The color from blue, green to red indicates the increase in density in turn, among which the blue means the density is close to 0.
As shown in Figure 8a, the distribution area of the density field of wax crystals is almost green, which demonstrates that the wax crystals were distributed evenly in the oil phase. However, the density field of wax crystals in Figure 8b appears in two dark red areas, indicating the aggregation of wax crystals with the decrease in temperature, which is similar to the aforementioned experimental phenomenon, verifying the accuracy of the models and simulation methods further.
The analysis of the D-values of solubility parameters and density field of models is to verify that the precipitation and aggregation of wax crystal in MD simulation are similar to that in experiment and provide theoretical support for the subsequent study of the effect of wax crystal on CO2 diffusion.

3.2.2. The Impediment of Wax Crystals on CO2

To study the influence mechanism of wax crystals on gas diffusion between bubbles, the CO2 diffusivity in the models was calculated to explore the impediment of wax crystals on CO2. As shown in Figure 9, the evolution of the CO2 diffusion coefficient of models with wax contents of 10% and 20% was calculated, and the values of the CO2 diffusion coefficient of extra models without wax molecules were added.
As shown in Figure 9a, the CO2 diffusion coefficient increased with increasing temperature for all models, which demonstrates how the high temperature can improve the diffusion of CO2. However, the CO2 diffusion coefficient decreased with increasing wax content at the same temperature, and a greater increase is consistent with lower temperatures. For the same model, the change rate of the CO2 diffusion coefficient decreased with the decrease in temperature. The descent rate of the CO2 diffusion coefficient of the model with wax content of 10% is faster at 323.15 K than that at a lower temperature, which is because the 323.15 K is close to WAT. It demonstrates that the newly emerged insolubility of wax crystal has a greater influence on CO2 diffusion with the decrease in temperature. As shown in Figure 9b, the aggregation of wax crystals impedes the CO2 diffusion channel, which explains how the microscopic mechanism of wax crystals affects the defoaming process.
Meanwhile, the concentration distribution of CO2 modeling with a wax content of 20%, which represents the ratio of the density of CO2 in a certain thickness range to their density in the system [31], was analyzed and is shown in Figure 10.
Obviously, the CO2 molecules were less distributed in the oil phase (red frame) at 303.15 K and mostly dispersed at the interface between the CO2 and oil. At 323.15 K, the CO2 relative concentration was both high in the oil phase and at the interface, which means that the CO2 molecules more easily enter the oil phase and pass through it. The analysis illustrates that with decreasing temperature, the insolubility and aggregation of wax crystals impede the diffusion of CO2 across the film layer further, verifying the effect of wax crystals on foam stability at the molecular level and clarifying the theory of wax crystal particles stabilizing foam films.

4. Conclusions

The wax crystals in crude oil are one of the most critical factors that affect the stability of the foam. To understand the influence mechanism and law of wax crystals on the crude oil foam characteristics, lay a theoretical foundation for the research of crude oil defoaming, and provide reliable theoretical support for the safe operation of CO2 flooding crude oil gathering and transportation system, the influence of wax crystal concentration and structure on the foam characteristics of simulated waxy oil was explored using a CO2 containing crude oil depressurization foaming device. Microscopic observations were used to analyze the micromechanism of wax crystals that affects foam stability. In addition, the effect of wax crystal on CO2 diffusion through liquid film was studied using MD simulation. The following are the main findings:
  • Both the defoaming and drainage rates increase slightly as the temperature is lower than WAT and then decrease faster than that of pure white oil with a continuous decrease in temperature. The defoaming and drainage rates of waxy oil foam have an obvious inflection point with a wax crystal content of 0.2%.
  • With the precipitation of wax crystals, the needle-like wax crystals can destroy the stability of the simulated oil foam, and the network formed by wax crystal aggregation can reduce the drainage area, slow the drainage flow in the foam drainage channel and impede the diffusion of gas through liquid films of foam, leading to a decrease in the defoaming and drainage rates.
  • The needle-like wax crystal destroyed the foam film and led to foam bursting before reaching the maximum bubble diameter, while the wax crystal network impeded the increase in bubble diameter by slowing down the rate of drainage and gas diffusion.
  • It is clear from the molecular level that with the decrease in temperature, the insolubility between wax crystal and oil molecules and the wax crystal aggregation increased, hindering the diffusion of CO2 through liquid film and slowing down the coalescence between bubbles using MD simulation.
However, the shape and size of wax crystals are controlled by the cooling rate, shear rate, shear time, and crystallization mode. Future research will continue to analyze the change law of wax crystal structures and clarify the effect of different crystal structures on foam stability to provide theoretical support for the foam stability mechanism and colloid interface chemical system. It can also serve as a guide for defoaming agent selection and separator efficiency improvement.

Author Contributions

Funding acquisition, L.Z.; Methodology, C.W.; Supervision, C.W.; Validation, X.Z.; Visualization, C.S.; Writing—original draft, Q.Z.; Writing—review & editing, L.Z. All authors have read and agreed to the published version of the manuscript.

Funding

The work is supported by the National Natural Science Foundation of China (Grant No. 51504270).

Conflicts of Interest

The authors declare no conflict of interest.

References

  1. Blázquez, C.; Dalmazzone, C.; Emond, E.; Schneider, S. Crude oil foams. Part 1—A novel methodology for studying non-aqueous foams formed by depressurization. Fuel 2016, 171, 224–237. [Google Scholar] [CrossRef]
  2. Zhang, Q.; Zuo, L.; Wu, C.; Sun, C.; Zhu, X. Effects of crude oil characteristics on foaming and defoaming behavior at separator during CO2 flooding. Colloids Surf. A Physicochem. Eng. Asp. 2021, 608, 125562. [Google Scholar] [CrossRef]
  3. Chen, J.; He, L.; Luo, X.; Zhang, C. Foaming of crude oil: Effect of acidic components and saturation gas. Colloids Surf. A Physicochem. Eng. Asp. 2018, 553, 432–438. [Google Scholar] [CrossRef]
  4. Quan, Q.; Gong, J.; Wang, W.; Gao, G. Study on the aging and critical carbon number of wax deposition with temperature for crude oils. J. Pet. Sci. Eng. 2015, 130, 1–5. [Google Scholar] [CrossRef]
  5. Anazadehsayed, A.; Rezaee, N.; Naser, J.; Nguyen, A.V. A review of aqueous foam in microscale. Adv. Colloid Interface Sci. 2018, 256, 203–229. [Google Scholar] [CrossRef] [PubMed] [Green Version]
  6. Boos, J.; Drenckhan, W.; Stubenrauch, C. Protocol for studying aqueous foams stabilized by surfactant mixtures. J. Surfactants Deterg. 2013, 16, 1–12. [Google Scholar] [CrossRef]
  7. Wang, J.; Nguyen, A.V.; Farrokhpay, S. A critical review of the growth, drainage and collapse of foams. Adv. Colloid Interface Sci. 2016, 228, 55–70. [Google Scholar] [CrossRef] [Green Version]
  8. Kumar, V.; Pal, N.; Jangir, A.K.; Manyala, D.L.; Varade, D.; Mandal, A.; Kuperkar, K. Dynamic interfacial properties and tuning aqueous foamability stabilized by cationic surfactants in terms of their structural hydrophobicity, free drainage and bubble extent. Colloids Surf. A Physicochem. Eng. Asp. 2020, 588, 124362. [Google Scholar] [CrossRef]
  9. Rio, E.; Drenckhan, W.; Salonen, A.; Langevin, D. Unusually stable liquid foams. Adv. Colloid Interface Sci. 2014, 205, 74–86. [Google Scholar] [CrossRef]
  10. Quintero, C.G.; Noïk, C.; Dalmazzone, C.; Grossiord, J.L. Formation kinetics and viscoelastic properties of water/crude oil interfacial films. Oil Gas Sci. Technol. Rev. l’IFP 2009, 64, 607–616. [Google Scholar] [CrossRef]
  11. Shrestha, L.K.; Shrestha, R.G.; Sharma, S.C.; Aramaki, K. Stabilization of nonaqueous foam with lamellar liquid crystal particles in diglycerol monolaurate/olive oil system. J. Colloid Interface Sci. 2008, 328, 172–179. [Google Scholar] [CrossRef] [PubMed]
  12. Binks, B.P.; Rocher, A.; Kirkland, M. Oil foams stabilised solely by particles. Soft Matter. 2011, 7, 1800–1808. [Google Scholar] [CrossRef]
  13. Heymans, R.; Tavernier, I.; Dewettinck, K.; van der Meeren, P. Crystal stabilization of edible oil foams. Trends Food Sci. Technol. 2017, 69, 13–24. [Google Scholar] [CrossRef]
  14. Hunter, T.N.; Pugh, R.J.; Franks, G.V.; Jameson, G.J. The role of particles in stabilising foams and emulsions. Adv. Colloid Interface Sci. 2008, 137, 57–81. [Google Scholar] [CrossRef] [PubMed]
  15. Binks, B.P.; Horozov, T.S. Aqueous foams stabilized solely by silica nanoparticles. Angew. Chem. 2005, 117, 3788–3791. [Google Scholar] [CrossRef]
  16. Kaptay, G. Interfacial criteria for stabilization of liquid foams by solid particles. Colloids Surf. A Physicochem. Eng. Asp. 2003, 230, 67–80. [Google Scholar] [CrossRef]
  17. Mishima, S.; Suzuki, A.; Sato, K.; Ueno, S. Formation and microstructures of whipped oils composed of vegetable oils and high-melting fat crystals. J. Am. Oil Chem. Soc. 2016, 93, 1453–1466. [Google Scholar] [CrossRef]
  18. Binks, B.P.; Garvey, E.J.; Vieira, J. Whipped oil stabilised by surfactant crystals. Chem. Sci. 2016, 7, 2621–2632. [Google Scholar] [CrossRef] [Green Version]
  19. Sethumadhavan, G.N.; Nikolov, A.D.; Wasan, D.T. Stability of liquid films containing monodisperse colloidal particles. J. Colloid Interface Sci. 2001, 240, 105–112. [Google Scholar] [CrossRef]
  20. Madivala, B.; Vandebril, S.; Fransaer, J.; Vermant, J. Exploiting particle shape in solid stabilized emulsions. Soft Matter. 2009, 5, 1717–1727. [Google Scholar] [CrossRef]
  21. Shrestha, L.K.; Aramaki, K.; Kato, H.; Takase, Y.; Kunieda, H. Foaming properties of monoglycerol fatty acid esters in nonpolar oil systems. Langmuir 2006, 22, 8337–8345. [Google Scholar] [CrossRef] [PubMed]
  22. Gan, Y.; Cheng, Q.; Wang, Z.; Yang, J.; Sun, W.; Liu, Y. Molecular dynamics simulation of the microscopic mechanisms of the dissolution, diffusion and aggregation processes for waxy crystals in crude oil mixtures. J. Pet. Sci. Eng. 2019, 179, 56–69. [Google Scholar] [CrossRef]
  23. Chen, X.; Hou, L.; Li, W.; Li, S.; Chen, Y. Molecular dynamics simulation of magnetic field influence on waxy crude oil. J. Mol. Liq. 2018, 249, 1052–1059. [Google Scholar] [CrossRef]
  24. Wu, C.; Zhang, J.; Li, W.; Wu, N. Molecular dynamics simulation guiding the improvement of EVA-type pour point depressant. Fuel 2005, 84, 2039–2047. [Google Scholar] [CrossRef]
  25. Samieadel, A.; Oldham, D.; Fini, E.H. Multi-scale characterization of the effect of wax on intermolecular interactions in asphalt binder. Constr. Build. Mater. 2017, 157, 1163–1172. [Google Scholar] [CrossRef]
  26. Jang, Y.H.; Blanco, M.; Creek, J.; Tang, Y.C.; Goddard, W.A. Wax inhibition by comb-like polymers: Support of the incorporation-perturbation mechanism from molecular dynamics simulations. J. Phys. Chem. B 2007, 111, 13173–13179. [Google Scholar] [CrossRef] [Green Version]
  27. Zhang, Q.; Zuo, L.; Wu, C.; Zhu, X.; Sun, C. The evolution and influence factors of CO2 flooding crude oil defoaming behavior after depressurization. J. Pet. Sci. Eng. 2021, 206, 108996. [Google Scholar] [CrossRef]
  28. Babamahmoudi, S.; Riahi, S. Application of nano particle for enhancement of foam stability in the presence of crude oil: Experimental investigation. J. Mol. Liq. 2018, 264, 499–509. [Google Scholar] [CrossRef]
  29. Martin-Martinez, F.J.; Fini, E.H.; Buehler, M.J. Molecular asphaltene models based on Clar sextet theory. Rsc. Adv. 2015, 5, 753–759. [Google Scholar] [CrossRef]
  30. Sun, S.; Zhang, X.; Feng, S.; Wang, H.; Wang, Y.; Luo, J.; Li, C.; Hu, S. CO2/N2 switchable aqueous foam stabilized by SDS/C12A surfactants: Experimental and molecular simulation studies. Chem. Eng. Sci. 2019, 209, 115218. [Google Scholar] [CrossRef]
  31. Wu, G.; Yuan, C.; Ji, X.; Wang, H.; Sun, S.; Hu, S. Effects of head type on the stability of gemini surfactant foam by molecular dynamics simulation. Chem. Phys. Lett. 2017, 682, 122–127. [Google Scholar] [CrossRef]
  32. Zhang, C.; Wu, P.; Li, Z.; Liu, T.; Zhao, L.; Hu, D. Ethanol enhanced anionic surfactant solubility in CO2 and CO2 foam stability: MD simulation and experimental investigations. Fuel 2020, 267, 117162. [Google Scholar] [CrossRef]
  33. Parra, J.G.; Domínguez, H.; Aray, Y.; Iza, P.; Zarate, X.; Schott, E. Structural and interfacial properties of the CO2-in-water foams prepared with sodium dodecyl sulfate (SDS): A molecular dynamics simulation study. Colloids Surf. A Physicochem. Eng. Asp. 2019, 578, 123615. [Google Scholar] [CrossRef]
  34. Md. Azmi, N.S.; Abu Bakar, N.F.; Tengku Mohd, T.A.; Azizi, A. Molecular dynamics simulation on CO2 foam system with addition of SiO2 nanoparticles at various sodium dodecyl sulfate (SDS) concentrations and elevated temperatures for enhanced oil recovery (EOR) application. Comput. Mater. Sci. 2020, 184, 109937. [Google Scholar] [CrossRef]
Figure 1. Principle of the device for testing crude oil foam characteristics.
Sustainability 14 06778 g001
Figure 2. (a) The carbon number distribution of wax extracted from the JL crude oil; (b) the cluster with a large bulk (C26H54 and C30H62) of waxy crystals; (c,d) the initial and final configuration model of gas/liquid with CO2, wax clusters, and n-decane.
Sustainability 14 06778 g002
Figure 3. Change in wax crystal content and viscosity of the simulated oil with temperature ((a) wax content 10% and 0% between 43 and 29 °C; (b) wax content 20% and 0% between 54 and 40 °C) (error bars: n = 2).
Sustainability 14 06778 g003
Figure 4. Evolution of the defoaming and drainage rates of the simulated oils ((a) defoaming rate with wax contents of 10% and 0%; (b) defoaming rate with wax contents of 20% and 0%; (c) drainage rate with wax contents of 10% and 0%; (d) drainage rate with wax contents of 20% and 0%) (error bars: n = 2).
Sustainability 14 06778 g004
Figure 5. (ad) The distribution and flow characteristics of wax crystals at different temperatures ((a) 39 °C; (b) 36 °C; (c) 32 °C; (d) 29 °C); (e) schematic of the needle-like wax crystal flow with drainage in the foam film; (f) schematic of the wax crystal network in the foam film; (g) the needle-like wax crystals at 39 °C (×400).
Sustainability 14 06778 g005
Figure 6. The average bubble diameter distribution of the simulated oil foam (error bars: n = 2).
Sustainability 14 06778 g006
Figure 7. The D-value of solubility parameters versus temperature for different wax contents.
Sustainability 14 06778 g007
Figure 8. The density field of wax molecules at different temperatures: (a) 323.15 K; (b) 303.15 K.
Sustainability 14 06778 g008
Figure 9. (a) The evolution of the CO2 diffusion coefficient with temperature; (b) the diagram of CO2 diffusion.
Sustainability 14 06778 g009
Figure 10. The concentration distribution of CO2 at different temperatures: (a) 323.15 K; (b) 303.15 K (red frame: oil phase).
Sustainability 14 06778 g010
Table 1. The compositions of the simulated oils.
Simulated OilsWax Content/wt%White Oil/wt%
10100
21090
32080
Publisher’s Note: MDPI stays neutral with regard to jurisdictional claims in published maps and institutional affiliations.

