1. Introduction
Ore demand remains high around the world, particularly in China, the United States, India, and other populated countries [
1,
2]. With the growth of consumer markets in developing countries, energy demand is rising, and ore demand frequently surpasses supply [
3,
4,
5]. For example, global iron ore production has increased 1.77 times since the 1970s [
6], demand for cobalt ore has increased in the rapidly growing electric vehicle market [
7], and global coal power continues to expand despite the Paris Agreement requirement to decarbonize global electricity generation by mid-century [
8]. Since 1978, a huge number of resource-based cities have been built to support China’s rapid urbanization pace [
9], and the entire process, from extraction to transportation to consumption, has resulted in different levels of environmental degradation [
10]. In China, high-intensity urban mineral resource development has constrained the sustainable development of towns and cities [
11], and mine rehabilitation has become an inevitable need for the sustainable development of the mining industry [
12]. A quantitative evaluation of the eco-geological environment quality (EEQ) of mining areas is beneficial to the pre-planning of mine ecological restoration projects [
13]. The main objective of this study is to explore methods suitable for the impactful evaluation of regional mine eco-geological environments to guide mineral resource development and environmental protection in mining cities or key mining areas.
The geological environment is the part of the lithosphere close to the earth’s surface that interacts with the atmosphere, water, and biosphere [
14], and has a special and close connection with the development of human society. Based on the theory of environmental geology [
15], the essence of mine geology refers to the human–earth relationship, i.e., the relationship between mining activities and the geological environment. The geological action caused by mining activities and various geological phenomena form a relatively independent environmental system [
16], i.e., the mine geological environmental system. Broadly speaking, the mining geo-environmental system includes all human activities within the sphere of influence around the mine, and when the natural equilibrium state of the earth’s surface and lithosphere within the system is constantly changed, it leads to many geological environmental problems and prominent geological disasters. The phenomenon of change and destruction resulting from the interaction between mining activities and ore bodies and their processes, and the problems arising from this process of geological activity, are mine geological environmental problems [
17]. The Chinese government attaches great importance to such geological environmental issues to avoid inducing greater secondary disasters. In 2009, the Chinese Ministry of Land and Resources issued the Regulations on Mine Geo-environmental Protection, which were amended three times in 2015, 2016, and 2019, respectively, and formulated relevant documents such as the Specification for the Preparation of Mine Geo-environmental Protection and Restoration and Management Program.
The ecological environment and the geological environment interact with each other, influence each other, and constrain each other, forming a relatively unified whole that integrates all environmental elements generated by human-land-life activities [
18]. The eco-geological environmental system is the ecological background for resource-based cities to achieve sustainable development and the key to promoting the coordinated development of regional resources, the environment, and the economy and society [
19]. The Chinese State Council announced the National Sustainable Development Plan for Resource-based Cities in 2013 to guide the sustainable development plans of resource-based cities and resource development planning (2013–2020). It is worth noting that the Northeast region is rich in natural resources, including Jilin, Heilongjiang, and Liaoning [
20], so much so that more resource-based cities are being formed, but there is less literature on the Northeast region. The damage to the eco-geological environment caused by mines includes the influence of multiple factors, and geological hazards, landscape destruction, and environmental pollution have a cumulative effect [
21]. Evaluating eco-geological environmental problems of mines and fully grasping the current situation requires a combination of survey tools such as remote sensing, field sampling, and historical survey data collection [
22].
Over the years, many scholars have analyzed and evaluated the eco-geological environmental problems generated by mining activities. Rybak [
23] proposed a conceptual plan for waste-free production in mining and metallurgical processes to reduce eco-geological damage. Niemiec [
24] analyzed the reclamation model of abandoned mines in the region according to the different eco-geological environmental conditions of abandoned mines. Xiao [
25] developed an O-U (Overground-Underground) model to assess the ecological resilience of mining areas. Yuan [
26] used a coupled coordination degree model to assess the sustainable development potential of mining cities in the west. Most of the studies in China have focused on large open-pit coal mining areas in western China. In fact, some of the resource-based cities are characterized by “many small mines and few large mines”, and based on this characteristic, “concentrated mining area of mineral resources” have been formed [
27], and the EEQ evaluation in this area is still lacking. In general, the comprehensive evaluation of the eco-geological environment in the concentrated mining area of mineral resources is a very relevant issue. The purpose of this work is to realize the ecological restoration zoning of the national land space in resource-based cities and to improve the regional EEQ.
In 2013, Tonghua City was officially listed as one of the resource-based cities in China, and the resource and environment base of urban development is in crisis, and the industry has a high degree of homogeneity. In this study, the regional EEQ is evaluated by taking the concentrated mining area of mineral resources in Tonghua City as an example, considering the regional characteristics. In order to achieve the objectives, it is necessary to solve the following tasks: (1) to establish a set of evaluation systems considering eco-geological environmental conditions, environmental pollution status, and anthropogenic influence; (2) to quantitatively evaluate the EEQ of the concentrated mining area; and (3) to explore countermeasures to improve the EEQ and to provide objective suggestions for eco-geological environmental protection and resource allocation in resource-based cities.
2. Materials and Methods
2.1. Study Area
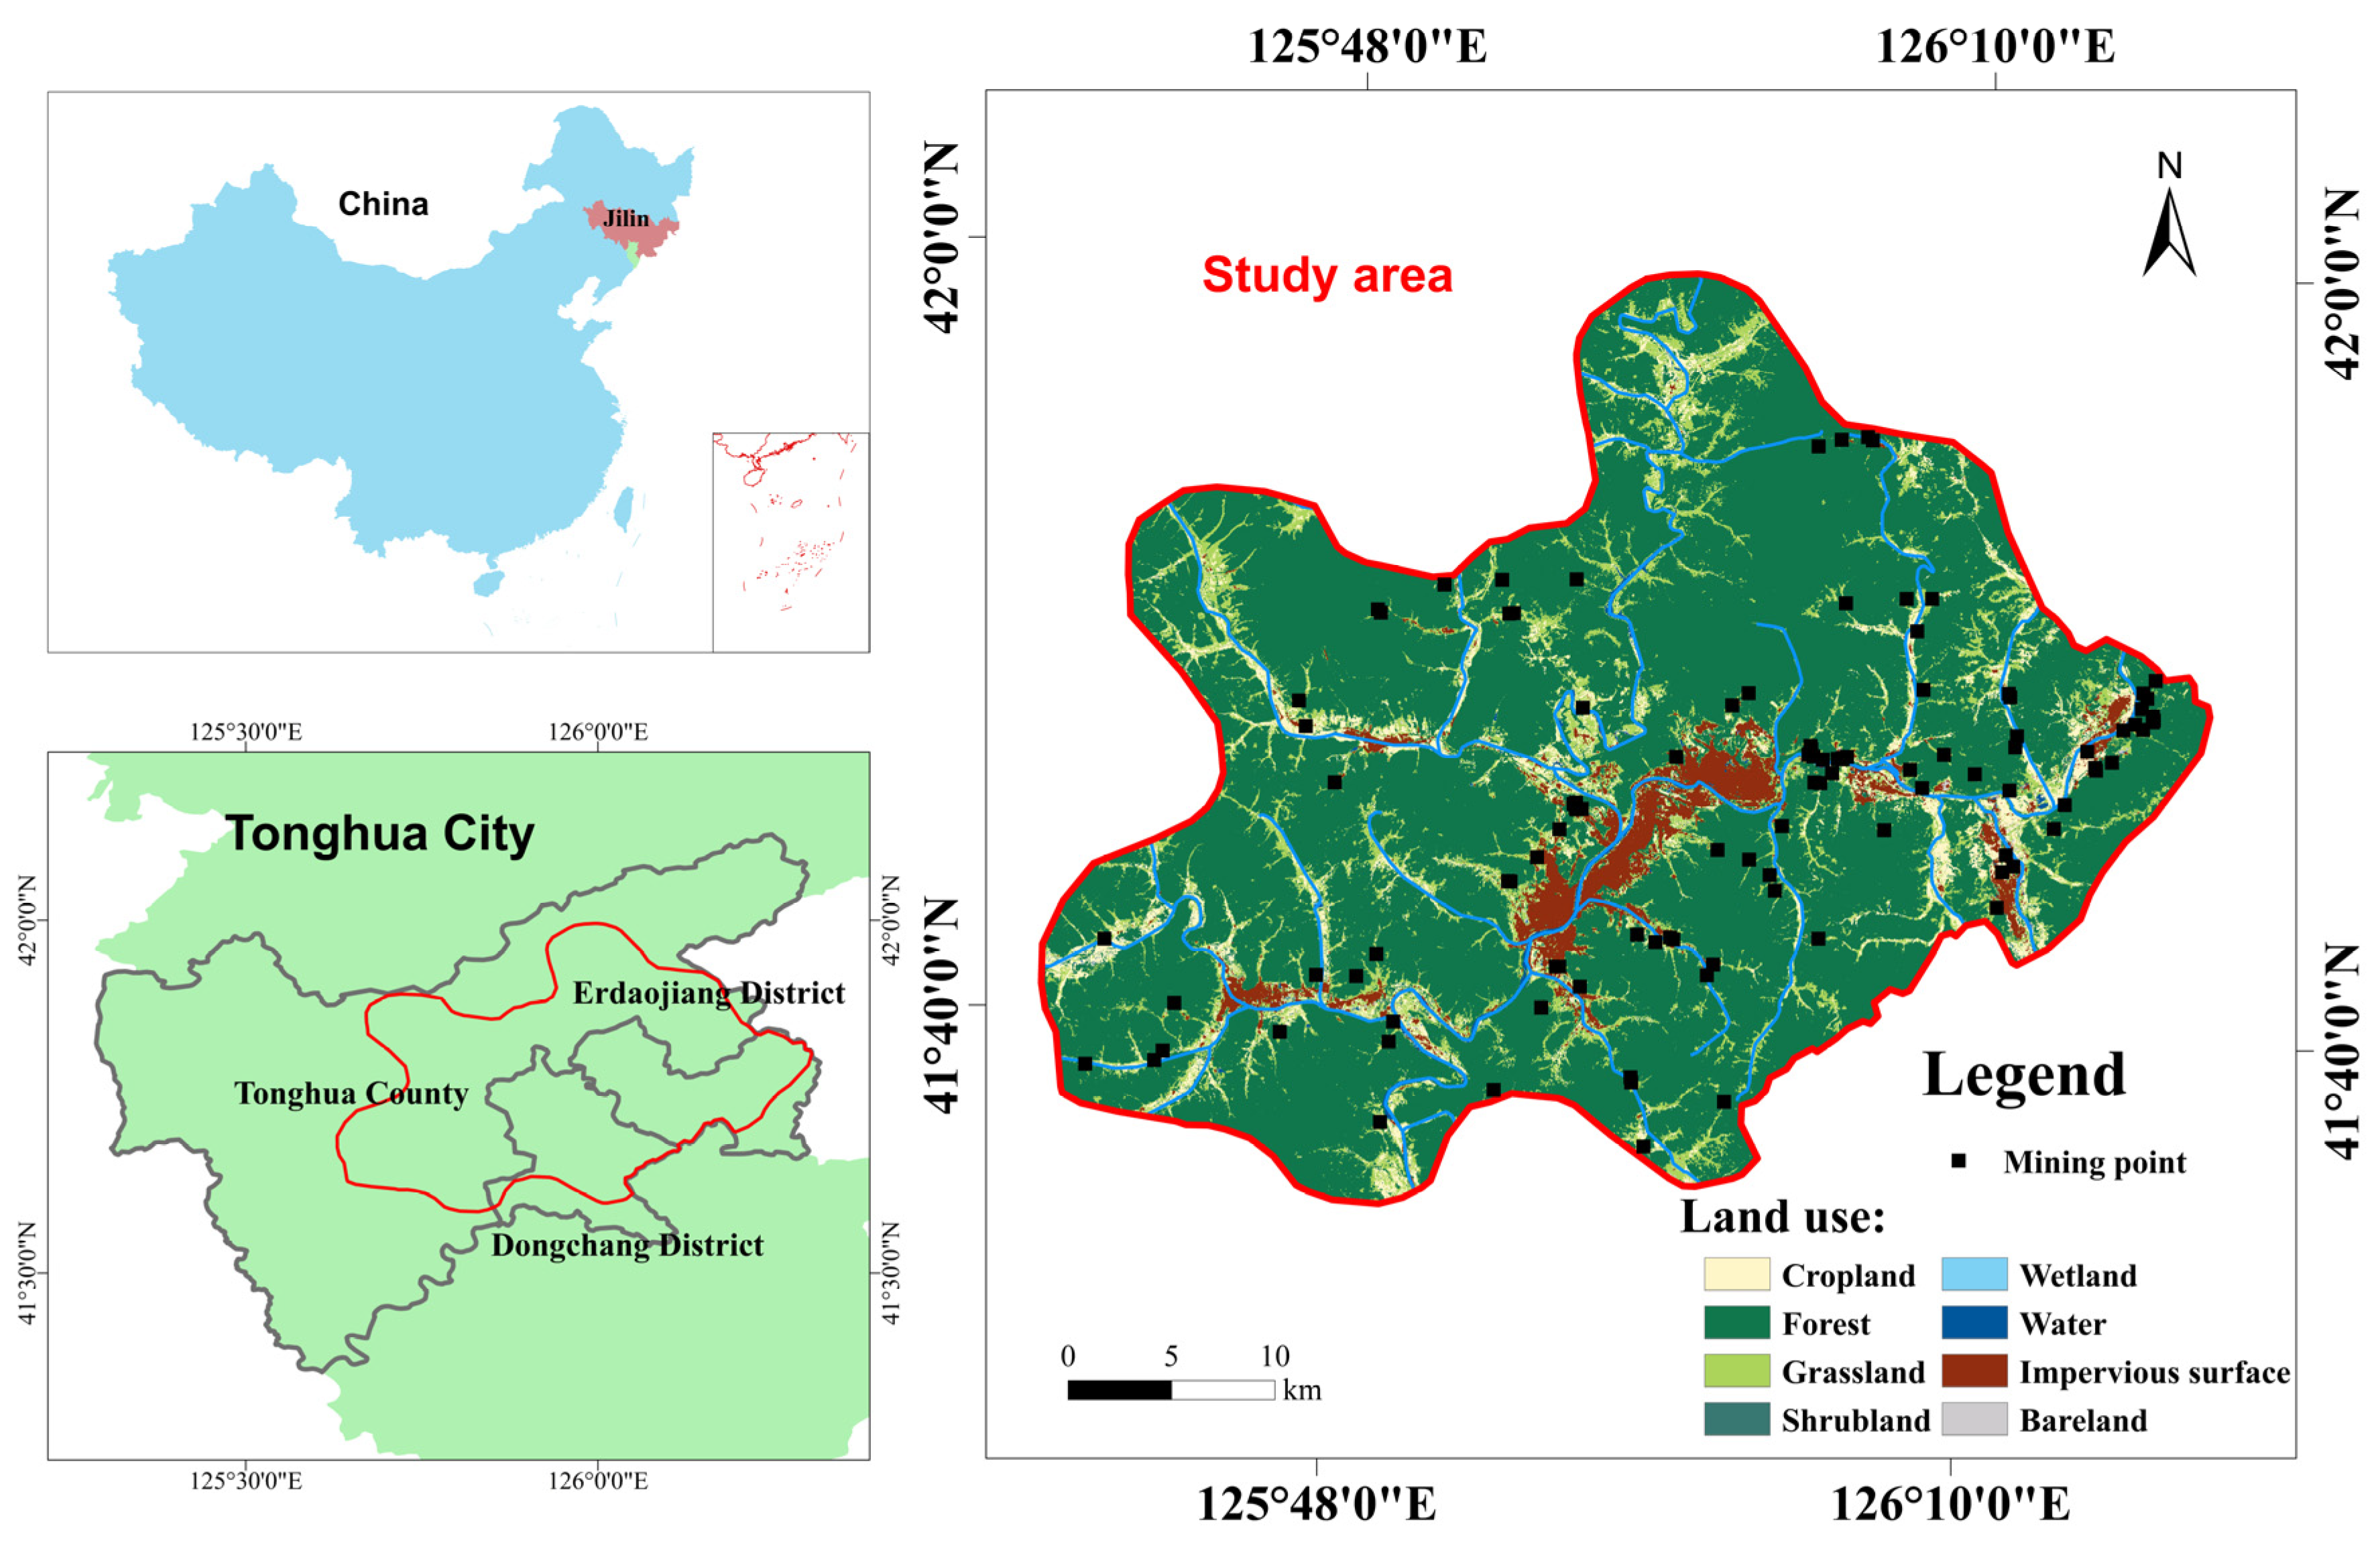
The geographical location of Tonghua City is in the southeastern part of Jilin Province, China, and the study area is located within Tonghua City (
Figure 1). The geographical coordinates are 125°35′–126°20′ E, 41°35′–42°00′ N, 37 km in length from north to south and 66 km in width from east to west. The study area includes parts of the Erdaojiang mining area, Dongchang district mining area, and Tonghua county mining area, with an area of about 1462 km
2.
The study area belongs to the north temperate continental monsoon climate, influenced by the topography of Changbai Mountain, with an obvious continental climate. The average annual temperature is 4.9~6.5 °C, and the average annual precipitation is 800~900 mm. The main rivers in the study area are the Hun River and the Hani River. The landform type in the area is mainly low and medium mountains, with distributed inter-mountain valley plains. The micro-landscapes along the rivers are often steep cliffs or steep slopes, with dense inter-mountain valleys and large slope drops.
Tonghua City has 107 mines in the concentrated mining area of mineral resources. From the analysis of mineral resources categories, the developed mineral resources of non-metallic mines dominate, and there are 38 mines with valid mining licenses in Tonghua City, with nearly 10,000 employees in the mines and an actual annual production capacity of 10,162,000 tons. The problems related to the ecological and geological environment in the study area mainly include mining enterprises occupying and destroying land vegetation resources, the influence and destruction of aquifers, topographic and geomorphological landscape destruction, groundwater pollution and soil heavy metal pollution, solid waste, wastewater, and liquid discharge, as well as collapse, landslide, and debris flow disasters.
2.2. Investigative Framework
The extent to which EEQ was influenced by internal and external factors was evaluated using techniques and methods such as RS, GIS, field survey, ANP, and spatial autocorrelation analysis in this study. In order to meticulously assess the EEQ in the study area, geological environment survey information for 107 mines in 2015 was collected from the General Geological and Environmental Monitoring Station of Jilin Province. The general framework of this study is shown in
Figure 2.
2.3. Evaluation Indicators Selection
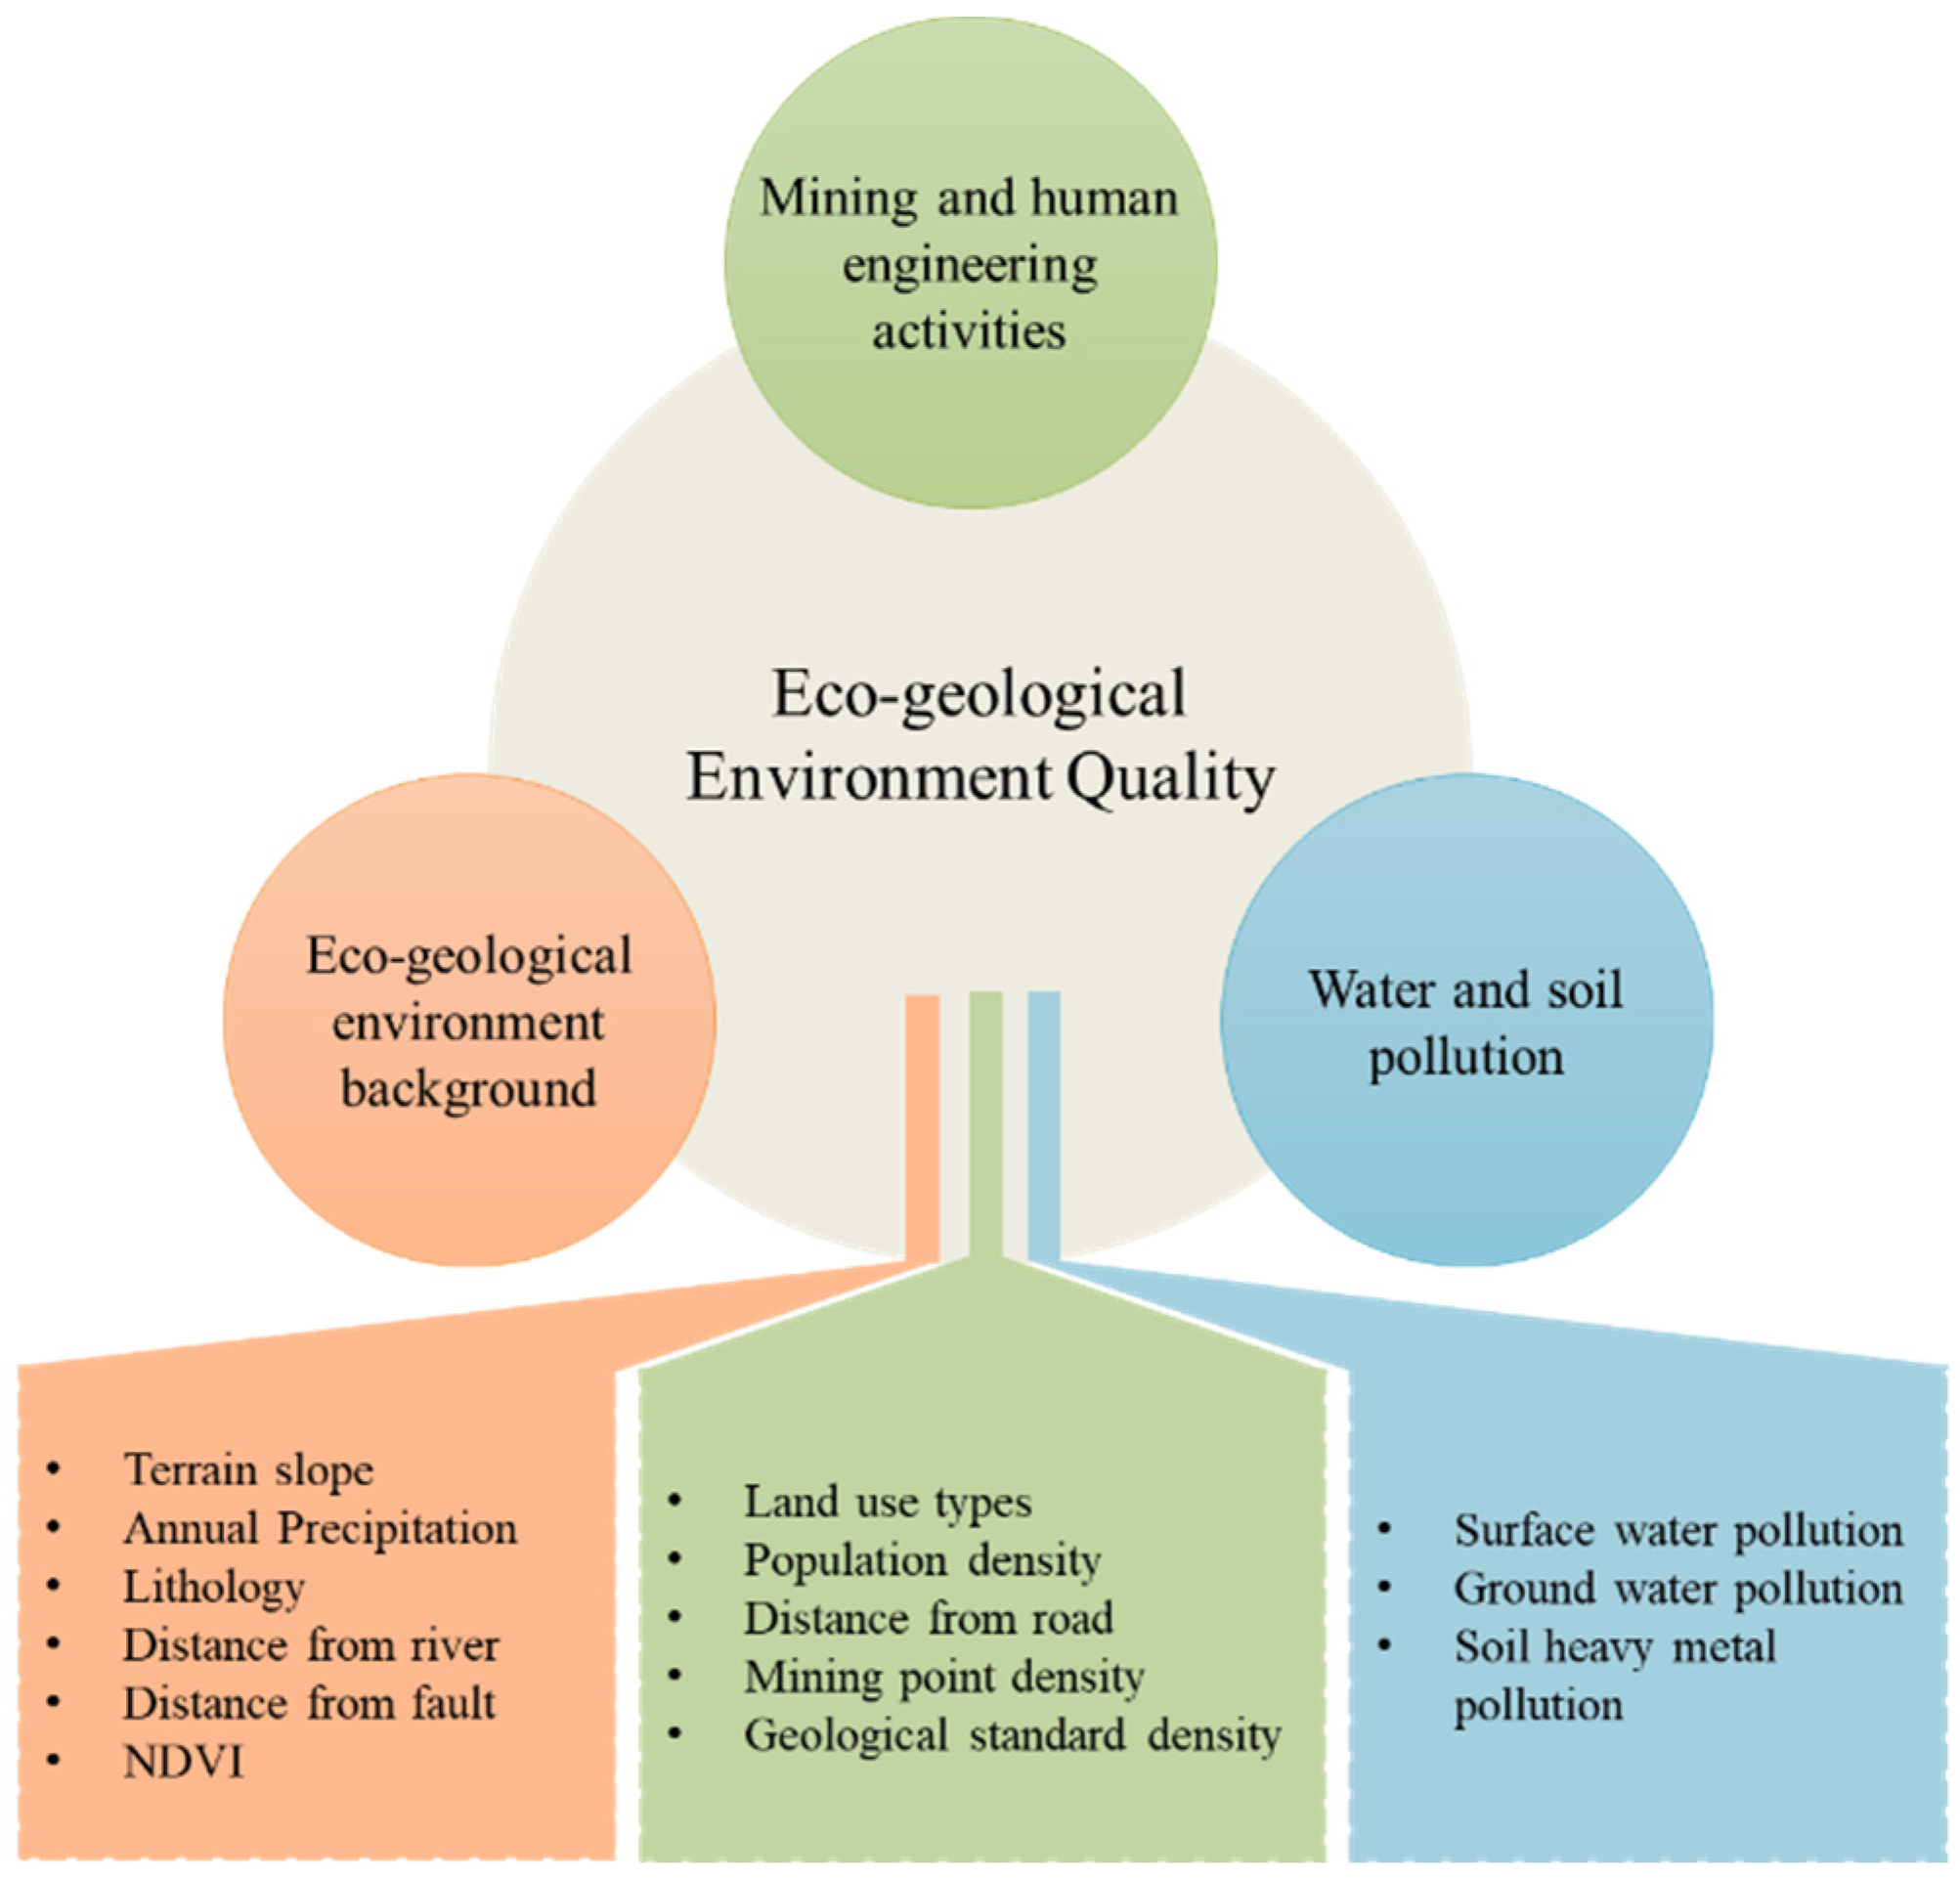
An appropriate, reasonable, and representative index system is the key to objectively reflecting EEQ in the study area [
28]. Based on the concept of eco-geological environment system and research progress [
29,
30,
31], combining the influence of internal system factors of geological and ecological conditions on the eco-geological environment and the influence of external system factors of mining activities and social economy the on eco-geological environment, and through communication with experts, 14 evaluation indexes were finally summarized, and the principles of selecting indexes are shown in
Table 1.
2.4. Data Sources and Classification of Indicators
The research data primarily contain remote sensing, meteorological, and basic geographic information vector data based on the evaluation indexes chosen in
Section 2.3, and
Table 2 lists the corresponding data sources for each indicator. The DEM data used in this study were obtained with a spatial resolution of 30 m from the geospatial data cloud sharing platform (
http://www.gscloud.cn, accessed on 1 January 2022) and were used to generate topographic slope data. The Normalized Difference Vegetation Index (NDVI) for 2015 in the study area was calculated in Google Earth Engine (
https://earthengine.google.com, accessed on 22 February 2022), and the results were synthesized based on the NDVI maxima of the July–September images. Land use data were obtained from the Global Land Cover Map FROM-GLC version2 (2015_v1) dataset (
http://data.ess.tsinghua.edu.cn/fromglc2015_v1.html, accessed on 18 March 2022) and were divided into eight categories according to cropland, forest, grassland, shrubland, wetland, water, impervious surface, and bare land. Precipitation data were obtained from the National Tibetan Plateau Scientific Data Center (
https://data.tpdc.ac.cn, accessed on 30 March 2022), and the annual rainfall for 2015 was selected. Population density data were obtained from the 2015 WorldPop dataset with a spatial resolution of 100 m (
https://www.worldpop.org, accessed on 19 March 2022). Other geographic information data were obtained from the national geographic information database (
https://www.webmap.cn, accessed on 3 January 2022) and vector data provided by the General Geological and Environmental Monitoring Station of Jilin Province.
All indicators are shown in
Figure 3. ArcGIS 10.8 (Esri, Redlands, CA, USA) was used for data resampling and projection transformation. Then, the grid data of the index assessment layer was formed with a spatial resolution of 250 m × 250 m, and a unified the WGS 1984 UTM Zone 52N projection coordinate system was uniformly used for the coordinates.
Eventually, 14 indicators were chosen to characterize the current state of mine EEQ from three perspectives: eco-geological environment background, mine human engineering activities, and soil and water pollution. The impact of EEQ in the study area is classified into five grades: good, better, medium, poor, and poor areas (V
1, V
2, V
3, V
4, V
5), which are quantitatively assessed using remote sensing data and field survey data, and the corresponding grading thresholds are shown in
Table 3.
2.5. Calculate the Weights of the Iindicators
The impact of mining activities on EEQ has obvious and long-term spatial heterogeneity [
49,
50]. By selecting reasonable evaluation indicators and determining the weights, the impact range can be accurately assessed. The subjective assignment method is based on the rich a priori knowledge of experts, and the objective assignment method can explain the intrinsic connection of the data itself. In this paper, we synthesize the advantages of the two evaluation methods, and apply the game theory method to find the comprehensive weights of each evaluation index based on the subjective and objective weights, i.e., we combine the ANP and coefficient of variation methods for 14 evaluation indicators, respectively, and give full play to the value of the data. The comprehensive weight calculation results are shown in
Table 4.
2.5.1. Weights Calculated the Coefficient of Variation Method
The Coefficient of Variation (CV) method is a method that directly uses the information contained in each indicator to obtain the weight of the indicator by calculation. It is an objective weighting method. The basic approach of this method is that in the evaluation index system, the indicators that have a greater variation in the value of the indicators, that is, the more difficult to achieve the indicators, such indicators are more reflective of the gaps in the evaluated units. The CV value is calculated as follows.
Negative indicator:
where
—standardized value,
—original indicator value;
,
—maximum and minimum values, respectively, of the original indicator.
- 2.
Calculate the mean and standard deviation of each indicator:
- 3.
The CV of each indicator:
- 4.
The weights of each indicator:
The CV weight calculation results of the 14 factors are presented in
Table 4.
2.5.2. Weights Calculated with ANP Method
The subjective empowerment method uses the Analytic Network Process (ANP), which is a further extension of the Analytic Hierarchy Process (AHP) [
43]. The traditional hierarchical analysis method is widely used, but in the eco-geological environment system, the indicators are not completely independent of each other [
44]. Therefore, compared with the hierarchical analysis method, the network analysis method more reasonably considers the interaction between factors or adjacent levels. ANP is divided into the following steps.
A typical ANP network is shown in
Figure 4, which consists of two parts: one is the control layer, and the other is the network layer, which is built based on the criteria of the control layer and reflects how the elements or groups of elements in the network interact with each other under the corresponding goal and criteria. In addition, ANP can build subnets according to each criterion, and each subnet is composed of groups of elements that reflect the corresponding control criteria.
- 2.
Construct the initial super matrix without weights:
Suppose there are
element groups in the network layer, i.e.,
. The elements in element group
are denoted as
. The judgment matrix is constructed according to the degree of influence of each element in the element group
on the element
, and the normalization vector
is obtained. In this way, the elements in
are compared with the elements in element group
in turn to construct their respective judgment matrices, and finally the normalized feature vectors of each judgment matrix are aggregated into a matrix,
, and finally the unweighted super matrix
can be obtained.
- 3.
Constructing the weight super matrix:
Pairwise comparisons of element groups are performed, judgment matrix
is constructed, and normalization is performed.
This results in a weight matrix
that reflects the element subtraction relationship under a certain criterion.
Weight super matrix is
- 4.
Calculating the limiting super matrix:
Because of the feedback introduced in the ANP method—the relationship of mutual influence—two elements can be compared both directly and indirectly. So, it is necessary to determine the priority of stable elements by the method of finding the limit super matrix.
where
denotes the limit super matrix and
denotes the weight super matrix.
The process of computing the limit super matrix is an iterative, stabilizing process, equivalent to the Markov process [
45]. In the limit super matrix
, each column value is then the limit relative priority of each element to the corresponding element in that column under each criterion.
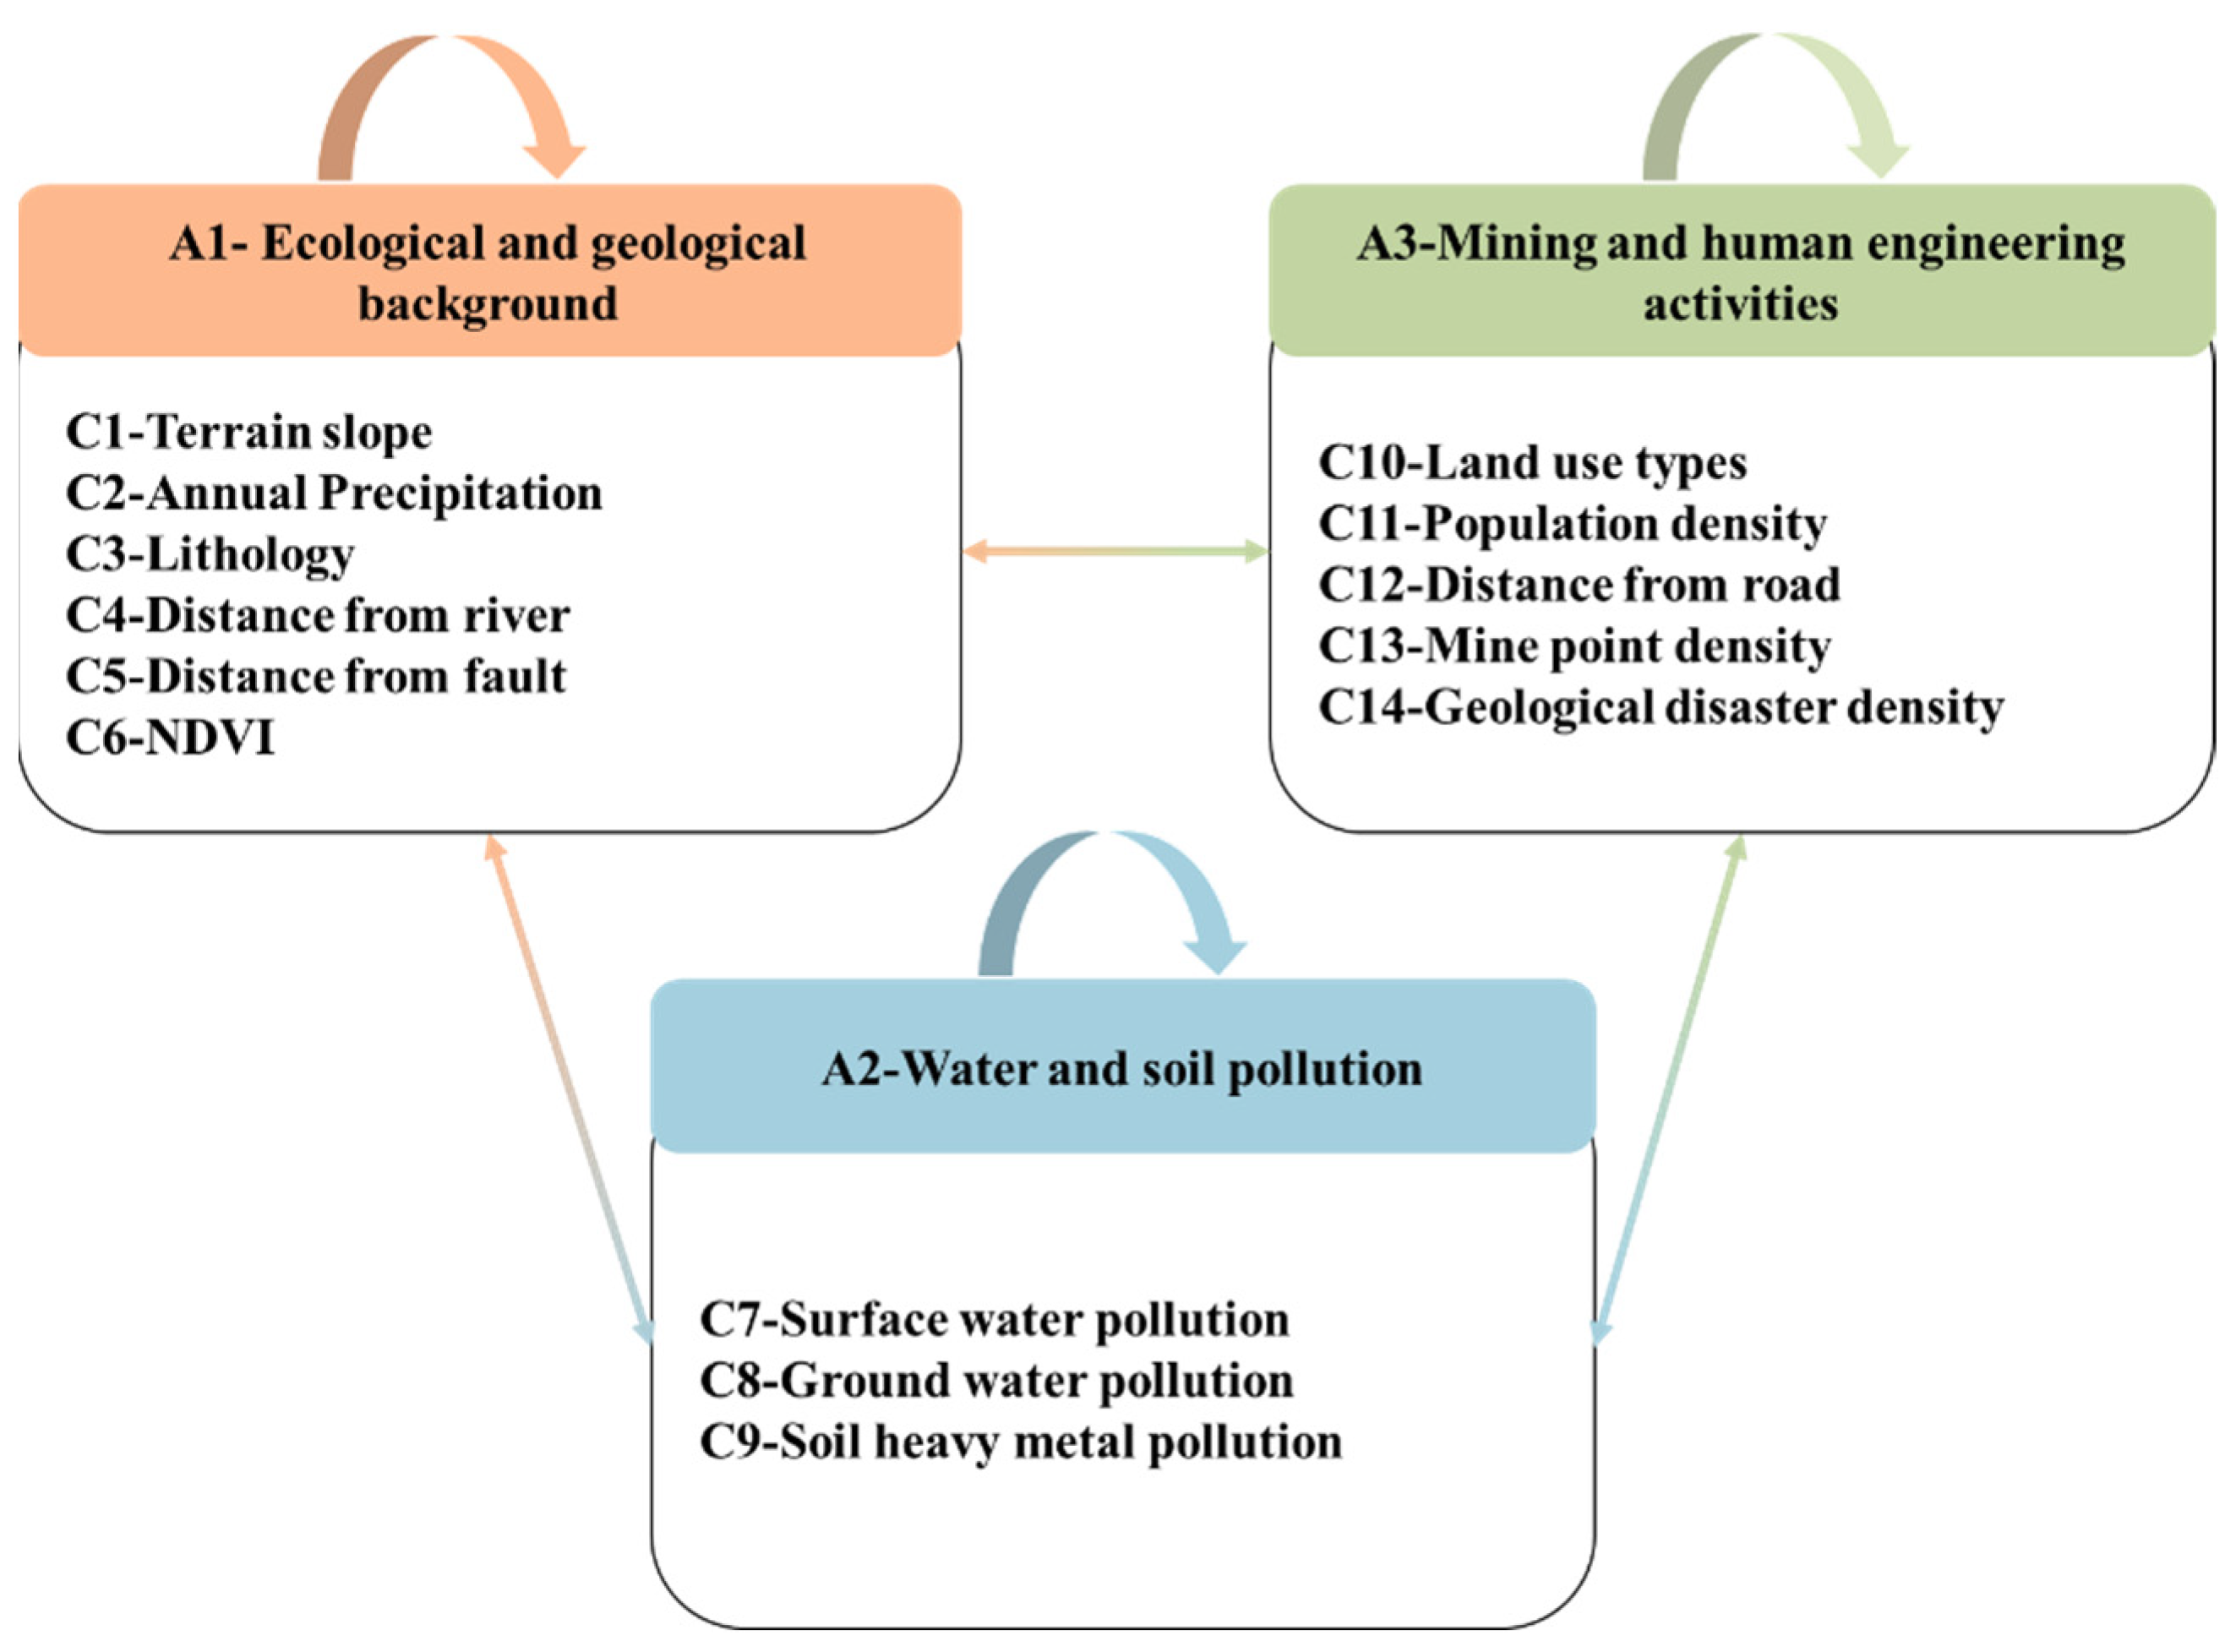
In this study, the control level objective is EEQ with 3 criteria (A1, A2, A3), and the network level indicators have 14 (C1~C14). A network analysis model was constructed based on the 14 evaluation indicators in
Figure 2 after determining the mutual influence relationship between the indicators (
Figure 5).
2.5.3. The comprehensive Weights
The game theory [
51] method is used to obtain the comprehensive weights of indicators. Based on the game theory idea, the weights determined by different methods are compared and coordinated in the form of vectors in a competitive relationship, and a more balanced result is sought to ensure the geological environment evaluation is scientific.
- 1.
In order to make the obtained weights more reasonable and realistic,
different methods are used to assign weights to each indicator, and the set of weights of each indicator is
,
. The combined weights are any linear combination between l different vectors as:
- 2.
In order to minimize the deviation between the combined weights and the basic weights, the combination coefficient
is optimized:
Following the differential properties of the matrix, taking the optimal first order derivative of Equation (14), it can be transformed into following equation:
- 3.
Calculating the combined weights:
Normalize
:
Obtain the composite index weights:
2.6. Calculation of EEQ Value of Each Grid
The EEQ evaluation value,
, was calculated using a linear weighted combination. The information of the 14 standardized evaluation indicators contained in each grid is multiplied with the combined weights to calculate the combined value.
where
is the number of factors involved in the evaluation system;
is the weight of evaluation factor
; and
represents the standardization value of each indicator.
2.7. Hot Spot Analysis
The evaluation results of EEQ are often correlated in spatial distribution, i.e., they have the distribution characteristics of clustering [
52]. The spatial hotspot identification methods for geographic data are Moran’s I, Getis–Ord Gi* statistics, where Getis–Ord Gi* statistics shows better in identifying different confidence-level statistical values, i.e., the optimal solution for guiding resource allocation in mine eco-geological environment restoration [
53]. To analyze the rationality of mine EEQ evaluation results in the study area, Getis–Ord Gi* [
54] was used to study hotspot analysis at the grid cell scale. In this study, ArcGIS 10.8 software was used to calculate the hotspot analysis of the eco-geological environment of the study area and to determine three confidence levels, i.e., 90%, 95%, and 99% of the space. Getis–Ord local statistics can be expressed as:
where
is the attribute value of element
,
is the spatial weight between elements
and
, and
is the total number of elements.
and
are:
The G* statistic is calculated for each grid z-score. For statistically significant positive z-scores, the higher the z-score, the tighter the clustering for high values (hot spot). For statistically significant negative z-scores, the lower the z-score, the tighter the clustering for lower values (cold spot).
3. Result
3.1. EEQ Evaluation Grading and Analysis
According to the weight assignment result (
Table 4) and linear weighting model (Equation (18)), the final score of each grid was obtained by using the ArcGIS raster calculation tool to show the EEQ evaluation as shown in
Figure 6a. In order to display the evaluation results more intuitively, the Natural break method is used to divide the impact evaluation into 5 levels, Ⅰ, Ⅱ, Ⅲ, Ⅳ, and Ⅴ, from high to low indicating the level. The lower the score, the worse the result of EEQ evaluation is represented.
Meanwhile,
Figure 6b screens out the grids that contain open pit mining faces. In order to show the difference in EEQ of the mine more clearly, these grids are divided into three classes according to the EEQ evaluation results, and these grids are artificially clustered to obtain the EEQ partition range of the mine.
From the EEQ evaluation results (
Figure 6a,
Table 5), the EEQ of the study area is characterized by an obvious spatial aggregation distribution. The EEQ-I area represents the best environmental area, concentrated in the western mountainous region, with a total area of 313.31 km
2. The EEQ-II area is the largest area, with a total area of 450.06 km
2. The EEQ-III area is the transition area between poor and good, mainly distributed in the northeast, with a total area of 400.5 km
2. The EEQ-IV area is widely wrapped around the periphery of the V area, with a total area of 212.06 km
2. The EEQ-V area is distributed in the upper and middle reaches of the mainstream of the Hun River, including the tributaries Hani River, Daluoquan River, and Lagu River basin, and its location is concentrated in the eastern, central, and southeastern parts of the study area, with a total area of 107.31 km
2.
Figure 6b illustrates the EEQ zoning of the mine. The EEQ of the zone severely affected by the eco-geological environment (Ⅲ) is low. This zone mainly includes parts of Ermi Town, Guanghua Town, and Daan Town in Tonghua County, and parts of Yuyuan Town, Wudaogang Town, and Tiechang Town in Erdaojiang District, and is divided into three small areas. The main mining types of Ⅲ-1 and Ⅲ-2 are metal mines, and the main mining types of Ⅲ-3 are coal mines. There were four mudslide disasters, two landslide disasters, and one landslide disaster in the area.
The EEQ of the more seriously affected eco-geological environment zone (II) is thought to be low. This zone mainly includes parts of Ermi Town, Guanghua Town, and Daan Town in Tonghua County, and parts of Yuyuan Town, Wudaojiang Town, and Tiezhuang Town in Erdaojiang District, which are divided into five small areas. The district is characterized by the prevalence of non-metallic mines. A total of 13 cave-in disasters occurred in the district.
Slightly affected by eco-geological environment zone (Ⅰ), this zone is characterized by less distribution of mining enterprises, mostly small, closed pit mines, and far from towns. Mining geological hazards are basically not developed, and EEQ level is medium-high.
3.2. Hotspots and Cold Spots of EEQ
Cold and hot spots with statistical significance are identified, with hot spots representing clusters of high values and cold spots the opposite [
55], as shown in
Figure 7. In fact, when the confidence level is greater than 95%, the data can be considered statistically significant [
56].
The cold spots with confidence levels higher than 95% account for 19.97% of the total study area. The distribution of cold spots is related to the location of the main urban area of Tonghua City, and the population concentration area is distributed along the middle reaches of the Hun River, while the coal mining areas in Erdaojiang District are distributed on both sides of the upper reaches of the Hun River. The cold spots in this study represent areas with poor mining eco-geological environments, and there are 58 mining sites in the cold spot area, including 54% of the mining sites in the total study area.
Above the 95% confidence level, hot spots account for 21.43% of the total surface. The hot spot areas are mainly distributed in Kuaidamao town and Ermi town in Tonghua County, and some sporadic distribution at the edge of the study area, far from the urban area and with low population density, fewer mining enterprises, which are still in the undeveloped and unused stage, and the eco-geological environment of the area is stable.
Overall, there is a strong correlation between EEQ and mine development and utilization. The identification of cold and hot spots can reasonably allocate investment in environmental management and achieve sustainable development of resource extraction and eco-geological environmental protection [
57].
4. Discussion
The EEQ is a prerequisite for mine reclamation in Tonghua City, and this study aims to quantify EEQ. From the results of the evaluation, it is concluded that the overall EEQ preference of the study area is high with a high concentration of mining sites in the area. Furthermore, the area covered by vegetation can be estimated by NDVI to be about 79% of the total area of the study area, and no major geological hazards have occurred in the area. However, the high degree of aggregation of mining sites in the study area creates a low EEQ preference for specific areas. From the geographical location of each mine—since 57% of the mining sites are within 1 km of rivers near the grade road—the traffic has guaranteed convenience. So, the construction cost of the ecological restoration project for the mines has a positive impact on the difficulty level, and as long as reasonable ecological restoration measures are taken, Tonghua City will gradually complete the task of restoring the national space and improve the overall EEQ.
4.1. Reliability of the Method
Some evaluation methods, such as fuzzy evaluation and informative evaluation, cannot explain the relationship between evaluation elements and each other and between evaluation elements and the eco-geological environment [
58,
59]. In response to the non-linear relationship between EEQ evaluation results and evaluation indicators in the study area, we chose the ANP method that can overcome the barriers between indicators, significantly explain the non-linear relationship between indicators, and with evaluation targets and combine with the coefficient of variation method to weaken the subjective interference, which is used to reveal the spatial distribution of EEQ. Therefore, this assignment method is suitable for evaluating EEQ
Regression analysis can characterize the driving factors affecting EEQ. To better explain the degree of influence of individual evaluation factors, 1000 sample points in the study area were randomly extracted, and then the regression coefficients between 14 evaluation factors and EEQ were calculated using the ordinary least squares method [
60], as shown in
Table 6. It is clear that mine density and NDVI contribute more to EEQ compared with other indicators in the assignment method and regression analysis calculations. Mining is the main factor limiting the ecological environment of the area, and controlling mining is an important way for sustainable development.
4.2. Suggestions for Improving EEQ in Tonghua
Section 4.1 shows that mine reclamation is the most direct way to improve EEQ. According to statistics, more than 70% of Tonghua is open pit mining, and this approach causes serious damage to the land and biomass [
61]. Mine reclamation can be carried out on the basis of mine EEQ classification (
Figure 6b). This includes the following three aspects: 1. Mines in subzone I can be restored mainly by natural means with artificial assistance, and the restoration direction is tailored to local conditions, following the principle of “forestry where appropriate and farming where appropriate” [
62]. 2. The mines in subzone II, due to the more serious development and utilization, shall develop corresponding mine land reclamation plans and then implement engineering measures. 3. The eco-geological environment of the mines in subzone Ⅲ is seriously damaged, with a large open-pit mining area, completely losing the original geomorphological features and land cultivation value, and the reclamation work requires a large amount of investment. Therefore, it is more appropriate to build a mine park or develop commercial land in this area. All mine reclamation should be carried out without deepening the damage to the eco-geological environment.
At the same time, increasing forest cover, implementing afforestation and greening projects, and strengthening ecological protection are also effective ways to improve EEQ.
4.3. Performance in Environmental Policy
Tonghua City has steadily implemented ecological regulations and limited the development of non-essential mineral resources since being designated as a resource-based city in 2011. The demonstration project of mine geological environment treatment in Erdaojiang District, which has treated an area of nearly 11 km2, was officially launched in 2012, alleviating environmental problems such as geological disasters, land occupation, landscape destruction, and vegetation damage that existed in the region.
Within the scope of the city’s water source quasi-protected areas, secondary protected areas are set up to limit the investigation area. Certain area have been set up to prohibit investigation n the nature reserves, ecological function areas, cultural and natural heritage within a certain area; important drinking water source primary protection zones; and tourist scenic areas, historical relics, famous monuments, and other protected areas.
From the statistical yearbook collected by CNKI, we know that the annual mining output value in Tonghua gradually decreased from 5948.22 million RMB in 2014 to 616.43 million RMB in 2017 (the remaining years are not explicitly listed in the gross mining product), which shows that Tonghua has actively participated in the industrial transformation.
Due to the long history of mining in Tonghua and the lack of relevant laws in the early days, the abandoned mines left by history have become a “difficult problem” for the ecological environment. In 2021, the Natural Resources Bureau of Tonghua City issued a government document to treat 41 abandoned mines. This action represents the contribution of the Tonghua government to protecting the habitat and eco-geological environment.
4.4. Limitations and Future Work
This study uses multi-source data to evaluate EEQ and make recommendations for eco-geological environmental protection in Tonghua, but there are inevitably some limitations. Tonghua City is a resource-based city, and the EEQ evaluation system is less applicable to a city with fewer mining activities.
In this study, the evaluation base cell is a 250 m×250 m grid. Although it is possible to distinguish the trend of the indicators, it will certainly bring some influence on the zoning results, and there will be an “enclave” phenomenon.
It can be found in the conclusion of the study that the indicators about human and mining engineering activities have a greater influence on the evaluation results, so the relationship involving the living environment, production environment, and ecological geological environment of the city will be the next research direction.
5. Conclusions
The quantitative and comprehensive evaluation of EEQ in the mineral concentration mining area of Tonghua City shows that the ecological and geological environment problems in the area are significantly aggregated. Based on the EEQ evaluation, three types of mine clusters can be classified and used to determine the classification of the degree of influence by mining activities. Combined with the hot spot analysis method, it highlights the areas in the study area that need to focus on the eco-geological environment.
Overall, the EEQ evaluation shows that the areas with EEQ-Ⅰ and EEQ-Ⅱ in the whole study area account for 51.5%, and the overall eco-geological environment is at the middle to upper level.
This study is of positive significance for accelerating the eco-geological environment survey in the mineral resource development zone of the study area, promoting the geological environment monitoring in the survey area, establishing a sound eco-geological environment monitoring system, strengthening mine geological environment protection, accelerating the comprehensive management of mine geological environment, and carrying out research on mine eco-geological environment protection and management techniques and methods.


