Article

Field Study on the Side Resistance-Softening and Resistance-Reinforcing Effects of Large-Diameter Combined Grouting Drilled Shafts

1
Key Laboratory of RC and PRC Structures of Ministry of Education, Southeast University, Nanjing 211189, China
2
School of Civil Engineering, Southeast University, Nanjing 211189, China
3
College of Transportation Engineering, Nanjing Tech University, Nanjing 211816, China
*
Author to whom correspondence should be addressed.
Sustainability 2022, 14(11), 6835; https://doi.org/10.3390/su14116835
Submission received: 5 May 2022 / Revised: 25 May 2022 / Accepted: 27 May 2022 / Published: 2 June 2022

Abstract

:
The traditional design method for drilled shafts rarely considers the influence of construction effect and tip resistance on side resistance, and lacks attempts to improve the performance of drilled shafts without increasing drilled shafts sizing, economic costs and carbon emissions. In this paper, the influences of construction-effect and shaft tip resistance on the side resistance of large-diameter drilled shafts before and after combined grouting were studied by full-scale field tests. The reinforcing effect of combined grouting on bearing capacity was confirmed, and the potential of applying combined grouting to realize sustainable development, the economy, and environmental protection was introduced. The mechanisms of softening-effect and reinforcing-effect on the side resistance of large-diameter drilled shaft are discussed in depth. The field test results showed that the construction-effect and shaft tip sediments caused the side resistance to soften, and the lower the shaft tip resistance, the more serious the side resistance softening-effect. The mobilization of side resistance was affected by the soil strength underneath the shaft tip. The shaft tip bearing capacity was improved after sediment compression, which helped to reinforce the side resistance near the shaft tip. Combined grouting improved the side resistance reinforcing-effect even further and broadened the range of soil layers that can benefit from it. The fundamental reason influencing the side resistance softening-effect and reinforcing-effect of the drilled shaft was the change in soil radial effective stress. This research provided certain references for improving the performance of drilled shafts without increasing drilled shafts sizing, economic costs and carbon emissions.

1. Introduction

Large-diameter drilled shafts have grown in popularity in China due to their ability to effectively control upper structure settlement, particularly in highway bridge engineering in soft soil areas [1]. For large-diameter drilled shafts in soft soil, shaft side resistance accounts for the majority of the drilled shaft bearing capacity. The traditional design method improves the bearing capacity of drilled shafts by enlarging the size of drilled shafts, which increases the economic cost, resource consumption, and carbon emissions. The side resistance and the tip resistance are independent of each other in the traditional drilled shaft design method, and the bearing capacity of drilled shafts is simply the sum of the tip resistance and the side resistance. Under given geological conditions, the shaft side resistance and shaft tip resistance are constant. However, in engineering practice, it has been discovered that they are not set values and are also impacted by the construction technique of drilled shafts [2]. Furthermore, shaft tip resistance and shaft side resistance are not independent of each other, and there is some interaction between them [3,4,5,6].
The test results of many scholars [7,8,9,10] indicate that the strength of the shaft tip soil influences the mobilization of shaft side resistance. According to several studies, the side resistance softens with depth at a given depth range far from the shaft tip [11,12,13,14,15], whereas the side resistance reinforces near the shaft tip due to the interaction between the tip resistance and the side resistance [7,8]. Zhang reported that even if there are drilled shafts with similar size in the same site, the side resistance of the shaft with tip sediment is softened [7]. Zhang [7] also reported that a shaft with high tip resistance has a side resistance reinforcing-effect. Many scholars [16,17,18,19] proposed that the dilatancy characteristics of the shaft-sand interface under loading enhance the shear strength of the shaft-sand interface and strengthen the shaft side resistance.
During the drilling process of drilled shafts, mud remains on the shaft wall and the radial effective stress of the shaft side soil is reduced, resulting in the side resistance softening-effect [20,21,22]. Furthermore, residual construction sediment at the shaft tip reduces tip resistance [23,24,25]. Post-grouting is widely used in drilled shafts as an effective means to solve these problems [26,27,28,29,30]. By post-grouting, the cement slurry is injected into the soil at the shaft tip or side at high pressure. Post-grouting has great advantages in terms of economy and environmental protection [31,32,33]. Practice has proved that the application of post-grouting in construction can reasonably reduce the size of drilled shafts and reduce the amount of concrete and steel used [1] to achieve the goal of sustainable development, such as protecting the environment, reducing economic costs, and saving resources. Many scholars have conducted extensive research and discussion on the reinforcement mechanism of post-grouting on side resistance and tip resistance of the shaft in recent years [34,35,36]. However, most of these studies are focused on small-diameter or medium-diameter drilled shafts with tip grouting. Research on the side resistance softening-effect and reinforcing-effect of large-diameter combined grouting drilled shafts is sparse, and there is no research on the influence of tip resistance on side resistance after combined grouting [20,37].
At present, research on the softening-effect and reinforcing-effect of shaft side resistance mostly adopts the method of indoor model tests, while the field test is recognized as the most reliable means to obtain the authenticity of the test drilled shaft [38]. Therefore, in this paper, the following works were carried out by a field bi-directional static test: (1) through comparative tests, the reinforcing effect of combined grouting on bearing capacity was confirmed, and the potential of combined grouting to reduce drilled shaft sizing and carbon emissions was introduced; (2) the influences of construction effect and shaft tip resistance on the softening-effect and reinforcing-effect of shaft side resistance before and after combined grouting were studied; (3) the reinforcement effect of combined grouting on side resistance and tip resistance was studied; (4) from the perspective of radial effective stress change in soil around the shaft, the mechanism of side resistance softening-effect and reinforcing-effect was explained. This research provides references for reasonably revising the traditional design method of drilled shafts, improving the performance of drilled shafts without increasing drilled shafts sizing, economic costs and carbon emissions.

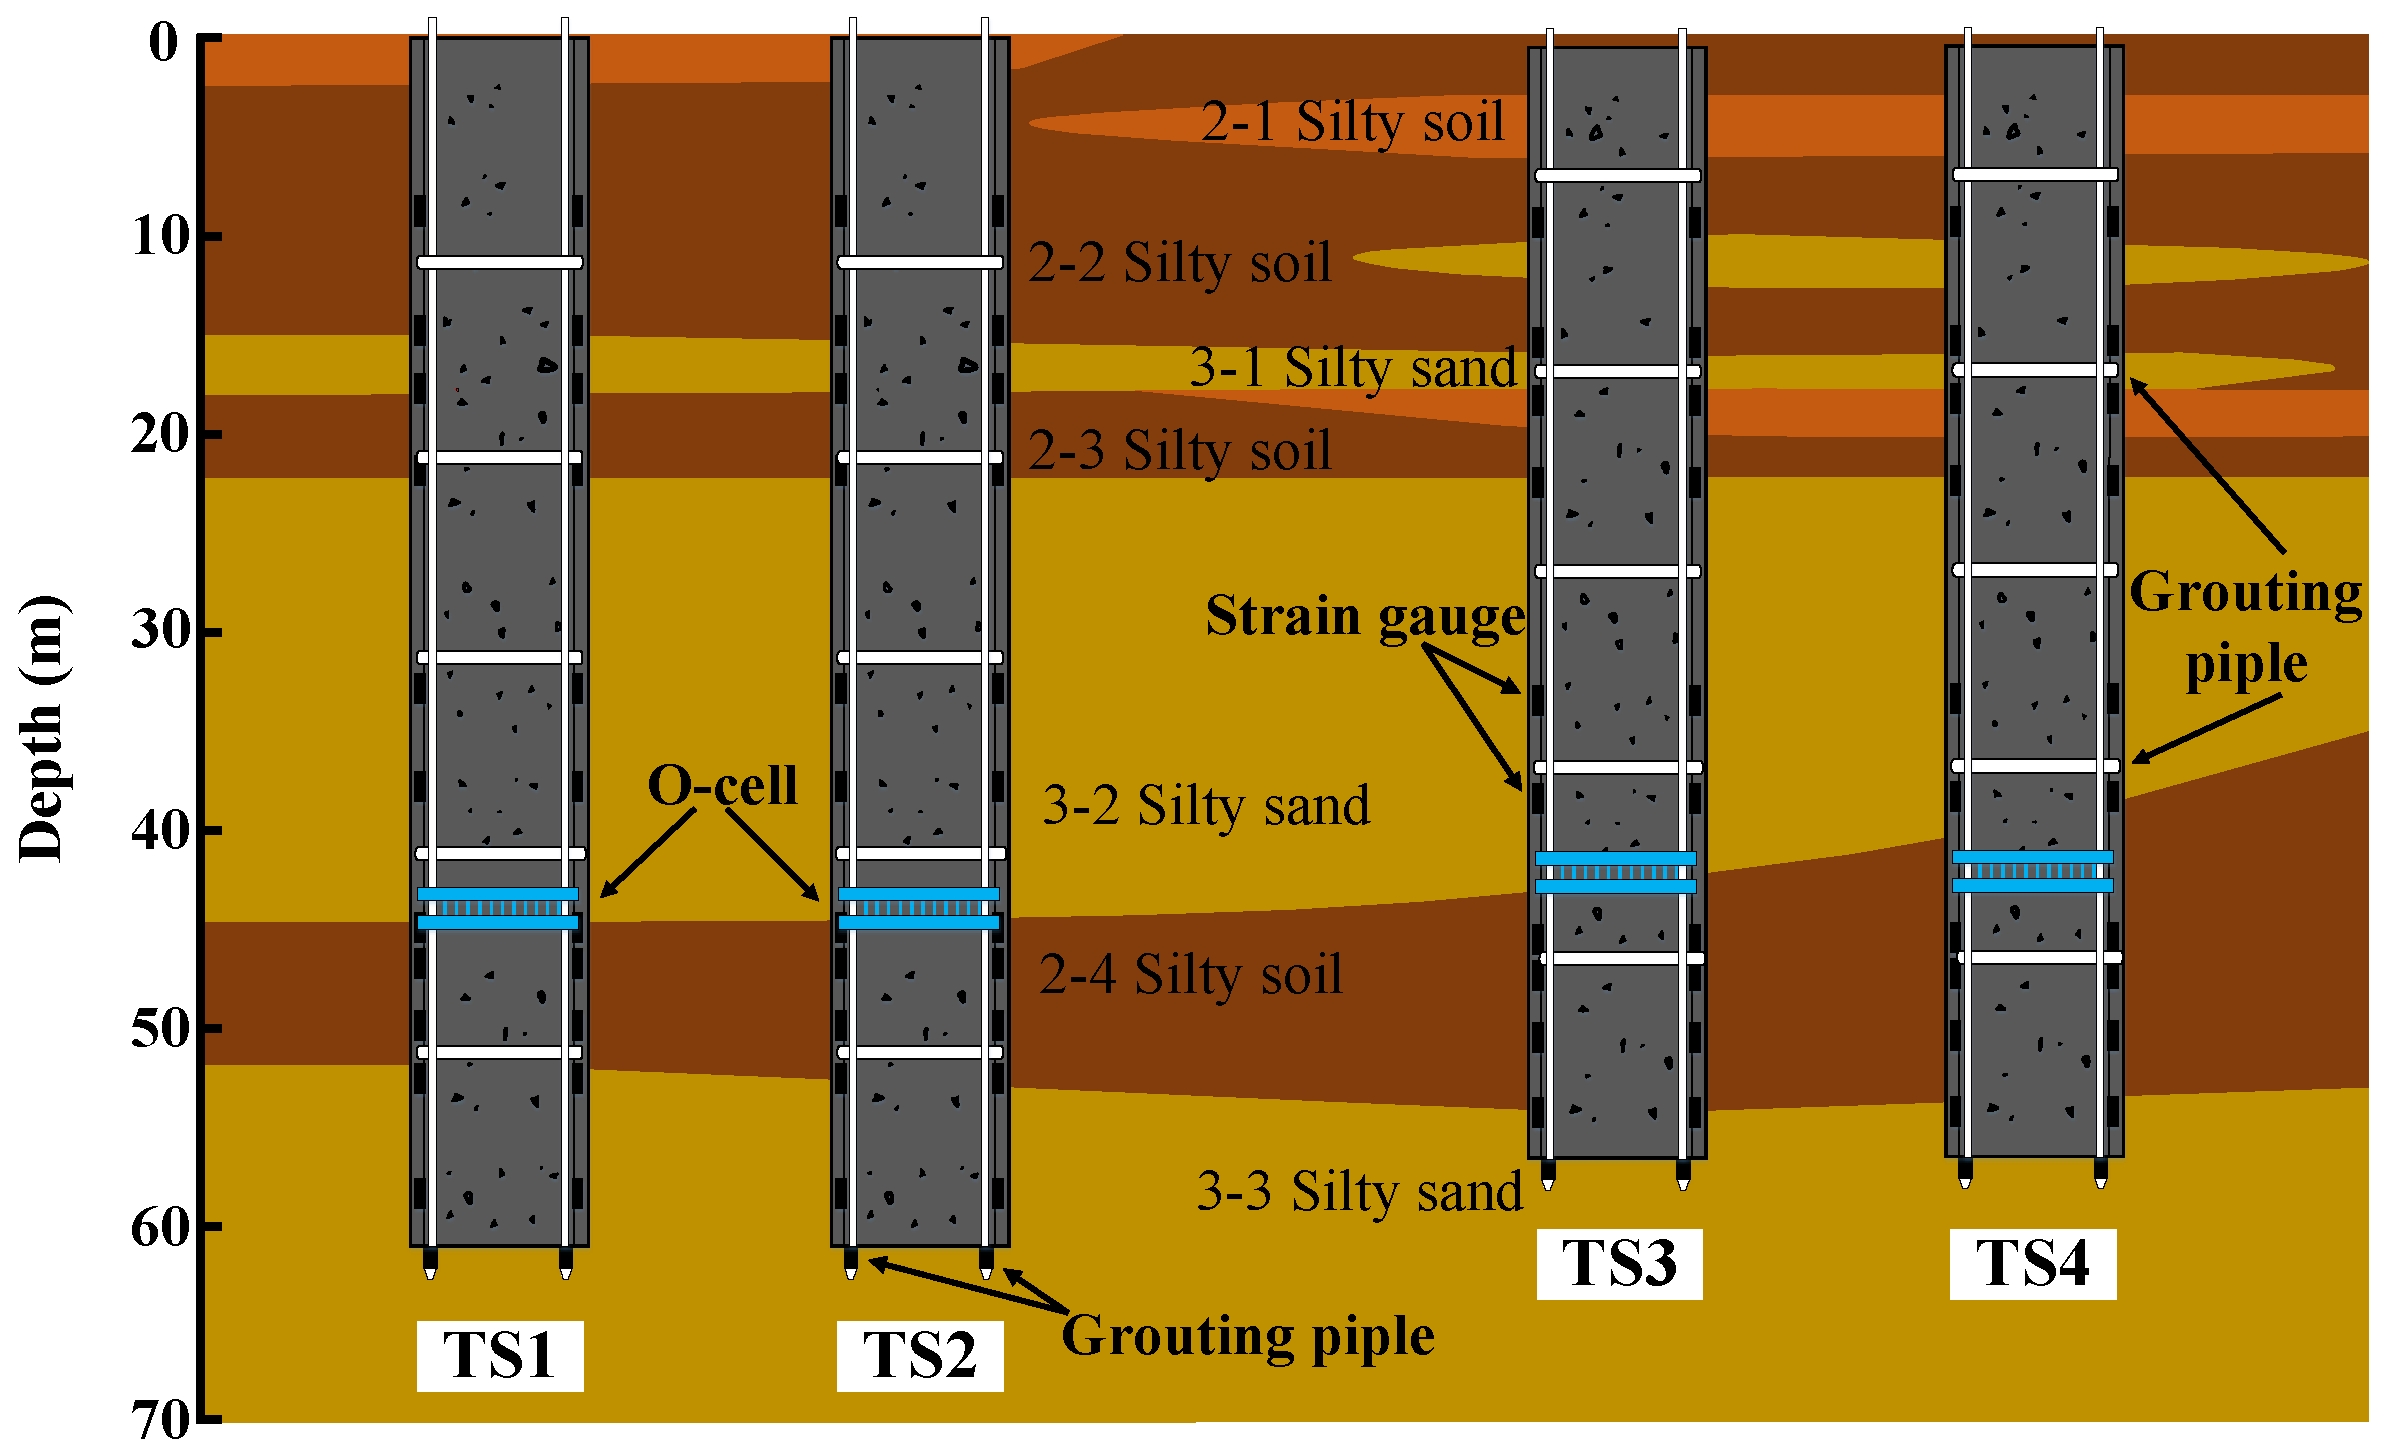
2. Description of Test Site

The highway from Zhanhua City to Linzi City in Shandong Province, China, has a total length of 108.697 km and required the construction of 73 bridges. This project is a simple beam bridge across the Delongyan Railway, located in Liangcai Township, Binzhou City, Shandong Province. Its length is 1262.2 m and its width is 30 m. The bridge of this project is based on large-diameter bored piles. The bridge for this project is based on large-diameter drilled shafts. Figure 1 depicts the plane and left profile of the bridge at the test site section. The route passes through the alluvial plain of the Yellow River. The soil layers in this area are mainly silty soil and silty sand.
To comprehensively explore and evaluate the test site, engineering drilling, in-situ tests, and laboratory geotechnical tests were used. Figure 1 shows the SPT drilling position. According to drilling data, the strata in the exploration depth range are mostly Quaternary late Pleistocene alluvial soils such as silty clay, silty soil, and silty sand. Figure 2 depicts the detailed soil distribution of the test site.
Detailed soil parameters are shown in Table 1, where w is the moisture content, c is the cohesion, φ is the internal friction angle, Es is the compression modulus, γ is the gravity, qs is the ultimate side resistance, SPT is the standard penetration test, and N is the hit number of the standard penetration test.
In order to enhance the bearing capacity of drilled shafts and reduce the settlement of shaft heads, combined tip and side grouting was adopted. In order to verify the improvement effect of combined grouting and determine the performance of drilled shafts, four test drilled shafts were selected for static load test verification. The diameter of all test piles was 1.8 m, the length of TS1 and TS2 was 61 m, and the length of TS3 and TS4 was 57 m. Following the completion of the drilling operation, ultrasonic equipment was used to assess the quality of the shaft completion. The detailed data of the drilled shaft is shown in Table 2. The elastic modulus of the concrete for the four test drilled shafts was 31 GPa.

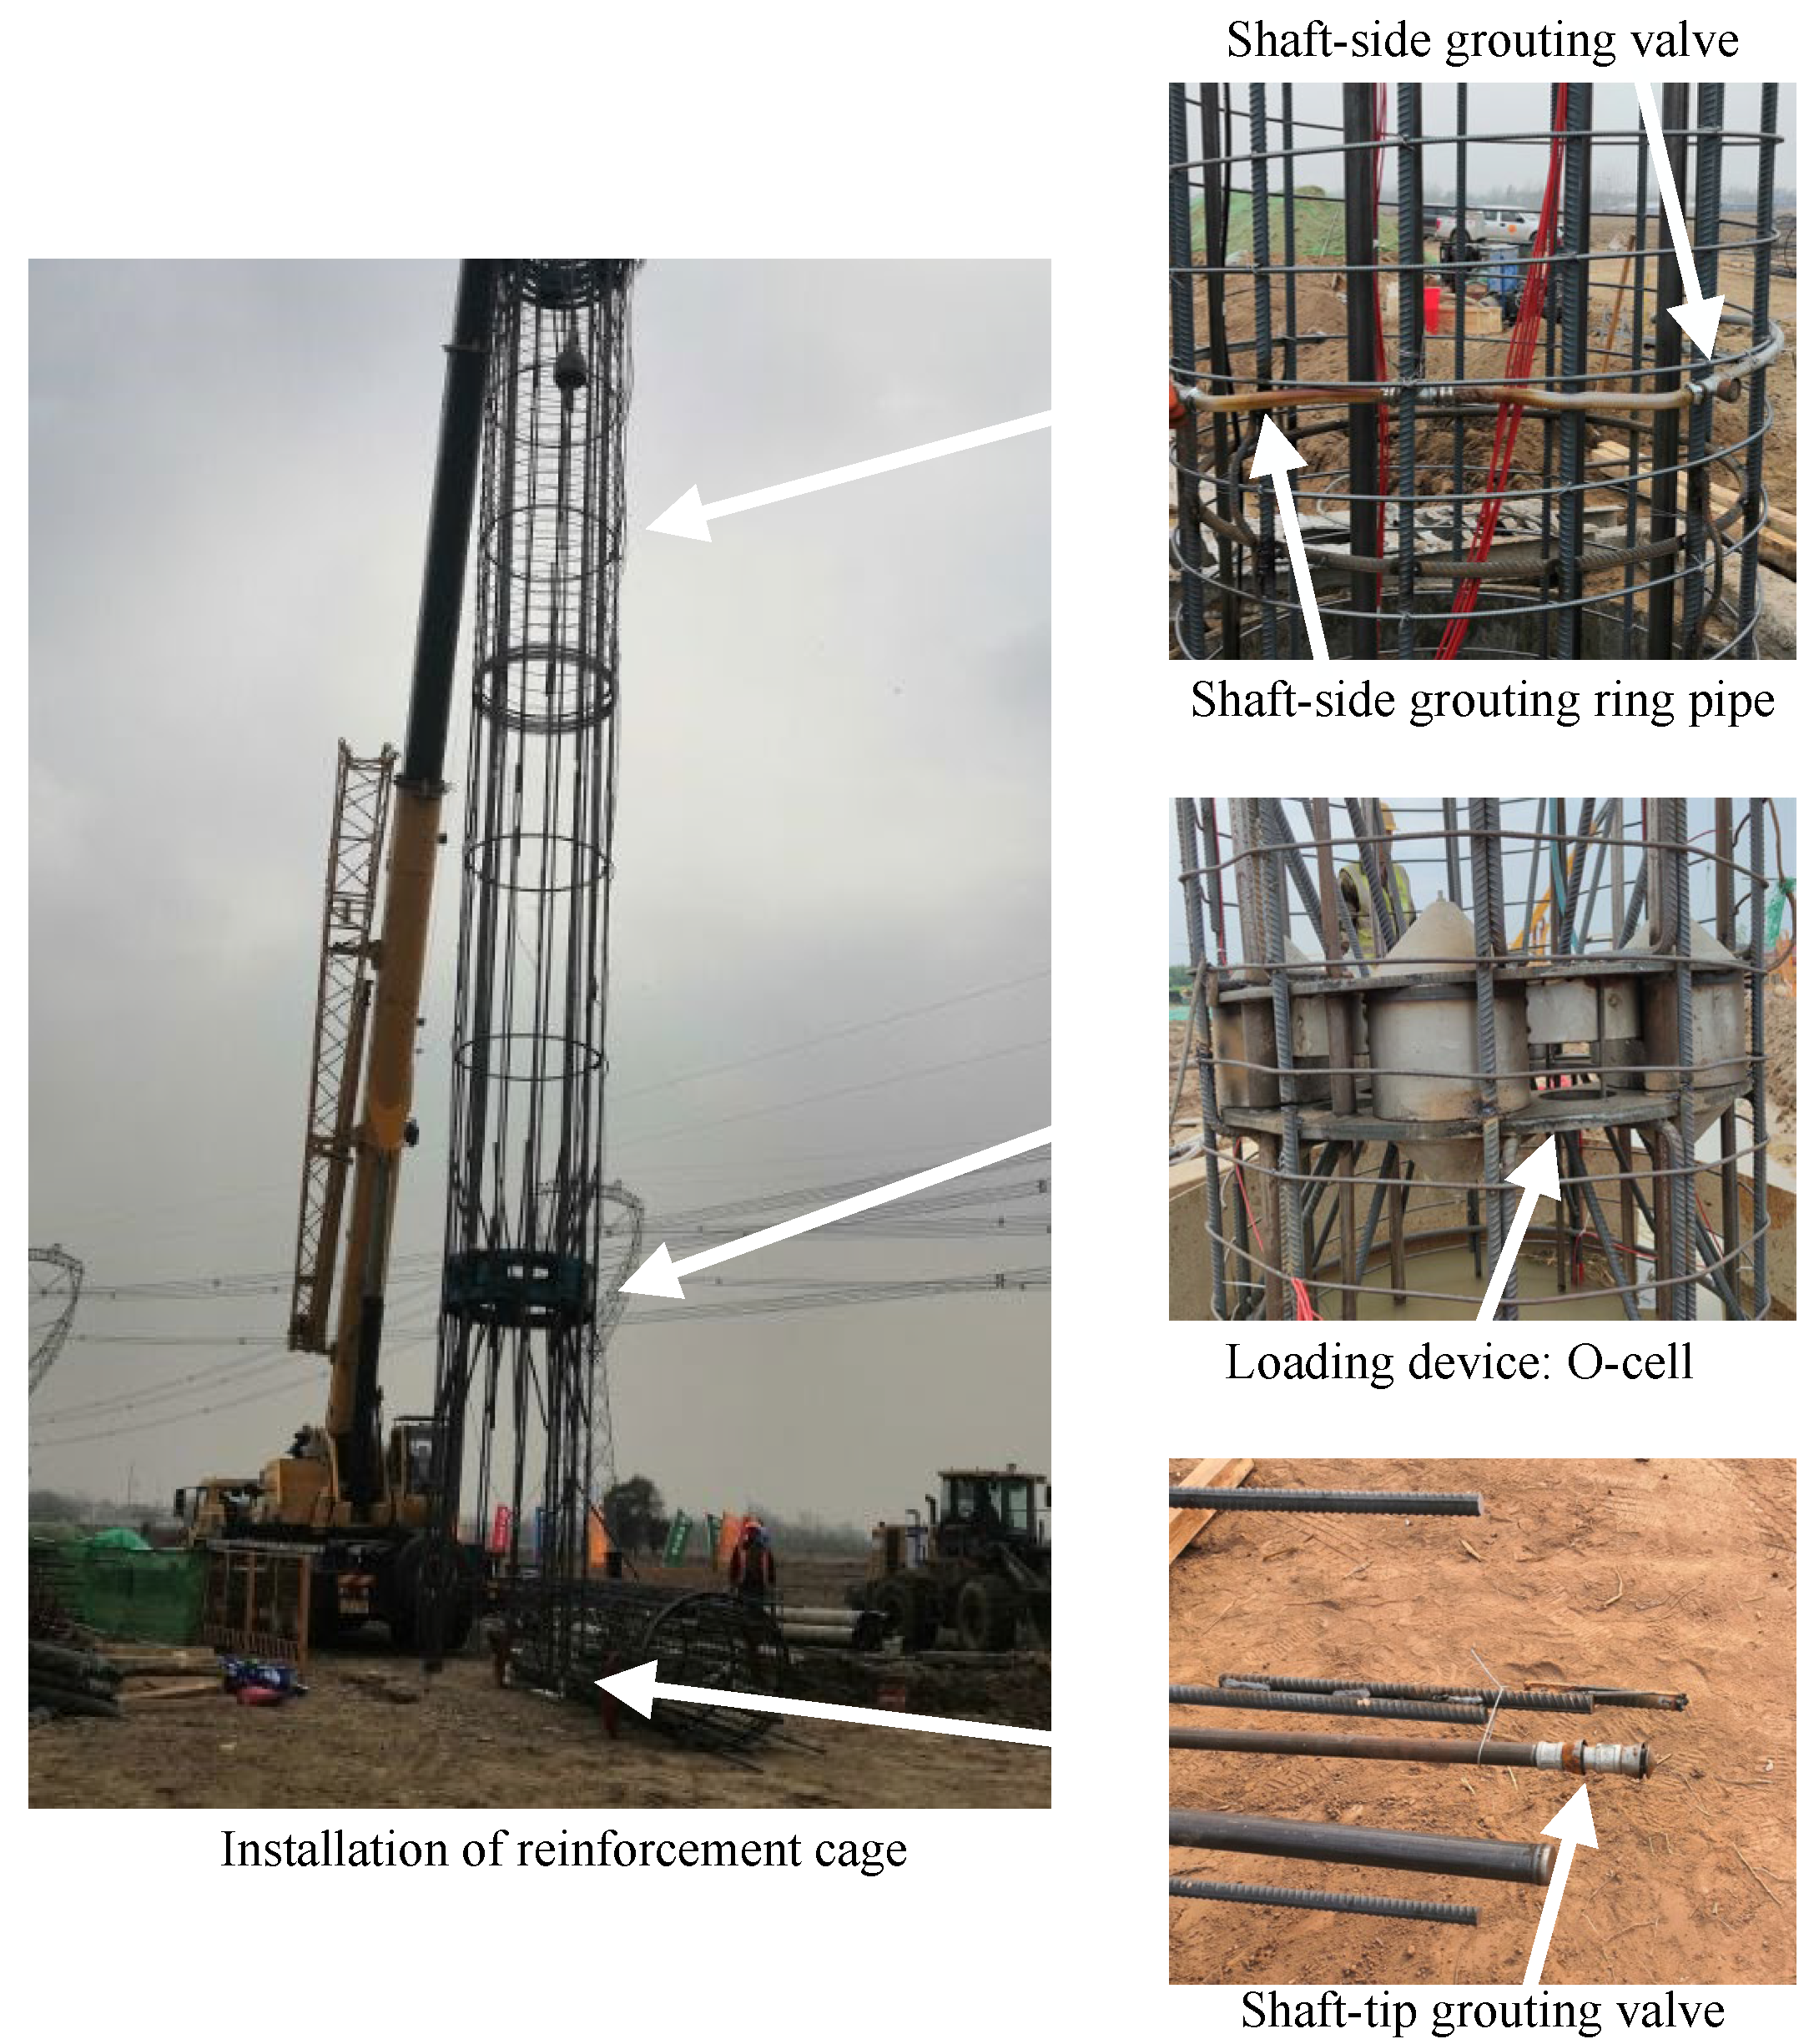
3. Combined Grouting and Testing Programs

3.1. Combined Tip and Side Grouting

When the concrete strength of the test drilled shafts reached 80% of the design strength, combined tip and side grouting began. The combined grouting system was similar to that described by Wan [20]. The shaft-side grouting ring pipe and the shaft-tip grouting valve are shown in Figure 3. Three straight grouting pipes were fixed at the shaft tip. The shaft-side grouting ring pipes were arranged from a position of 10 m above the shaft tip, and one grouting ring pipe was arranged at each interval of 10 m, so there were five shaft-side grouting ring pipes in one test shaft. Figure 2 depicts the precise location of the grouting pipe. P.O 42.5 Portland cement (ordinary Portland cement with a uniaxial compressive strength of 42.5 MPa under 28d standard curing conditions) was used for combined grouting. The water cement ratio was 0.55.

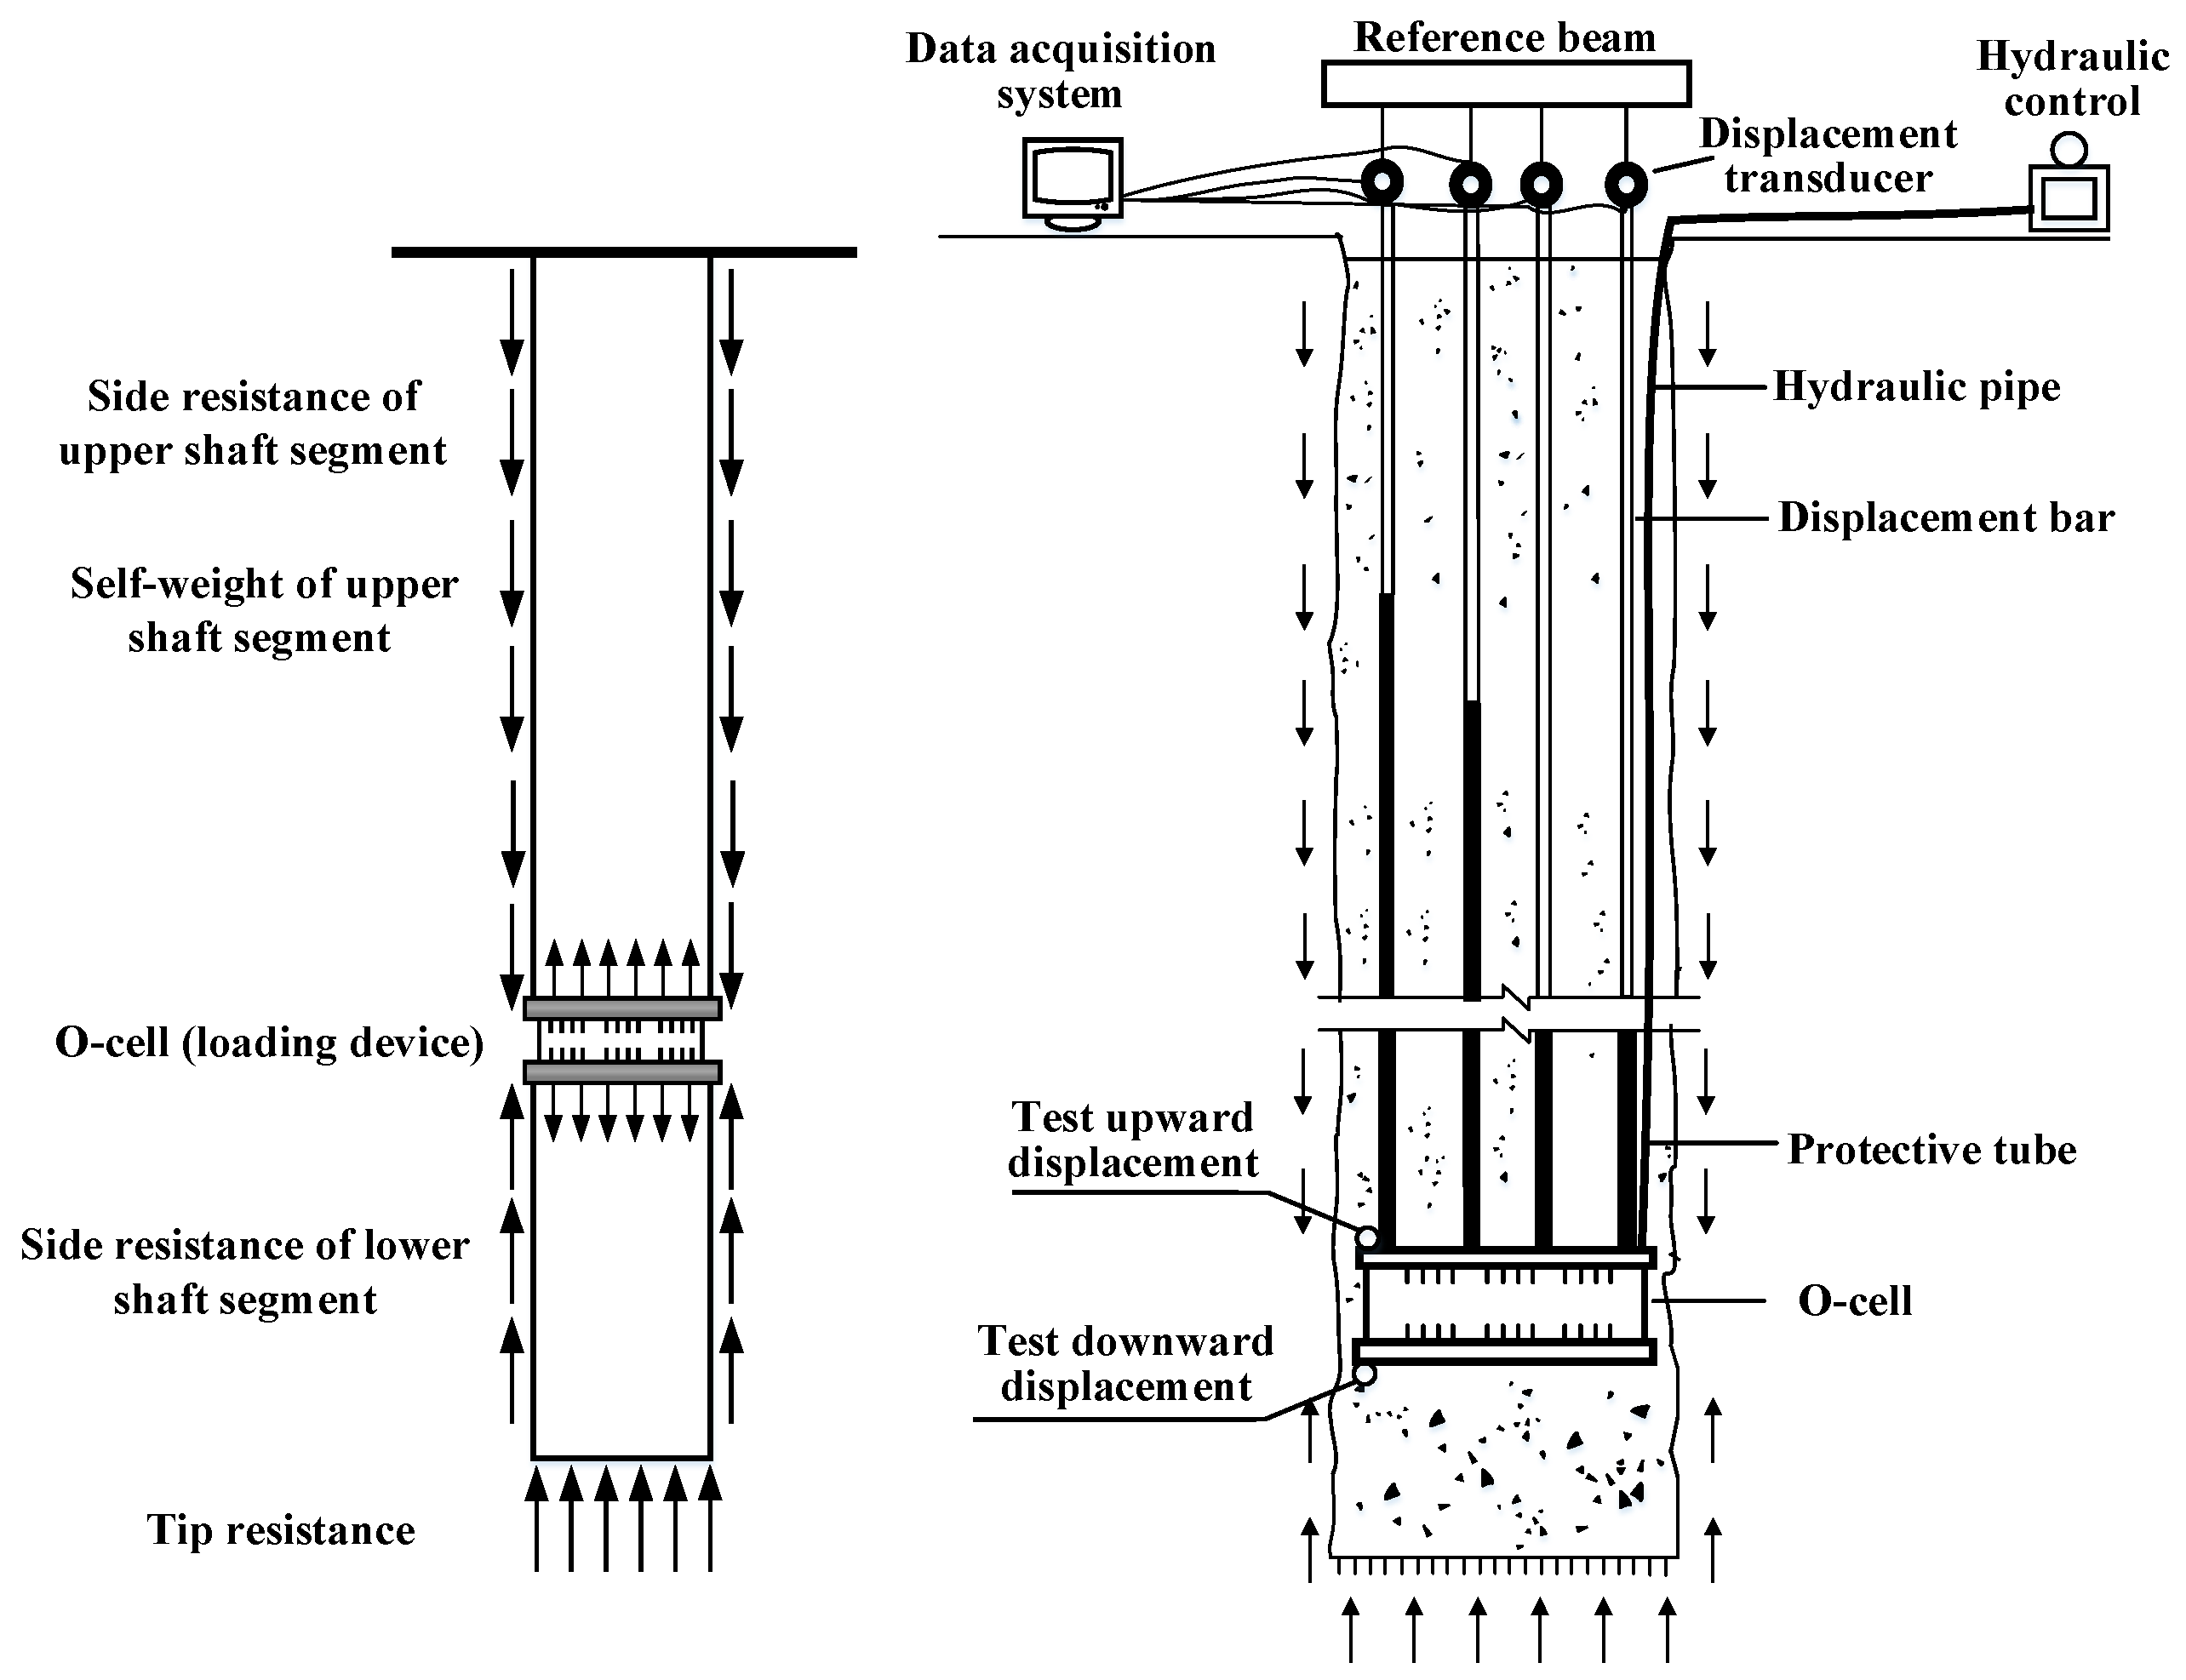
3.2. Field Bi-Directional Static Test

All test shafts were tested by the field bi-directional static test, which is the new method for bearing capacity detection in drilled shafts. In 1969, Nakayama and Fujiseki put forward the concept of testing the bearing capacity of the drilled shafts by the mutual reaction of shaft side resistance and shaft tip resistance, also known as the shaft tip loading test method [39]. Subsequently, Osterberg [40] applied this technology to engineering practice, so this loading method was also called the Osterberg-Cell load test or O-cell load test. Figure 4 depicts the typical bi-directional static test setting and loading principle. The O-cell was installed 17 m above the pile tip for TS1 and TS2, and 15 m above the pile tip for TS2 and TS3.The first bi-directional static test was performed 28 days after the drilled shafts were poured, and the combined grouting operation followed the first bi-directional static test. The second bi-directional static test was conducted 40 days after the completion of the combined grouting operation [21,31]. In order to monitor the axial strain and load transfer along the test shafts in the tests, the strain sensors were fixed on the vertical reinforcement along the entire test shafts. The specific installation positions of the strain sensors and the loading device are shown in Figure 2. When the bi-directional static test began, the hydraulic control system on the ground was pressurized, and the O-cell (loading device) applied loads to the upper and lower sections of the drilled shafts via hydraulic action. Two displacement transducers were installed at the top and bottom of the O-cell, and four displacement transducers were arranged at the head of the test shaft. These displacement transducers were used to record the displacement data during the loading. The test employs the slow maintenance load method, and the loading (unloading) procedure followed to Chinese standards [41].

4. Results and Discussion

4.1. Results of Bi-Directional Static Test

The load-displacement curves of the upper segment and lower segment of the shaft tested by the bi-directional test are shown in Figure 5. In Figure 5, Ddu and Duu represent the downward and upward displacements measured by the O-cell before grouting, respectively; while Ddg and Dug represent the downward and upward displacements measured by the O-cell after grouting, respectively. It can be seen from Figure 5 that the load–displacement curves of the upper segments of the four test shafts showed slowly-varying characteristics before grouting, whereas the load-displacement curves of the lower segments were steeper. The load–displacement curves of the lower segments of TS1 and TS3 showed a slow-steep-slow varying characteristic, especially in TS3. This could be because the shaft tip sediment of TS3 is the thickest.
When the load of TS1 was increased to 7000 kN, the displacement of the lower segment of TS1 increased sharply then returned to normal when the load was increased to 8000 kN. Similarly, when the load of TS3 was increased to 4000 kN, the displacement of the lower segment of TS3 increased sharply then returned to normal when the load was increased to 6000 kN. In contrast, the displacement of the lower segment of TS2 and TS4 did not increase sharply during loading. When the TS1 and TS3 were loaded to 11,000 kN, the loading was stopped due to the failure of the lower shaft segment, while the resistance of the upper shaft segment had not yet been fully mobilized. The same situation occurred when the TS2 and TS4 were loaded to 10,000 kN.
The tip sediment thicknesses of TS1 and TS3 were 42 mm and 53 mm, respectively, according to Table 2, while the tip sediment thicknesses of TS2 and TS4 were 29 mm and 25 mm, respectively. Before grouting, the difference in shaft tip sediment thickness was the main reason that the load–settlement curves of the lower segments of TS1 and TS3 were different from those of TS2 and TS4. Because of the thick and compressible sediment under the tips of TS1 and TS3, the soil strength beneath the tips of TS1 and TS3 was low, resulting in a sudden increase in the settlement of the lower segments of TS1 and TS3 under a certain level of load due to sediment compression.
Table 3 shows that under maximum load, the displacement of the lower segments of TS1 and TS3 before grouting was significant, and the rebound rates after unloading were only 13.88% and 11.32%, respectively, indicating that there was serious residual deformation at the shaft tip. However, the rebound rates of the lower segments of TS2 and TS4 were 22.12% and 23.64%, respectively, indicating that their residual deformation at the shaft tip was less. The shaft tip soil strength of TS1 and TS3 with thick sediment was lower, and the shaft tip settlement was caused primarily by sediment compression, and the sediment could not rebound after compression. Therefore, whether the shaft tip sediment was clean or not, it directly affected the settlement of large-diameter drilled shafts.
It can be seen from Figure 5 that the load-displacement curves of the upper and lower segments of the four test shafts all showed slowly-varying characteristics after grouting. When the TS1 and TS2 were loaded to 18,133 kN after grouting, the loading was stopped due to the failure of the upper shaft segment, while the resistance of the lower shaft segment had not yet been fully mobilized. The same situation occurred when the TS3 and TS4 were loaded to 17,000 kN. These results are in contrast to those before grouting.
This was because after the combined grouting, the shaft tip resistance improves significantly, allowing the lower segments to provide sufficient resistance as a reaction force to support the upper segments loading to failure. This could also explain why the displacement of the upper segments after grouting increased under maximum load, because only a large enough soil-shaft relative displacement could fully mobilize the side resistance of the upper segments and cause them to fail.
After grouting, each segment resistance of TS1 and TS2 increased by 64.84% on average compared with those before grouting, and each segment resistance of TS3 and TS4 increased by 70% on average compared with those before grouting. After grouting, the rebound rates of each segment of test shafts increased by an average of 91.74%. The combined grouting significantly improved the strength of the shaft tip and shaft side soils, as well as the elastic state of the soil.

4.2. Equivalent Q-s Curves of Test Shafts
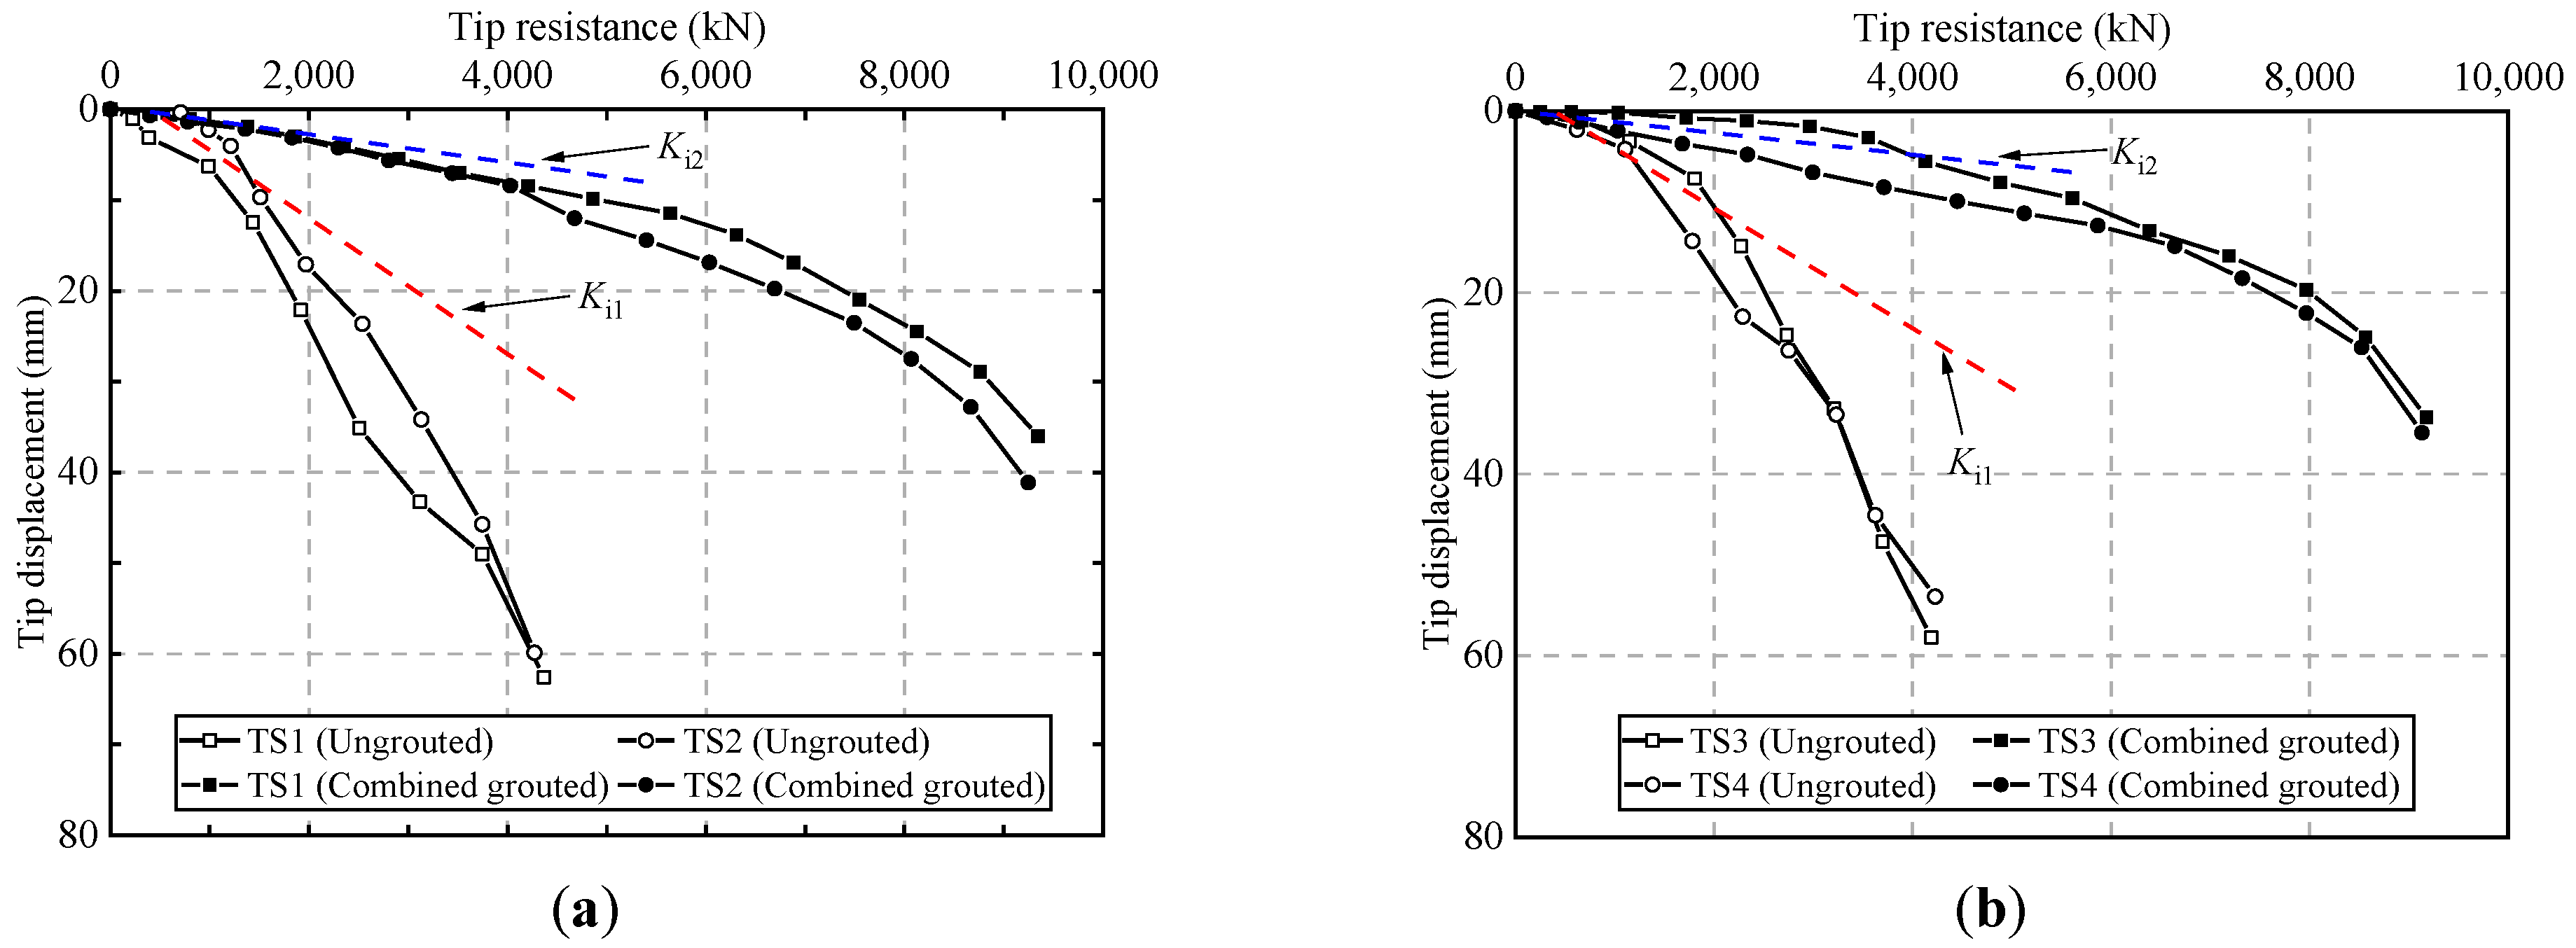
According to the Chinese standard [41], the load–settlement curves obtained by the bi-directional static test were converted to the equivalent Q-s curves of the conventional shaft head loading test, where the Q is the shaft head load and the s is the shaft head settlement. The Q-s curves of four test shafts are shown in Figure 6. In Figure 6a, the ultimate bearing capacity of TS1 and TS2 before grouting was 22,428 kN, and the corresponding shaft head settlement was 73.21 mm and 70.47 mm, respectively. After grouting, the ultimate bearing capacity of TS1 and TS2 increased to 38,561 kN, while shaft head settlement decreased to 54.73 mm and 59.85 mm, respectively. In Figure 6b, the ultimate bearing capacity of TS3 and TS4 before grouting was 20,196 kN, and the corresponding shaft head settlement was 67.15 mm and 62.66 mm, respectively. After grouting, the ultimate bearing capacity of TS3 and TS4 increased to 36,019 kN, while shaft head settlement decreased to 50.50 mm and 52.43 mm, respectively.
It was important to note that after grouting, the ultimate bearing capacity of each test shaft increased by 1.72–1.78 times, and the shaft head settlement under ultimate load decreased by 15.07–25.24%. The result was significant because it demonstrated that using combined grouting in construction could significantly improve the bearing capacity of drilled shafts without increasing drilled shaft sizing, economic costs, and carbon emissions. By using combined grouting, on the other hand, the designer could reduce the size and number of original drilled shafts while still achieving the design bearing capacity. This means that using combined grouting in drilled shaft construction can reduce the drilling machine operation time and the amount of concrete and steel used, so as to achieve the goal of sustainable development, such as environmental protection, reducing economic costs, and saving resources.
The effects of combined grouting on reinforcing drilled shaft bearing capacity and reducing drilled shaft settlement are obvious. The Q-s curve of each test shaft before combined grouting had an obvious inflection point, and the ‘penetration’ failure mode of each test shaft appears under a load of 36 MN. When approaching the ultimate load, the Q-s curves of each test shaft softened, and the settlement increased dramatically. In contrast, the Q-s curves of each test shaft after grouting exhibited more obvious linear elastic characteristics from beginning to end. Even after reaching the ultimate bearing capacity, the settlement had not increased significantly, and the test shaft had not reached the failure state. This might be because combined grouting could strengthen the shaft side resistance and the stiffness of the thick sediments at the shaft tip.

4.3. Tip Resistance

The bi-directional static test method was more accurate than the traditional static load test method in determining shaft tip resistance. The qw curves of TS1–TS4 before and after grouting are shown in Figure 7, where q is the shaft tip resistance and w is the shaft tip displacement. Before grouting, the qw curves of each test shaft showed a short linear elastic response at the initial stage of loading, with the inflection point appearing when the shaft head load was around 1500–1800 kN. In contrast, the qw curves after grouting appeared to have an inflection point around 7966–8125 kN, showing linear elastic behavior in most loading processes. This was because cement slurry could strengthen shaft tip sediment and soil, and high-pressure cement slurry could also compact shaft tip sediment and soil, increasing the stiffness of the qw curve response.
Before grouting, the ultimate tip resistance of TS1–TS4 was approximately 4188–4367 kN, and the corresponding tip displacement was approximately 53.5–62.6 mm (2.97D%–3.48D%); D is the diameter. After grouting, the ultimate tip resistance of TS1–TS4 was approximately 9130–9340 kN, representing a 116% increase; the corresponding tip displacement was approximately 33.8–41.1 mm (1.88D%–2.28D%), representing a 37% reduction. The average initial stiffness of the qw curves of, TS1–TS4 was about 266 kN mm−1 before grouting, while the average initial stiffness of the qw curves of, TS1–TS4 was 794 mm−1 after grouting, a 198% increase.

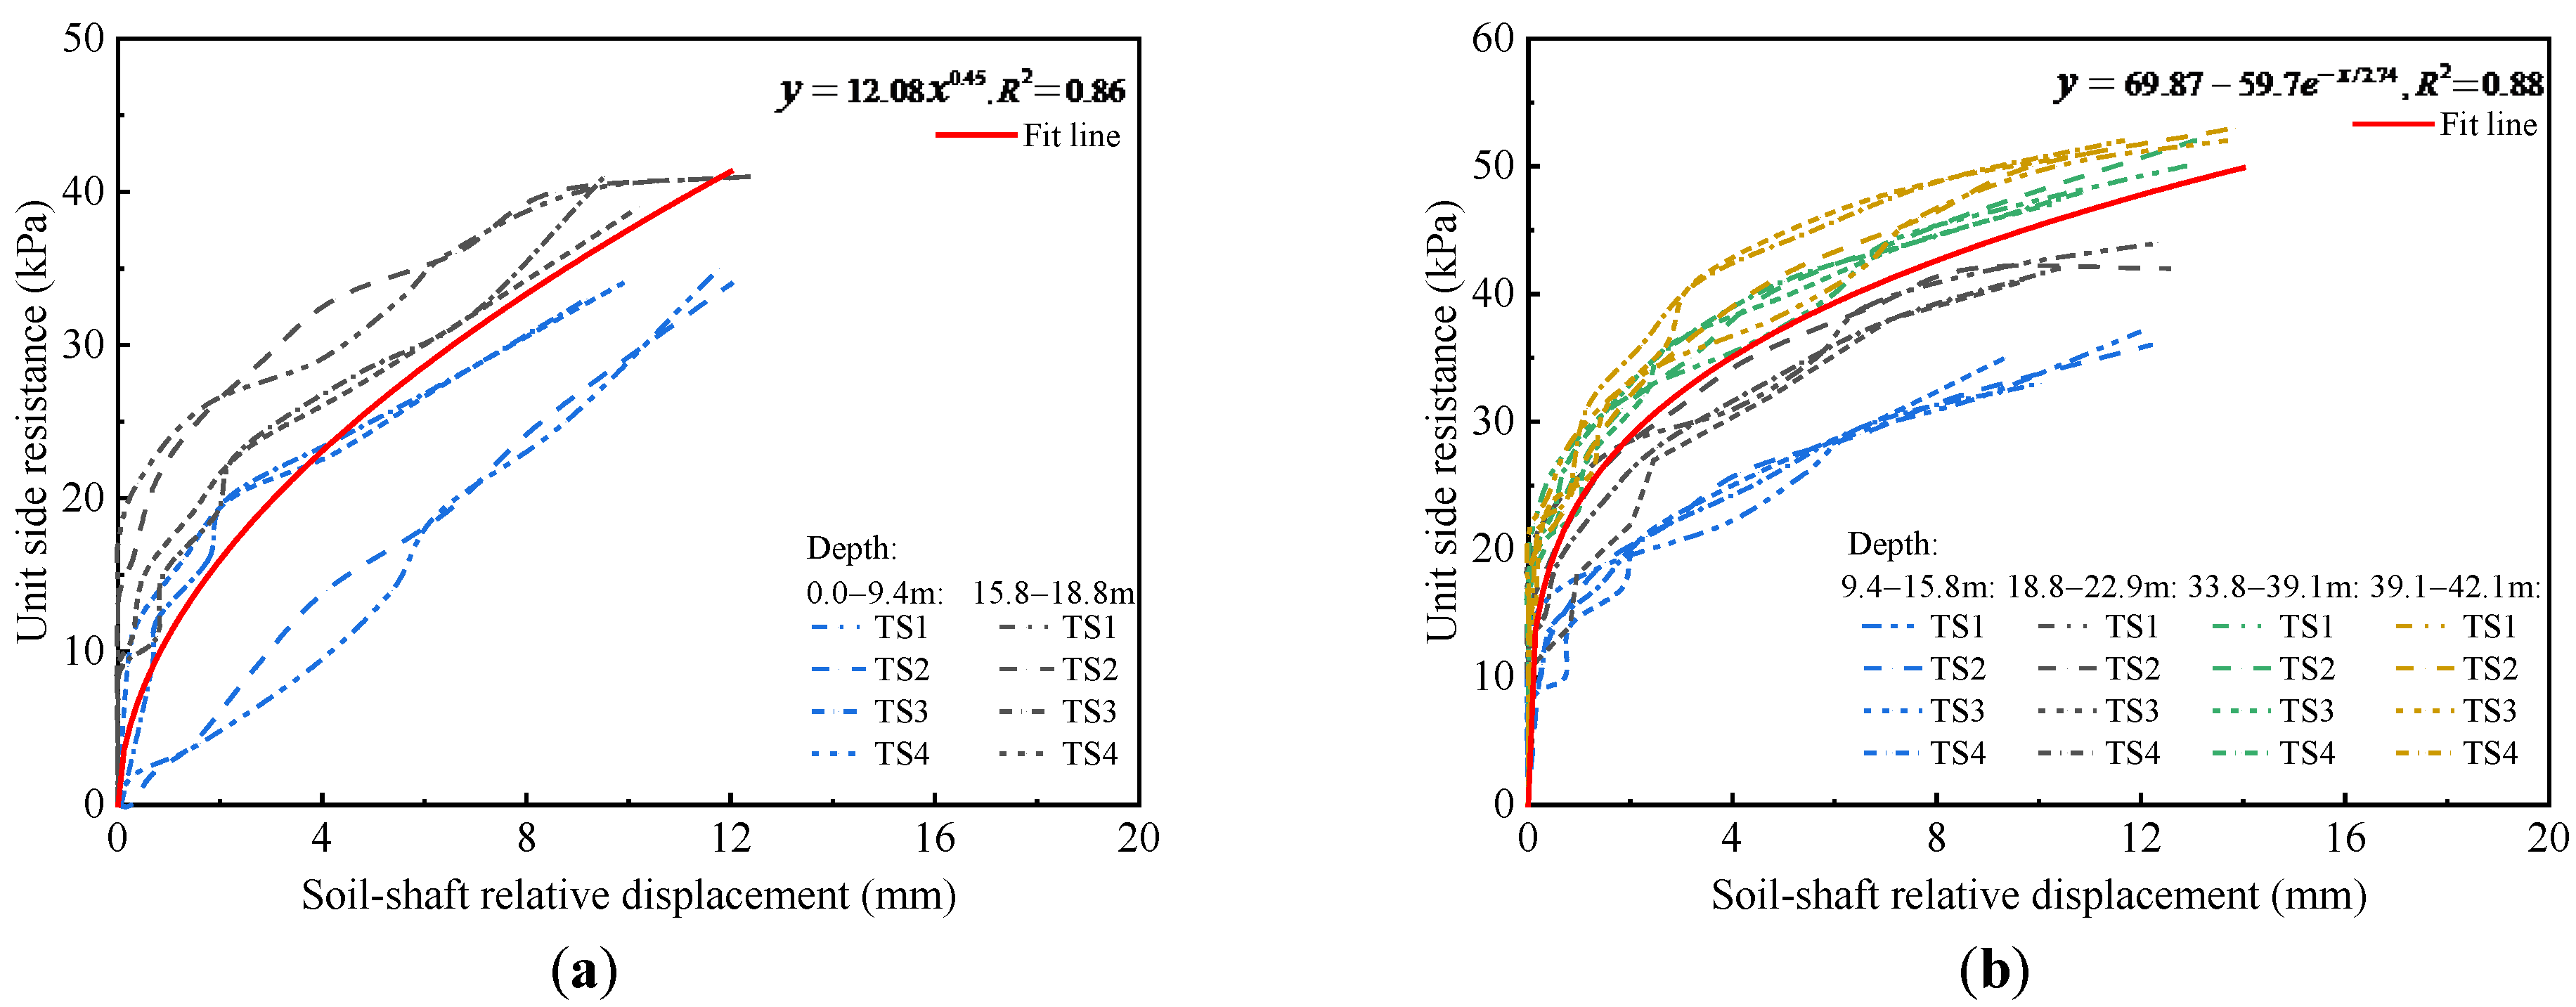
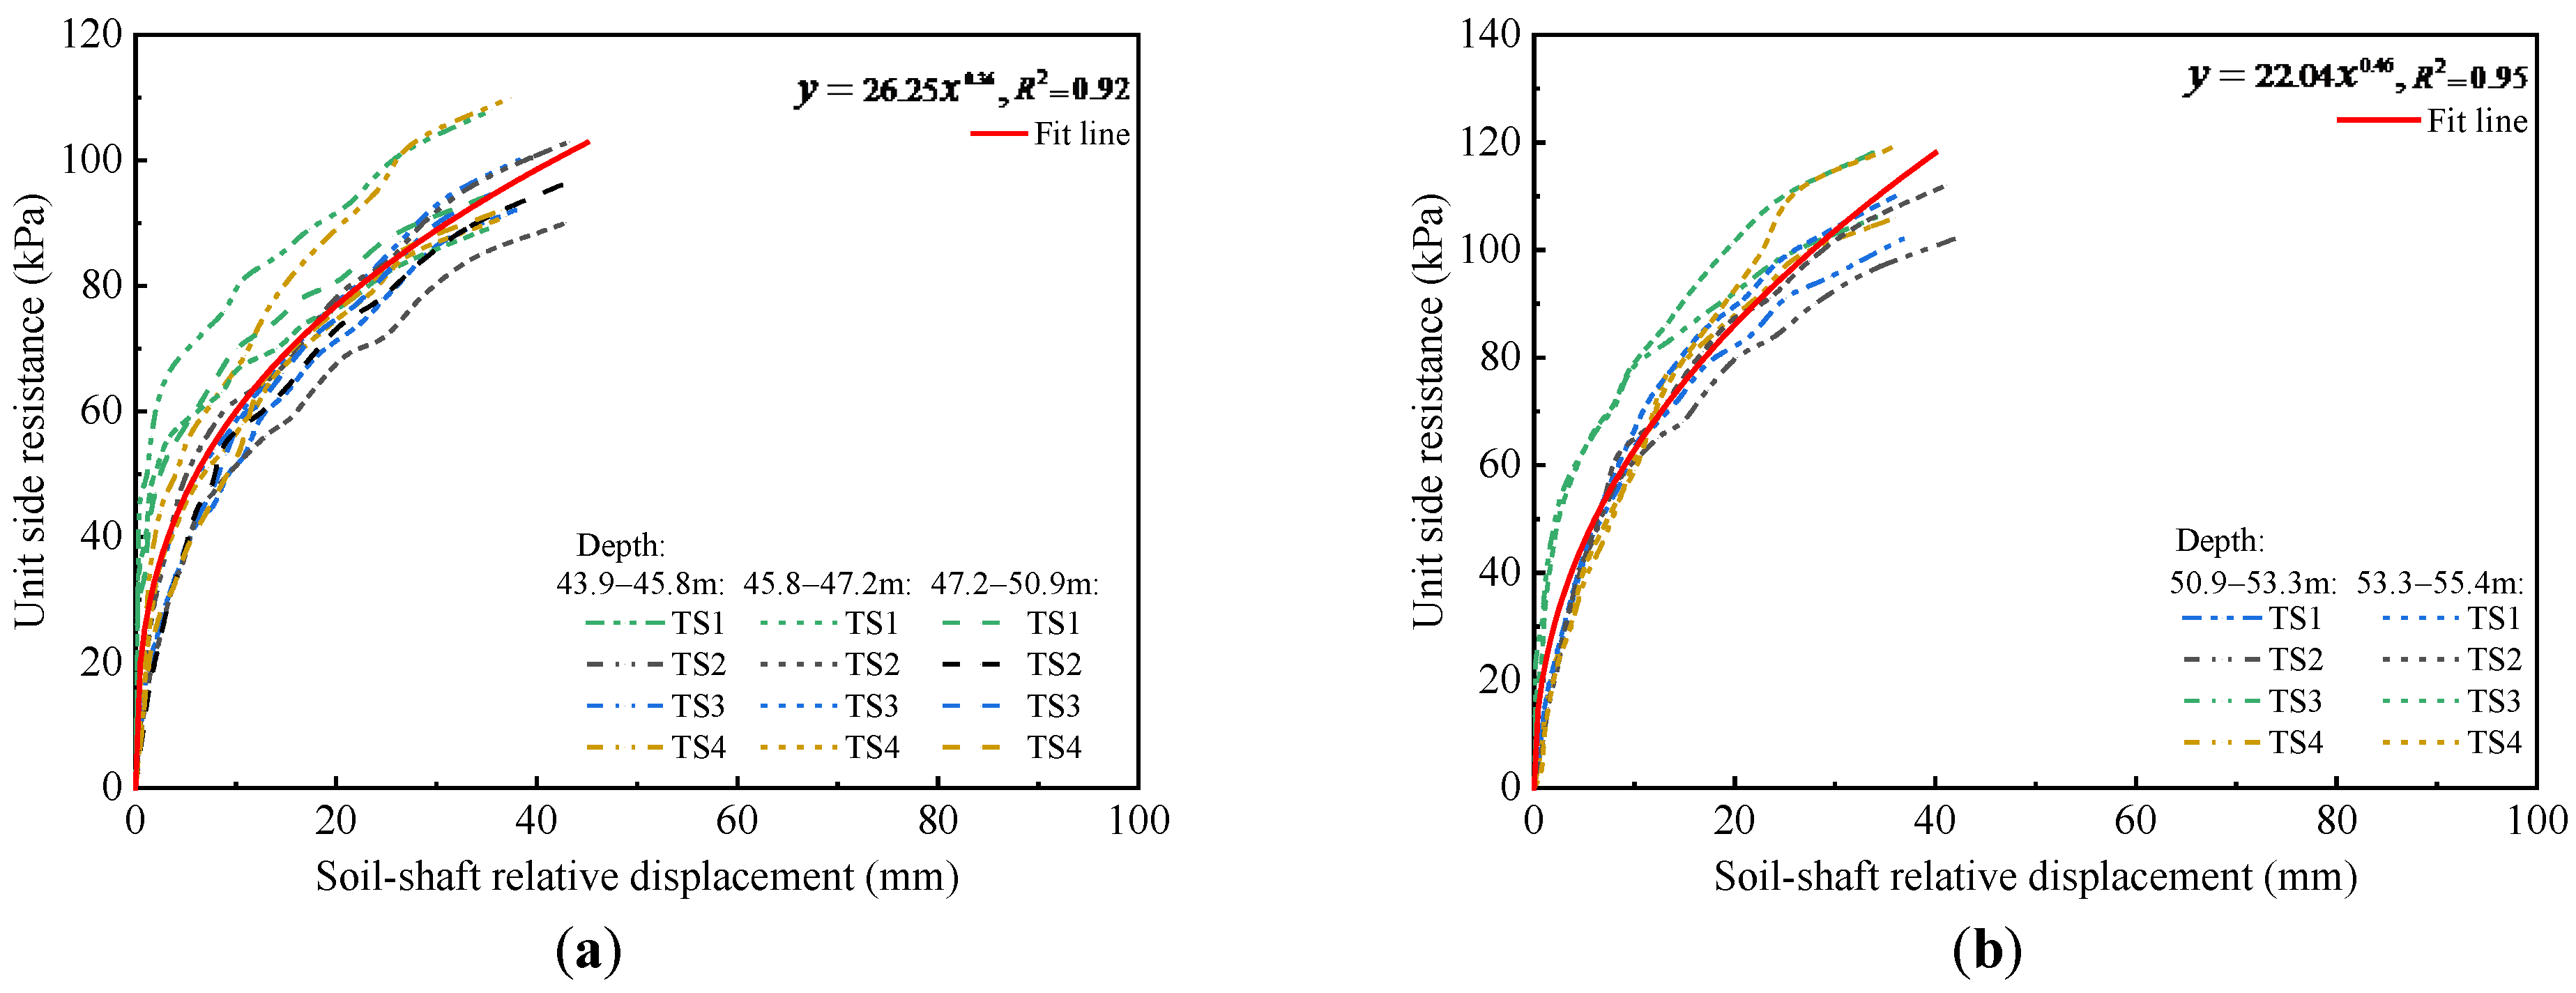
4.4. The τ-s Curves of the Side Resistance at Different Depths

The load transfer curves τ-s of the side resistance at different depths were obtained by the field test, where τ represents the unit side resistance, and s represents the relative soil-shaft displacement. Figure 8, Figure 9, Figure 10 and Figure 11 show τ-s curves of TS1–TS4 in each soil layer before and after grouting. In Figure 8, Figure 9, Figure 10 and Figure 11, the fitting lines of τ-sτ-s curves of each soil layer are used to analyze and intuitively reveal the change trend of τ-s curves. The τ-s curves of silty soil and silty sand in the upper segments of TS1–TS4 before grouting are shown in Figure 8a,b, respectively.
As shown in Figure 8a, the unit side resistance of silty soil gradually increases as the soil-shaft relative displacement increases. The τ-s curves exhibit linear elastic change at the beginning of loading followed by nonlinear elastic-plastic change. Note that the τ-s curves exhibit linear hardening behavior again at the later stage of loading, and no obvious softening failure occurs. This was similar to the static load test results of piles performed by Yu et al. [42] in the Taipei gravel layer. Because the construction-effect and shaft tip sediment softened the side resistance and tip resistance of the lower shaft segments, the bearing capacity of the lower segments is less than that of the upper segments. At the end of loading, the lower shaft segment that provides the loading reaction failed first, preventing the upper shaft segment from being loaded to failure further.
In Figure 8b, the τ-s curves of silty sand show a similar response to the τ-s curves of silty soil in Figure 8a. However, compared with silty soil, the τ-s curves of silty sand have higher stiffness at the initial stage of loading, and the unit side resistance of silty sand was higher under the same soil-shaft relative displacement.
The τ-s curves of silty soil and silty sand in the upper segments of TS1–TS4 after grouting are shown in Figure 9a,b, respectively. The τ-s curves in Figure 9a,b exhibit linear elastic change at the initial stage of loading. After reaching the peak unit side resistance, the τ-s curves clearly show a side resistance softening-effect as the soil-shaft relative displacement increases. This is significantly different from the τ-s curves response of the upper segments of TS1–TS4 before grouting.
This was because the side resistance and tip resistance of the lower segments were significantly strengthened after combined grouting, allowing the lower segments to provide sufficient bearing capacity as the loading reaction force to load the upper segments to failure. After combined grouting, the average ultimate side resistance of silty soil and silty sand was 56.6 kPa and 66.4 kPa, respectively, increasing by 52.0% and 57.2%. After combined grouting, the soil-shaft relative displacement was 10.7 mm, 0.59D% and 11.2 mm, 0.62D%, respectively, when the side resistance of silty soil and silty sand reached its peak value.
It was worth noting that the initial stiffness of the τ-s curves of silty soil and silty sand in the upper segments of TS1–TS4 were greatly improved after combined grouting. Compared with the ungrouted test shaft, the linear elastic stage of the τ-s curves after combined grouting was longer, and the peak side resistance of the τ-s curves was higher. This was different from the report proposed by Hsu [43] that the initial stiffness of the τ-s curves and the peak side resistance of the pile do not change after grouting. This could be because Hsu adopted tip grouting, whereas this research adopted combined side and tip grouting. This comparison demonstrates that, when compared to traditional tip grouting, combined grouting could better reinforce shaft side resistance.
The τ-s curves of silty soil and silty sand in the lower segments of TS1–TS4 before grouting are shown in Figure 10a,b, respectively. To intuitively show the change trend of the τ-s curves, the fitting line of τ-s curves in Figure 10a,b is represented by a piecewise function composed of a linear segment and a nonlinear segment. As shown in the fitting lines in Figure 10a,b, the τ-s curves of TS1–TS4 show a linear-nonlinear-softening trend.
Specifically, the τ-s curves show linear elastic change in the initial stage of loading. When the soil-shaft relative displacement reached about 4 mm (0.22D%), the τ-s curves enter a nonlinear change. When the soil-shaft relative displacement was around 60 mm (3.33D%), the τ-s curves reached the peak side resistance, and the softening effect appeared. Before grouting, the average ultimate side resistance of silty soil and silty sand in the lower segments of TS1–TS4 was 61.0 kPa and 68.7 kPa, respectively; and the corresponding average soil-shaft relative displacement was 59.3 mm (3.29D%) and 58.1 mm (3.23D%), respectively.
It was worth noting that the τ-s curves of the lower segment of TS3 were significantly different from those of other test shafts, with a more serious and obvious side resistance softening-effect after the end of its linear elastic stage (red circles in Figure 10a,b). This was due to a thick layer of sediment beneath the tip of TS3. As the load increased, the sediment beneath the tip begins to bear the load, but its stiffness was very low. Therefore, the τ-s curves of the lower segment of TS3 appeared to have an obvious side resistance softening-effect at the early stage of loading. When the soil-shaft relative displacement reached about 23 mm (1.27D%), the τ-s curves of the lower segment of TS3 reverted to an obvious side resistance reinforcing-effect, though the period of this resistance reinforcing stage was brief. This was because after the shaft tip sediment was completely compressed, the shaft tip resistance effectively improved, helping the shaft side resistance to be mobilized again. When the soil-shaft relative displacement reached about 26 mm (1.44D%), the τ-s curves of TS3 exhibited similar behavior to other test shafts again.
The τ-s curves of silty soil and silty sand in the lower segments of TS1–TS4 after grouting are shown in Figure 11a,b, respectively. The τ-s curves exhibit linear elastic change at the beginning of loading, followed by nonlinear elastic-plastic change. It is worth noting that τ-s curves of the lower segments of TS1–TS4 after grouting did not fail under ultimate load. Under ultimate load, the τ-s curves exhibit an obvious side resistance reinforcing-effect while maintaining high stiffness. This was obviously different from the side resistance softening-effect of the τ-s curves in the lower segments of TS1–TS4 before grouting. This was because combined grouting stiffened the shaft tip sediment and increases shaft side resistance.
The initial stiffness of the τ-s curves was improved after grouting, as shown in Figure 11a,b. After grouting, the average ultimate side resistance of silty soil and silty sand was 96.8 kPa and 109.4 kPa, respectively, which increased by 58.6% and 59.2%. After grouting, when the side resistance of silty soil and silty sand reached its peak, the corresponding soil-shaft relative displacement was 38.1 mm (2.1D%) and 36.9 mm (2.05D%), respectively, which decreased by 35.6% and 33.03%, respectively. This result proved that combined grouting could not only reinforce side resistance but also significantly reduced the shaft-soil relative displacement needed to mobilize side resistance.

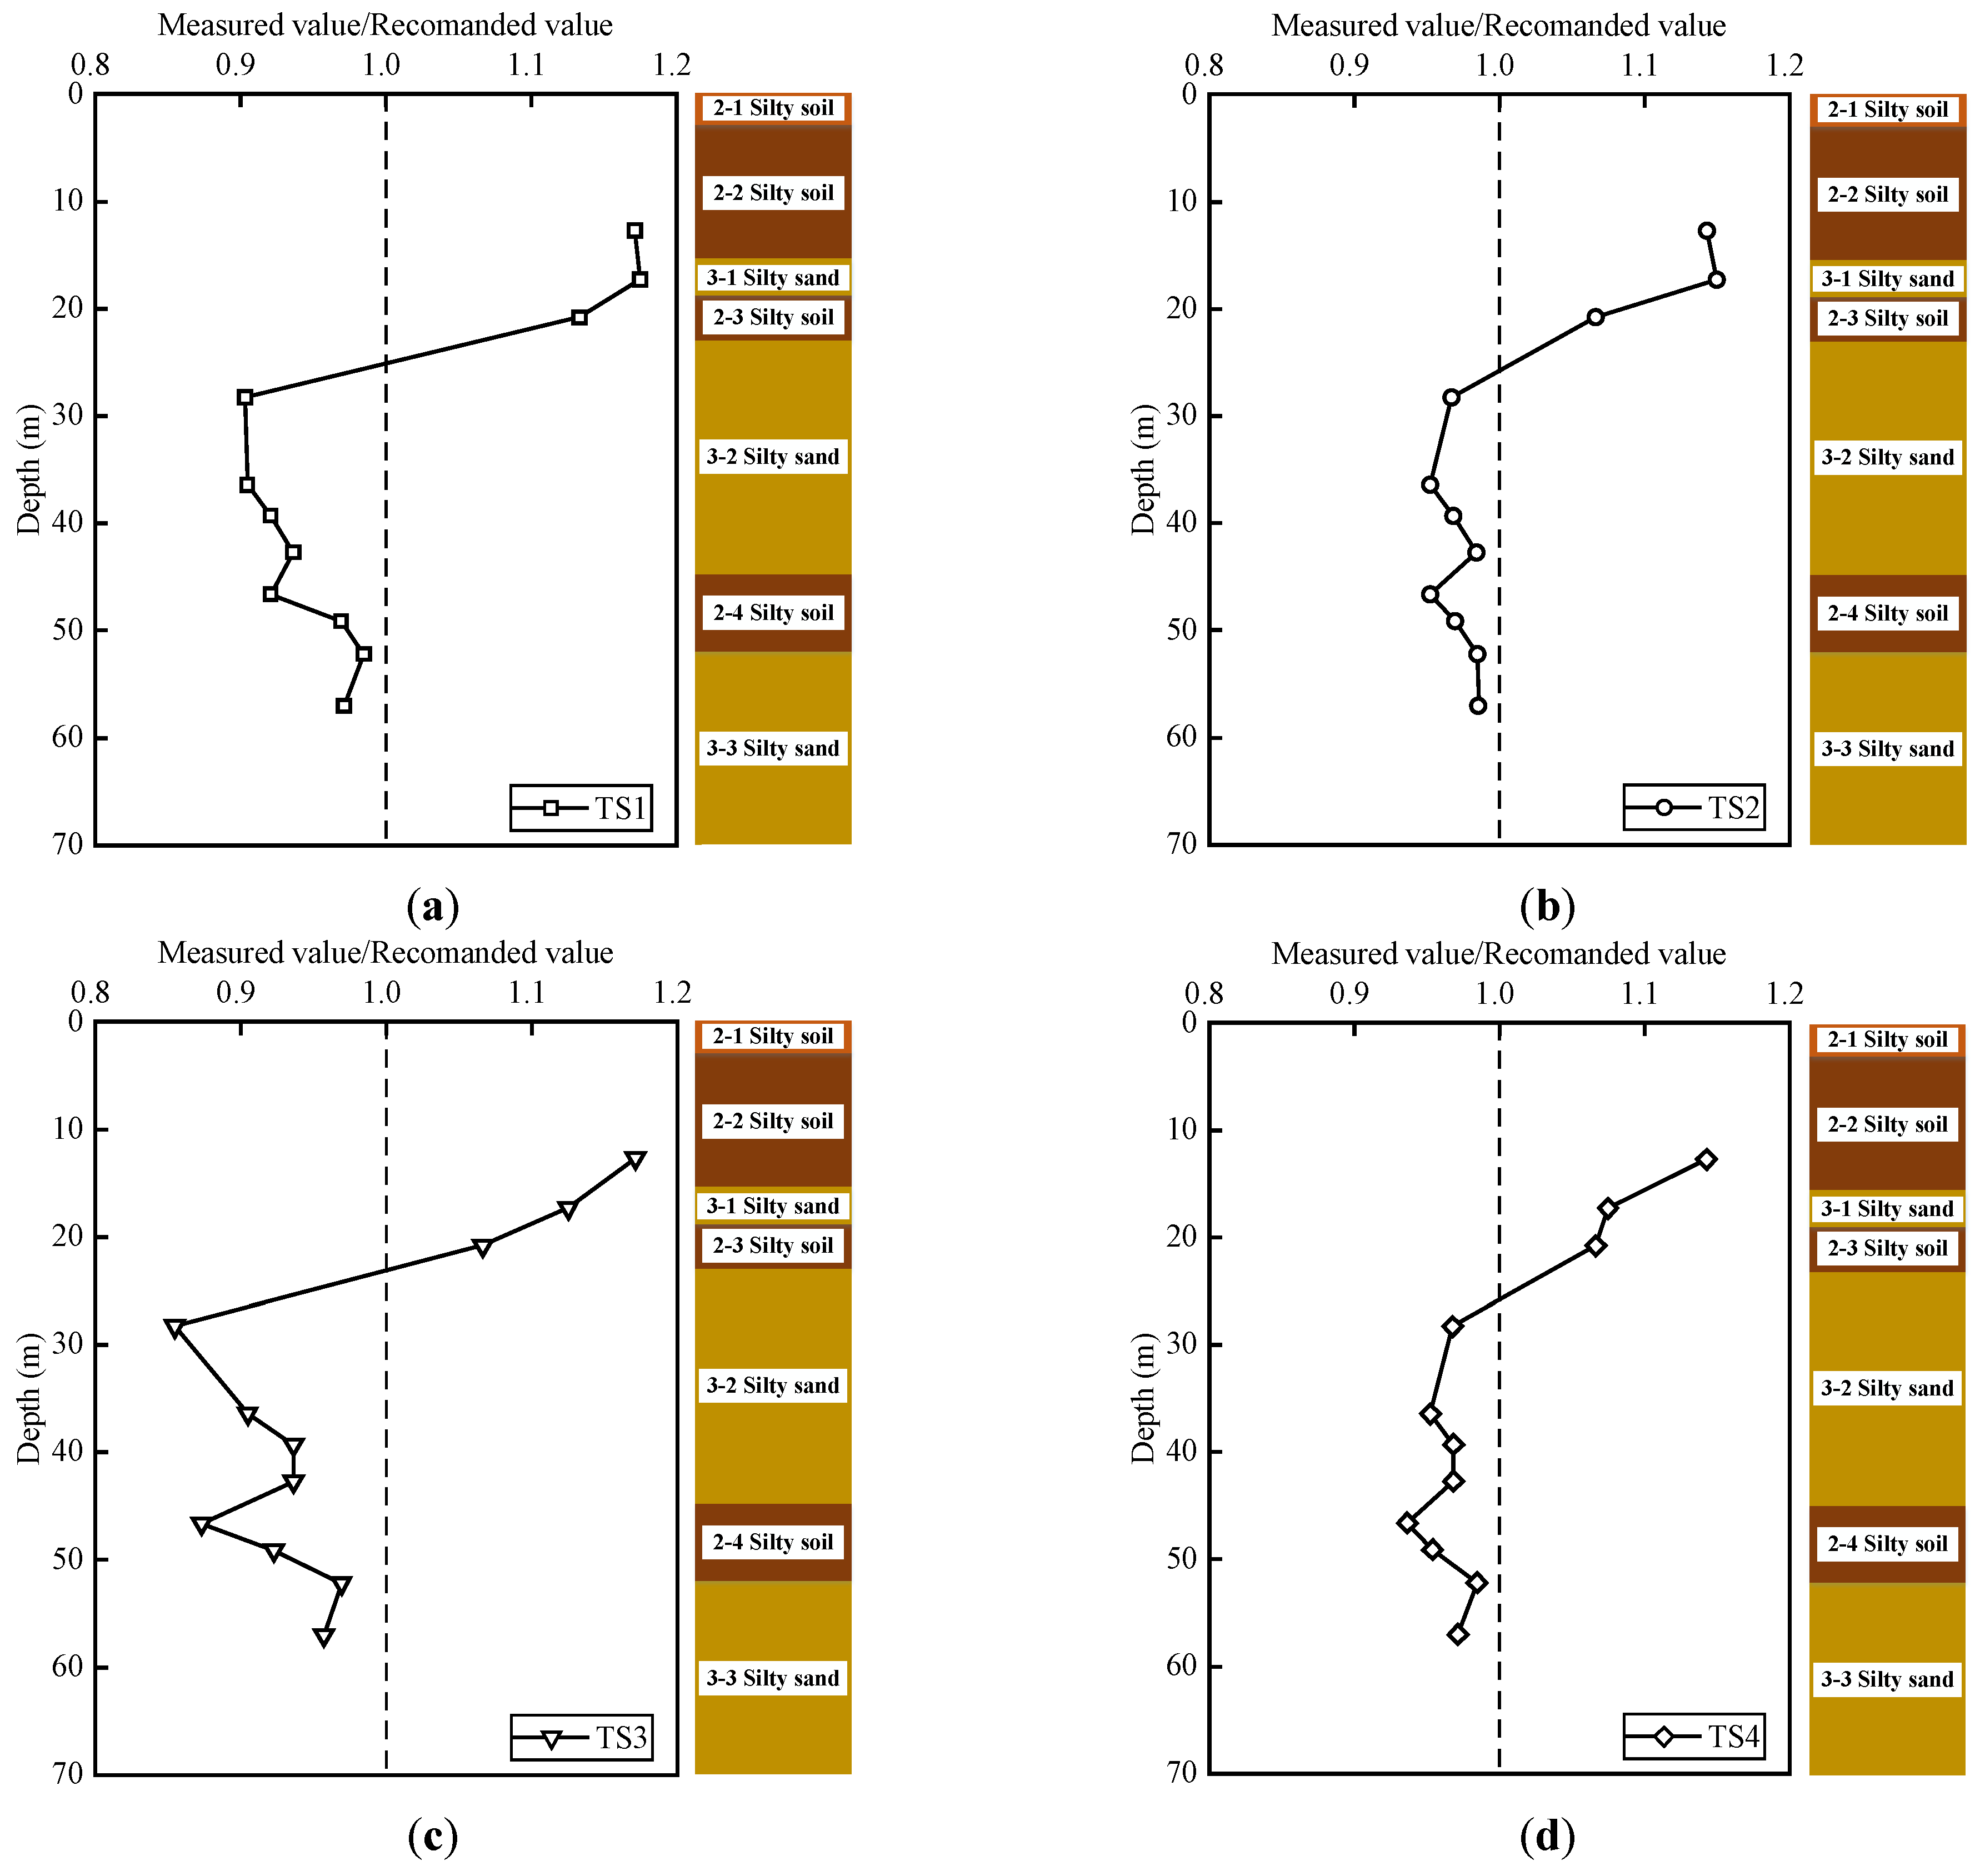
4.5. Comparison between Measured and Predicted Values of Shaft Side Resistance

The softening-effect of side resistance meant that the measured side resistance was less than the recommended side resistance predicted by the geological survey report. Affected by construction effects and shaft tip sediment, the mobilized shaft side resistance might be lower than predicted. Figure 12 shows the ratio of measured value/recommended value of ultimate side resistance distributed with depth before grouting. It can be seen from Figure 12 that the side resistance softening-effect mainly occurs in the soil layer with an embedded depth greater than 20 m. The most obvious side resistance softening-effect was in the soil layer with an embedded depth of about 20–45 m, and the side resistance softening-effect was weakened in the soil layer near the shaft tip with an embedded depth of 45–60 m. On the one hand, due to the influence of drilling disturbance and drilling slurry, the side resistance softening-effect of large-diameter drilled shafts appear. On the other hand, when the deeper the soil layer was embedded, the greater the radial effective stress release caused by drilling disturbance, the greater the side resistance softening-effect.
Figure 12a,b shows that under the premise of the same shaft design, site conditions, and construction method, the side resistance softening-effect of TS1 and TS3 with thicker sediment was more serious. This shows that the side resistance softening-effect was also related to the shaft tip bearing capacity, and poor shaft tip bearing capacity would weaken the mobilization of side resistance. It is worth noting that the side resistance softening-effect was weakened in the soil layer with an embedded depth of 45–60 m (near the shaft tip). This is because, under load, the performance of the shaft tip sediment was improved after compression, which reduced the side resistance softening-effect of the soil layer near the shaft tip to a certain extent; a detailed explanation will be provided in a subsequent analysis. Therefore, the thickness and performance of tip sediment directly affected the tip resistance, thus indirectly affecting the mobilization of side resistance. The low resistance of the shaft tip caused different degrees of softening of the shaft side resistance.
Figure 13 shows the distribution of the ratio of the measured value/recommended value for ultimate side resistance with depth after grouting. As shown in Figure 13, combined grouting reinforced the side resistance within the whole pile length range. After combined grouting, the side resistance reinforcing-effect of soil layer, with an approximately embedded depth of 40–60 m (near the shaft tip), was generally improved with the increase in depth.

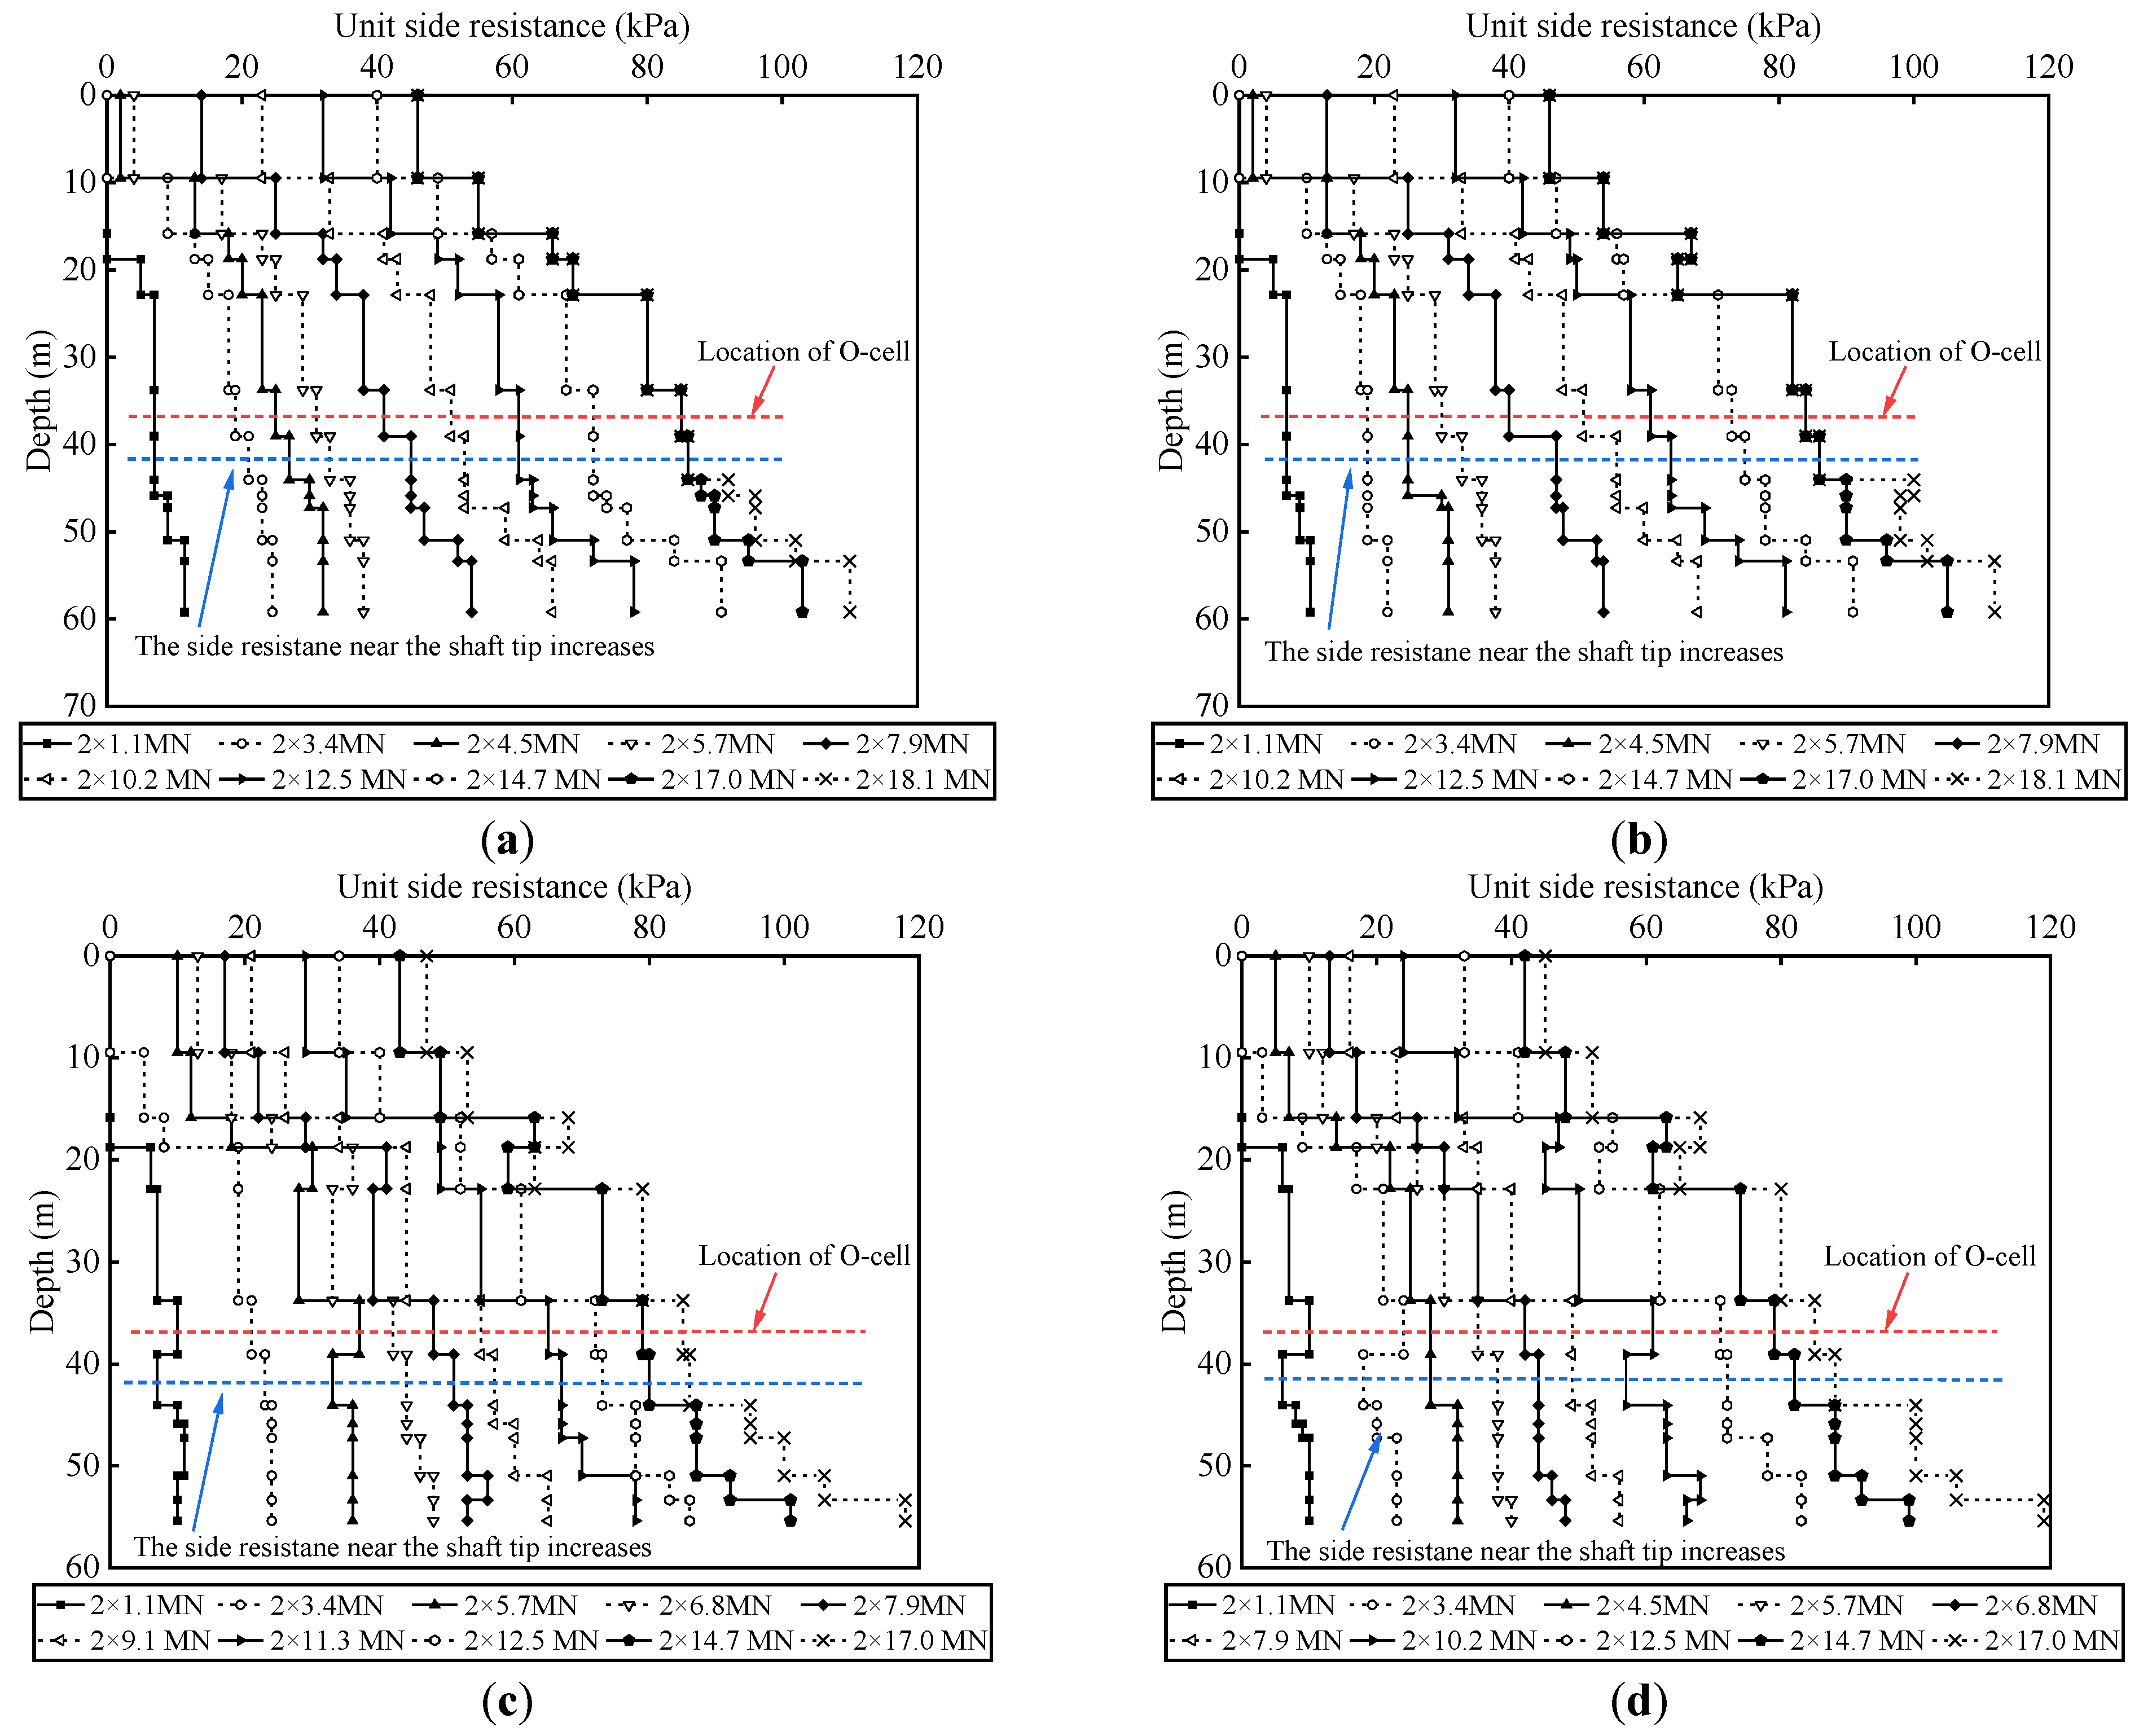
4.6. Distribution of Side Resistance Versus Depth

Figure 14 depicts the distribution of side resistance versus depth of TS1–TS4 under various loads before grouting. Under low load, the side resistance of the soil layer with an embedded depth of 45–61 m decreased with depth, which was most noticeable in the TS2 and TS3. This phenomenon, however, changed as the load increased. When the load reached a certain level, the side resistance of the soil layer with an embedded depth of 45–61 m (near the shaft tip) changed to increase with depth. This side resistance reinforcing-effect was more noticeable under high-level load.
As previously stated, as the load increased, the soil and sediment beneath the shaft tip were compressed, which improved the resistance and stiffness of the shaft tip soil. The increase in tip resistance had a reinforcing-effect on the side resistance, and this side resistance reinforcing-effect was most concentrated near the shaft tip. It was noted that the reinforcing-effect here meant that the side resistance near the shaft tip was relatively reinforced when compared to the side resistance of other shaft segments. Affected by the construction-effect, the measured ultimate side resistance of TS1–TS4 before grouting was still lower than the recommended value.
Figure 15 depicts the distribution of side resistance versus depth of TS1–TS4 under various loads after grouting. The shaft side near the shaft tip of TS1–TS4 after grouting also showed an obvious resistance reinforcing-effect, as shown in Figure 15a,b. After grouting, the range of soil layers with the side resistance reinforcing-effect increased. Taking TS1 and TS2 after grouting as examples, the range of soil with the side resistance reinforcing effect increased by 46% from an embedded depth of 48–61 m to 42–61 m. In addition, the side resistance reinforcing-effect of the soil layer near the shaft tip was stronger after grouting. Taking TS3 and TS4 after grouting as examples, the maximum increase of the average ultimate side resistance of the soil layer near the shaft tip was 71.0%. This was because combined grouting improved the strength of the sediment and soil at the shaft tip. Compared with tip grouting, combined grouting can expand the range of side resistance reinforcing-effect to the whole shaft.

4.7. Mechanism of the Softening-Effect and Reinforcing-Effect on Side Resistance

The results and analysis described in the previous sections indicate that the strength of the shaft tip bearing layer impacted the response and failure mode of large-diameter drilled shafts significantly. More importantly, the mobilization of shaft side resistance was affected by the strength of the shaft tip soil. When the strength of the bearing layer was poor, or there was a certain thickness of sediment, the shaft tip experienced pierced failure and the side resistance softening-effect appeared. When the strength of the bearing layer was strong, such as after combined grouting or sediment compression, the side resistance reinforcing-effect emerged.
The TS3 and TS4 of the same size were compared and analyzed to better explain the mechanism of the side resistance softening-effect and reinforcing-effect. Figure 16a depicts the q-w curves of TS3 and TS4 when the shaft tip loading range was 0–4000 kN. When compared with TS4, we found that the tip resistance of TS3 was first softened and then reinforced during loading. TS3 had thick sediment under the shaft tip, while TS4 did not.
Points A–C on the q-w curve of TS3 in Figure 16a represent resistance softening, resistance reinforcing, and resistance normalization again, respectively. Figure 16a is summarized as Figure 16b. The whole process diagram of the load–settlement curve is depicted in Figure 16b. The curve in Figure 16b is divided into three parts: OA, AB, and BC. Figure 17 illustrates the soil movement and stress element status in shaft side soil at various loading stages. In Figure 17, the shear stresses τr transfer from the drilled shaft when the drilled shaft under axial load. Randolph and Wroth [1] showed that the shear stresses τr in the soil around the drilled shaft may be written:
τ r = τ 0 ln r m r , r 0 r r m τ r = 0 , r 0 r m
where τ0 is the shear stress at the drilled shaft side, r0 is the radius of the drilled shaft and rm is the limiting radius of influence of the drilled shaft. This method for calculating shear stress τr is detailed in the literature [1]. Figure 17a–c corresponds to the OA, AB, and BC curves in Figure 16b to clearly analyze and explain the process of side resistance softening-effect and the reinforcing-effect.
Figure 17a shows that the influence of the tip bearing layer strength on the side resistance was not yet apparent when the tip resistance was not mobilized, and the side resistance was about to enter the nonlinear stage. The radial effective stress σh of the shaft side soil near the shaft tip remained unchanged. The shaft tip resistance was gradually mobilized as the load increases, and the effect of shaft tip resistance on shaft side resistance appeared.
In Figure 17b, when the shaft tip sediment existed or the strength of the shaft tip soil was low, the sediment with low stiffness was compressed with increasing load, and the shaft tip experienced large penetration deformation, resulting in the movement of the shaft side soil to the shaft tip. The constraint between upper and lower soil layers was reduced as a result of soil movement in the same direction, resulting in a reduction of radial effective stress to σh − Δh. Furthermore, due to the rapid increase in shaft tip displacement in a short period of time, the excess pore water pressure would rise while the radial effective stress σh would fall. According to Mohr-Coulomb theory, the decrease in radial effective stress σh resulted in the decrease in resistance between the shaft and the soil [7].
As shown in Figure 17c, after the shaft tip sediment was completely compressed, the shaft tip resistance began to be mobilized. The soil layer below the shaft tip level was compressed in a specific range, and the soil layer below the shaft tip level moved upward. The stress arching phenomenon occurred in the soil near the shaft tip [44,45,46], where the arching zone and the compaction zone appeared, and the radial effective stress increased to σh + Δh. The compaction and reinforcing effect were gradually increased from top to bottom. The radial effective stress σh + Δh increased the most near the shaft tip, and the side resistance reinforcing-effect was most visible.
Figure 17d represents the mechanism of side resistance reinforcing-effect after combined grouting. Based on the previously mentioned side resistance reinforcing mechanism, the high-pressure cement slurry injected by combined grouting further compressed the soil around the shaft and expanded the arching and compaction areas. Cement slurry also strengthened the sediment and soil at the shaft tip, forming a cement expansion head at the shaft tip. Furthermore, by injecting cement slurry along the shaft body, the combined grouting filled the gap between the shaft and the soil. The high-pressure cement slurry injected at the shaft side compacted the soil around the shaft, increasing the radial effective stress in the soil around the shaft to σh + Δh + Δug. Under the combined action of these factors, the combined grouting greatly enhanced the side resistance reinforcing-effect.

5. Conclusions

In this paper, through the field test of large-diameter drilled shafts, the influence of shaft tip resistance and construction-effect on shaft side resistance before and after combined grouting was studied, the reinforcing effect of combined grouting on bearing capacity was confirmed, and the potential of applying combined grouting to realize sustainable development, the economy, and environmental protection was introduced. According to the test results, the fundamental mechanism of the softening-effect and reinforcing-effect of shaft side resistance before and after combined grouting was analyzed. The following conclusions are made:
1.
Due to the influence of construction-effect and shaft tip sediment, the side resistance of large-diameter drilled shafts without grouting softened at the initial loading stage, and the measured ultimate side resistance, were lower than predicted values. The lower the strength of shaft tip soil, the more serious the side resistance softening-effect e. The mobilization of side resistance was affected by the strength of shaft tip soil.
2.
The shaft tip sediment caused by the construction-effect softened the tip resistance of large-diameter drilled shafts. However, after combined grouting or sediment compression, shaft tip resistance was reinforced.
3.
The increase in shaft tip resistance had a reinforcing-effect on shaft side resistance, which mainly occurred near the shaft tip. However, this side resistance reinforcing-effect near the shaft tip could only reduce, and not completely eliminate the negative impact of construction-effect. Combined grouting could further improve this side resistance reinforcing effect and expand the range of soil layers with this reinforcing-effect by 46%, completely eliminating the negative impact of the construction-effect.
4.
Compared with traditional shaft tip grouting, the reinforcing effect of combined grouting on the side resistance of large-diameter drilled shafts was remarkable, and the mobilization speed of side resistance was improved. Combined grouting could also improve the tip resistance and bearing capacity of large-diameter drilled shafts. After combined grouting, the average increase of side resistance was 67.42%, the average tip resistance increased by 116%, and the bearing capacity increased by 74.64%.
5.
Combined grouting improved the bearing capacity of drilled shafts without increasing drilled shaft sizing, economic costs, and carbon emission. By using combined grouting, the designer could reduce the size and number of original drilled shafts while still achieving the design bearing capacity. Large-diameter combined grouting drilled shafts had great advantages in terms of reducing economic costs, environmental protection, and sustainable development.
6.
The change of radial effective stress in soil was the fundamental reason influencing the side resistance softening-effect and reinforcing-effect. When the soil strength under the shaft tip was low, the shaft tip experienced pierced failure, which reduced radial effective stress and side resistance. When the soil strength under the shaft tip was high, an arching phenomenon appeared in the soil layer near the shaft, which increased radial effective stress and side resistance. Combined grouting extended the arching zone and increased the radial effective stress, thus reinforcing the side resistance.

Author Contributions

Data curation, W.G.; Funding acquisition, Z.W.; Writing—original draft, T.H.; Writing—review & editing, G.D. All authors have read and agreed to the published version of the manuscript.

Funding

This research was funded by National Natural Science Foundation of China grant number [52008100; 51878160; 52078128] and Natural Science Foundation of Jiangsu Province grant number [BK20200400].

Institutional Review Board Statement

Not applicable.

Informed Consent Statement

Not applicable.

Data Availability Statement

Not applicable.

Acknowledgments

The authors would like to express appreciation to the editors and reviewers for their valuable comments and suggestions.

Conflicts of Interest

The authors declare no conflict of interest. The funders had no role in the design of the study; in the collection, analyses, or interpretation of data; in the writing of the manuscript, or in the decision to publish the results.

References

  1. Zhang, Z.T.; Gong, W.M.; Dai, G.L.; Cao, X.L.; Zhu, Y.; Huang, H. Field Tests on Bearing Characteristics of Large-Diameter Combined Tip-and-Side Post Grouted Drilled Shafts. Appl. Sci. 2021, 11, 11883. [Google Scholar] [CrossRef]
  2. Randolph, M.F. Design methods for pile groups and piled rafts. In Proceedings of the 13th International Conference on Soil Mechanics and Foundation Engineering, New Delhi, India, 5 January 1994; pp. 61–82. [Google Scholar]
  3. Żarkiewicz, K. Laboratory Research of Toe Resistance Based on Static Pile Load Tests in Different Schemes. Civ. Environ. Eng. Rep. 2018, 28, 172–181. [Google Scholar] [CrossRef] [Green Version]
  4. Tejchman, A.; Gwizdala, K. Analysis of Safety Factors of Bearing Capacity for Large Diameter Piles. In Proceedings of the European Conference on Soil Mechanics and Foundation Engineering, Brighton, UK, 1979; pp. 293–296. Available online: https://link.springer.com/article/10.1007/BF02094048 (accessed on 4 May 2022).
  5. Meyerhof, G.G. Scale effect of ultimate pile capacity. J. Geotech. Eng-ASCE 1983, 109, 797–806. [Google Scholar] [CrossRef]
  6. Borghi, X.; White, D.J.; Bolton, M.D.; Springman, S. Empirical pile design based on cone penetrometer data: An explanation for reduction of unit base resistance between CPTs and piles. In Proceedings of the 5th International Conference on Deep Foundation Practice, Singapore, 4–6 April 2001; pp. 125–132. [Google Scholar]
  7. Zhang, Q.Q.; Zhang, Z.M.; Li, S.C. Investigation into Skin Friction of Bored Pile Including Influence of Soil Strength at Pile Base. Mar. Geores. Geotechnol. 2013, 31, 1–16. [Google Scholar] [CrossRef]
  8. Broere, W.; Vantol, A.F. Modelling the Bearing Capacity of Displacement Piles in Sand. In Proceedings of the Institution of Civil Engineers: Geotechnical Engineering, London, UK, 2006; pp. 195–206. Available online: https://doi.org/10.1680/geng.2006.159.3.195 (accessed on 4 May 2022).
  9. Shin, J.K.C.; Omer, J.R.; Delpak, R.; Robinson, R.B.; Jones, C.D. Full-scale pile tests in sand and development of a computer program for predicting load capacity. Can. J. Civ. Eng. 2007, 34, 1222–1236. [Google Scholar]
  10. Lee, J.; Paik, K.; Kim, D.; Hwang, S. Estimation of axial load capacity for bored tapered piles using CPT results in sand. J. Geotech. Geoenviron. Eng. 2009, 135, 1285–1294. [Google Scholar] [CrossRef]
  11. Flynn, K.N.; McCabe, B.A. Shaft resistance of driven cast-in-situ piles in sand. Can. Geotech. J. 2016, 53, 49–59. [Google Scholar] [CrossRef] [Green Version]
  12. Heerema, J.P. Predicting pile driveability: Heather as an illustration of the ‘‘friction fatigue’’ theory. Ground. Eng. 1980, 13, 13–37. [Google Scholar]
  13. Kraft, L.M.; Focht, J.A.; Amerasinghe, S.F. Friction capacity of piles driven into clay. J. Geotech. Eng. Div. 1981, 107, 1521–1541. [Google Scholar] [CrossRef]
  14. Randolph, M.F. Design considerations for offshore piles. In Proceedings of the Conference on Geotechnical Practice in Offshore Engineering, Austin, TX, USA, 27–29 April 1983; pp. 422–439. [Google Scholar]
  15. Moayedi, H.; Nazir, R.; Mosallanezhad, M. Determination of Reliable Stress and Strain Distributions Along Bored Piles. Soil Mech. Found. Eng. 2015, 51, 285–291. [Google Scholar] [CrossRef]
  16. Lehane, B.; Jardine, R.; Bond, A.J.; Frank, R. Mechanisms of shaft friction in sand from instrumented pile tests. J. Geotech. Eng. 1993, 119, 19–35. [Google Scholar] [CrossRef]
  17. Hanna, T.H.; Tan, R.H.S. The behavior of long piles under compressive loads in sand. Can. Geotech. J. 1973, 10, 311–340. [Google Scholar] [CrossRef]
  18. Vesic, A.S. Tests on instrumented piles, ogeechee river site. J. Soil Mech. Found Div. 1970, 96, 561–584. [Google Scholar] [CrossRef]
  19. Duan, N.; Cheng, Y.P.; Lu, M.F.; Wang, Z.K. DEM investigation of sand response during displacement pile installation. Ocean Eng. 2021, 230, 109040. [Google Scholar] [CrossRef]
  20. Wan, Z.H.; Liu, H.; Feng, Z.; Dai, G.L. Axial Bearing Mechanism of Post-Grouted Piles in Calcareous Sand. Appl. Sci. 2022, 12, 2731. [Google Scholar] [CrossRef]
  21. Wan, Z.H.; Dai, G.L.; Gong, W.M. Field and theoretical analysis of response of axially loaded grouted drilled shafts in extra-thick fine sand. Can. Geotech. J. 2020, 57, 391–407. [Google Scholar] [CrossRef]
  22. Thiyyakkandi, S.; McVay, M.; Bloomquist, D.; Lai, P. Measured and predicted response of a new jetted and grouted precast pile with membranes in cohesionless soils. J. Geotech. Geoenviron. Eng. 2013, 139, 1334–1345. [Google Scholar] [CrossRef]
  23. Stocker, M.F. Influence of post-grouting on the load-bearing capacity of bored piles. In Proceedings of the 8th European Conference on Soil Mechanics and Foundation Engineering, Helsinki, Finland, 23–26 May 1983; pp. 167–170. [Google Scholar]
  24. Sliwinski, Z.J.; Fleming, W.G.K. The integrity and performance of bored piles. In Piling and Ground Treatment; Thomas Telford Publishing: London, UK, 1984; pp. 211–223. [Google Scholar]
  25. Majano, R.E.; O’Neill, M.W.; Hassan, K.M. Perimeter load transfer in model drilled shafts formed under slurry. J. Geotech. Eng. 1994, 120, 2136–2154. [Google Scholar] [CrossRef]
  26. Thompson, P.A. Base and shaft grouted piles. Proc. Inst. Civ. Eng. Geotech. Eng. 1996, 119, 186–192. [Google Scholar]
  27. Mullins, G.; Winters, D.; Dapp, S. Predicting end bearing capacity of post-grouted drilled shaft in cohesionless soils. J. Geotech. Geoenviron. Eng. 2006, 132, 478–487. [Google Scholar] [CrossRef] [Green Version]
  28. Zhang, Z.M.; Yu, J.; Zhang, G.X.; Zhou, X.M. Test study on the characteristics of mudcakes and in situ soils around bored piles. Can. Geotech. J. 2009, 46, 241–255. [Google Scholar] [CrossRef]
  29. Sinnreich, J.; Simpson, R.C. Case histories of full-scale comparative load testing of base grouted and Ungrouted test shaft pairs. In Proceedings of the IFCEE 2015, San Antonio, TX, USA, 17–21 March 2015; pp. 486–499. [Google Scholar]
  30. Frizzi, R.P.; Meyer, M.E.; Zhou, L.J. Full Scale Field Performance of Drilled Shafts Constructed Utilizing Bentonite and Polymer Slurries. In GeoSupport 2004: Drilled Shafts, Micropiling, Deep Mixing, Remedial Methods, and Specialty Foundation Systems; Geotechnical Special Publication: Orlando, FL, USA, 2004; pp. 573–586. [Google Scholar]
  31. Wan, Z.H.; Dai, G.L.; Gong, W.M. Full-scale load testing of two large-diameter drilled shafts in coral-reef limestone formations. Bull. Eng. Geol. Environ. 2018, 77, 1127–1143. [Google Scholar] [CrossRef]
  32. Randolph, M.F.; Wroth, C.P. An analysis of the vertical deformation of pile groups. Geotechnique 1979, 29, 423–439. [Google Scholar] [CrossRef]
  33. El-Kelesh, A.M.; Matsui, T.; Tokida, K. Field investigation into effectiveness of compaction grouting. J. Geotech. Geoenviron. Eng. 2012, 138, 451–460. [Google Scholar] [CrossRef] [Green Version]
  34. Fang, K.; Zhang, Z.M.; Zhang, Q.Q.; Liu, X.W. Prestressing effect evaluation for a grouted shaft: A case study. Proc. Inst. Civ. Eng.-Geotech. Eng. 2014, 167, 253–261. [Google Scholar] [CrossRef]
  35. Wen, L.; Kong, G.Q.; Li, Q.S.; Zhang, Z.D. Field Tests on Axial Behavior of Grouted Steel Pipe Micropiles in Marine Soft Clay. Int. J. Geomech. 2020, 20, 06020006. [Google Scholar] [CrossRef]
  36. Fiscina, L.F.G.; Barbosa, Y.; Albuquerque, P.J.R.D.; Carvalho, D.D. Field study on axial behavior of instrumented post-grouted steel pipe micropiles in tropical lateritic soil. Innov. Infrastruct. Solut. 2021, 6, 56. [Google Scholar] [CrossRef]
  37. Wan, Z.H.; Dai, G.L.; Gong, W.M. Field study on post-grouting effects of cast-in-place bored piles in extra-thick fine sand layers. Acta Geotech. 2019, 14, 1357–1377. [Google Scholar] [CrossRef]
  38. Xing, H.; Liu, L.L.; Luo, Y. Effects of Construction Technology on Bearing Behaviors of Rock-Socketed Bored Piles as Bridge Foundations. J. Bridge Eng. 2019, 24, 05019002. [Google Scholar] [CrossRef]
  39. Jianhang, L.; Xiaojuan, L.; Luchao, G.; Guoliang, D.; Weiguo, W. Conversion factor analysis of self-balanced loading test of cast-in-situ piles based on analogue test method. J. Southeast Univ. (Engl. Ed.) 2019, 35, 185–190. [Google Scholar]
  40. Osterberg, J. New device for load testing driven piles and drilled shafts separates friction and end bearing. In Proceedings of the 3rd International Conference on Piling and Deep Found, London, UK, 15–18 May 1989; pp. 421–428. [Google Scholar]
  41. The Traffic Professional Standards Compilation Group of People’s Republic of China. JT/T 738-2009 Static Loading Test of Foundation Pile-Self-Balanced Method; China Communications Press: Beijing, China, 2009. (In Chinese) [Google Scholar]
  42. Yu, C.H. Application and Development of Load Tests on Cast-in Place Bored Piles in Taiwan. In Proceedings of the 5th Deep Foundation Engineering Development Forum, Hangzhou, China, 25–28 March 2015; pp. 218–235. (In Chinese). [Google Scholar]
  43. Hsu, M.C.; Chen, C.H.; Koh, C.; Kwan, P.C.; Yu, C.H. Evaluation of base grouting for the bearing behavior of barrette piles socketed in a gravel formation. J. Chin. Inst. Eng. 2017, 40, 492–502. [Google Scholar] [CrossRef]
  44. Touma, F.T.; Reese, L.C. Behavior of bored piles in sand. J. Geotech. Eng.-ASCE. 1974, 100, 749–761. [Google Scholar] [CrossRef]
  45. Kamal, Z.A.; Arab, M.G.; Dif, A. Analysis of the arching phenomenon of bored piles in sand. Alex. Eng. J. 2016, 55, 2639–2645. [Google Scholar] [CrossRef]
  46. Dai, G.L.; Gong, W.M.; Zhao, X.L.; Zhou, X.Q. Static testing of pile-base post-grouting piles of the Suramadu Bridge. Geotech. Test. J. 2010, 34, 34–49. [Google Scholar]
Figure 1. Plan view of test site and left elevation of bridge.
Sustainability 14 06835 g001
Figure 2. Details of test shafts and soil layer profile.
Sustainability 14 06835 g002
Figure 3. Combined grouting system and bi-directional loading device used for drilled shafts.
Sustainability 14 06835 g003
Figure 4. Mechanism and details of bi-directional test.
Sustainability 14 06835 g004
Figure 5. Load–displacement curves of bidirectional test: (a) TS1; (b) TS3; (c) TS2; (d) TS3.
Sustainability 14 06835 g005
Figure 6. Q-s curves of test shafts: (a) TS1 & TS2; (b) TS3 & TS4.
Sustainability 14 06835 g006
Figure 7. qw curves of test shafts: (a) TS1 & TS2; (b) TS3 & TS4.
Sustainability 14 06835 g007
Figure 8. τ-s curves of the upper segments of TS1–TS4 before grouting: (a) silty soil; (b) silty sand.
Sustainability 14 06835 g008
Figure 9. τ-s curves of the upper segments of TS1–TS4 after grouting: (a) silty soil; (b) silty sand.
Sustainability 14 06835 g009
Figure 10. τ-s curves of the lower segments of TS1–TS4 before grouting: (a) silty soil; (b) silty sand.
Sustainability 14 06835 g010
Figure 11. τ-s curves of the lower segments of TS1–TS4 after grouting: (a) silty soil; (b) silty sand.
Sustainability 14 06835 g011
Figure 12. Ratio of measured value/recommended value of ultimate side resistance. Distributed with depth before grouting: (a) TS1; (b) TS2; (c) TS3; (d) TS4.
Sustainability 14 06835 g012
Figure 13. Ratio of measured value/recommended value of ultimate side resistance distributed with depth after grouting: (a) TS1; (b) TS2; (c) TS3; (d) TS4.
Sustainability 14 06835 g013
Figure 14. Distribution of side resistance versus depth of TS1–TS4 under various loads before grouting: (a) TS1; (b) TS2; (c) TS3; (d) TS4.
Sustainability 14 06835 g014
Figure 15. Distribution of side resistance versus depth of TS1–TS4 under various loads after grouting: (a) TS1; (b) TS2; (c) TS3; (d) TS4.
Sustainability 14 06835 g015
Figure 16. (a) qw curves of TS3 & TS4 under the loading range of 0–4000 kN;.(b) Failure mode of test shafts with thick tip sediment.
Sustainability 14 06835 g016
Figure 17. Soil movement and stress element status in shaft side soil at various loading stages: (a) initial loading; (b) resistance softening; (c) resistance reinforcing; (d) combined grouting.
Sustainability 14 06835 g017
Table 1. Physical properties of the soil layer.
Soil LayerLayer Thickness (m)w (%)c (kPa)φ (°)Es (MPa)γ (kN/m−3)qs (kPa)SPT (N)
2-1 Silty soil2.8–3.221.825.610.66.8619.5337
2-2 Silty soil11.6–14.019.441.29.512.5419.33510
3-1 Silty sand1.6–2.9----------4010
2-3 Silty soil4.1–4.322.644.514.010.0719.04511
3-2 Silty sand21.1–23.0----------6314
2-4 Silty soil7.5–12.126.729.88.34.4620.06517
3-3 Silty sand3.2–10.7----------7017
Table 2. Summary of test drilled shafts and load test results.
Shaft No.Shaft Diameter (m)Shaft Length (m)Sediment Thickness (mm)Combined GroutingMaximum Shaft Head Load (kN)Maximum Shaft Head Displacement (mm)
TS11.86142ungrouted22,42873.21
TS21.86129ungrouted22,42870.47
TS31.85753ungrouted20,19667.15
TS41.85725ungrouted20,19662.66
TS11.86142grouted38,56154.73
TS21.86129grouted38,56159.85
TS31.85753grouted36,01950.50
TS41.85725grouted36,01952.43
Table 3. Loads and displacement of each segment of TS1–TS4.
Shaft No.Combined GroutingMaximum Load (kN)Displacement (mm)Percentage of Rebound (%)
UpwardDownward UpwardDownward
TS1ungrouted11,00014.6492.7213.9213.88
TS2ungrouted11,00014.8390.1413.2422.12
TS3ungrouted10,00011.6585.6915.8011.32
TS4ungrouted10,00012.3277.7814.9523.64
TS1grouted18,13327.3338.3931.9420.15
TS2grouted18,13326.2543.5132.3731.42
TS3grouted17,00019.9135.9231.4621.55
TS4grouted17,00021.5037.8537.0132.03
Publisher’s Note: MDPI stays neutral with regard to jurisdictional claims in published maps and institutional affiliations.

