Abstract
This paper aims to introduce thermal energy storage technology into a solar-powered dual-packed bed desalination system. By prehesdating and reserving seawater during the daytime and utilizing it at night, the integrated desalination system with innovative configuration can achieve freshwater and electricity combined generation and particularly realize the continuous operations for water production. The detailed mathematical model is established, and the corresponding parametric analyses are executed with various operating situations. The simulation results show that with the rise of top temperature, the performance indicators of the system, gained-output-ratio (GOR), and water productivity, reach the maximum value at the MFRR corresponding to the balance condition of dehumidifier, while the power generation of photovoltaic/thermal (PV/T) reaches minimum value under different incident conditions. It is summarized that the balance condition also represents the upper limit of air compensation capability and the “turning point” of air temperature, which can be enhanced by raising the top temperature of the system. Furthermore, the integrated system outperforms other HDH configurations in prior research, demonstrating the feasibility and superiority of the present continuous water-producing HDH system supported by thermal energy storage.
1. Introduction
With fast industrial development, escalating rise in population, and uneven distribution of water around the world, guaranteeing the quality and quantity of freshwater resources has become increasingly difficult. Compared with freshwater, seawater accounts for more than 97% of the total water assets on the planet [1] thus, the issue of water scarcity will hopefully be solved by processing seawater into freshwater, which is also the reason why desalination technology is of significant importance to our future development. Including distillation and membrane methods, common large-scale desalination technologies usually require expert operations as well as considerable energy consumption of thermal and electric energy supplied by large power plants [2], which are ineffective in less-developed regions. Therefore, numerous investigations have been focused on the improvement of small-scale desalination devices [3,4,5], in which the humidification and dehumidification (HDH) desalination technology, based on the principle of simultaneous heat and mass transfer, is one of the most promising ones for its high energy utilization efficiency [6].
However, despite the ability of the HDH system to function with less energy input due to the miniaturization of its equipment, the energy consumption per unit volume far exceeds that of traditional desalination technologies [7]. If solar energy or waste heat from power plants is adopted as the heat source, the HDH system will achieve a higher GOR while maintaining lower energy consumption.
Considerable research efforts have been devoted to the application of solar energy to HDH desalination systems. Thakkar et al. [8] designed and fabricated an air-heated HDH system powered by a solar air collector. The experiments were conducted under two different air flow rates, and the results showed that the proposed desalination system is suitable for arid and oceanic areas with small-scale freshwater requirements. In a novel solar-driven CAOW HDH desalination system proposed by S.W. Sharshir et al. [9], solar still and solar collector (SC) are adopted to raise the temperature of working fluid under different system configurations. The performance of a single HDH desalination system, conventional solar still, and the combination of them were studied in detail, and the impact of various water mass flow rates on the water production of the combined system was investigated as well. The conclusion indicated that the daily freshwater productivity of conventional solar still, solar still feed with brine from HDH system, single HDH system, and the combination of HDH system and solar still were 3.9, 13, 24, and 37 L. Kabeel et al. [10] experimentally investigated the performance evaluations of a two-stage indirect solar dryer with reheating coupled with an HDH desalination system. The experimental results showed that the daily water production rose from 29.55 L to 42.3 L, with air flow increasing from 50 m3h−1 to 75 m3h−1. In addition, within the same air flow variation range, the performance indicator of the system, GOR, varied over ranges of 1.24 to 1.79 and 0.97 to 1.38 for the proposed system and an HDH desalination system only, respectively. Mishal [11] proposed a continuously working HDH system by feeding seawater to absorb solar energy and reserving it in a thermal storage tank with excellent insolation during the day. At night, the tank switches to discharging mode and starts feeding the HDH system with the hot seawater. The results showed that daily freshwater production is 7.6 kg per unit area of solar collector, and the daily average for GOR and the recovery ratio are 0.3 and 0.09, respectively.
Apart from research focusing on SC, numerous investigations have been conducted on the combination of PV/T and HDH desalination systems. Wang et al. [12] designed an HDH system driven by a photovoltaic (PV) device under natural or forced convection mode, in which the evaporation chamber is filled with heated seawater, and the condensation chamber is a shell and tube heat exchanger. The conclusion revealed that when the evaporative temperature equals 64.3 °C, the highest value of freshwater yield was 0.873 kgm−2d−1 for the forced convection mode, indicating the economic and feasible characteristics of the PV-driven HDH desalination system. For a CWOA HDH system with circulating air heated by solar energy, Giwa et al. [13] studied the PV panel capacity for recovery from thermal energy as well as water production, and the calculation results showed that the daily freshwater production is 2.28 Lm−2. In addition, Shiva et al. [14] proposed a novel PV/T solar humidifier and adopted it in an HDH system driven by a heat pump cycle. Under different condensation temperatures and seawater mass flow rate conditions, the thermodynamic and economic performance of the combined HDH system was investigated experimentally. The results revealed that the highest value of water evaporation rate in the humidifier was around 4.48 kg at the seawater flow rate of 0.15 kgs−1 and the condensation temperature of 20 °C, and the cost of freshwater production was 0.018 USDkg−1. Elsaf [15] came up with a power and water co-generation system based on the HDH cycle and PV/T module, and the corresponding mathematical model for the integrated system was raised. The results showed that the system could produce 12 m3 of freshwater and 960 kWh of electricity annually, and the unit cost for freshwater and electricity production were 0.01 USDL−1 and 0.289 USDkWh−1, respectively. Therefore, compared with solar collectors, PV/T can generate electrical energy as well as heat the circulating fluid of the system, which greatly improves the overall performance of the combined HDH system.
Given the structure of the desalination system in the aforementioned papers, the involved HDH devices are either self-designed or composed of a packed bed humidifier and a surface heat exchanger for dehumidification. In the latter case, severe pressure drops, contamination, and corrosion enhance the operating cost and impair the lifespan of the integral desalination system [16]. In addition, the dehumidification side often requires a larger heat transfer area due to a lower heat transfer coefficient, which increases the construction cost of the system. In order to solve the above problems, Klausner et al. [17] introduced a direct-contact dehumidifier into the HDH desalination system, in which the dehumidifier was fabricated as a twin tower structure with a co-current and countercurrent and had the same construction as the packed bed humidifier. Moreover, He et al. [18] proposed a co-generation system comprised of organic Rankine cycle and HDH to achieve continuous utilization of geothermal energy for simultaneous power and water production. The research results showed that the maximum value of net power and water production were 42.68 kW and 236.81 kgh−1, respectively. Considering the recirculation of seawater and freshwater, Zarei et al. [19] raised a CACW HDH desalination system with a direct-contact humidifier and dehumidifier. The relevant theoretical and experimental analyses were conducted at the various input parameter conditions, and the results showed that the peak value of GOR and water production are 3.3 and 300 Ld−1 at the equilibrium conditions of the dehumidifier.
In combination with previous literature review, it is found that although the application of PV/T and SC to HDH desalination system has received intensive investigations for their respective advantages, nonetheless, the solar-powered HDH system, which is fabricated with a direct contact dehumidifier to realize the compaction and economy of the system has not received much attention yet. In addition, ignoring the importance of energy storage, a majority of current solar-driven HDH systems can only operate during the daytime but fail to achieve continuous water production at night. However, in some special conditions, such as remote islands, the system may not fulfill the all-day freshwater requirements by solely operating in the daytime. Consequently, in order to ensure continuous operations for water production, realize the combined generation of freshwater and electricity, and fulfill the compaction and economy of the integrated system, this research incorporates the thermal energy storage technology into a dual packed bed HDH desalination system powered by solar energy. Moreover, the complete mathematical model is established, and the corresponding parametric analyses are executed at different incident solar radiation and top temperatures. By preheating and conserving seawater during the day and using it at night, the proposed system with innovative configuration outperforms other types of HDH configurations in prior research, demonstrating the feasibility and superiority of the present study. The research conclusions will afford worthy references for the design and optimization of the solar-driven HDH desalination system with thermal energy storage for continuous water production.
2. Description of the System
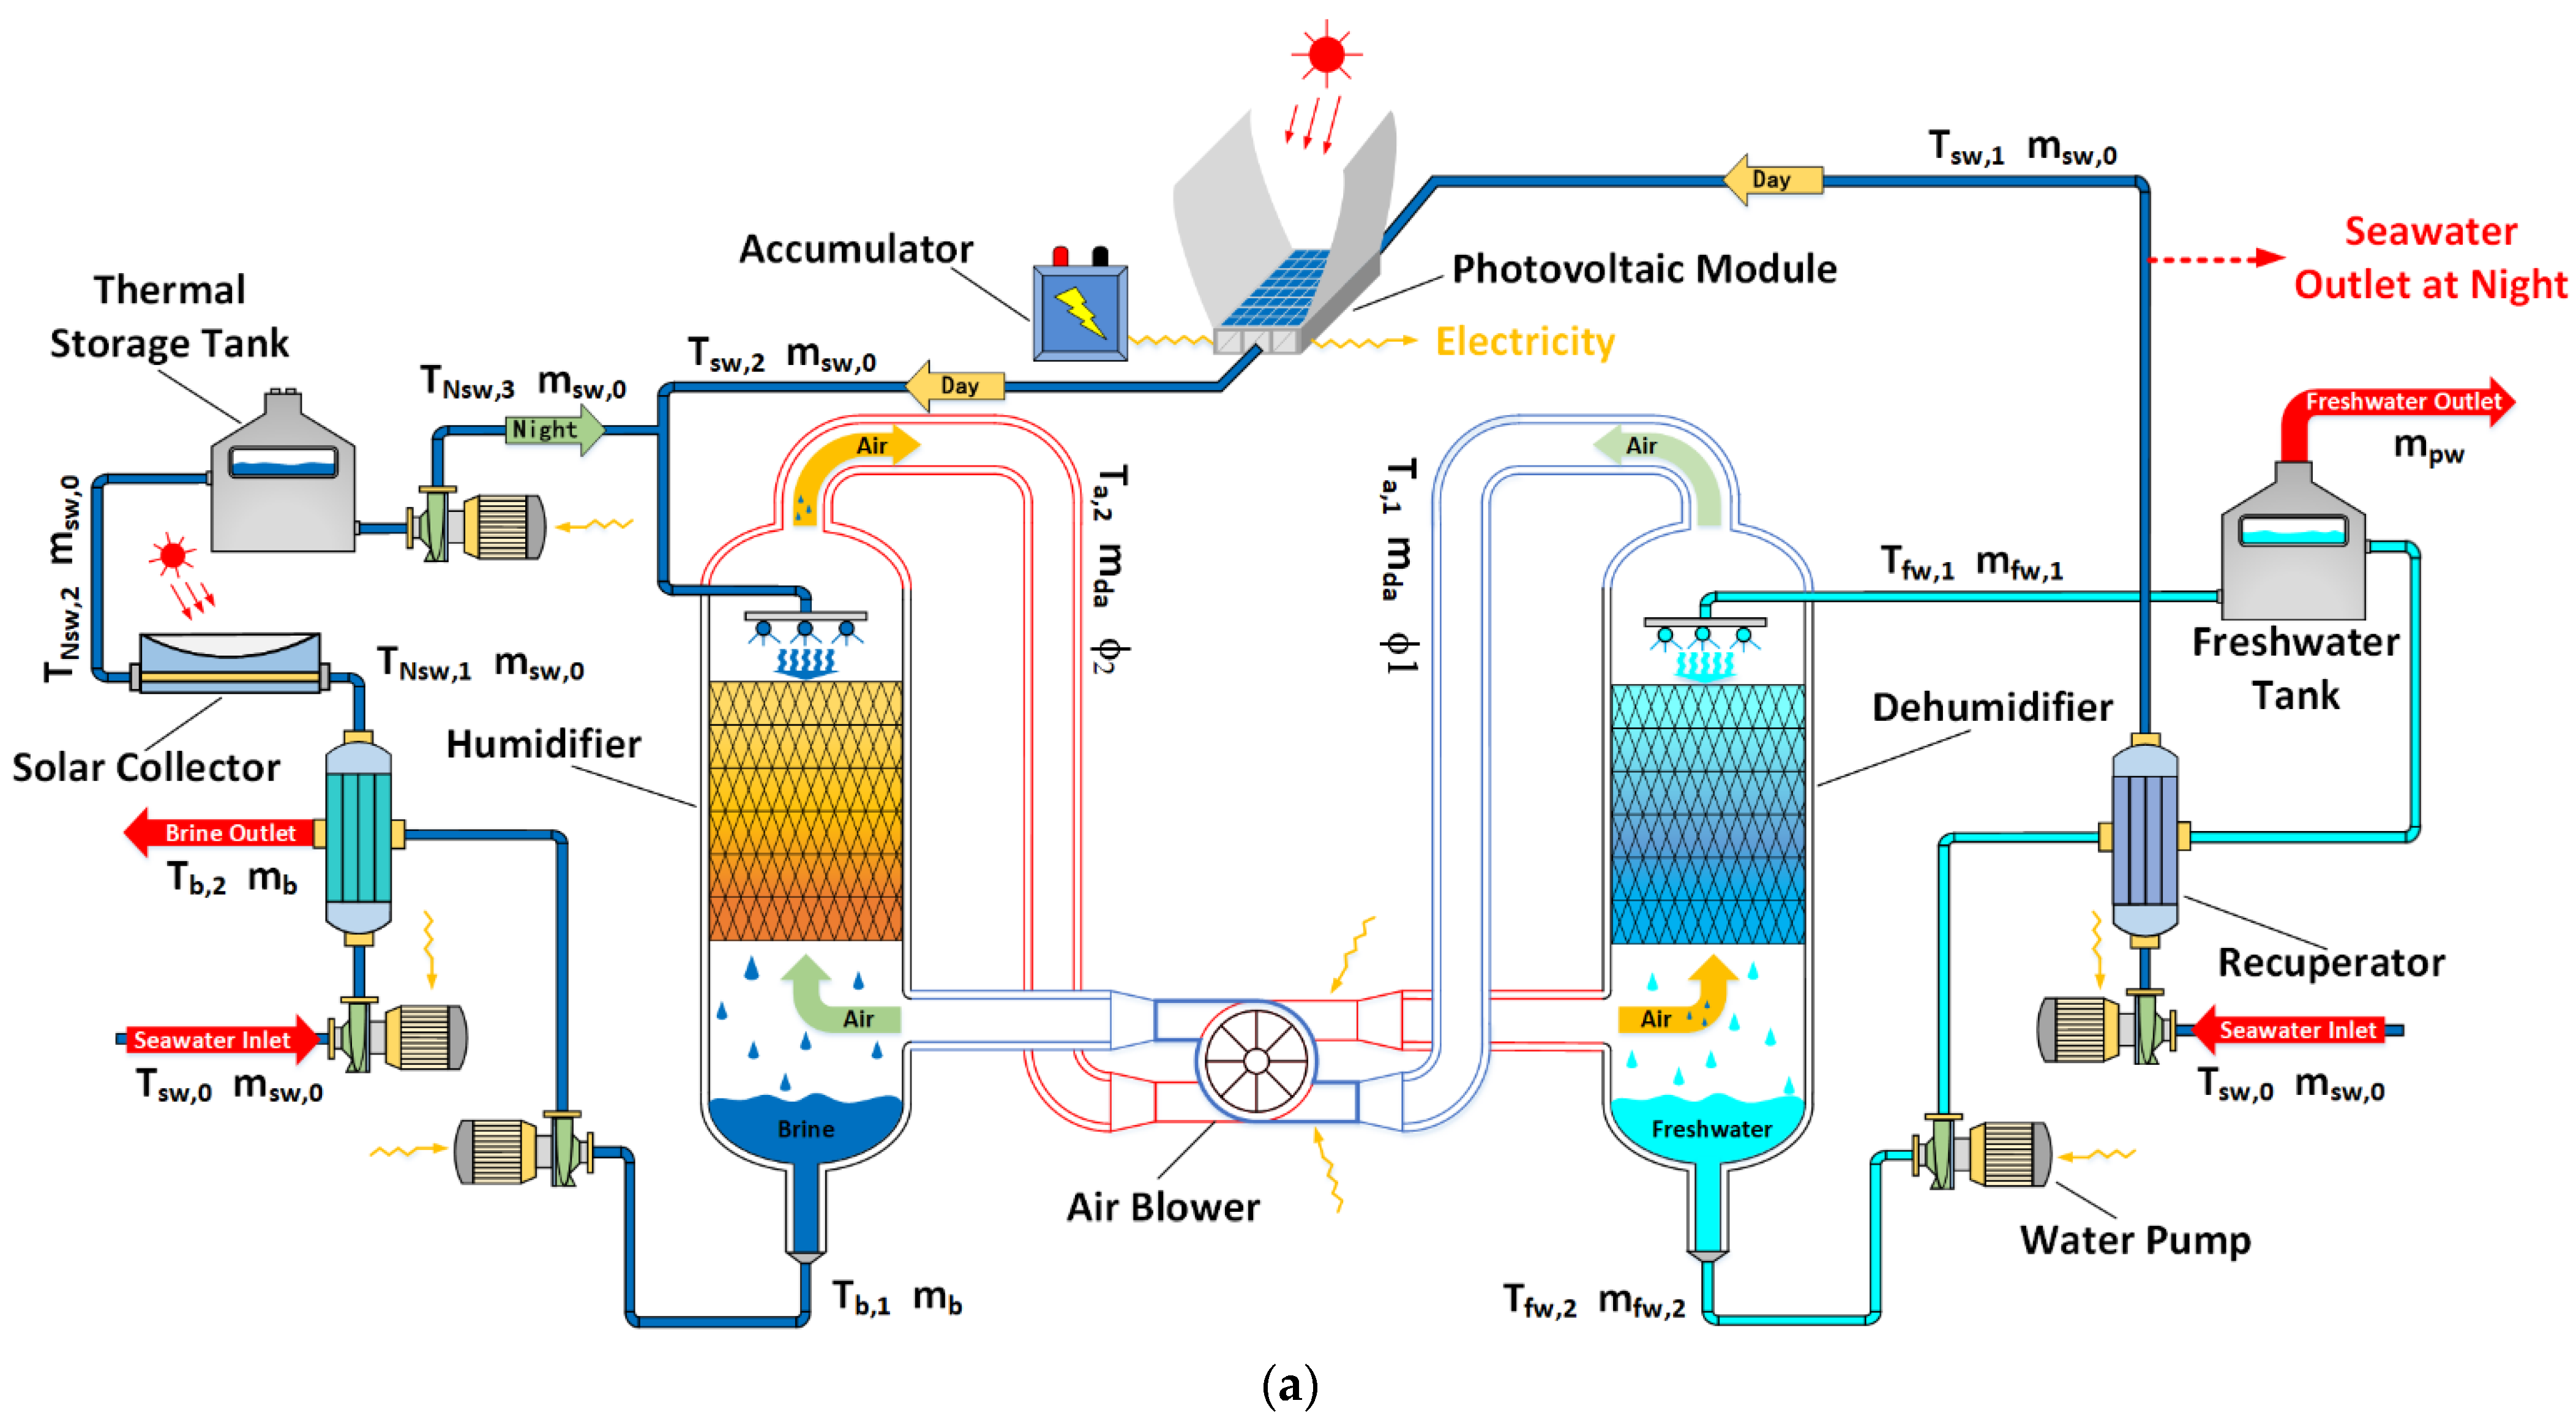
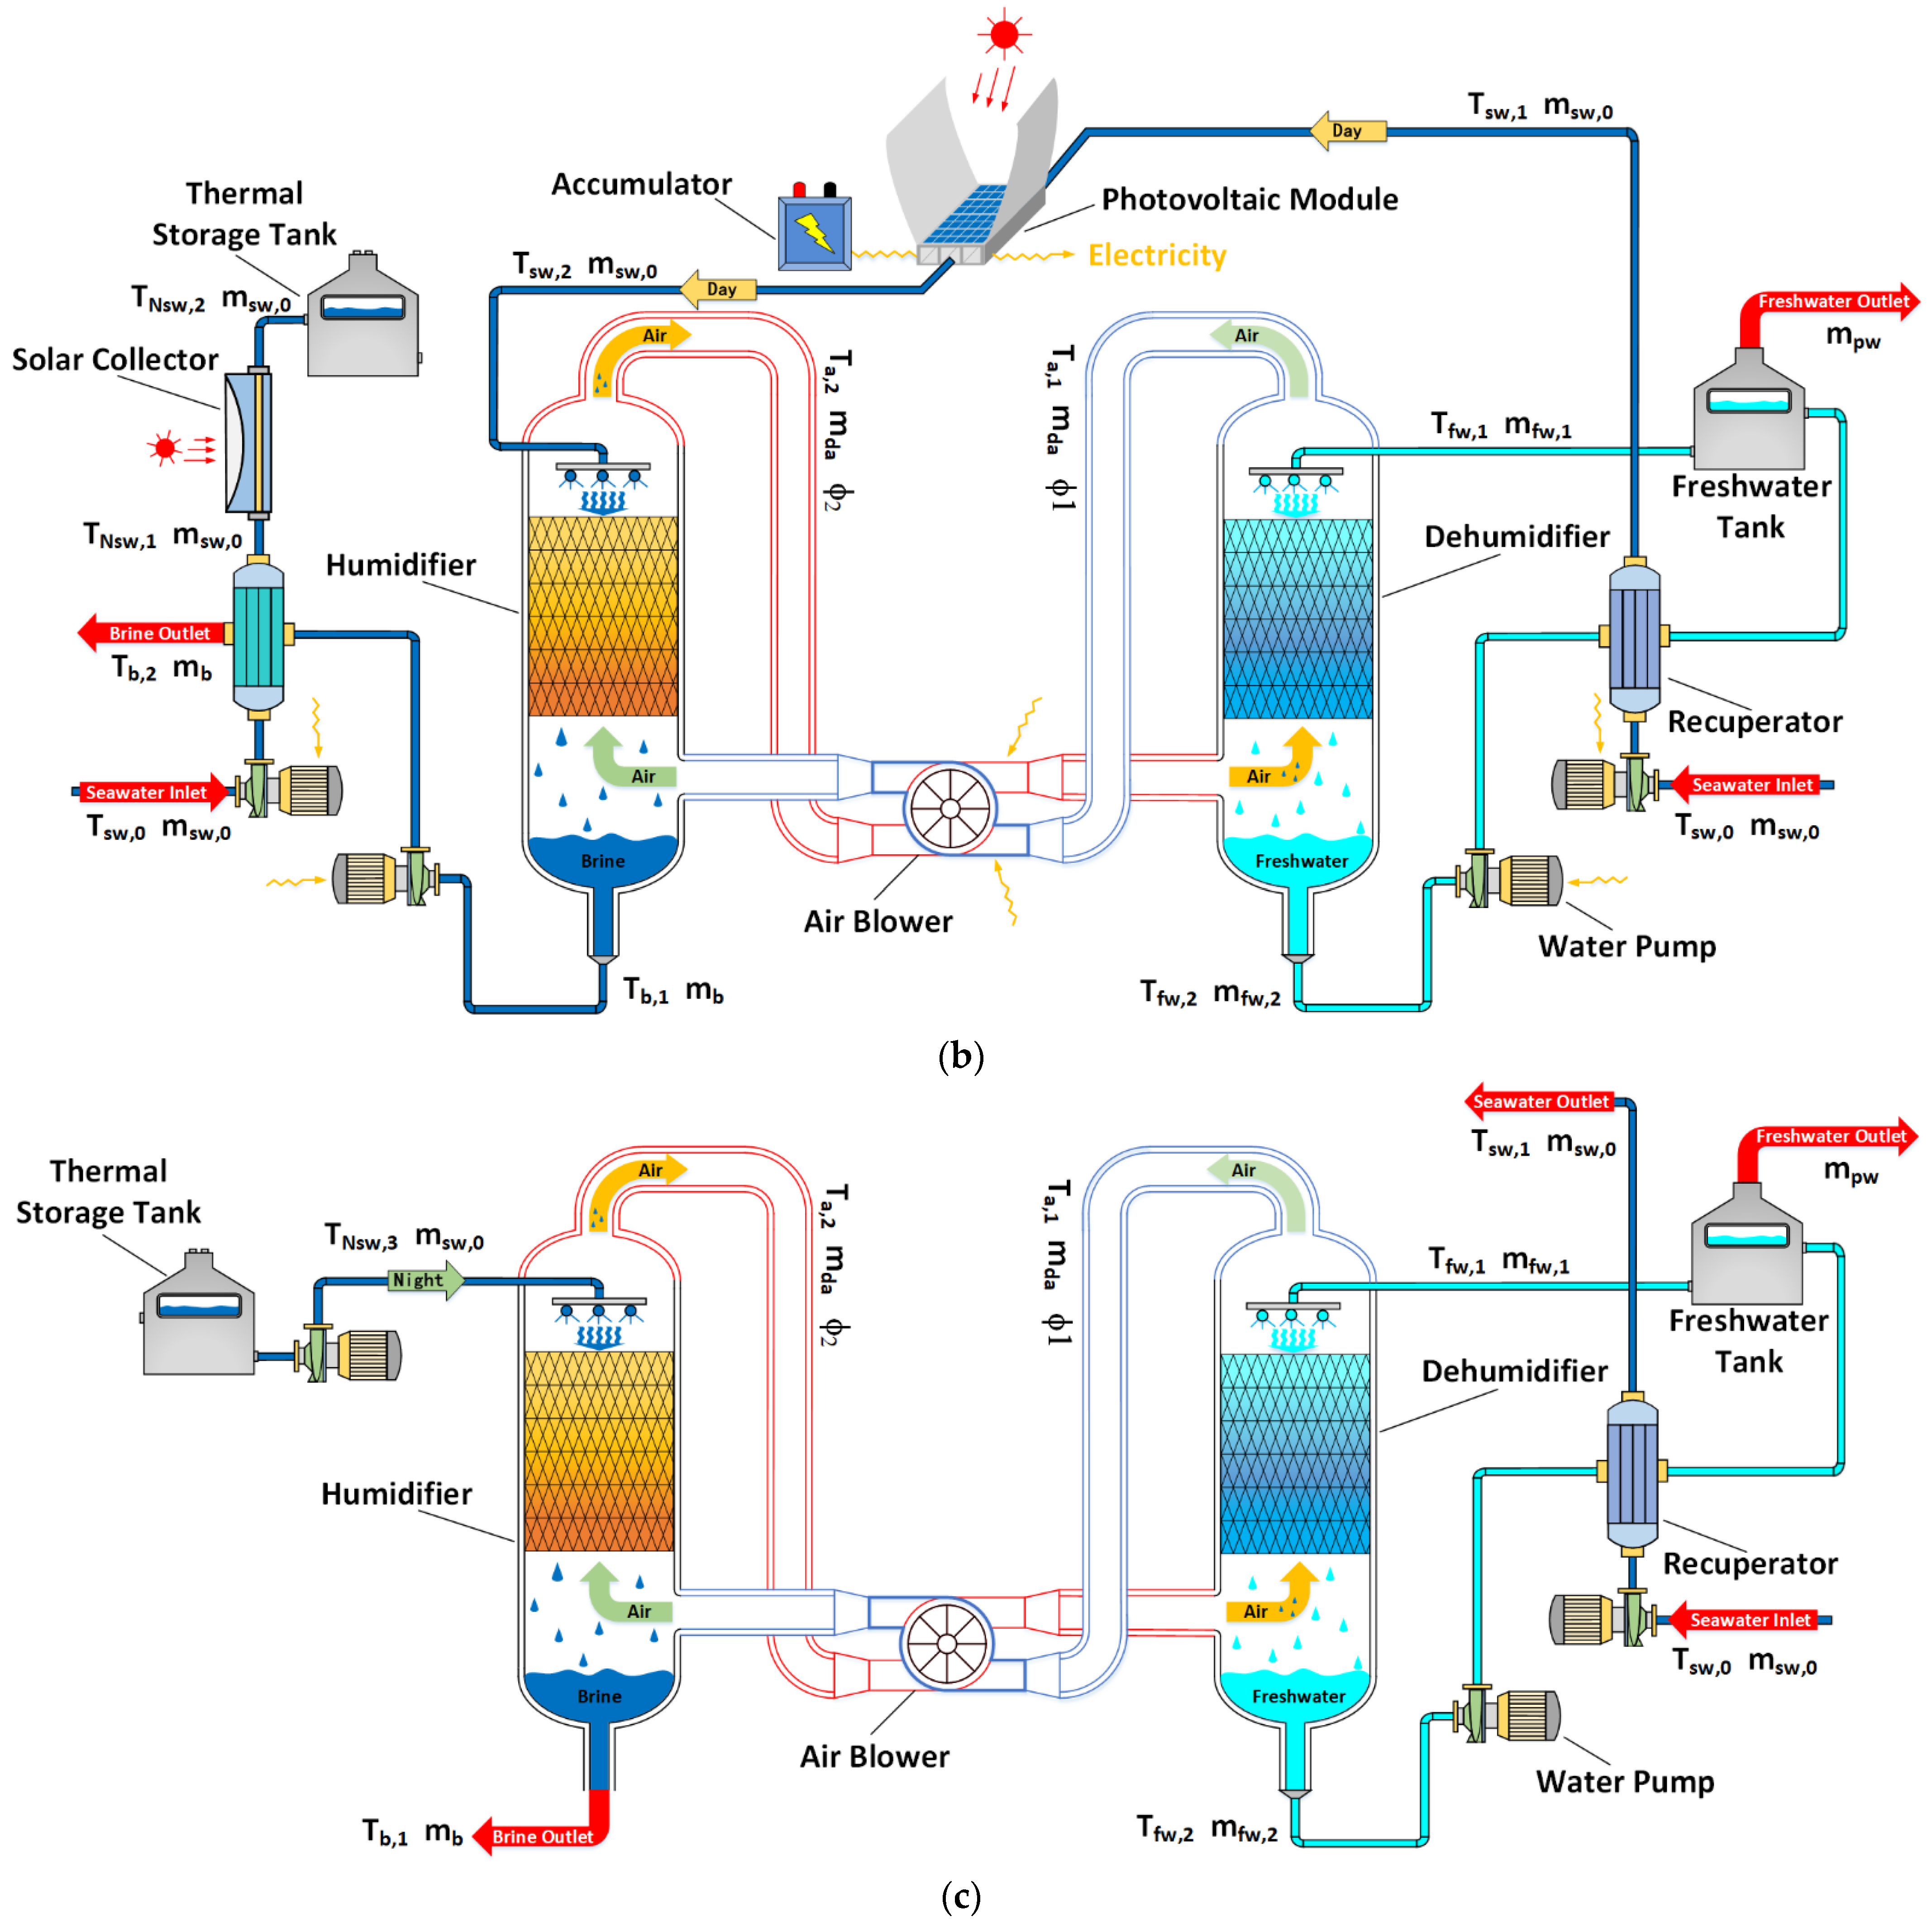
The integral configuration of the proposed desalination system, which mainly consists of a humidifier, dehumidifier, PV/T module, SC, thermal storage tank, and two recuperators, is presented in Figure 1a. It is obvious that the system belongs to the closed-air open-water type, utilizes solar energy to heat seawater via PV/T module and SC, and operates under different working modes in the daytime and night, which can be respectively seen in Figure 1b,c. The meticulous operation processes of the system are as follows. During the daytime, seawater firstly flows through the PV/T module to moderate the inevitable temperature rise of the PV panel during the photoelectric process as well as absorb the thermal energy to the prescribed top temperature and then flows into the humidifier from the top side. In the packing area of the humidifier, the cold air synchronously absorbs the heat and vapor from the seawater with countercurrent and further goes into the dehumidifier with a high temperature and humidity; meanwhile, the concentrated brine stored at the bottom of the humidifier is applied to raise the temperature of the seawater used at night in a recuperator, after which the preheated seawater is further heated to a certain temperature by an SC and stored in the thermal storage tank with fair thermal insulation capacity. Afterward, on the dehumidification side, a similar simultaneous heat and mass transfer process occur between freshwater and moist air, leading to the temperature and mass flow rate rise of freshwater and the drops in temperature and humidity of moist air. The heat preserved in the freshwater outflow of the dehumidifier is then recovered by initial seawater in another recuperator. The moist air at the outlet of the dehumidifier flows into the humidifier again, and the preheated seawater further enters into the PV/T module and then into the humidification side to restart the thermal cycle. In the evening, the prepared hot seawater enters the system and repeats a similar humidification and dehumidification process during the day, except for discharging the seawater outflow of the humidifier and recuperator on the dehumidification side.
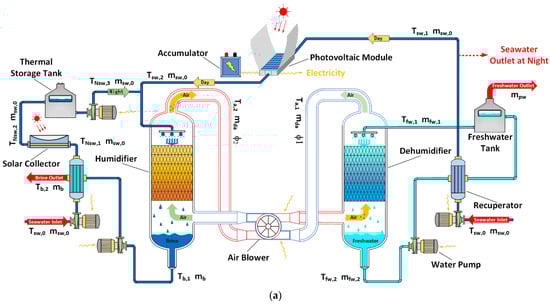

Figure 1.
The schematic diagram of solar-driven HDH desalination system. (a) Integral system, (b) Day mode subsystem, (c) Night mode subsystem.
It is emphasized that some assumptions should be achieved to simplify the mathematical model:
- (1)
- The system operates at a steady state condition.
- (2)
- The solar radiation is uniform and stable.
- (3)
- The photoelectric conversion efficiency changes linearly with the temperature of the photovoltaic panel.
- (4)
- Heat dissipation of HDH devices is negligible.
- (5)
- The changing of kinetic and potential energy should be ignorable.
- (6)
- Fouling resistance of the HDH devices is neglected.
- (7)
- The air is always saturated along the flow path [20].
- (8)
- The fluid is in a laminar state throughout the process.
3. Mathematical Model of the System
3.1. Model of PV/T
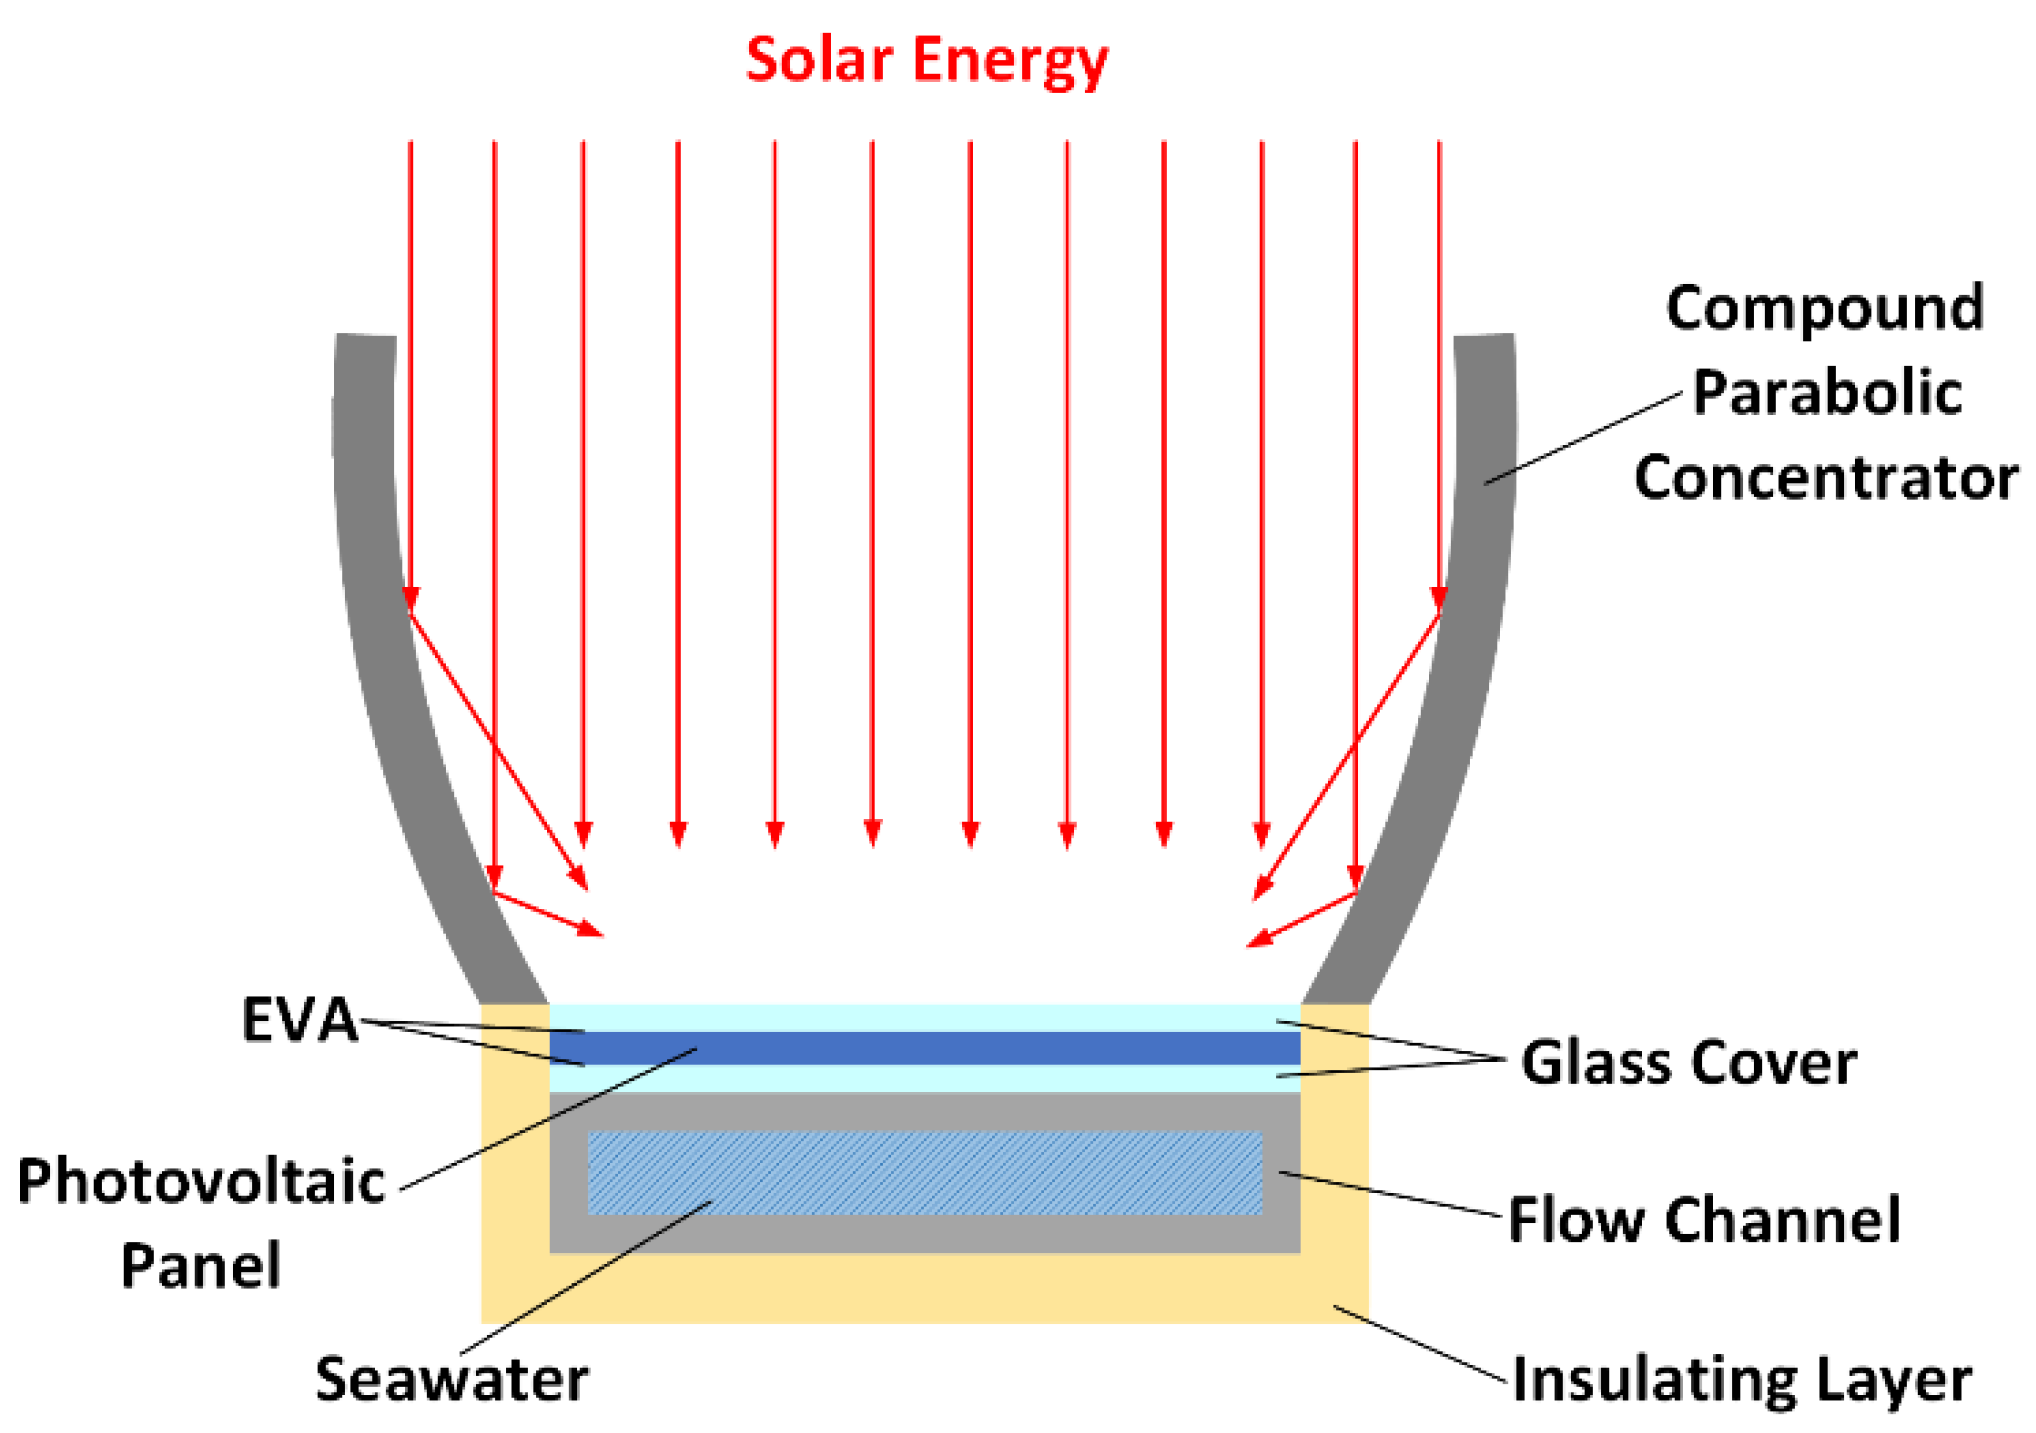
As mentioned before, the operation process of a PV panel will generate thermal energy inevitably, which increases its temperature and thereby weakens the photoelectric conversion efficiency and service life of the integral PV/T module. In order to enhance the efficiency of electricity generation, seawater is applied to take away the heat emerging during the operation process. It could be found from Figure 2 that the PV/T module is composed of a compound parabolic concentrator (CPC), glass cover, EVA bonding layer, photovoltaic (PV) panel, seawater flow channel, and insulation layer. Some structural parameters of PV/T are presented in detail in Table 1.
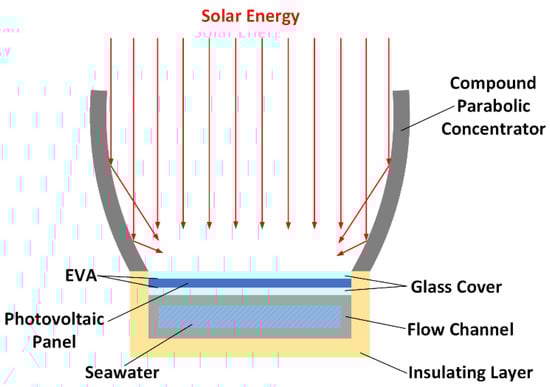
Figure 2.
The structure diagram of PV/T module.

Table 1.
Detailed parameters of the PV/T module.
Predicated on the structure presented in Figure 2, the heat transfer processes within the PV/T module are as follows. Firstly, the concentrator focuses the incident solar radiation on the upper glass cover, among which a small amount of solar energy is lost due to reflection and convection, another small part is converted into thermal energy of itself, but most of the remaining solar radiation is transferred into thermal and electricity in the PV panel. The heat transferred from PV to the lower glass cover is then converted into the thermal energy of the seawater in the flow channel through heat convection between the seawater and lower glass cover. As a consequence of the adoption of the insulation layer, there is only a small amount of energy dissipation from seawater to the environment. On the basis of the PV/T model proposed by Bu [21], this paper further considers the variation of the PV panel area. Therefore, considering the aforementioned energy transfer process, the mathematical model of the PV/T module can be established based on energy conservation.
For the upper glass cover:
where C denotes the concentration ratio of CPC, I is the total incident radiation of sunlight; αg1 refers to the absorptivity of the upper glass cover; Kc,g1, Kg1,amb and Kg1,atm are the heat transfer coefficient between the upper glass cover and photovoltaic panel, upper glass cover and ambient space, upper glass cover and atmosphere; Tc, Tg1 stand for the temperature of PV panel and upper glass cover; Tamb and Tatm represent the ambient temperature and atmospheric temperature.
CIαg1 + Kc,g1 (Tc − Tg1) = Kg1,amb (Tg1 − Tamb) + Kg1,atm (Tg1 − Tatm)
Then, the heat transfer in the PV panel can be expressed as follow:
where Kc,g2 represents the heat transfer coefficient between the lower glass cover and PV panel; E stands for the power generation through the photoelectric process, which can be provided as:
where ηc in Equation (3) is the photovoltaic efficiency of the PV panel, which is described as:
where ηref is the reference efficiency, Tref stands for the reference temperature according to reference efficiency, and γ denotes the attenuation coefficient. As can be obtained from Equation (4), the photovoltaic efficiency of the PV panel will decrease with the rise in its temperature, which weakens the ability to generate electricity.
CIτg1αc = Kc,g1 (Tc − Tg,1) + Kc,g2 (Tc − Tg2) + E
E = CIτg1αcηc
ηc = ηref [1 − γ(Tc − Tref)]
Moreover, take the lower glass cover as the research object:
where Kg2,f refers to the heat transfer coefficient between the lower glass cover and seawater in the flow channel.
Kc,g2 (Tc − Tg2) = Kg2,f (Tg2 − Tf)
At last, focus on the seawater within the flow channel:
where Kf,amb stands for the heat transfer coefficient between seawater and ambient space; ef and Lf represent the width and length of the fluid channel; Tsw,1 and Tsw,2 are the inlet and outlet temperature of seawater, respectively; Tf denotes the mean temperature of seawater.
Kg2,f A(Tg2 − Tf) = Kf,amb (A + 2efLf)(Tf − Tamb) + mswCp,f (Tsw,2 − Tsw,1)
By combining Equations (1), (2), (5) and (6), the temperature of the upper and lower glass cover, PV panel, and seawater outflow can be calculated; thus, heat absorption of seawater in the PV/T module during the daytime can be also obtained:
where hsw,1 refers to the specific enthalpy of seawater at the inlet of PV/T module, hsw,2 stands for the specific enthalpy of seawater at the outlet of PV/T module.
Qin,D = msw (hsw,2 − hsw,1)
3.2. Model of SC
In order to heat the seawater to a specific temperature for night use, an SC with a high concentration ratio is utilized in this paper, and its structure is presented in Figure 3. Using trough parabolic concentrator, the SC realizes the convergence of solar energy during the operation process, among which a small amount is lost through reflection, another small part will be converted into thermal energy of glass cover through radiation heat transfer, and the rest of the solar energy is going to be transformed into the heat of seawater in the flow channel. In order to reduce heat dissipation, a thick insulation layer is applied as the outermost structure. Some structural and thermodynamic parameters of SC under standard operating conditions (I = 1000 Wm−2, Tsw,2 = 60 °C) are listed in Table 2.
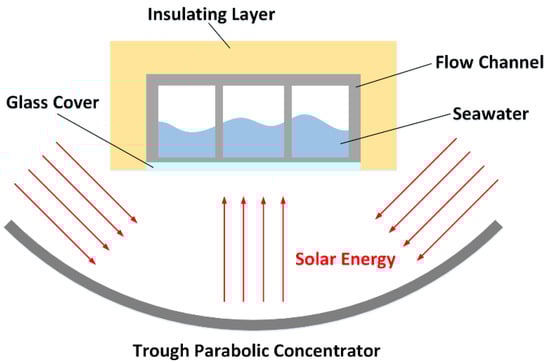
Figure 3.
The structure diagram of SC.
Table 2.
Detailed parameters of SC under standard conditions.
Taking the glass cover and seawater in the flow channel as the research object, the energy conservation equations can be expressed as follows [22]:
where Ch denotes the concentration ratio of trough parabolic concentrator; αg refers to the absorptivity of the glass cover; Kf,g, Kg,amb, Kg,atm, Kf,amb are the heat transfer coefficient between the glass cover and seawater flow, glass cover and ambient space, glass cover and atmosphere, seawater flow and ambient space; Tg stands for the temperature of glass cover; TNsw,1 and TNsw,2 are the inlet and outlet temperature of seawater, respectively; τg represents the transmissivity of glass cover; Sh represents the heat transfer area.
ChIαg + Kf,g (Tf − Tg) = Kg,amb (Tg − Tamb) + Kg,atm (Tg − Tatm)
ChIτgαc = Kf,g (Tf − Tg) + Kf,amb (Tf − Tamb)/Sh + mswCp,f (TNsw,2 − TNsw,1)
By combining Equations (8) and (9), the temperature of seawater outflow and glass cover can be obtained at the same time. Therefore, the heat absorption of seawater in the SC for night use can be determined as follow:
where hNsw,1 and hNsw,2 stand for the specific enthalpy of seawater at the inlet and outlet of SC, respectively.
Qin,N = msw (hNsw,2 − hNsw,1)
3.3. Model of the Recuperator
In the proposed desalination HDH system, two plate-type heat exchangers are employed to recover thermal energy from brine at the outlet of the humidifier and freshwater outflow of the dehumidifier. The structure parameters of the recuperator are detailedly listed in Table 3.
Table 3.
Structure parameters of the recuperator.
By applying the energy conservation principle to the fluid on both sides of the recuperator, the heat transfer rate can be calculated as:
where mh and mc represent the mass flow rate of hot and cold fluid; hh,i and hc,i refer to the specific enthalpy of hot and cold fluid at the inlet; hh,o and hc,o are the specific enthalpy of hot and cold fluid at the outlet.
Qre = mh (hh,i − hh,o) = mc (hc,o − hc,i)
Then, with the log mean temperature difference considered, the heat transfer rate of the recuperator can also be expressed as:
where K is the overall heat transfer coefficient; A represents the total heat transfer area; ΔTm refers to the log mean temperature difference between hot and cold fluid.
Qre = KAΔTm
In order to calculate the Nusselt and further heat transfer coefficient of the fluid, the Chisholm and Wanniarachchi correlation gained by Cascales [23] is applied:
where β is the plate chevron angle, Re stands for the Reynolds number, and Pr refers to the Prandtl number. Noting that when π/6 ≤ β ≤ 2π/3 and Re > 1000, this correlation is more accurate.
Nu = 0.724(6β/π)0.646Re0.583Pr1/3
After obtaining the heat transfer coefficient of the fluid within the recuperator, the overall heat transfer coefficient can be described as:
where hf,h and hf,c are the heat transfer coefficient of hot and cold fluid; δp and λp denote the thickness and thermal conductivity of the plate.
1/K = 1/hf,h + δp/λp + 1/hf,c
At last, based on the total plate number, the heat transfer area can also be calculated as:
where Nre represents the total plate number and Sp stands for the plate area.
A = NreSp
3.4. Model of Packed Bed Humidifier and Dehumidifier
As mentioned above, the air constantly circulates between the humidifier and dehumidifier and changes its temperature and humidity through the heat and mass transfer process with seawater and freshwater within the packing area. The relevant mass and energy balance equation for humidifier can be expressed as follows:
where msw, hsw,2 refer to the mass flow rate and specific enthalpy of seawater at the inlet of the humidifier; mb and hb denote the mass flow rate and specific enthalpy of seawater at the outlet of the humidifier; mda is the mass flow rate of dry air; ωa,1, ha,1 represent the humidity ratio and specific enthalpy of moist air inflow, and ωa,2, ha,2 stand for the humidity ratio and specific enthalpy of moist air outflow.
msw − mb = mda (ωa,2 − ωa,1)
mda (ha,2 − ha,1) = mswhsw,2 − mbhb
After leaving the humidifier, the humid and heated air will enter the dehumidifier, in which freshwater absorbs the distillation and thermal energy from moist air at the same time. A similar research method is applied to achieve the mass and energy balance equation between freshwater and moist air on the dehumidification side:
where mfw,i and hfw,1 are mass flow rate and specific enthalpy of freshwater at the inlet of dehumidifier; mfw,o and hfw,2 represent the mass flow rate and specific enthalpy of freshwater at the outlet of dehumidifier; mpw refers to water production during the condensation process.
mpw = mfw,o − mfw,i
mda (ha,2 − ha,1) = mfw,ohfw,2 − mfw,ihfw,1
In the present research, the effectiveness method is adopted to obtain the thermodynamic balance of the dehumidifier, and the concept of modified effectiveness raised by Narayan [24] can be defined as:
where ΔH denotes actual enthalpy change in the dehumidifier; ΔHmax refers to the smaller value of the ideal maximum enthalpy change between freshwater and moist air in the dehumidifier:
where ΔHmax,fw and ΔHmax,a are the ideal maximum enthalpy change of freshwater and moist air. To intuitively express the relative size of ideal maximum enthalpy change, heat capacity ratio, HCRd, is applied to represent the ratio of them:
ε = ΔH/ΔHmax
ΔHmax = min(ΔHmax,fw, ΔHmax,a)
HCRd = ΔHmax,fw/ΔHmax,a
It is worth pointing out that the minimum enthalpy change between air and water always occurs at the terminal location of the dehumidifier; thus, the parameters of the dehumidifier designed by the effectiveness method are always reasonable. However, the minimum enthalpy change of the humidifier does not always appear at the terminal location but at a certain position in the middle. In this case, the effectiveness method may lead to negative entropy production caused by the violation of the second law of thermodynamics [20,25]. Therefore, this paper adopts the enthalpy difference mapping method to design the required humidification equipment. At last, for the purpose of exposing the water production performance of the proposed system under a certain amount of energy input, the gained-output-ratio (GOR) is adopted to evaluate the energy utilization efficiency of the system, which can be described as:
where r denotes the latent heat of product freshwater.
GOR = mpwr/Qin
Therefore, the mathematical model of all the components has been established in detail, and now the MATLAB platform is employed to iteratively solve the governing equation for the critical parameters of the proposed solar-powered HDH desalination system for continuous water production.
4. Validation of the Components within the System
In order to validate the proposed desalination system, some key parameters for PV/T module, SC, and HDH devices are achieved at the typical operating case in the references. Under the same conditions of solar irradiation, inlet seawater temperature, and seawater mass flow rate, the results of PV/T calculated in this paper are compared with those calculated by Bu [21]. Table 4 shows the comparison results of PV/T power generation per unit area of PV panel and photoelectric conversion efficiency with relative errors of 0.864 and 4.91%, separately. To validate the SC with trough parabolic concentrator, the calculation result is compared with that in Chen’s study [22] under the same solar incident, inlet seawater temperature, seawater mass flow rate, and heat transfer area of the flow channel. It is obvious that the relative error for seawater outflow temperature is 0.146% in Table 5. Table 6 shows the comparison between the calculation results of the humidifier in this paper and those of Narayan [20] under the same minimum enthalpy difference, inlet seawater temperature, and air inflow temperature, and the relative errors of temperature for outlet air and brine are 3.94 and 0.61%, respectively. At last, for the validation of the dehumidifier, the comparison results between the current dehumidification configuration and that of He [16] are depicted in Table 7, and it is obvious that the relative errors of outlet air temperature and brine temperature are 0 and 3.98%, respectively. It is apparent that the relative errors for all parameters are within the acceptable range in the engineering field. Consequently, the proposed solar-driven desalination system can be considered accurate.
Table 4.
Validation of the PV/T module.
Table 5.
Validation of the SC.
Table 6.
Validation of the humidifier.
Table 7.
Validation of the dehumidifier.
5. Result and Analysis
Predicated on the mathematical model of the system, the relevant thermodynamic parameters and performance index for the proposed continuous working desalination system under different top temperatures (seawater temperature at the inlet of the humidifier), and incident solar radiation are obtained with MFRR varying from one to five, and the iterative calculation results are presented in forms of figures. It could be noted that the minimal enthalpy difference and effectiveness for designing humidifier and dehumidifier are 10 kJ/kg and 0.9, respectively; the terminal temperature difference between hot fluid outflow and cold fluid inflow is designated as 5 °C in the recuperator; the temperature loss of thermal storage tank is 2 °C; the environment temperature during the daytime and night are 35 and 25 °C, separately; the mass flow rate is specified as 0.5 kgs−1 for both seawater and freshwater.
5.1. Parameter Analysis of PV/T Module
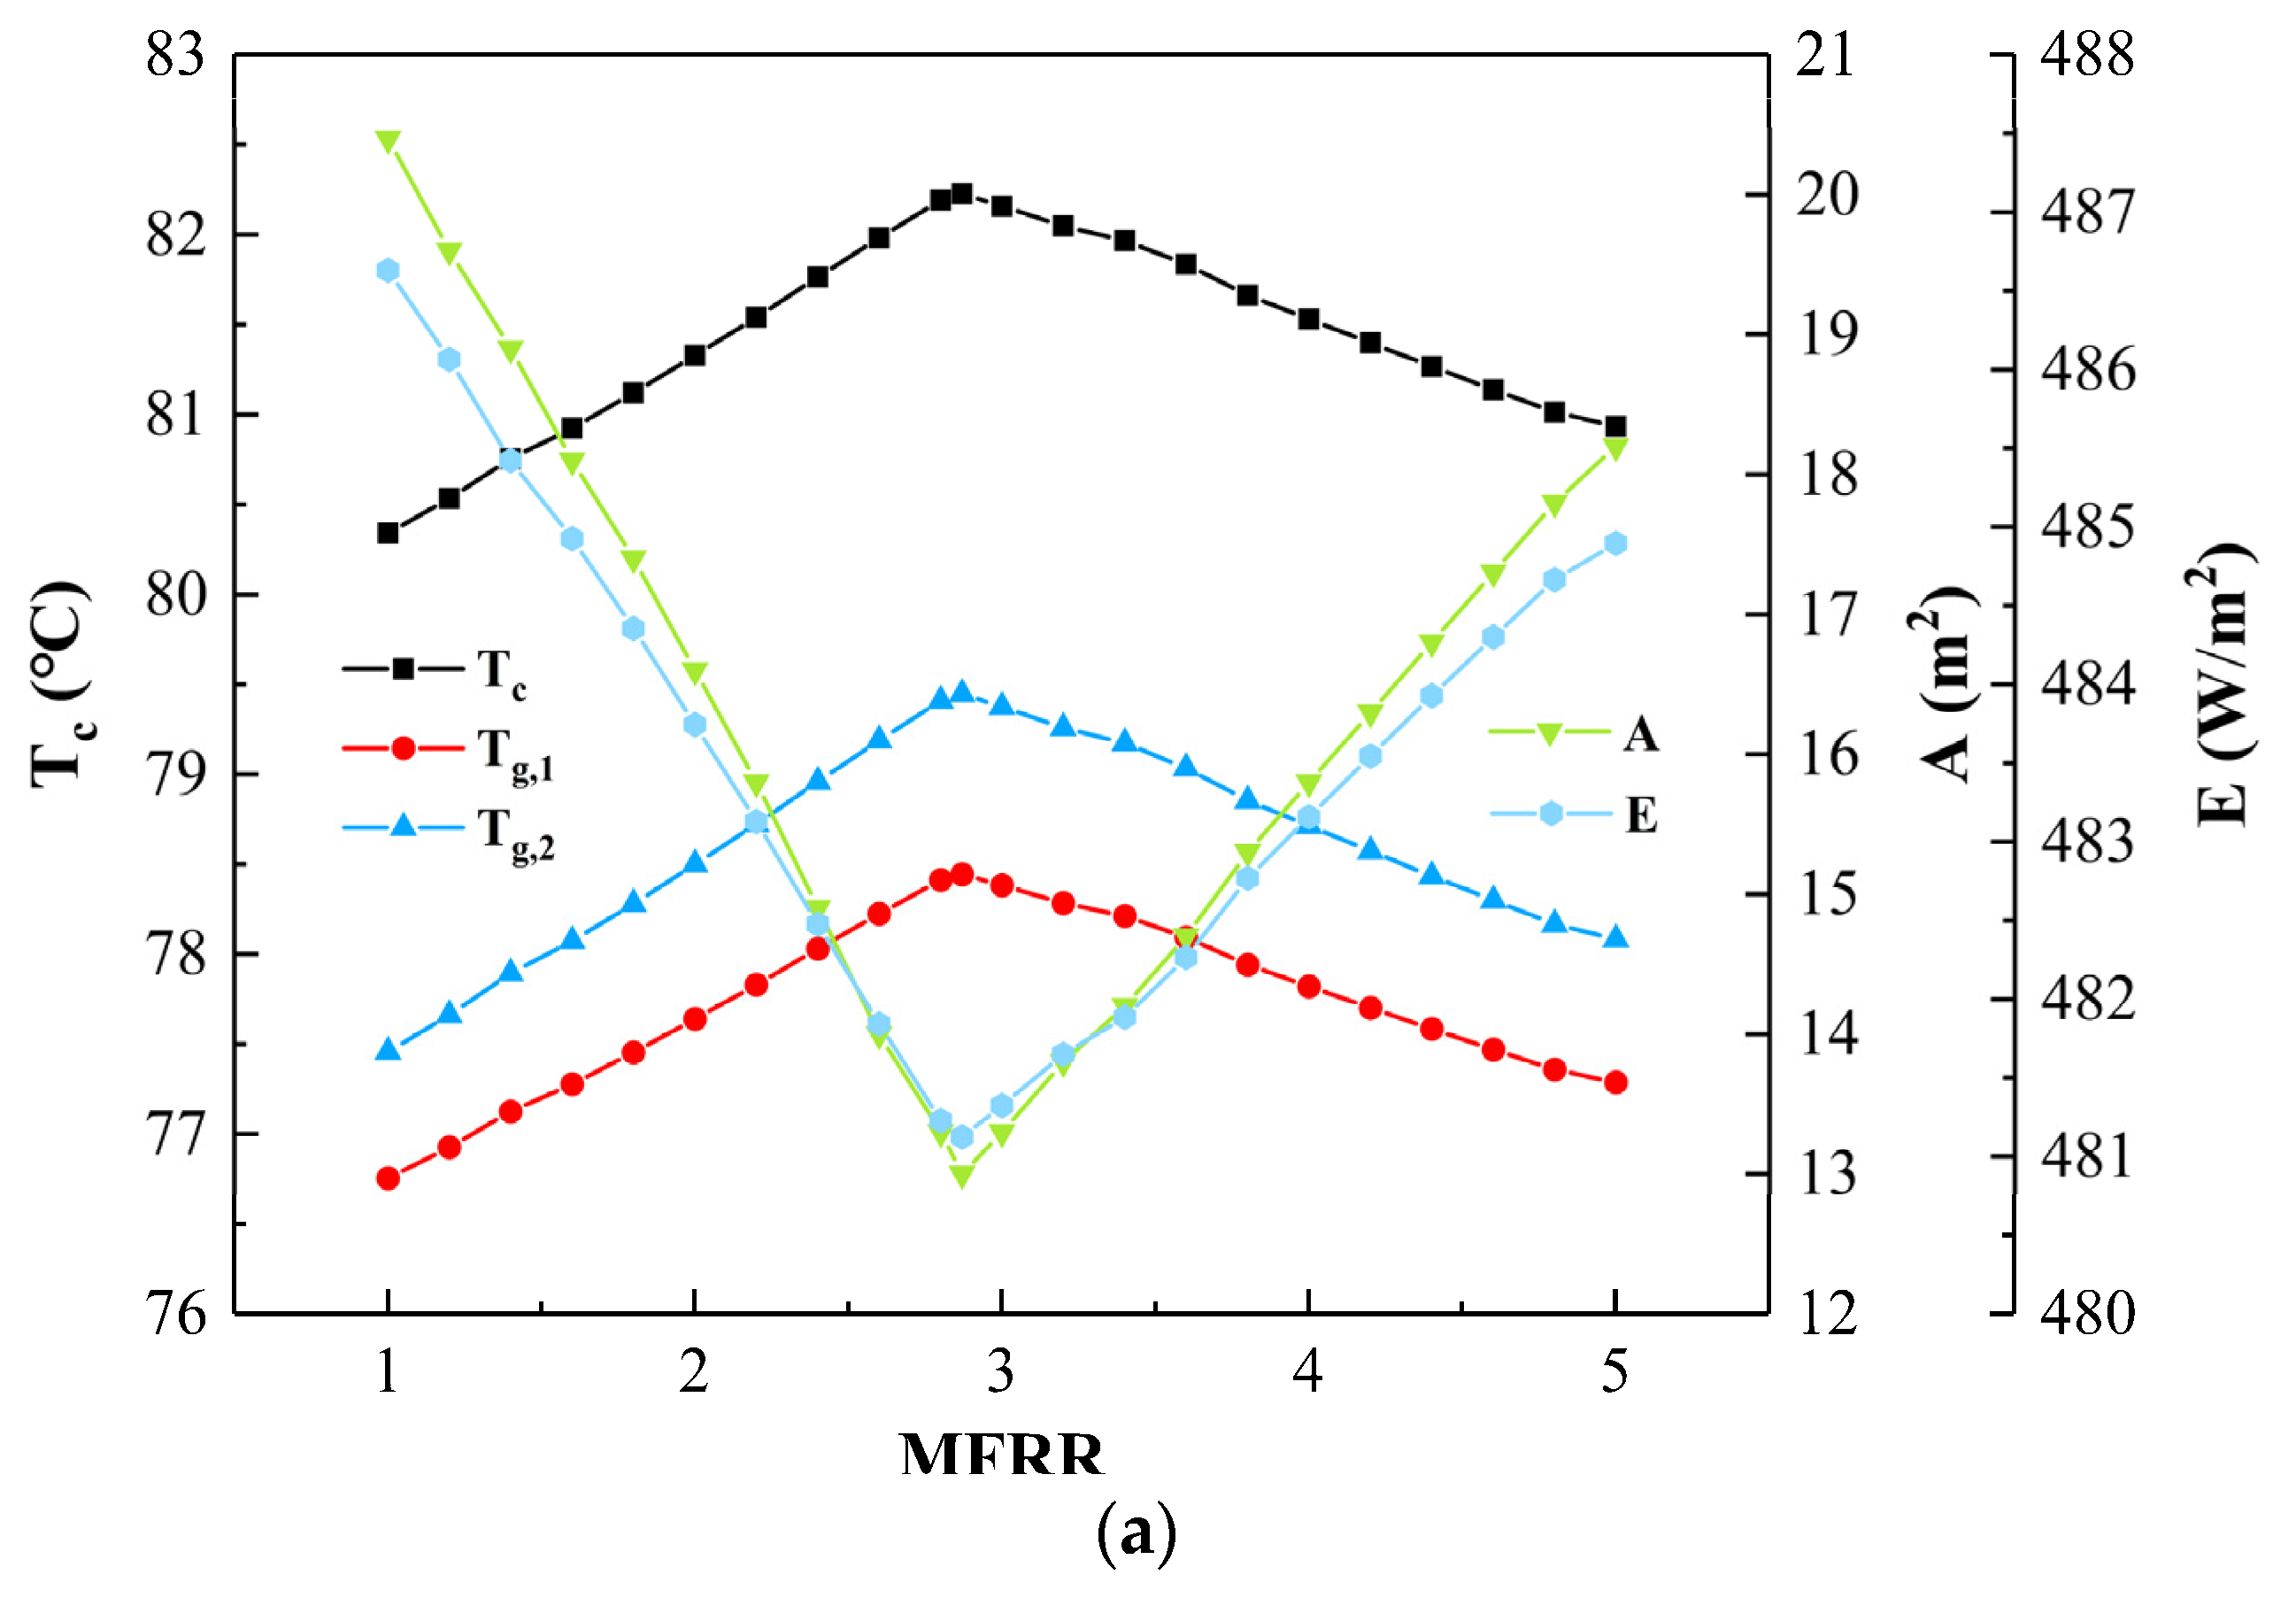
Figure 4a depicts the temperature variation of PV panel and glass cover, as well as the change of PV panel area and power generation (per unit PV panel area) under the typical operating condition, I = 1000 Wm−2, Tsw,2 = 60 °C, with the increase in MFRR. Apparently, the temperature of the glass cover and PV panel increases first and then decreases and reaches the maximum value when the mass flow rate ratio is equal to 2.87, MFRR = 2.87. However, the solar panel area and power generation have opposite trends that decrease first and then increase, and obtain the minimum value, Emin = 481.13 kWm−2 and Amin = 13 m2, in the case of MFRR = 2.87. Because of the internal heat conduction process between the glass cover and the PV panel, the temperature of the glass cover changes synchronously with that of the PV panel. The lower temperature of the glass cover, on the other hand, necessitates a bigger area of PV panel as support to heat seawater to the desired temperature, which explains their opposing variation pattern. Furthermore, as the temperature rises, the photoelectric conversion efficiency of PV panels decreases, resulting in a reduction in the amount of power produced. That is why the power generation reaches its minimum value at the peak value of the PV panel temperature.
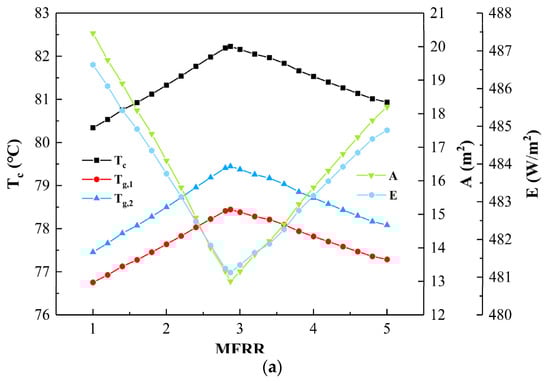
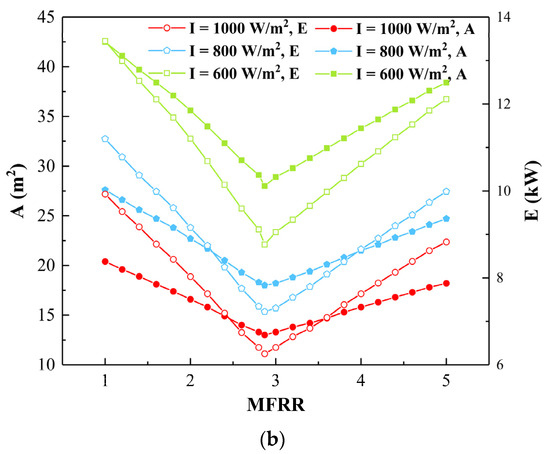
Figure 4.
Thermodynamic performance of PV/T module under different operation cases. (a) Parameter variation under typical operations; (b) Characteristics of the total power generation and PV panel area.
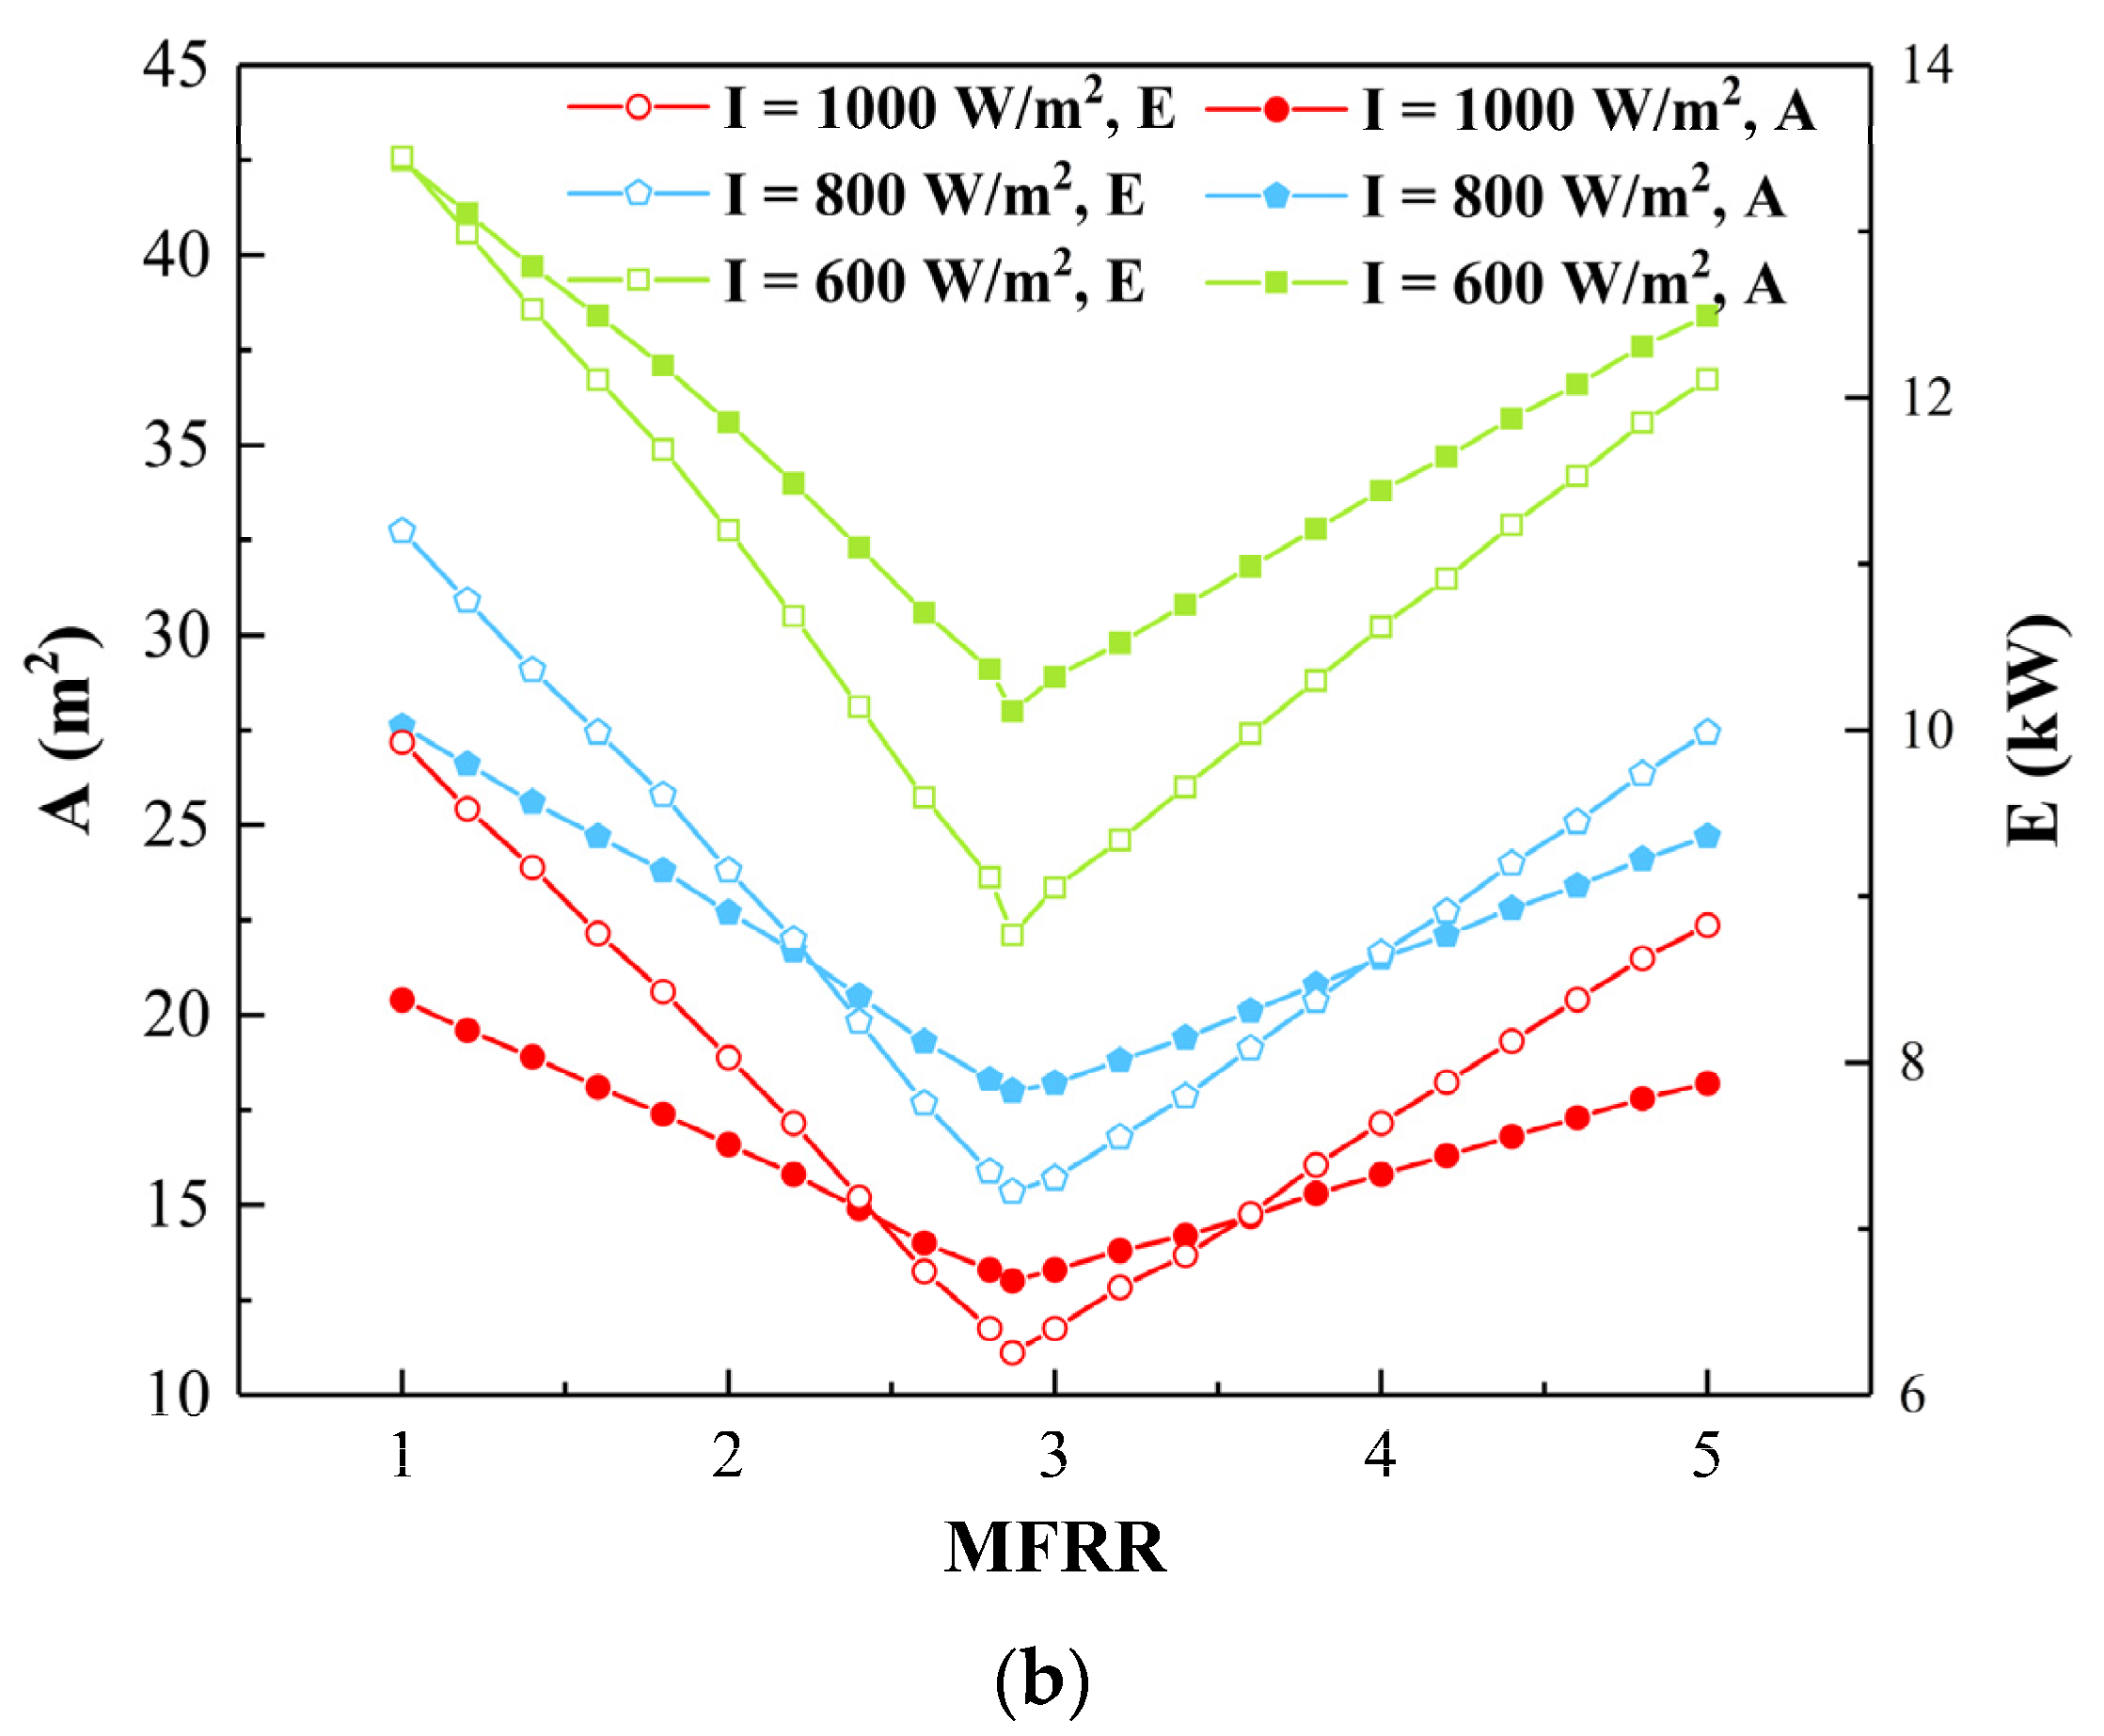
Under different solar irradiation conditions, Figure 4b depicts the variation of panel area and total power generation with respect to the MFRR. Due to the fixed top temperature (Tsw,2 = 60 °C), with the rise of MFRR, both the panel area and the total power generation decrease first and then increase, and reach their minimum value at the condition of MFRR = 2.87. Meanwhile, the enhancement of solar irradiation will increase the temperature of the PV panel, thus weakening the photoelectric conversion efficiency and, as a result, reducing the total power generation of the system. Higher incident solar radiation makes it easier for PV/T to heat seawater to a given top temperature, so the PV panel area decreases. Further, the minimum total power generation is 8.77, 7.22, and 6.25 kW, with solar irradiation increasing from 600 Wm−2 to 800 and 1000 Wm−2, decreasing by 17.67 and 28.73%, and the minimum PV panel area is 28, 18, and 13 m2, with decrement rates of 35.71 and 53.57%.
5.2. Parameter Analysis of HDH
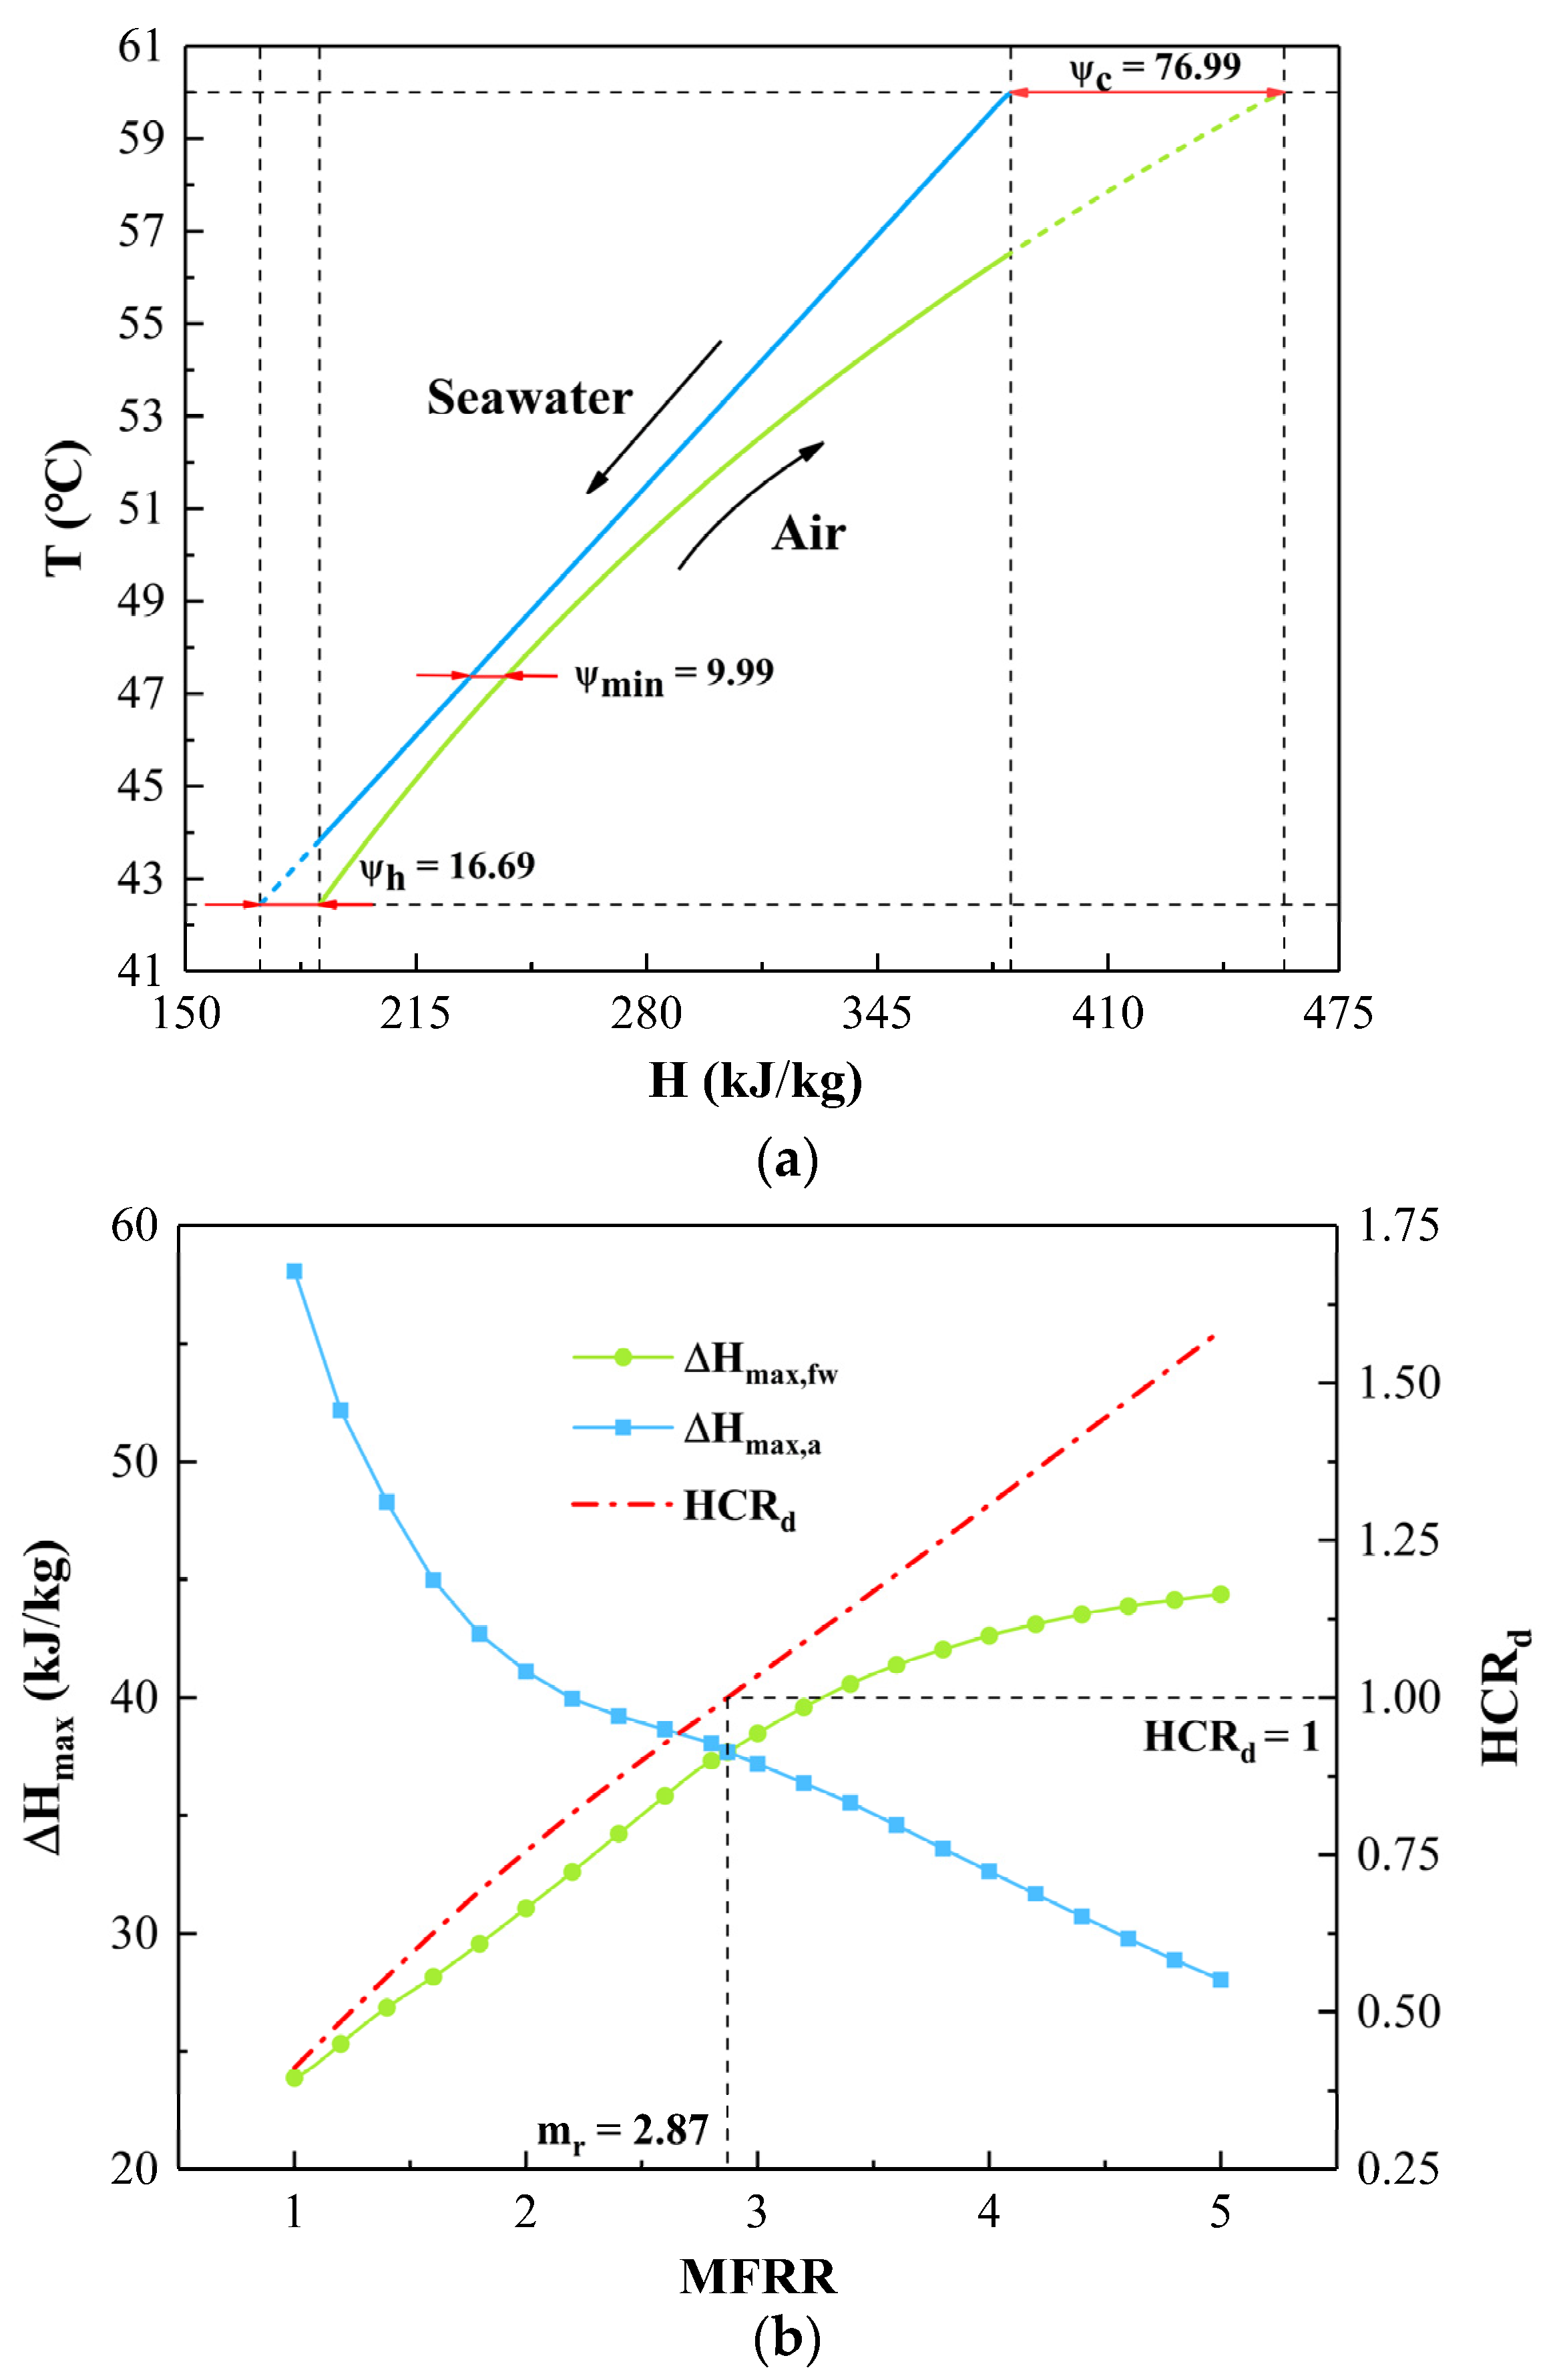
Figure 5a depicts the temperature versus enthalpy plot of seawater and moist air in the humidifier. The smallest enthalpy difference between moist air and seawater, obviously, does not occur on either side of the humidifier but rather in the middle. The dotted line illustrates the limiting situation in an ideal scenario with an unlimited heat transfer area, in which the exit temperature of one type of fluid reaches the entrance temperature of the other. Moreover, the highest ideal enthalpy difference between seawater and moist air in this situation is 16.69 kJkg−1 and 76.99 kJkg−1, which are both greater than the stipulated minimum enthalpy difference. Figure 5b describes the maximum ideal enthalpy change of fresh water and moist air, as well as the variation of HCRd in the dehumidifier. As previously stated, the performance of a dehumidifier is determined by the magnitude of the ideal enthalpy change of freshwater and moist air, which is expressed as the definition of HCRd. It can be found that the maximum ideal enthalpy difference of freshwater grows as the MFRR rises, but the maximum ideal enthalpy difference of moist air has the reverse pattern. Furthermore, in the case of MFRR = 2.87, where the heat capacity ratio is equal to the unit, HCRd = 1, and the maximum ideal enthalpy of freshwater is equal to that of moist air, the dehumidifier is recognized as being in the thermodynamic equilibrium.
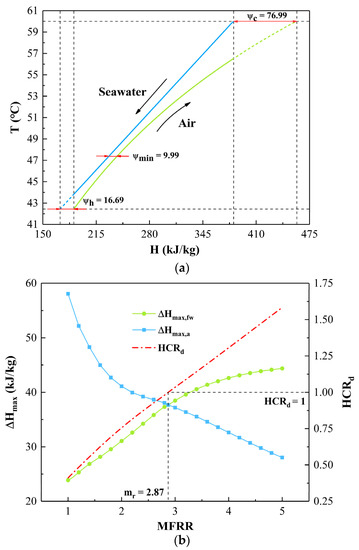
Figure 5.
The energetic performance of HDH system at the prescribed conditions of I = 1000 Wm−2 and Tsw,2 = 60 °C. (a) Enthalpy versus temperature diagram of working fluid within the humidifier; (b) Characteristics of ideal maximum enthalpy change and heat capacity ratio of the dehumidifier.
As previously explained, the structure of the proposed desalination system ensures the possibility of continuous water production. In the daytime mode, using PV/T and SC to heat the initial cold seawater, respectively, and simultaneously, the former is applied to reduce the temperature of the PV panel, as well as drive the integral desalination system, and the latter is stored in the thermal storage tank for night use. To facilitate the calculation process, assume that the top temperature in the case of night mode is 2 °C lower than that of day mode due to the heat loss of the thermal storage tank.
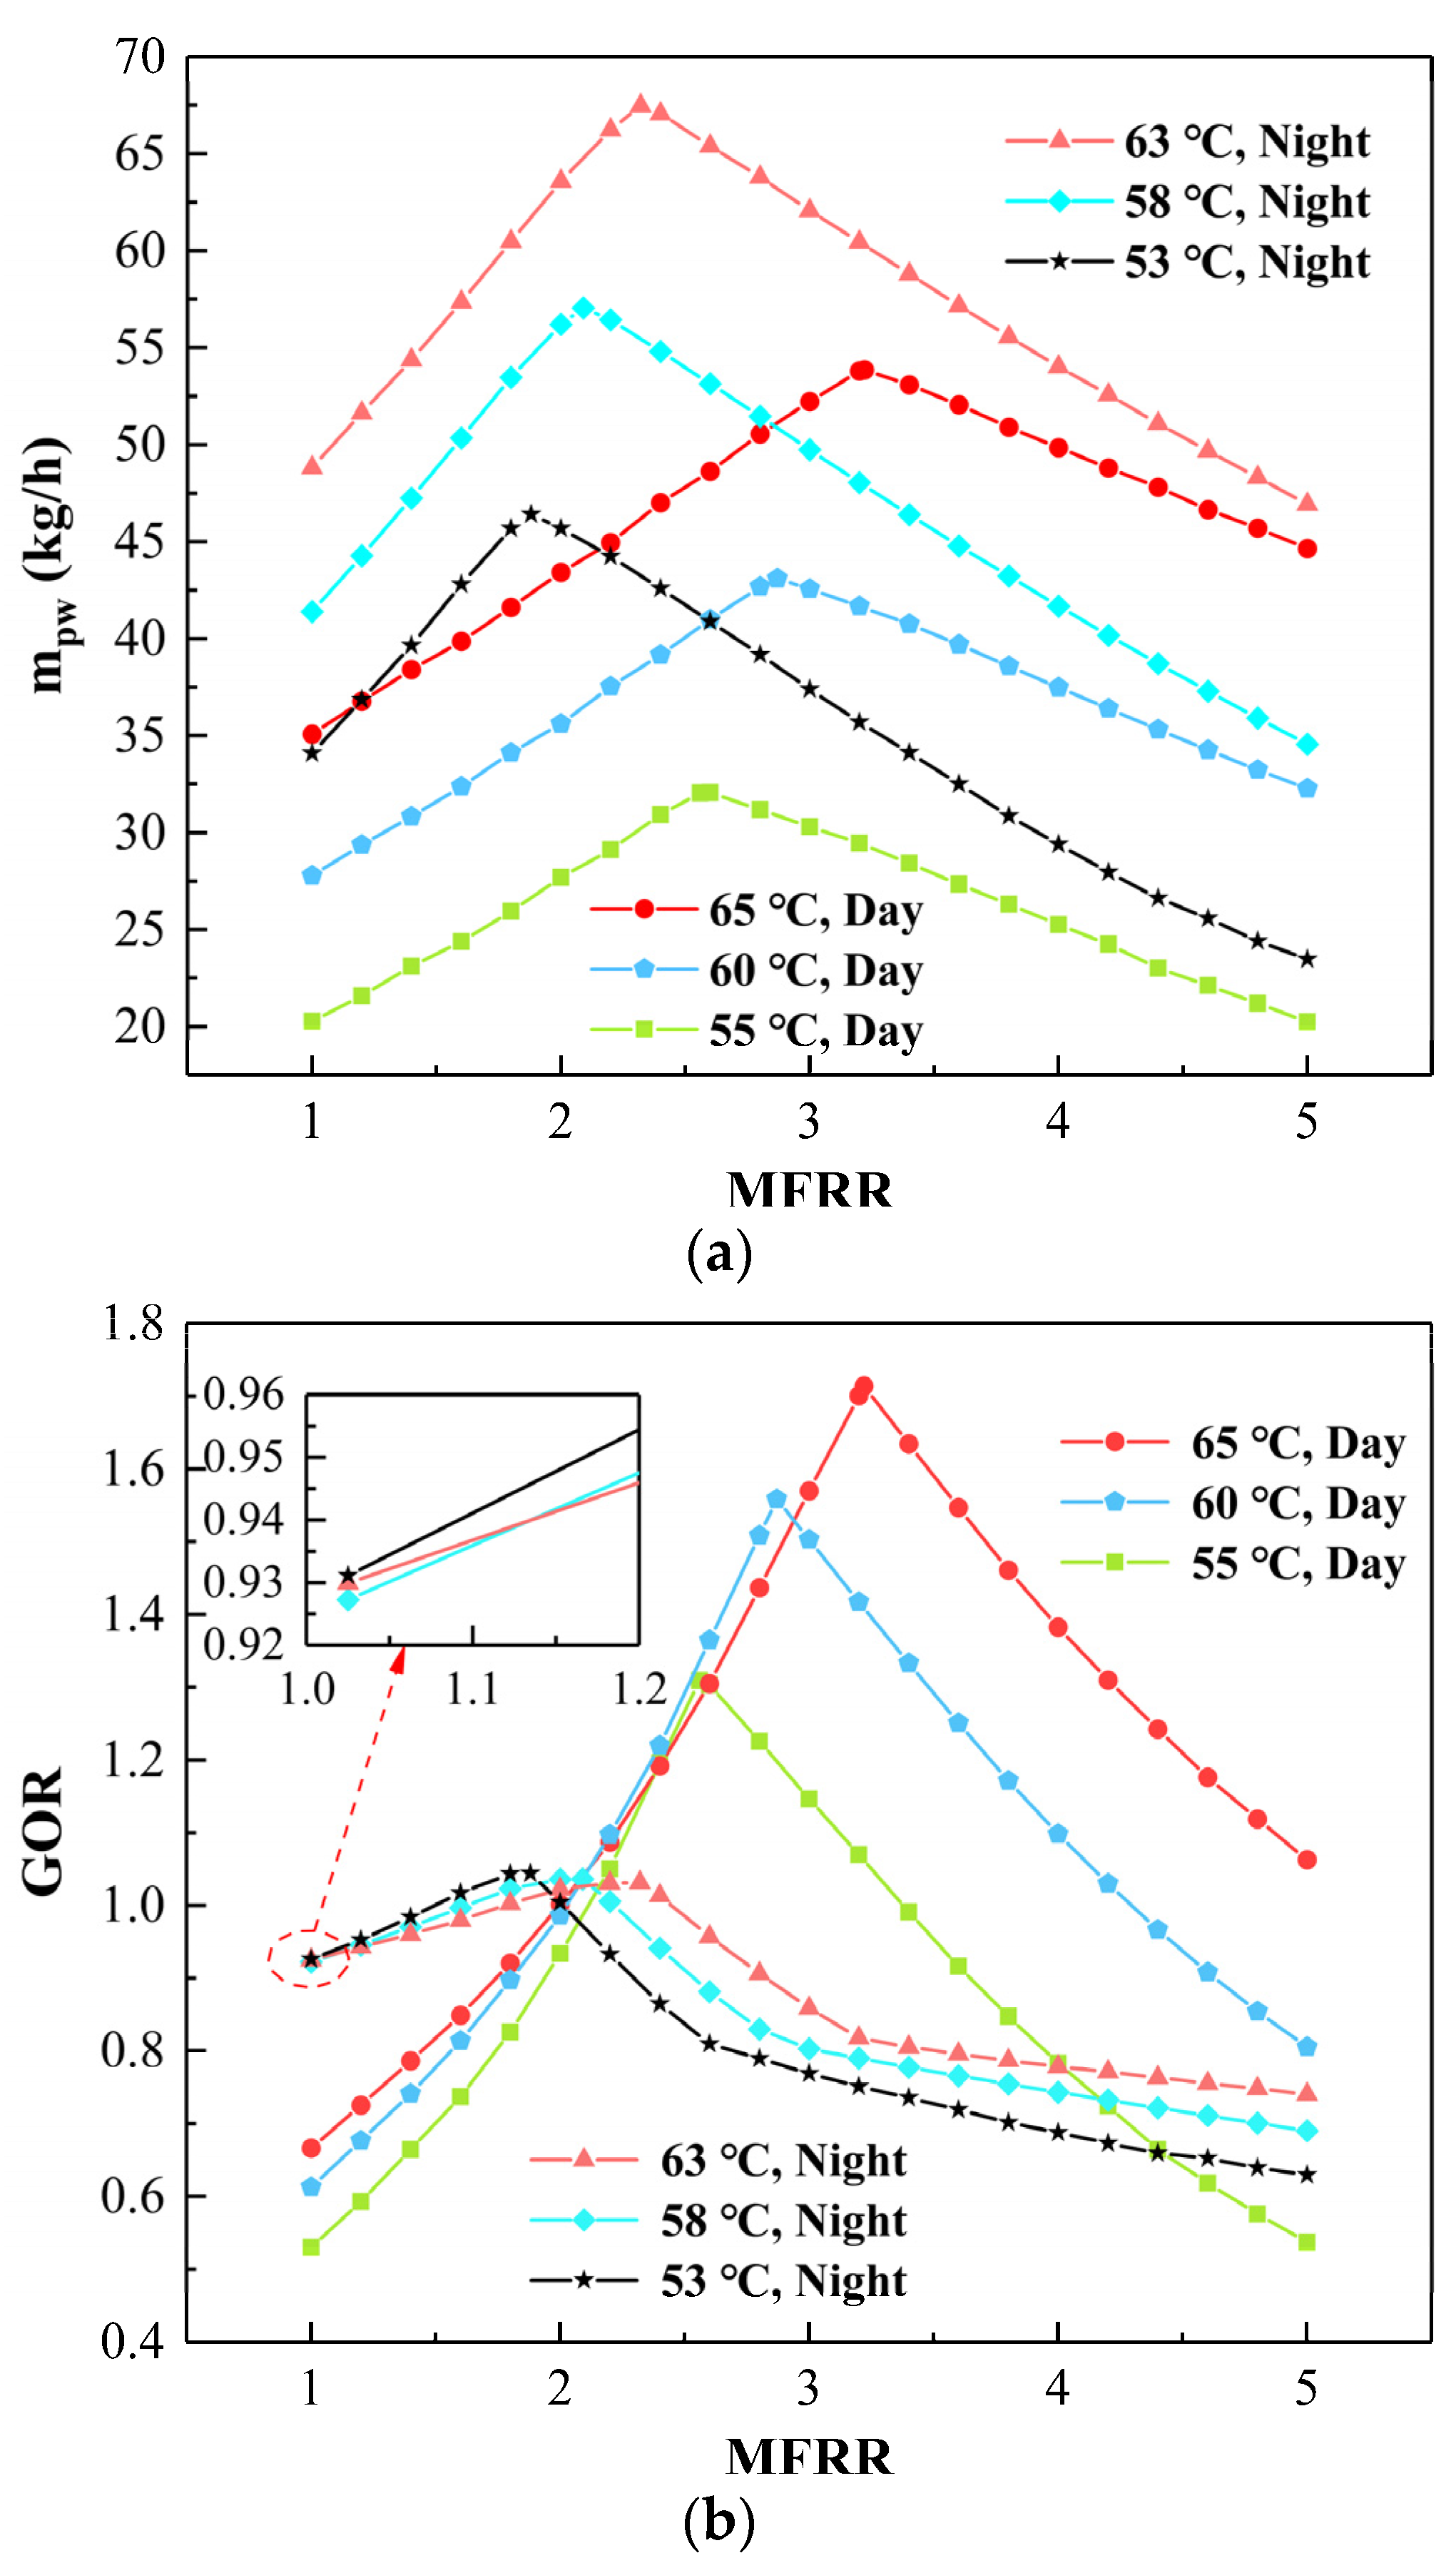
Figure 6 shows how the mass flow rate ratio affects water productivity and GOR under three different top temperature conditions (day mode). As depicted in Figure 6a, with the gradual rise of MFRR, the water production of the system increases at first and then decreases, reaching the peak value when the heat capacity ratio equals the unit. Therefore, the mass flow rate ratio corresponding to the thermodynamic balance state of the dehumidifier, HCRd = 1, represents the system’s optimal performance point. Moreover, for top temperatures ranging from 55 °C to 60 and 65 °C, the maximum daytime freshwater yield is 32.04, 43.1, and 53.85 kgh−-1, with growth rates of 34.5 and 68.06%; meanwhile, the highest value of water produced at night is 46.4, 57.05 and 67.47 kgh−1, increasing by 22.95 and 45.41%. Obviously, the system produces more freshwater in the night mode because the maximum water yield increases by 44.82, 32.37, and 25.29% from 55 °C to 60 and 65 °C, compared with that of the daytime. According to Figure 5b, GOR has a similar variation trend to the water productivity, reaching its peak value in the case of HCRd = 1. For top temperatures rising from 55 °C to 60 and 65 °C, the maximum value of GOR is 1.31, 1.56, and 1.71 by day, with growth rates of 19.08 and 30.53%, whereas the highest value of GOR at night is 1.044, 1.036 and 1.031, decreasing by 0.77 and 1.25%. With top temperature higher, the system in day mode tends to attain higher GOR at a larger MFRR; namely, the system performance enhances with the increase in top temperature. Despite the fact that the system generates more freshwater in the night mode at the same top temperature, the overall performance indicator, GOR, is lower than that of the daytime due to the increased energy input.
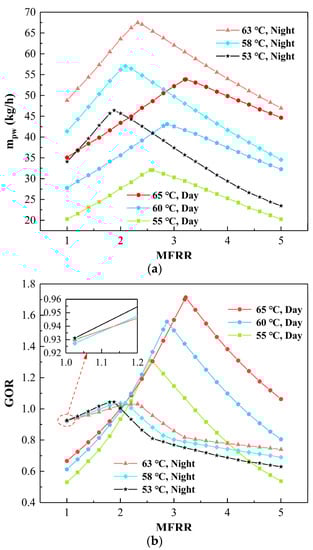
Figure 6.
Schematic diagram of water production and GOR under different operation cases. (a) Water production; (b) GOR.
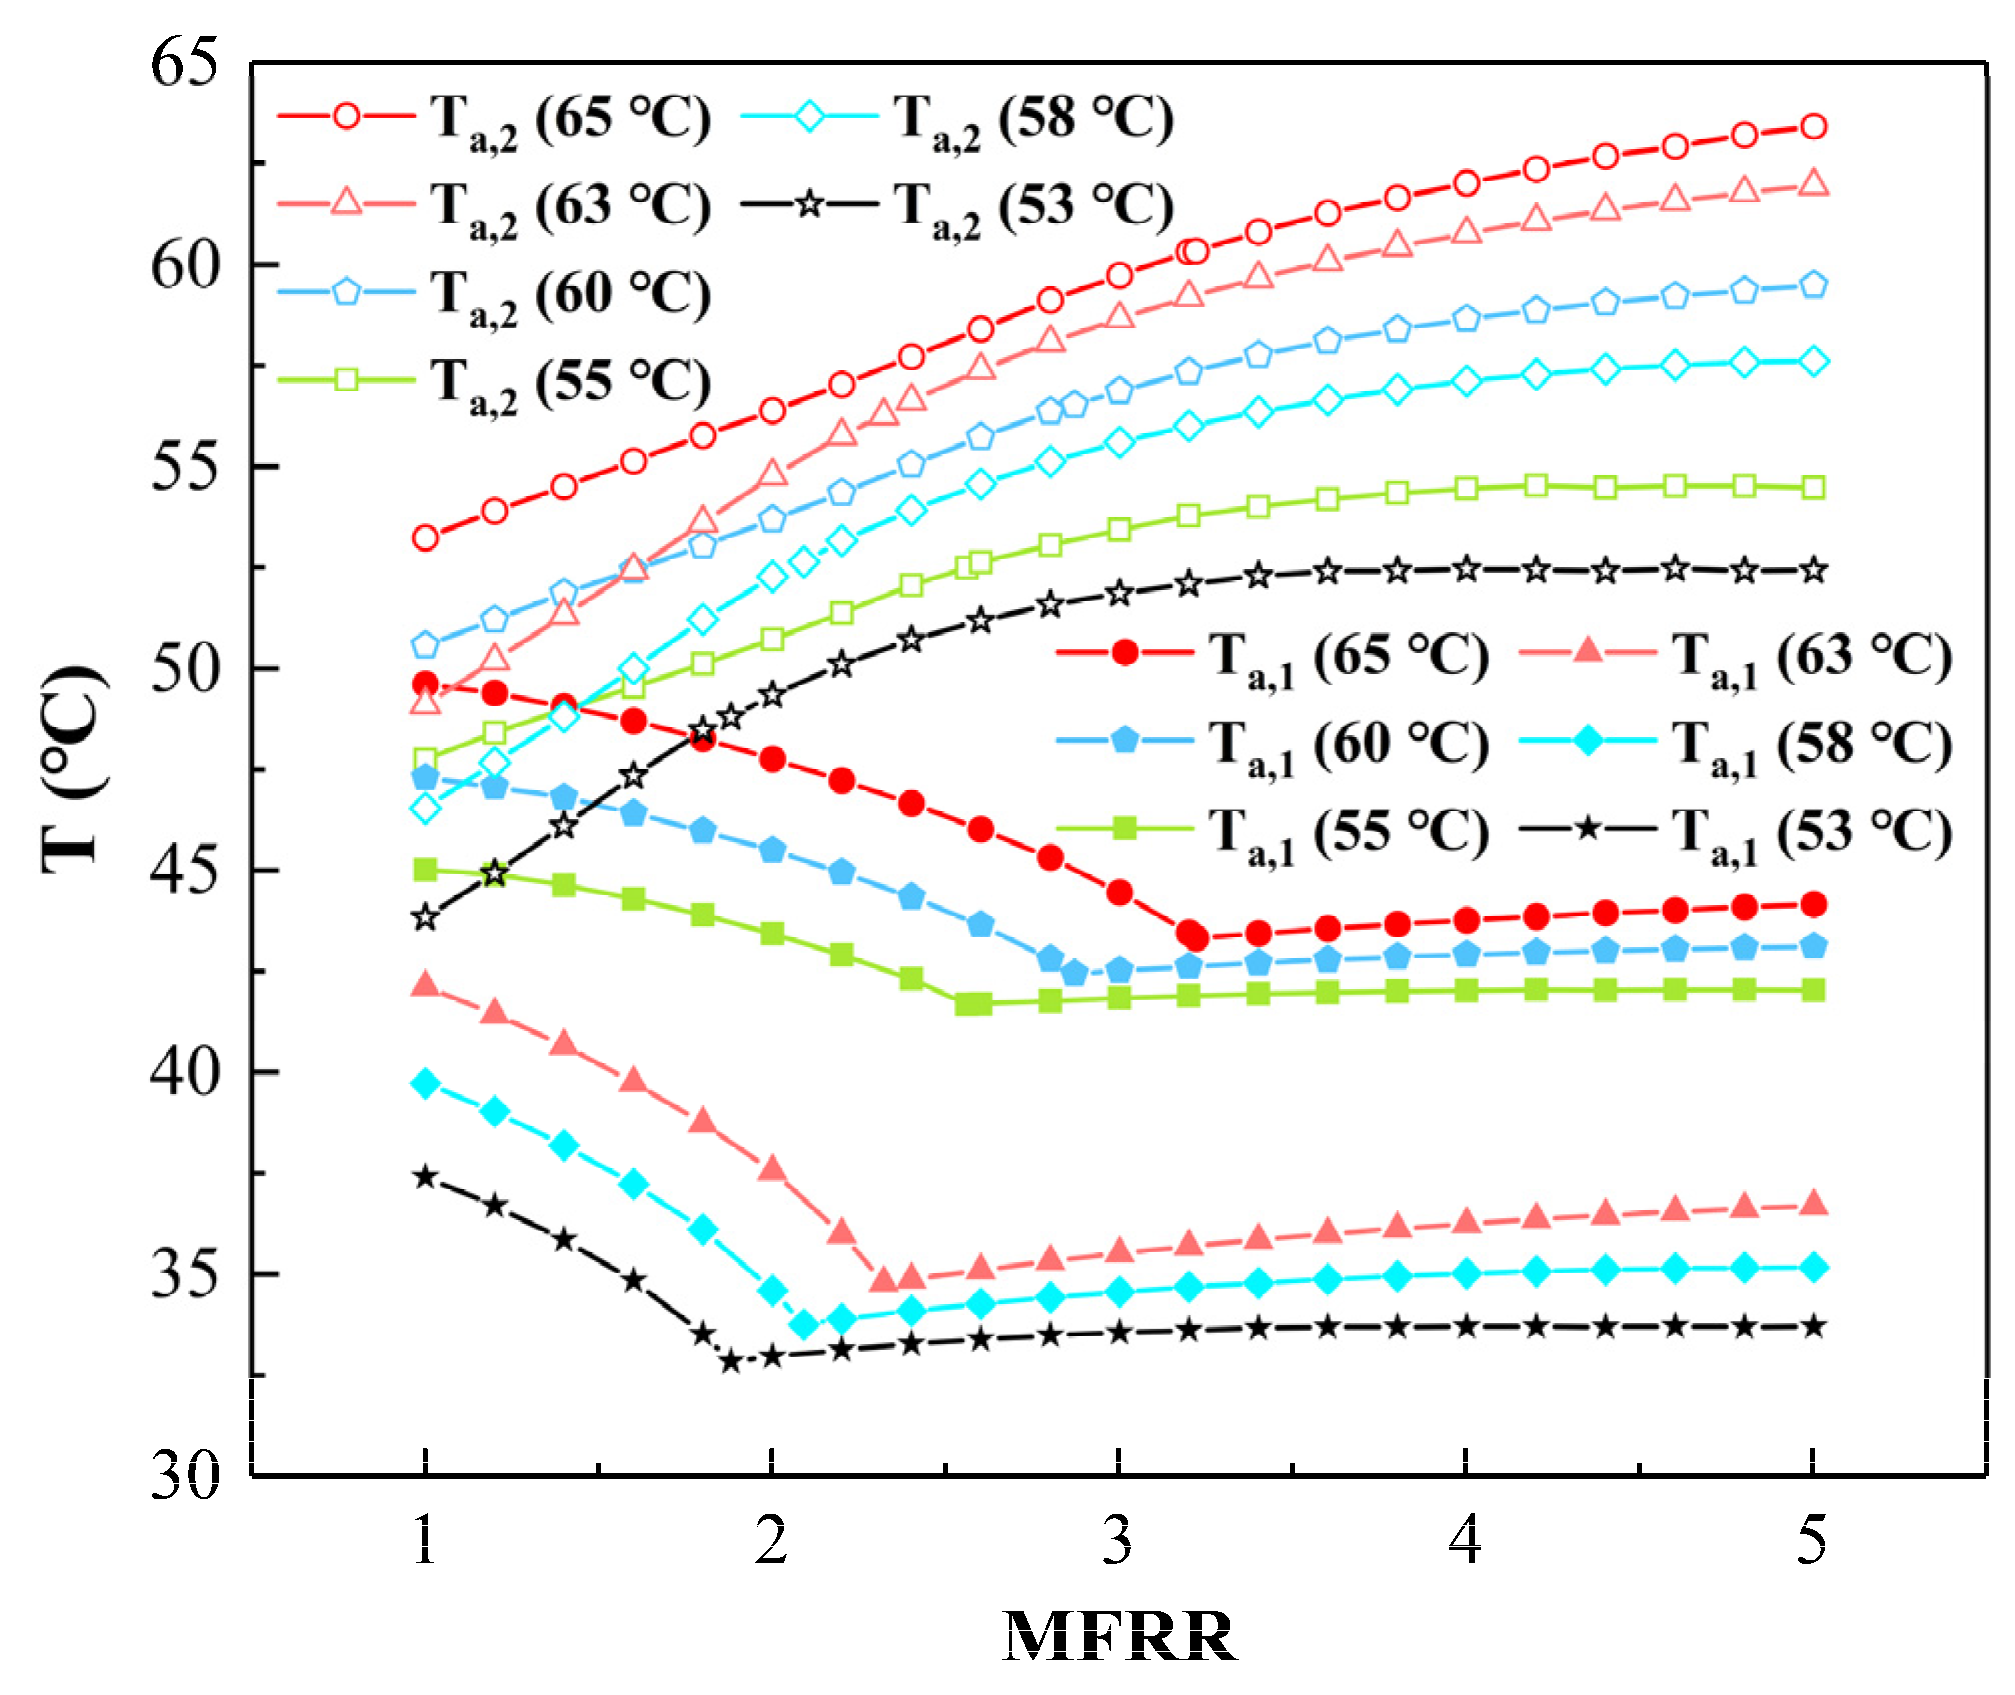
Figure 7 shows the variation of inlet and outlet air temperature of humidifier to mass flow rate ratio under different top temperature conditions. When the MFRR increases gradually, the air inflow temperature of the humidifier, Ta,1, decreases first, then increases, and finally stabilizes after reaching its minimum value at the balance condition point of the system. In addition, with the top temperature changing from 55 °C to 60 and 65 °C, the extremum of air inflow temperature is 41.68, 42.44 and 43.32 °C during the day, increasing by 1.82 and 3.93%, meanwhile, the lowest value of inlet air temperature at night is 32.84, 33.75 and 34.79 °C, with growth rates of 2.77 and 5.94%. As for the air outflow temperature of the humidifier, Ta,2, it keeps increasing and tends to be stable with the rise of MFRR. It is obvious that the air outflow temperature at the top temperature of 60 and 65 °C in the night mode (actually, 58 and 63 °C due to 2 °C heat loss of thermal storage tank) is lower than that of air outflow at the top temperature of 55 and 60 °C in the daytime mode when the MFRR is relatively small. The reason is that the air outflow temperature of the dehumidifier running in the night mode is lower than that of daytime under the same top temperature condition; hence, the heat capacity of seawater in the humidifier is not enough in the case of a small mass flow rate ratio. Further observation of Figure 7 reveals that the mass flow ratio corresponding to the balance condition is the “turning point” where the variation of air temperature converts from a state of apparent change to a stable development stage.
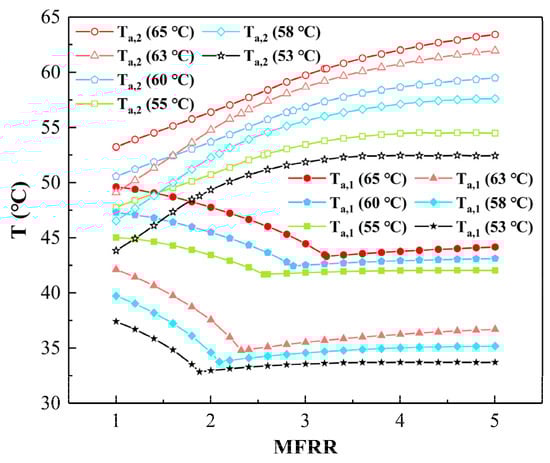
Figure 7.
Temperature variation of air under different operation cases.
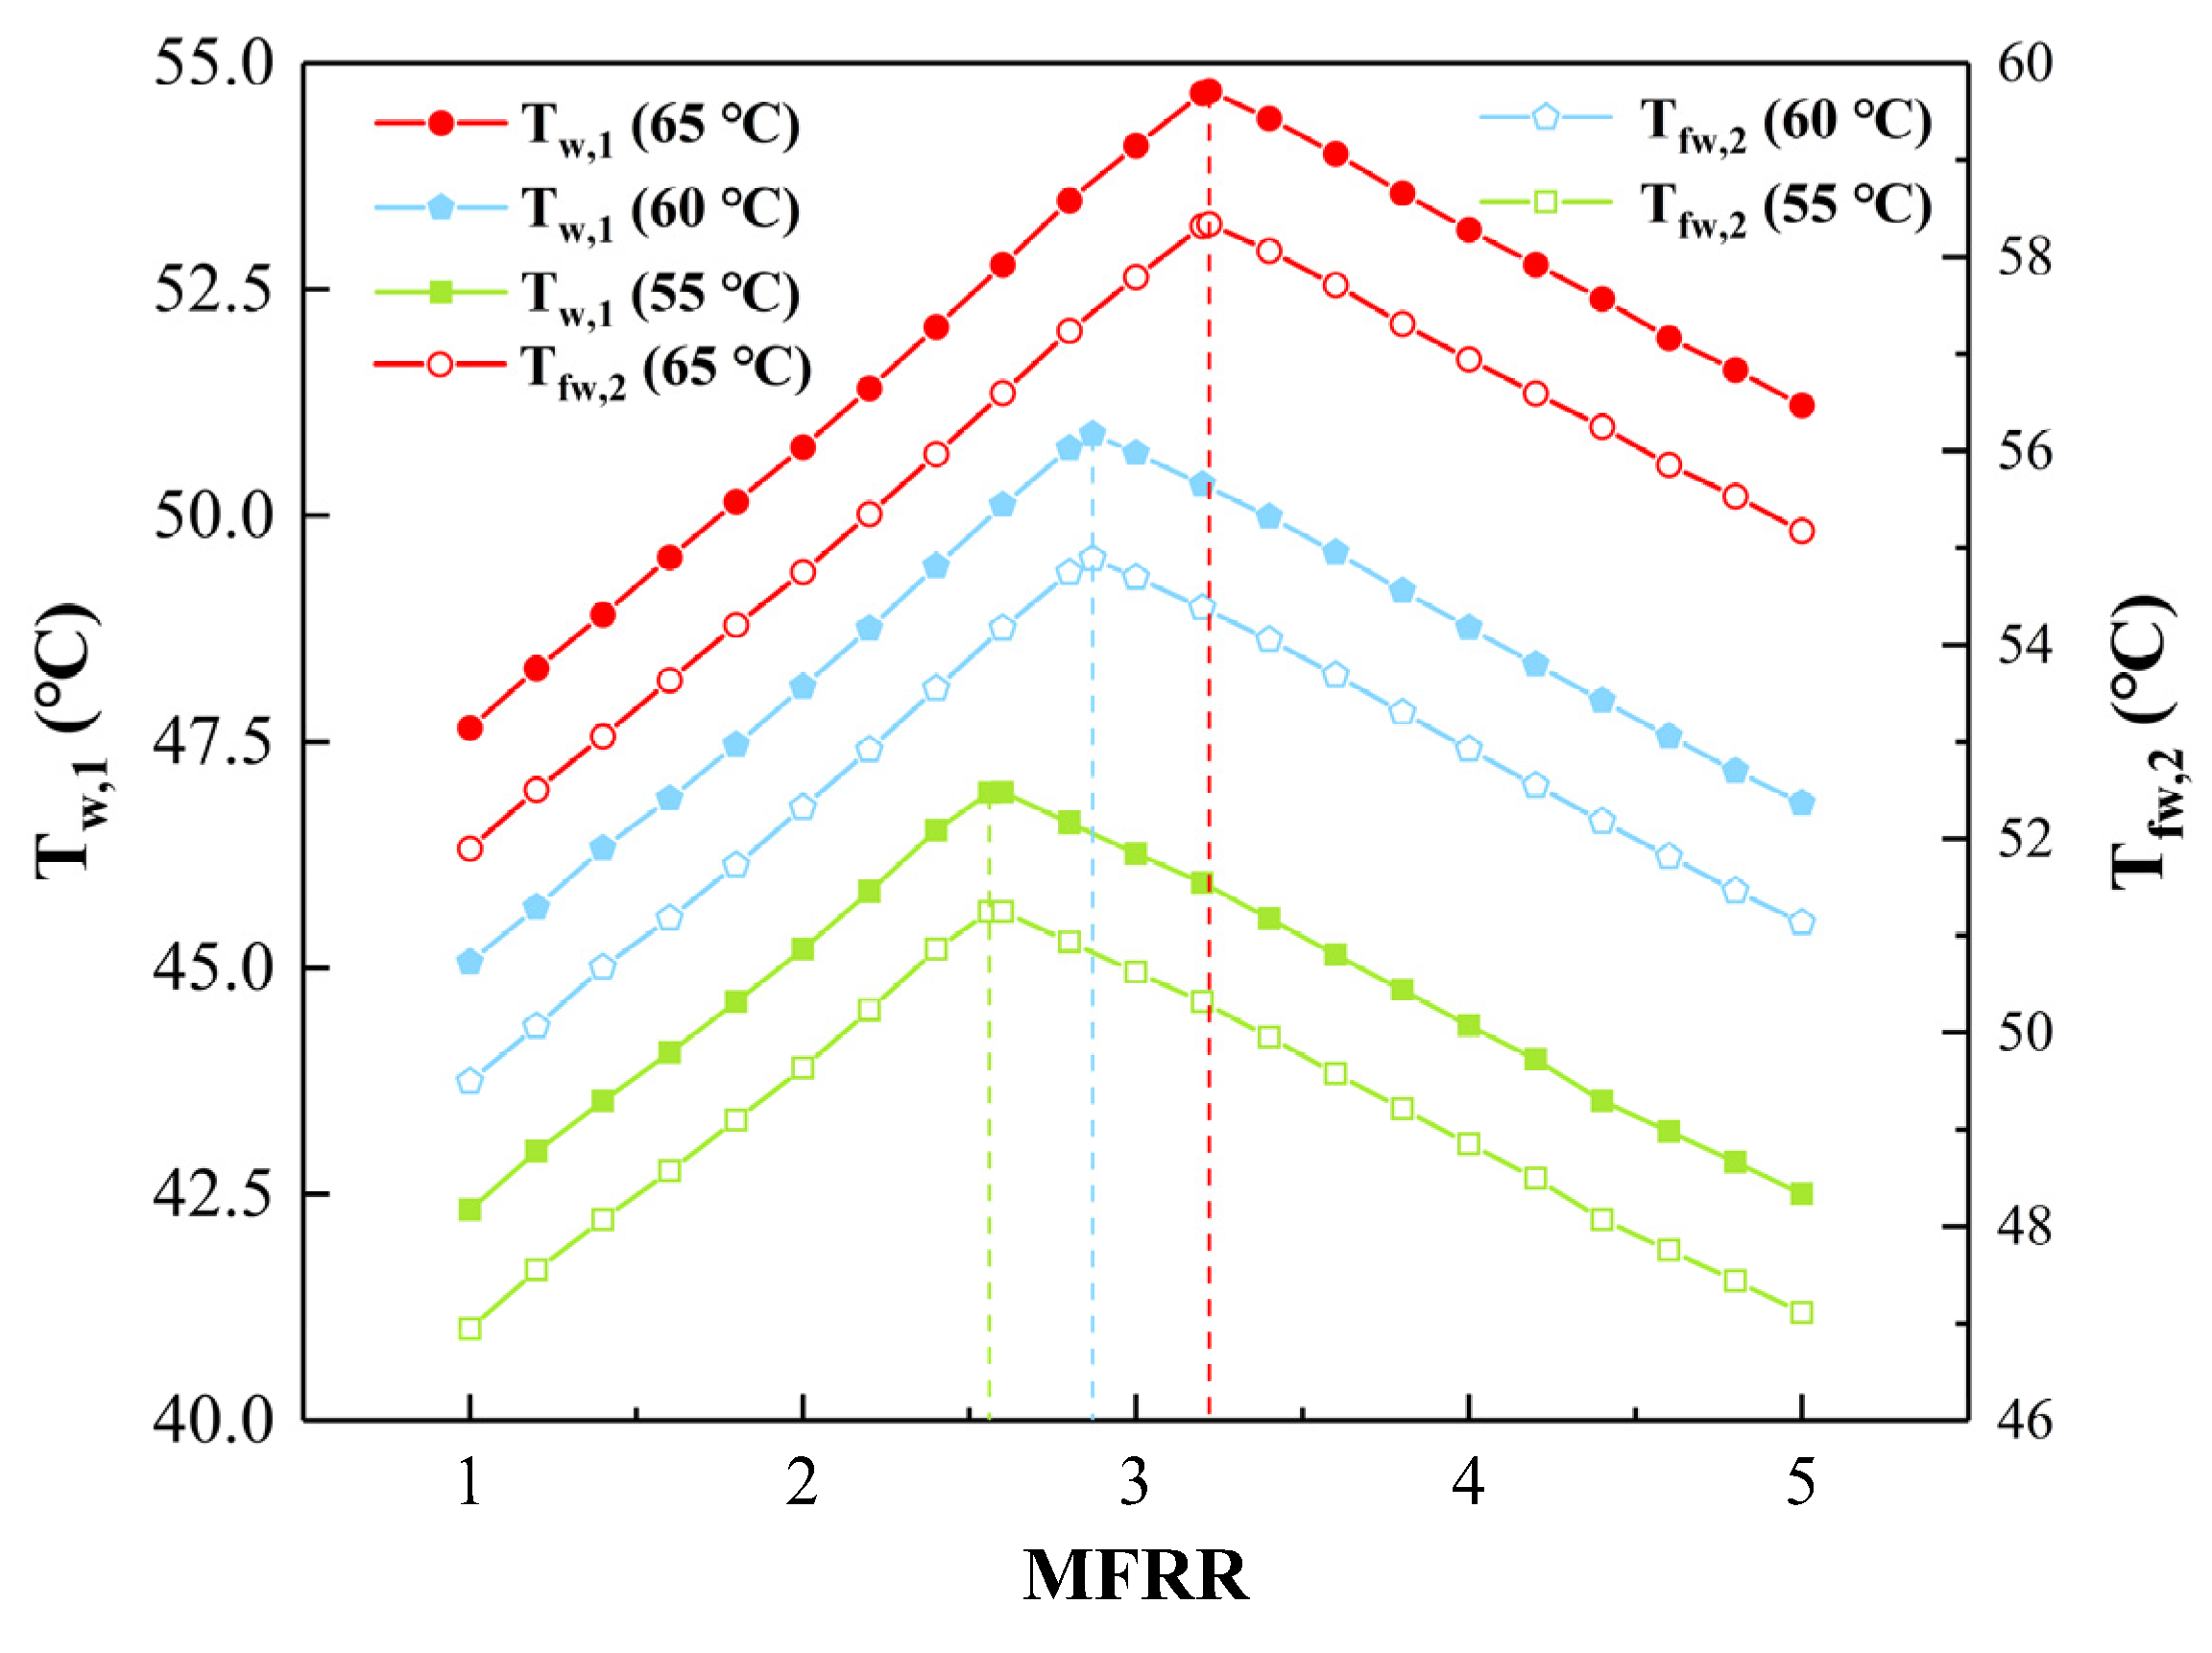
With the variation of mass flow rate and top temperature, Figure 8 describes the change of seawater temperature at the inlet of PV/T, Tw,1, and freshwater outflow temperature of the dehumidifier, Tfw,2. Obviously, both of them rise at first and then drop, eventually reaching the maximum value at the balance condition point. With the top temperature varying from 55 °C to 60 and 65 °C, the peak value of the seawater inflow temperature of PV/T grows from 46.94 °C to 50.9 and 54.69 °C, increasing by 8.43 and 16.51%, and the extremum of freshwater temperature at the outlet of dehumidifier rises from 51.25 °C to 54.89 and 58.34 °C, with growth rates of 7.1 and 13.83%, respectively.
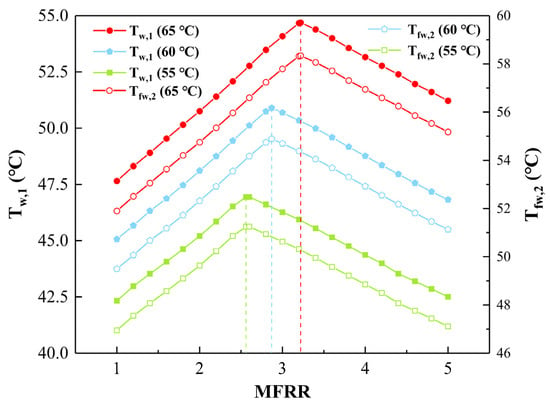
Figure 8.
Temperature variation in seawater inflow of PV/T and freshwater outflow of dehumidifier under different operation cases.
5.3. Energy Analysis of Integral System
The dependence of thermodynamic parameters on mass flow rate ratio and top temperature should be attributed to the change of heat and mass transfer characteristics between seawater/freshwater and air. Generally speaking, at the same top temperature, the increase in MFRR will enhance the performance of the HDH desalination system before the optimal operation situation since the rise in air temperature and humidity can compensate for the performance degradation caused by a decline in air mass flow rate. However, this compensation capability is also limited. When the value of MFRR exceeds the balance condition point, the freshwater productivity of the system will continuously reduce due to the influence of too little air. Furthermore, we can promote the compensation capability of the system by lifting the seawater inflow temperature of the humidifier.
Specifically, when the value of HCRd is less than one, HCRd < 1, the maximum ideal enthalpy change on the air side of the dehumidifier is larger than that of the freshwater side. Hence, the temperature and humidity of the air play a leading role in the system performance, and the GOR continues to rise with the increase in MFRR. Meanwhile, when the value of HCRd is larger than one, HCRd > 1, the maximum ideal enthalpy change of the air side is lower than that of the freshwater side; thus, the performance of the system gradually degrades due to a small value of air mass flow rate, mda. At the same top temperature, the increase in air temperature and humidity during the humidification process can be fully guaranteed in any case of mass flow rate ratio. Therefore, the air outflow temperature of the humidifier, Ta,2, rises continuously until the top temperature and heat exchange area limit its further development. In the dehumidifier, the freshwater yield comes from the condensation process of water vapor carried by moist air; thus the enhancement of system performance is inevitably accompanied by the drop in air outflow temperature, Ta,1, and the rise in temperature of water production. When the desalination system operates at night, lower freshwater inflow temperature of the dehumidifier, Tfw,1, due to a lower ambient temperature enhances the dehumidification process of moist air, hence significantly improving the water production of the system. However, the air temperature at the outlet of the dehumidifier is also less than that of the daytime mode, which burdens the humidifier as well as impairs the compensation capability of the system; thus, the MFRR corresponding to the best performance point of the system is smaller than it during the day. In addition, when the system works in daytime mode, the recuperator further correlates the variation trend of freshwater outflow temperature of dehumidifier, Tfw,2, with the seawater temperature at the inlet of PV/T, Tw,1. Further, the PV/T with a lower value of Tw,1 inevitably requires a larger PV panel area to meet the prescribed seawater outflow temperature, which causes the variation of parameters in the PV/T module.
5.4. Comparison between Present System and Different HDH Systems
Considering the system performance parameters, GOR, and water productivity, this section compares the performance of the current system with that of other types of HDH systems, and the results are displayed in Table 8. It is obvious that the proposed system outperforms those in prior research, demonstrating the feasibility and superiority of the present continuous water-producing HDH system supported by thermal energy storage.
Table 8.
The performance comparison between other HDH systems and current study.
6. Conclusions
Based on the aforementioned results, the following conclusions and salient features can be obtained:
- (1)
- With a higher top temperature, the performance of the system in daytime mode enhances with a higher GOR obtained at a larger MFRR. Moreover, the system has a higher water production in night mode because the lower ambient temperature improves the dehumidification process of moist air. However, despite larger water productivity, the GOR in night mode is lower than that of the daytime due to higher energy input.
- (2)
- The MFRR corresponding to the balance condition of the system, HCRd = 1, represents the upper limit of compensation capability and the turning point of air temperature. The former denotes the increase in air temperature, and humidity can compensate for the performance degradation of the system due to a decline in air mass flow rate until the effect of too litter air flow is not negligible. For the latter, the variation of air temperature converts from a state of apparent change to a stable development stage at this point.
- (3)
- Compared with other types of HDH systems, the proposed system outperforms those in prior research, which demonstrates the feasibility and superiority of the present continuous water-producing HDH system supported by thermal energy storage.
- (4)
- With different top temperatures rising from 55 °C to 60 and 65 °C, the maximum value of GOR is 1.31, 1.56, and 1.71 by day, while the highest value of GOR at night is 1.044, 1.036, and 1.031; meanwhile, the corresponding maximum daytime water productivity is 32.04, 43.1 and 53.85 kgh−1, and the highest value of water produced at night is 46.4, 57.05 and 67.47 kgh−1.
- (5)
- The total power generation of PV/T reaches its minimum value in the case of HCRd = 1. With solar incident irradiation increasing from 600 Wm−2 to 800 and 1000 Wm−2, the minimal value of the total power generation is 8.77, 7.22,S and 6.25 kW, decreasing by 17.67 and 28.73%.
Author Contributions
Conceptualization, W.H.; methodology, W.H. and Y.L.; software, W.H. and Y.L.; validation, Y.L.; formal analysis, Y.L.; resources, W.H.; data curation, X.Z. and H.A.; writing—Original draft preparation, Y.L.; writing—Review and editing, W.H., D.H. and J.C.; visualization, Y.L.; funding acquisition, W.H. and Y.L. All authors have read and agreed to the published version of the manuscript.
Funding
This research was funded by Jiangsu Provincial Key Research and Development Program (Grant No. BE2019088), Natural Science Foundation of Jiangsu Province (Grant No. BK20201294) and Postgraduate Research & Practice Innovation Program of NUAA (Grant No. xcxjh20210215).
Data Availability Statement
Not applicable.
Conflicts of Interest
The authors declare no conflict of interest.
Nomenclature
| Acronyms | |
| CAOW | closed-air open-water |
| GOR | gained-output-ratio |
| HCR | heat capacity ratio |
| HDH | humidification and dehumidification |
| MFRR | liquid-gas mass flow rate ratio |
| PV | photovoltaic |
| PV/T | photovoltaic/thermal |
| SC | solar collector |
| Roman symbols | |
| a | specific area (m2m−3) |
| A | heat transfer surface area (m2) |
| b | channel height of the plate heat exchangers (mm) |
| C | concentration ratio |
| Cp | specific heat capacity (kJkg−1K−1) |
| ef | height of flow channel (m) |
| E | electric energy production (Wm−2) |
| h | specific enthalpy (kJkg−1) |
| r | latent heat (kJkg−1) |
| H | height (m) |
| ΔH | enthalpy change (kJkg−1) |
| I | incident solar radiation (Wm−2) |
| k | mass transfer coefficient (kgm−2s−1) |
| K | heat transfer coefficient (kWm−1K−1) |
| L | length of photovoltaic panel (m) |
| m | mass flow rate (kgs−1) |
| N | plate number of recuperator |
| Nu | Nusselt number |
| Q | heat load (kW) |
| Pr | Prandtl number |
| r | latent heat (kJkg−1) |
| Re | Reynolds number |
| Sh | heat transfer area of solar collector |
| ΔTm | log mean temperature difference (K) |
| T | temperature (°C) |
| W | channel width (m) |
| Greek letters | |
| α | absorptivity |
| β | plate chevron angle (°) |
| γ | attenuation coefficient |
| δ | thickness (mm) |
| ε | effectiveness of dehumidifier; emissivity |
| η | efficiency (%) |
| λ | thermal conductivity (Wm−1K−1) |
| τ | transmissivity |
| ω | humidity ratio (kgkg−1) |
| Subscripts | |
| a | air |
| amb | ambient |
| atm | atmospheric |
| b | brine |
| c | photovoltaic panel; cold |
| d | dehumidifier |
| da | dry air |
| D | daytime |
| E | EVA |
| f | working fluid |
| fw | freshwater |
| g | glass cover of solar collector |
| g1 | upper glass cover |
| g2 | lower glass cover |
| g3 | seawater flow channel |
| h | hot; humidifier |
| i | inlet; insulating layer |
| m | main |
| max | maximum |
| min | minimum |
| N | night |
| Nsw | seawater for night use |
| o | outlet |
| p | plate |
| pw | product water |
| re | recuperator |
| ref | reference |
| sw | seawater |
References
- Wu, G. Thermophysical Problem Researches on Solar Desalination Based on Humidifiication-Dehumidificaiton Process. Ph.D. Thesis, Beijing Institute of Technology, Beijing, China, 2017. [Google Scholar]
- Xu, H. Theoretical and Experimental Study on Productivity Enhancement of Solar Assisted Humidification Dehumidification Desalination System. Ph.D. Thesis, Shanghai Jiao Tong University, Shangai, China, 2020. [Google Scholar]
- Shoeibi, S.; Kargarsharifabad, H.; Rahbar, N.; Khosravi, G.; Sharifpur, M. An integrated solar desalination with evacuated tube heat pipe solar collector and new wind ventilator external condenser. Sustain. Energy Technol. Assess. 2022, 50, 101857. [Google Scholar] [CrossRef]
- Shoeibi, S. Numerical Analysis of Optimizing a Heat Sink and Nanofluid Concentration Used in a Thermoelectric Solar Still: An Economic and Environmental Study. Environ. Res. Eng. Manag. 2021, 77, 110–122. [Google Scholar] [CrossRef]
- Saidur, R.; Elcevvadi, E.T.; Mekhilef, S.; Safari, A.; Mohammed, H.A. An overview of different distillation methods for small scale applications. Renew. Sustain. Energy Rev. 2011, 15, 4756–4764. [Google Scholar] [CrossRef]
- Rahimi-Ahar, Z.; Hatamipour, M.S.; Ahar, L.R. Air humidification-dehumidification process for desalination: A review. Prog. Energy Combust. Sci. 2020, 80, 100850. [Google Scholar] [CrossRef]
- Narayan, G.P.; Sharqawy, M.H.; Summers, E.K.; Lienhard, J.H.; Zubair, S.M.; Antar, M.S. The potential of solar-driven humidification–dehumidification desalination for small-scale decentralized water production. Renew. Sustain. Energy Rev. 2010, 14, 1187–1201. [Google Scholar] [CrossRef]
- Thakkar, H.; Ramana, P.V.; Panchal, H.; Sadasivuni, K.K. Design and experimental analysis of solar-powered water desalination system using humidification–dehumidification. Int. J. Ambient Energy 2020, 1–12. [Google Scholar] [CrossRef]
- Sharshir, S.W.; Peng, G.; Yang, N.; El-Samadony, M.O.A.; Kabeel, A.E. A continuous desalination system using humidification—Dehumidification and a solar still with an evacuated solar water heater. Appl. Therm. Eng. 2016, 104, 734–742. [Google Scholar] [CrossRef]
- Kabeel, A.E.; Abdelgaied, M. Experimental evaluation of a two-stage indirect solar dryer with reheating coupled with HDH desalination system for remote areas. Desalination 2018, 425, 22–29. [Google Scholar] [CrossRef]
- Alsehli, M. A New Approach to Solar Desalination Using a Humidification–Dehumidification Process for Remote Areas. Processes 2021, 9, 1120. [Google Scholar] [CrossRef]
- Wang, J.-h.; Gao, N.-y.; Deng, Y.; Li, Y.-l. Solar power-driven humidification–dehumidification (HDH) process for desalination of brackish water. Desalination 2012, 305, 17–23. [Google Scholar] [CrossRef]
- Giwa, A.; Fath, H.; Hasan, S.W. Humidification–Dehumidification desalination process driven by photovoltaic thermal energy recovery (PV-HDH) for small-scale sustainable water and power production. Desalination 2016, 377, 163–171. [Google Scholar] [CrossRef]
- Pourafshar, S.T.; Jafarinaemi, K.; Mortezapour, H. Development of a photovoltaic-thermal solar humidifier for the humidification-dehumidification desalination system coupled with heat pump. Sol. Energy 2020, 205, 51–61. [Google Scholar] [CrossRef]
- Elsafi, A.M. Integration of humidification-dehumidification desalination and concentrated photovoltaic-thermal collectors: Energy and exergy-costing analysis. Desalination 2017, 424, 17–26. [Google Scholar] [CrossRef]
- He, W.F.; Huang, L.; Xia, J.R.; Zhu, W.P.; Han, D.; Wu, Y.K. Parametric analysis of a humidification dehumidification desalination system using a direct-contact dehumidifier. Int. J. Therm. Sci. 2017, 120, 31–40. [Google Scholar] [CrossRef]
- Li, Y.; Klausner, J.F.; Mei, R.; Knight, J. Direct contact condensation in packed beds. Int. J. Heat Mass Transf. 2006, 49, 4751–4761. [Google Scholar] [CrossRef]
- He, W.F.; Yang, H.X.; Han, D. Thermodynamic analysis of a power and water combined system with geothermal energy utilization. Geothermics 2018, 76, 106–115. [Google Scholar] [CrossRef]
- Zarei, T.; Miroliaei, M.R. Performance evaluation of an HDH desalination system using direct contact packed towers: Experimental and mathematical modeling study. J. Water Reuse Desalination 2022, 12, 92–110. [Google Scholar] [CrossRef]
- Narayan, G.P.; Chehayeb, K.M.; McGovern, R.K.; Thiel, G.P.; Zubair, S.M.; Lienhard, J.H. Thermodynamic balancing of the humidification dehumidification desalination system by mass extraction and injection. Int. J. Heat Mass Transf. 2013, 57, 756–770. [Google Scholar] [CrossRef] [Green Version]
- Bu, Y.G. Thermodynamic Study on Desalination System of Low Concentration Photovoltaic/Thermal Collector. Master’s Thesis, North China Electric Power University, Beijing, China, 2018. [Google Scholar]
- Chen, X. Performance Analysis of Seawater Desalination System Co-Driven by Photoelectricity & Optothermal. Master’s Thesis, North China Electric Power University, Beijing, China, 2019. [Google Scholar]
- García-Cascales, J.R.; Vera-García, F.; Corberán-Salvador, J.M.; Gonzálvez-Maciá, J. Assessment of boiling and condensation heat transfer correlations in the modelling of plate heat exchangers. Int. J. Refrig. 2007, 30, 1029–1041. [Google Scholar] [CrossRef]
- Narayan, G.P.; Mistry, K.H.; Sharqawy, M.H.; Zubair, S.M.; Lienhard, J.H. Energy Effectiveness of Simultaneous Heat and Mass Exchange Devices. Front. Heat Mass Transf. 2010, 1, 1–14. [Google Scholar] [CrossRef]
- Narayan, G.P.; Sharqawy, M.H.; Lienhard, J.H.; Zubair, Z.M. Thermodynamic analysis of humidification dehumidification desalination cycles. Desalination Water Treat. 2012, 16, 339–353. [Google Scholar] [CrossRef] [Green Version]
- Aref, L.; Fallahzadeh, R.; Madadi Avargani, V. An experimental investigation on a portable bubble basin humidification/dehumidification desalination unit utilizing a closed-loop pulsating heat pipe. Energy Convers. Manag. 2021, 228, 113694. [Google Scholar] [CrossRef]
- Wang, K.; Hu, T.; Hassabou, A.H.; Spinnler, M.; Polifke, W. Analyzing and modeling the dynamic thermal behaviors of direct contact condensers packed with PCM spheres. Contin. Mech. Thermodyn. 2012, 25, 23–41. [Google Scholar] [CrossRef]
- Mahmoud, A.; Fath, H.; Ookwara, S.; Ahmed, M. Influence of partial solar energy storage and solar concentration ratio on the productivity of integrated solar still/humidification-dehumidification desalination systems. Desalination 2019, 467, 29–42. [Google Scholar] [CrossRef]
- Alrbai, M.; Enizat, J.; Hayajneh, H.; Qawasmeh, B.; Al-Dahidi, S. Energy and exergy analysis of a novel humidification-dehumidification desalination system with fogging technique. Desalination 2022, 522, 115421. [Google Scholar] [CrossRef]

Publisher’s Note: MDPI stays neutral with regard to jurisdictional claims in published maps and institutional affiliations. |
© 2022 by the authors. Licensee MDPI, Basel, Switzerland. This article is an open access article distributed under the terms and conditions of the Creative Commons Attribution (CC BY) license (https://creativecommons.org/licenses/by/4.0/).