Article

Geotechnology Applied to Analysis of Vegetation Dynamics and Occurrence of Forest Fires on Indigenous Lands in Cerrado-Amazonia Ecotone

by
Felipe Gimenes Rodrigues Silva
1,
Alexandre Rosa dos Santos
2,
Nilton Cesar Fiedler
3,
Juarez Benigno Paes
3,
Rodrigo Sobreira Alexandre
3,
Plinio Antonio Guerra Filho
4,*,
Rosane Gomes da Silva
5,
Marks Melo Moura
3,
Evandro Ferreira da Silva
6,
Samuel Ferreira da Silva
3,
Saira G. de Oliveira Santos Rodrigues Silva
7,
Raphael Maia Aveiro Cessa
8,
Washington Amaral Ferreira
1 and
Fabio Gonçalves Marinho
1
1
Federal Institute of Mato Grosso/IFMT, Confresa Campus, Confresa 78652-000, Brazil
2
Rural Engineering Department, Alegre Campus, Federal University of Espírito Santo/UFES, Alegre 29500-000, Brazil
3
Forestry and Wood Sciences Department, Alegre Campus, Federal University of Espírito Santo/UFES, Jerônimo Monteiro 29550-000, Brazil
4
Agricultural Engineering Department, Agricultural and Environmental Sciences Center, Federal University of Maranhão/UFMA, Chapadinha 65500-000, Brazil
5
Federal Institute North of Minas Gerais/IFNMG, Araçuí Campus, Araçuí 39600-000, Brazil
6
Altamira Campus, Federal University of Pará/UFPA, Altamira 68372-040, Brazil
7
State School Teacher Juracy Macedo, State Secretariat of Education of the State of Mato Grosso/SEDUC, Poxoréu 78800-000, Brazil
8
Federal Institute of Brasília/IFB, Planaltina Campus, Planaltina 73380-900, Brazil
*
Author to whom correspondence should be addressed.
Sustainability 2022, 14(11), 6919; https://doi.org/10.3390/su14116919
Submission received: 28 March 2022 / Revised: 15 May 2022 / Accepted: 17 May 2022 / Published: 6 June 2022

Abstract

:
The Cerrado-Amazonia Ecotone is one of the largest ecosystems in Brazil and is internationally considered a biodiversity hotspot. The occurrence of fires is common in these areas, directly affecting biomass losses and the reduction of vegetative vigor of forest typologies. Information obtained through remote sensing and geoprocessing can assist in the evaluation of vegetation behavior and its relation to the occurrence of forest fires. In this context, the objective of the present study was to analyze temporal vegetation dynamics, as well as their relationship with rainfall and fire occurrence on Indigenous lands, located in the Cerrado-Amazonia Ecotone of Mato Grosso state, Brazil. Normalized Difference Vegetation Index (NDVI) images of the MOD13Q1 MODIS product and burnt area of the MCD45A1 MODIS product, and rainfall images from the Tropical Rainfall Measuring Mission (TRMM) sensor were used. The period analyzed was from 2007 to 2016. After pre-processing the NDVI, TRMM and burnt area images, correlation analyses were performed between the rainfall, vegetation index and burnt area images, considering different lags (−3 to 3), to obtain the best response time for the variables. The analyses of inter-annual vegetation index trends were carried out following Mann–Kendall monotonic trend and seasonal trend analysis methodologies. Significant correlations were observed between NDVI and rainfall (R = 0.84), in grass regions and between NDVI and burnt area (R = −0.74). The Mann–Kendall monotonic trend indicates vegetation index stability with positive variations in grass regions. The analysis of seasonal trends identified different vegetation responses, with this biome presenting a diverse phytophysiognomy and seasonal vegetation with different phases for amplitudes. This variation is evidenced by the various phytophysiognomies and their responses in relation to biomass gains and losses. The correlation and regression of the NDVI and rainfall in the vegetation type of grass areas show that the burnt area tends to increase with the reduction of NDVI. Finally, no defined pattern of vegetation cycles or phases was observed in terms of seasonality and the proposed methodology can be adapted to other world biomes.

1. Introduction

Brazil has a large territorial extension and part of this territory is defined as Indigenous land, totaling 704 units or 13.8% of the national territory, including several biomes, according to data from the Socio-Environmental Institute [1]. The creation of Indigenous units contributes to socio-environmental gains, directly contributing to maintaining the culture of Indigenous populations and the conservation of several biomes [2,3]. These include the Cerrado of the Mato Grosso, which has an area of 30 million ha with approximately 4.38 million hectares belonging to Indigenous lands.
These peoples are mainly recognized in terms of sustainability and ethnodevelopment practices, which points to a less predatory and more ritualistic relationship with the environment when compared to Western society. However, bringing all these groups together in a single term can make it difficult to understand the reality of each people. Thus, the cultural singularities of each ethnic group can be perceived in different configurations of power relations, social organization, creed and mores. Based on this idea, it is impossible to dissociate the Indigenous reality from the need to occupy and use their territories in order to maintain their lives and traditions in symbiotic processes with nature [4]. Several ethnicities present in the Cerrado-Amazonia Ecotone use fire to burn their territories as a hunting methodology [5]. The Xavante people, for example, have the characteristic of using this methodology for both hunting and rituals [6]. This is evident in the Indigenous territories from Cerrado-Amazonia Ecotone in Mato Grosso state, which are inhabited by eight recognized ethnic groups (Bororo, Cinta Larga, Tapirapé, Enawene Nawe, Nambikwara, Bakairi, Paresi and Xavante).
The Cerrado biome, also called “Brazilian Savannah”, is one of the largest ecosystems in Brazil, being internationally considered a biodiversity hotspot [7]. It is continuously affected by forest fires, directly influencing biomass losses and reduction of vegetative vigor of the present forest typologies [8,9]. The biome is threatened with the extinction of plant and animal species, by the advance of agriculture and the uncontrolled use of fire [10,11]. Even with its great environmental importance, increasing pressure to make new agricultural areas available has jeopardized the integrity of its natural habitats [11,12,13].
In this context, fire is responsible for a series of interactions, as well as disturbances of vegetation dynamics [11,14,15,16]. It is also an important aspect for some species, as it directly affects the productivity, resilience, biodiversity and hydrological cycle of the site, being a significant source of greenhouse gases [17,18].
Thus, remote sensing appears to be a suitable tool to evaluate the temporal behavior of vegetation related to precipitation and the occurrence of fires in the biome. Monitoring the plant dynamics of the planet’s ecosystems is essential, and vegetation indices derived from red and near infrared reflectance can be used, making these vegetation indices a useful tool for correlation with climatic data and vegetation behavior across spatial and temporal scales [19,20,21].
Thus, the use of multispectral satellites has become a common tool to map the effects of forest fires [22], by means of orbital sensors able to detect these events at regional, continental and global scales [23]. Many studies have been developed using the Moderate Resolution Imaging Spectro Radiometer (MODIS) sensor for the analysis of forest fires [24,25,26,27].
In this context, the study of the landscape and its phenology becomes a challenge, due to the difficulty of measuring phenological events, especially in the context of large areas. Therefore, interest in evaluating and monitoring landscape dynamics has increased in recent years, caused by the availability of data from orbital monitoring with good resolution, used among other functions to observe climate changes and their impact on vegetation dynamics [28]. In addition, many properties of the biological processes of vegetation can be monitored by satellite, which constitutes a form of rapid evaluation of the biological behavior of vegetation [24,29]. Thus, these methods generate satisfactory results when applied to temporal analysis with moderate resolutions using sensors [20,30,31].
Because of the lack or scarcity of information related to vegetation dynamics and their relation to forest rainfall and fires occurring in Indigenous lands located in the Cerrado-Amazonia Ecotone, it is necessary to monitor and correlate variables to understand these environmental events [32,33], through statistical procedures such as (a) temporal analysis of burnt areas and (b) time series analysis (analysis of trends, correlations and lags, Mann–Kendall monotonic trends, vegetation seasonality, NDVI anomalies and rainfall and burnt area). Monitoring them is also necessary as a conservation measure since these areas are surrounded by agricultural activities, which can generate anthropic pressures that cause environmental impacts, such as fire occurrences.
Therefore, rainfall and vegetation indexes are information that correlates with fire occurrence. The present study seeks to determine the effect of rainfall on Cerrado-Amazonia Ecotone phenology given that vegetation and rainfall are related to fire occurrence. The objective of the present study is to evaluate temporal vegetation dynamics related to rainfall and fire occurrence on Indigenous lands located in the Cerrado-Amazonia Ecotone of Mato Grosso state, Brazil (Figure 1 and Figure 2).

2. Materials and Methods
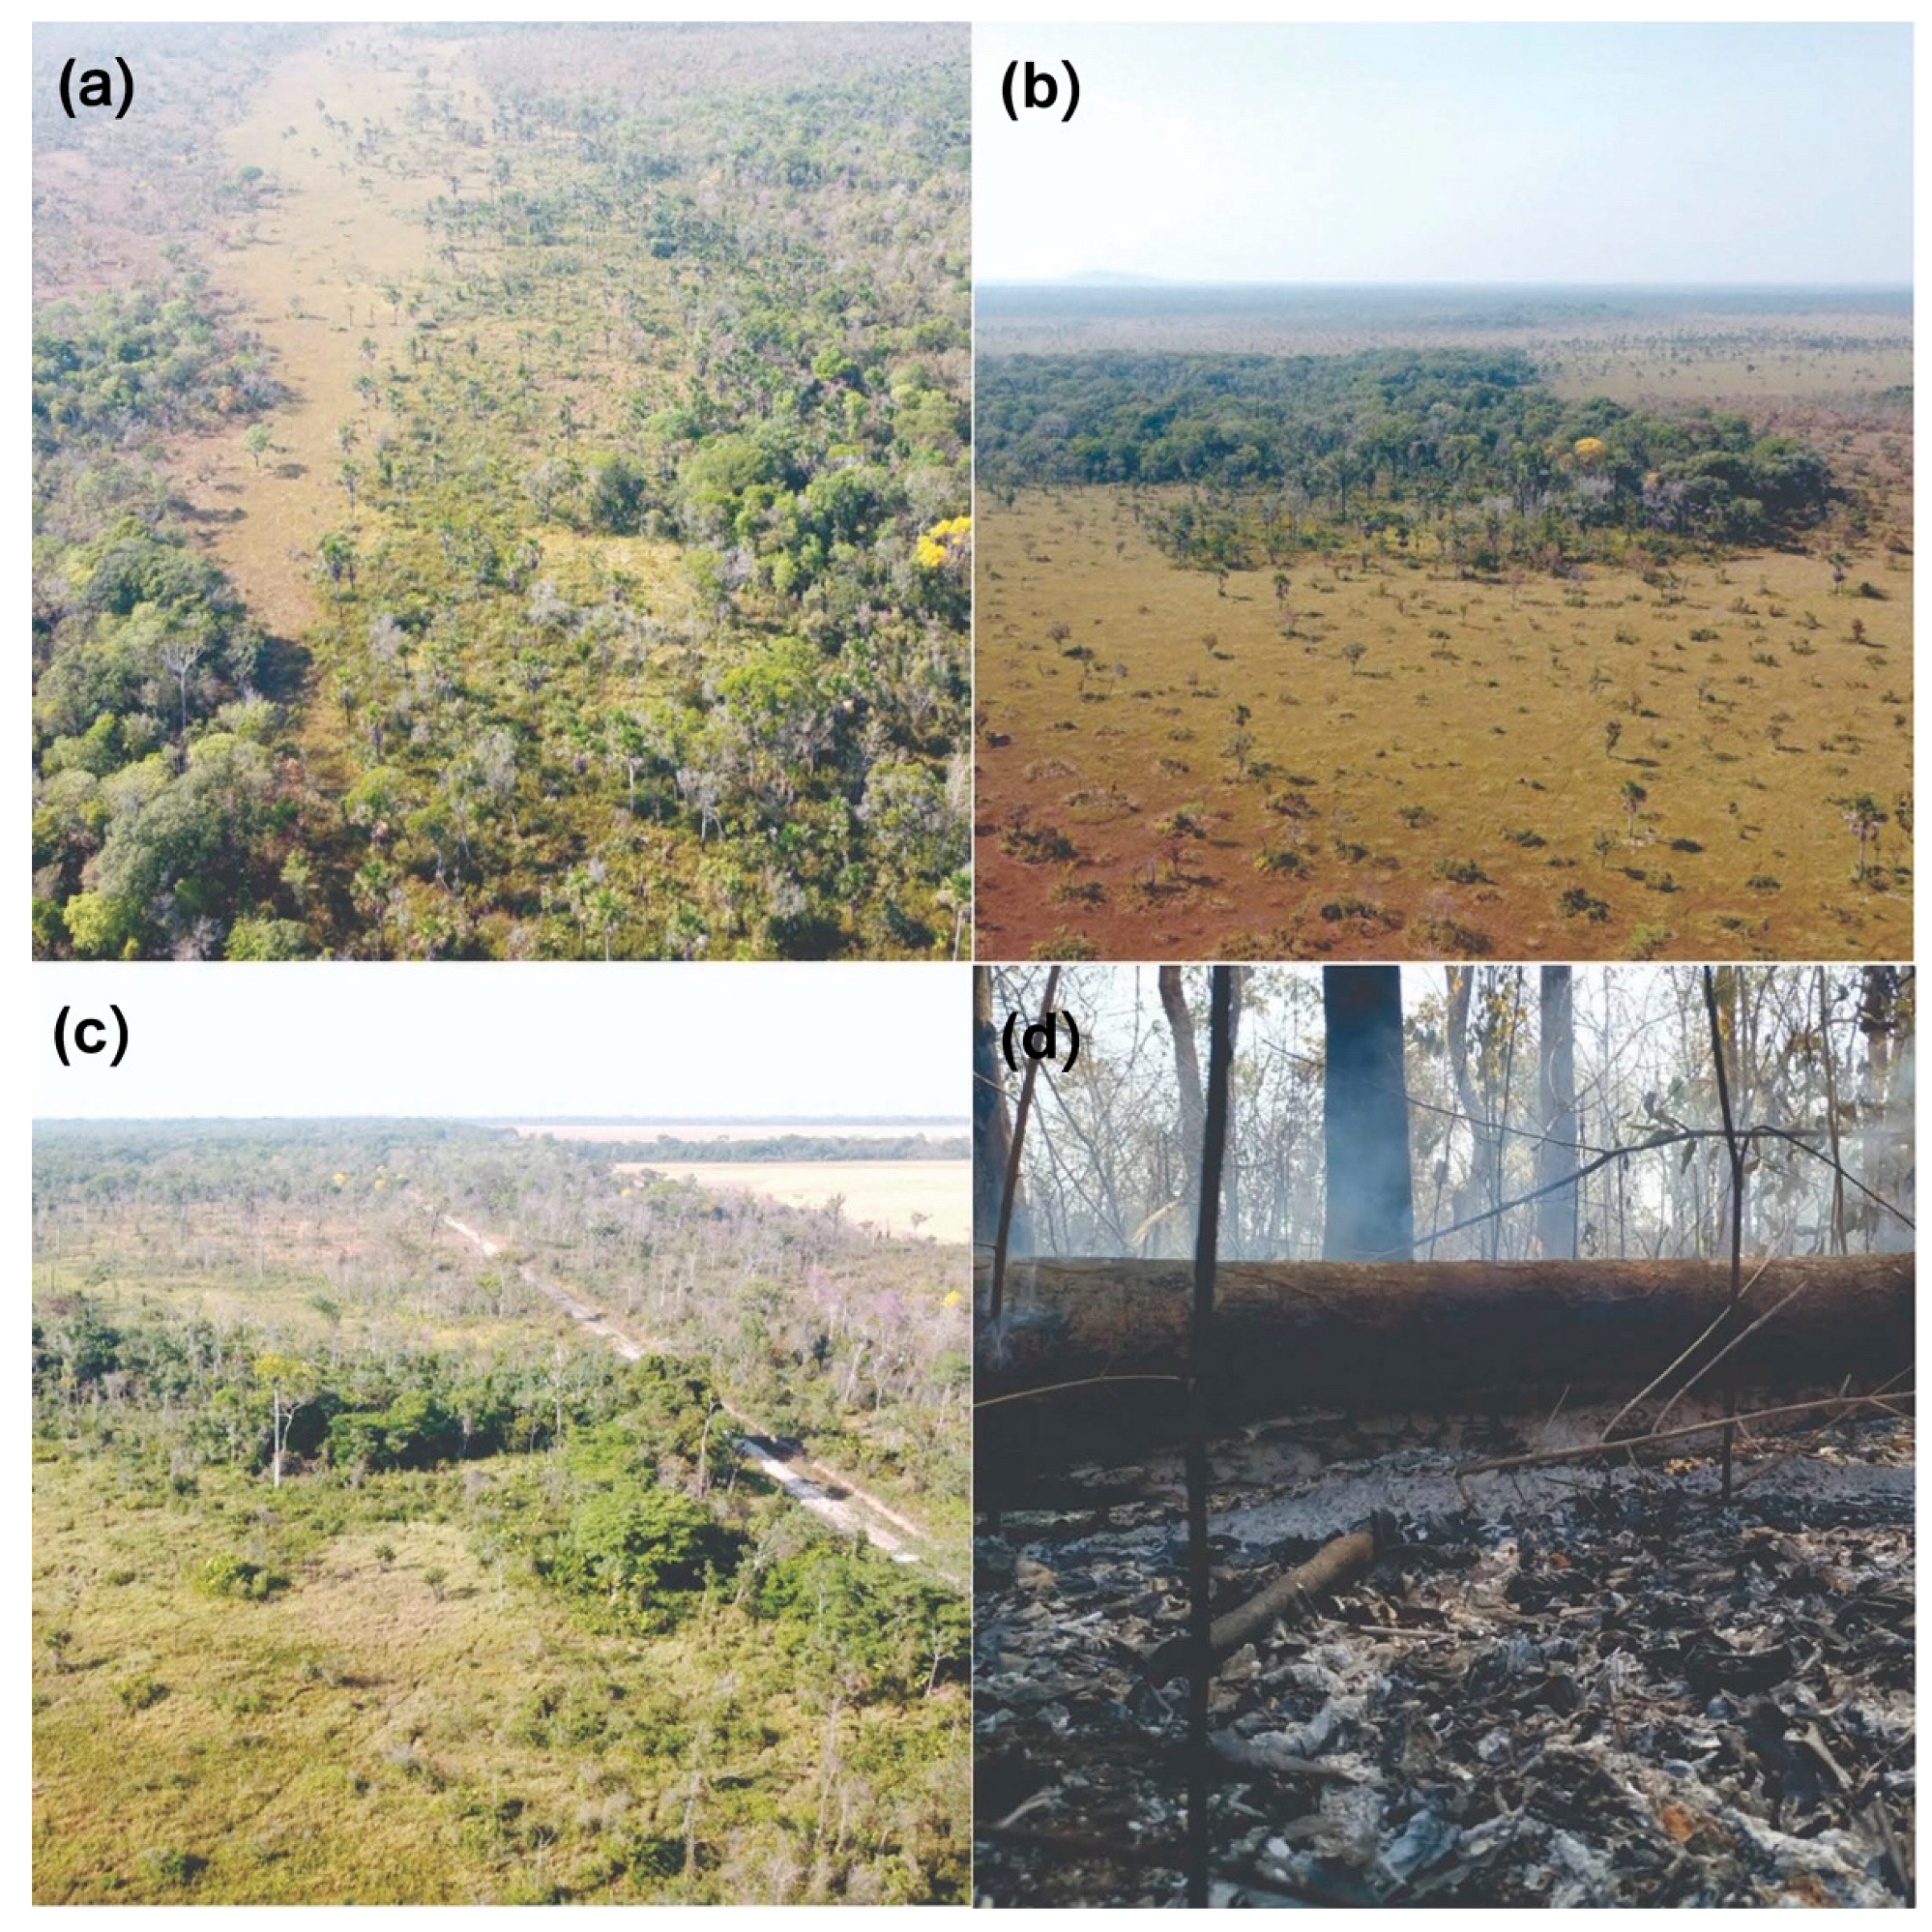
2.1. Study Area

The research was carried out on Indigenous lands in the Cerrado-Amazonia Ecotone, within the boundaries of the state of Mato Grosso located between the parallels 9°33′17″ and 17°51′11″ S and the meridians 60°15′32″ and 50°42′41″ W (Figure 3). The prevailing climate of the Cerrado is a tropical seasonal type, with a dry winter and rainy summer. According to the Köppen classification [34], the average annual temperature ranges from 22 to 23 °C, with monthly averages presenting small variations, but being able to reach 40 °C maximums, and with monthly minimums having a high amplitude of variation.

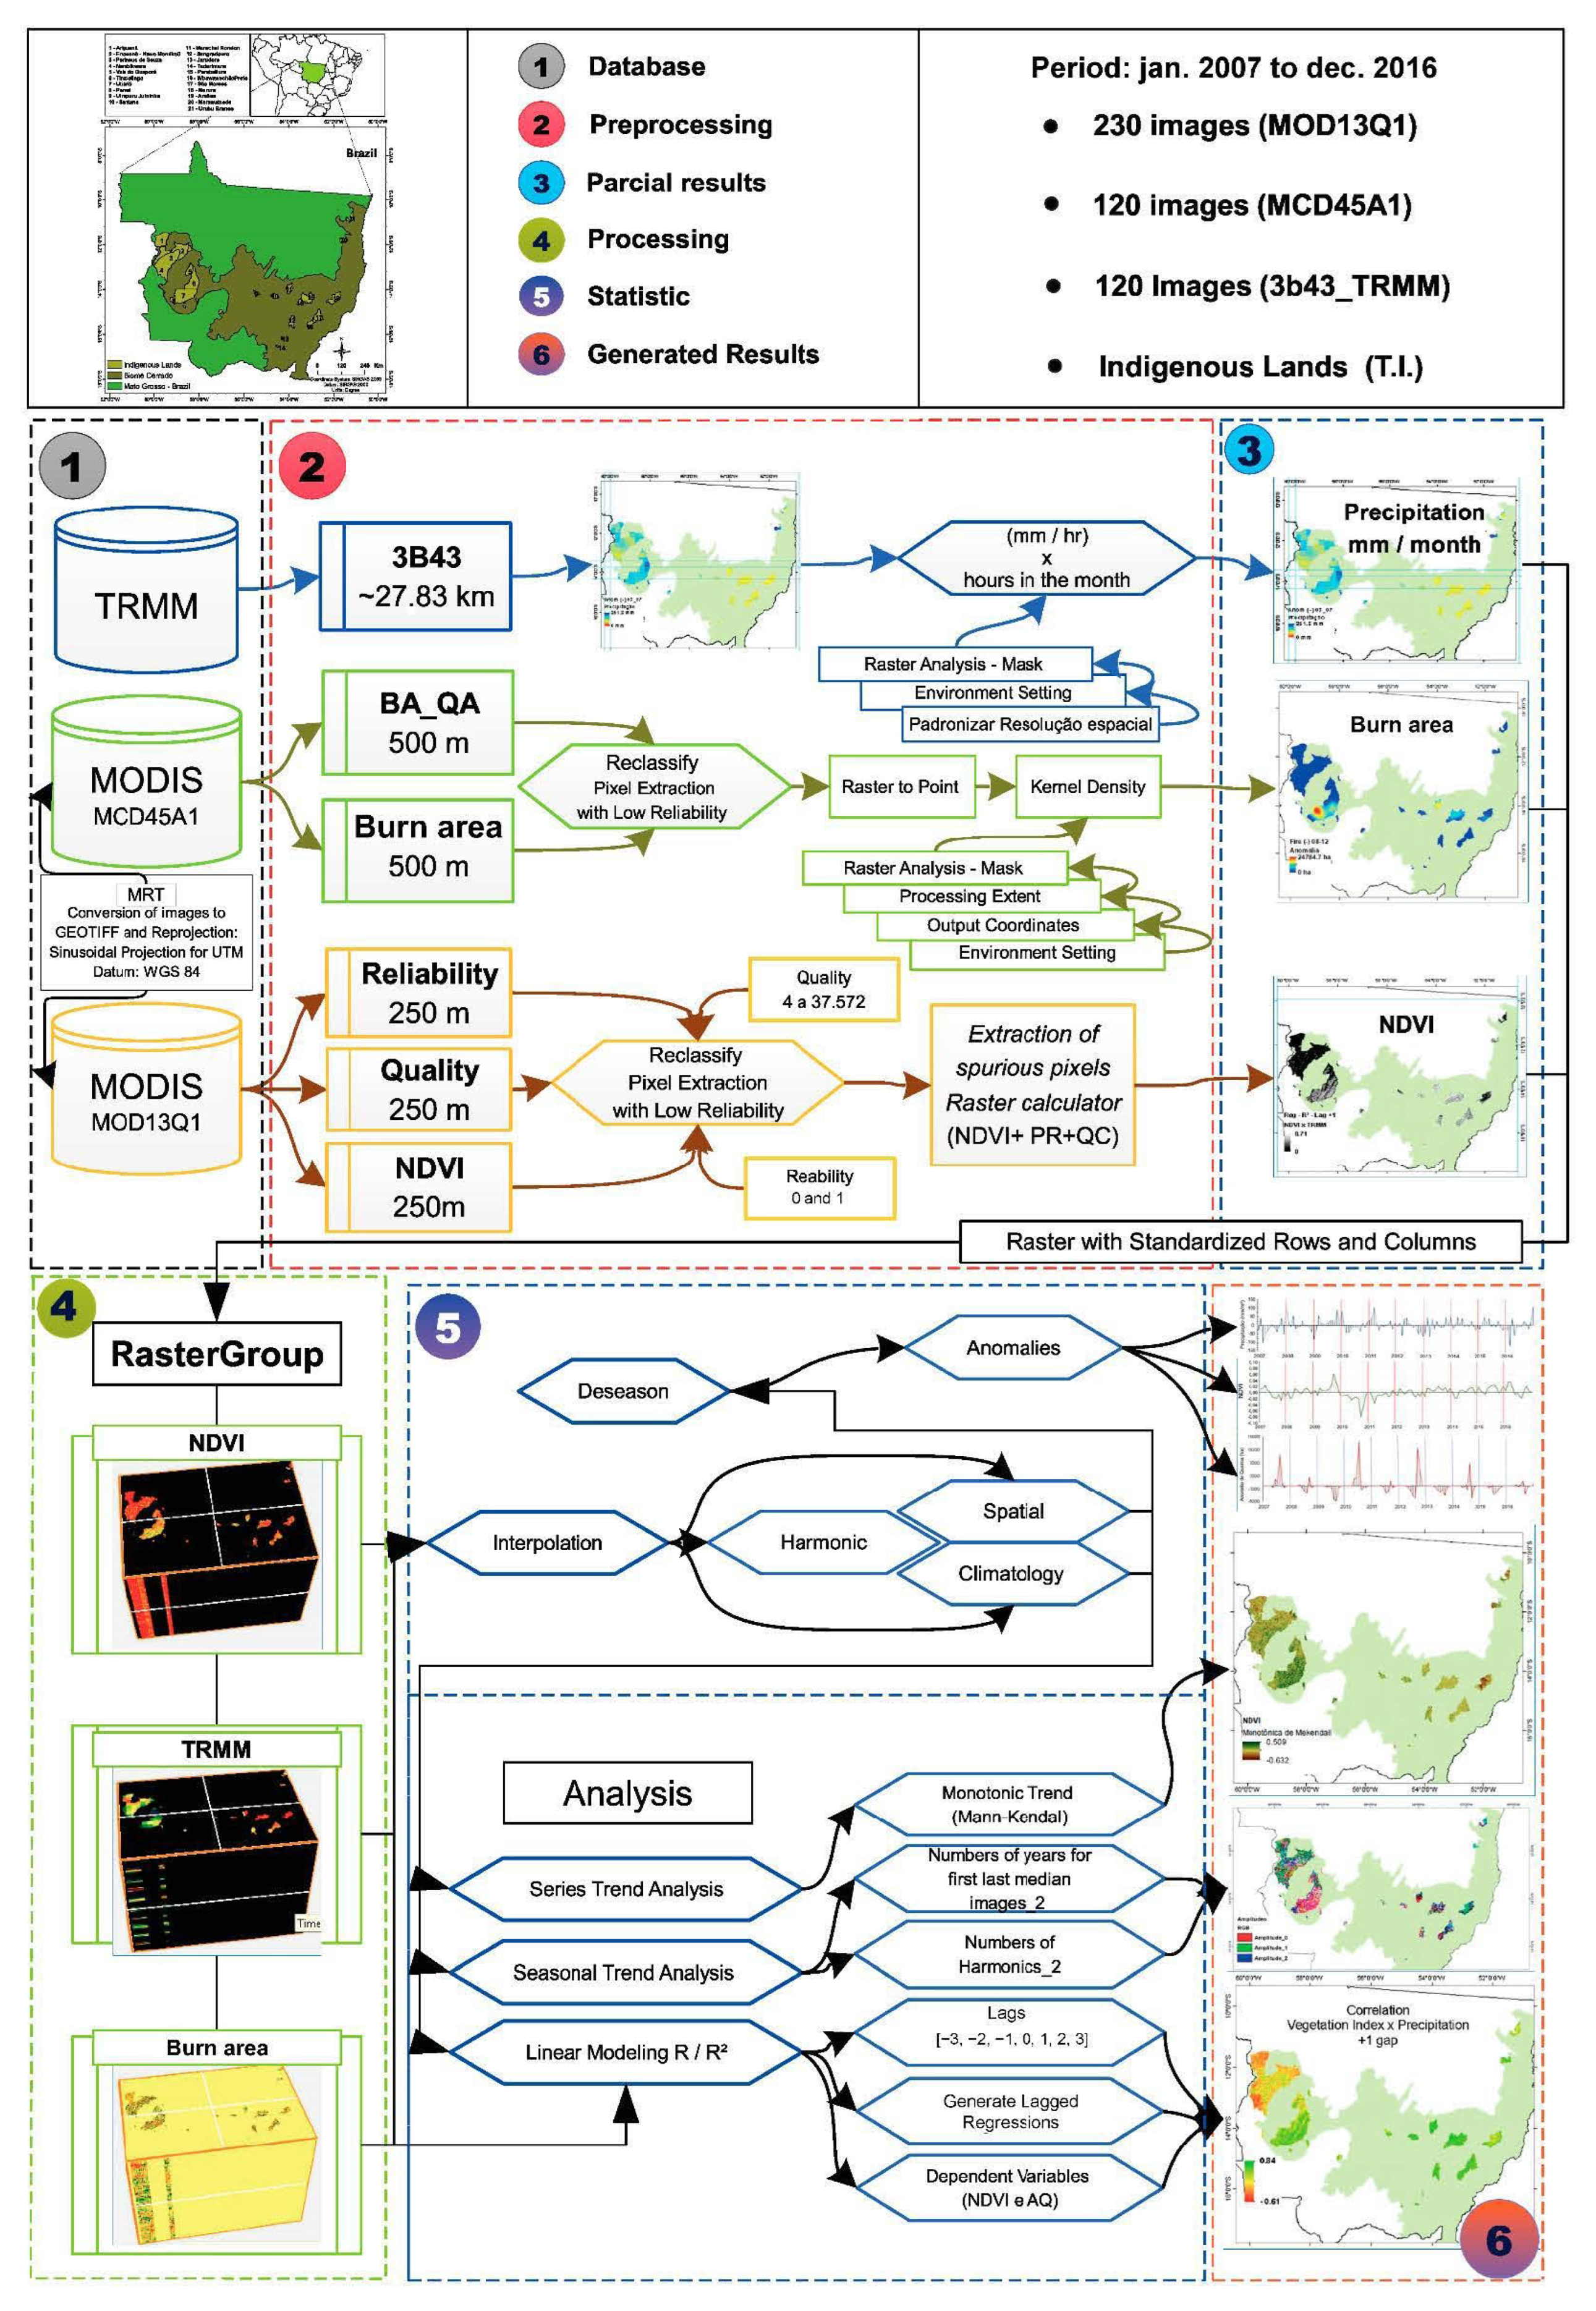
2.2. Obtaining and Pre-Processing Data

The data used to analyze the seasonal vegetation patterns of Indigenous lands originated from the NDVI vegetation index of the MOD13Q1 product provided by the MODIS sensor, aboard the Terra satellite. To analyze the burnt areas over the 10-year time series (2007–2016), images from the MODIS sensor MCD45A1, Aqua and Terra satellites were used. MODIS is a passive sensor (depends on sunlight), therefore, it has a heliosynchronous orbit (synchrony with the Sun), with an altitude of 705 km, almost polar, and temporal resolution of one day, its acquisition latitude is greater than 30 degrees. In addition, this sensor contains 12-bit radiometric resolution and operates by obtaining information with 36 spectral bands. Thus, it works with several wavelengths, acting from visible to thermal infrared. The spatial resolution contains images of 250 m for bands 1 and 2; 500 m for bands 3 to 7 and 1000 m for the other 29 bands [35].
In addition, MODIS makes its products available in hierarchical data format (HDF) divided into quadrants, with the same area and size called tiles, which have dimensions of 10 × 10 degrees (1200 × 1200 km). The scenes of this sensor cover a strip of 2330 km wide, which facilitates the correlation between data and their location on Earth. Each tile has a vertical and horizontal numerical reference. For the total coverage of the Earth, 460 tiles are required [35].
MODIS images were extracted from the site (http://reverb.echo.nasa.gov/reverb/ (accessed date: 30 January 2017)), which integrates NASA’s The Earth Observing System Data and Information System program (EOSDIS). The images were acquired from 01/01/07 to 12/31/16. In this temporal evaluation, images were extracted considering the temporal resolution of the 16-day satellite of the NDVI indexes, totaling 230 images (NDVI), 230 (Pixel Reliability) and 230 (VI Quality), in the evaluated temporal session.
The NDVI images of the MOD13Q1 product and burnt area images of the MCD45A1 product are presented in the sinusoidal projection, with a quantization level of 16 bits, in hierarchical data format (HDF). They were preprocessed using the Modis Reprojection Tools (MRT) application to obtain geographic coordinates and convert the HDF into Geotiff format. These images are called ready-to-use, because they are available, georeferenced, and atmospherically corrected by the Land Processes Distributed Active Archive Center (LPDAAC) (2014) and correspond to the tile H12V10, in which the study area is located. As previously mentioned, each image results from a mosaic of the selection of the best quality pixels from a 16-day period for the NDVI.
The images used from the MOD13Q1 product were NDVI, Pixel Reliability and VI Quality. Only areas from the Cerrado-Amazonia Indigenous lands were considered. Pixel Reliability and VI Quality images were used for noise correction in NDVI images, selecting only high-reliability data. A NoData classification was given to low quality values (−1, 2, and 3) and a zero classification for data considered good (0 and 1) in terms of Pixel Reliability. For VI quality images, a value of 0 was assigned for the range between 4 and 37,572 and NoData for the range between 37,572 and 60,000. Pre-processing is required to remove spurious pixels generating high-reliability images (Table 1).
For the pre-processing of the MCD45A1 product, the data were crossed, which selected the pixels with a higher degree of reliability in the determination of the burn date in the burn date (annual values from 1 to 366 Julian days). With this, it was possible to obtain a pixel selection presenting a high reliability index (value 1).

2.3. Obtaining and Processing Meteorological Data

Rainfall data were obtained from the Tropical Rainfall Measuring Mission (TRMM) [37], which collects information from the tropical region, with a spatial resolution of 0.25 degrees, approximately 27.83 km. The conversion of the units provided by the TRMM, which are in mm h−1 to mm−1, was performed by multiplying the total monthly hours by the value of each pixel, taking leap years into consideration. In addition, the sizes of the TRMM images were converted into the value of 0.00225 to work with pixels with the same spatial resolution as the images obtained by the MODIS-MOD13Q1 sensor with 250 m of spatial resolution.

2.4. Temporal Analysis of Burnt Areas

The time resolution of the MCD45A1 is composed of a monthly burnt area image, with a total of 120 images for the product. For the analysis of the spatial distribution pattern of burnt area recurrence within the limits of the Cerrado, the MCD45A1 product was used as a reference. The conversion of the MOD45A1 product from HDF to GEOTIFF was performed, resulting in a post-conversion data set, distributed in layers, defined for each 500 m pixel, presenting quality and fire information per pixel. The images used were only the ba_qa (detection confidence index ranging from 1 (more confident) to 4 (less confident)) and burn date that defines the burnt area. Subsequently, the data was filtered to obtain the selection of pixels labeled as burnt area by means of burn date (annual values from 1 to 365 days). With this, the selection of pixels with a high reliability index was achieved (value 1) [38].
The behavior of vegetation vigor in Indigenous lands was analyzed in order to identify possible areas affected by fire, through the analysis of anomalies (abnormally decreased biomass) along the spectral profiles of the vegetation index.

2.5. Time Series Analysis

2.5.1. Analysis of Trends, Correlations and Lags

The relationships between the time series were compared, for vegetation (dependent) index and rainfall (independent), burnt area (dependent) and precipitation (independent); and burnt area (dependent) and vegetation index (independent). They were considered in the analysis of different lags. For example, when lag 0 is considered, the time series are being compared via corresponding time intervals; a negative lag, lag −1, shifts the independent variable to a previous month, ie precipitation during October will be correlated as the month of November of the vegetation index. Therefore, with this procedure, it was possible to obtain the correlations between the analyzed variables

2.5.2. Mann–Kendall Monotonic Trends

The 10-year time series of images forms a data set that was examined pixel by pixel, using the method that indicates if a trend is non-linear or not and whether it increases or decreases. The values generated by this equation are limited to −1 or 1. When negative, these values denote a decreasing trend in the case of the vegetation index, presenting a loss of vegetative vigor and biomass. When they are positive, they denote an increasing trend that represents an increase in vegetative vigor and biomass. Mann–Kendall coefficients, as described in Equations (1) and (2), were estimated using this technique [39,40].
S = i 1 n 1 j = i + 1 n s i n   a l x i x j
s i n   a l x i x j = 1 ,   i f x i x j < 0 0 ,   i f x i x j = 0 1 ,   i f x i x j < 0
where S is the Mann–Kendall correlation coefficient, x i and x j are the estimated values of the sequence of values and n is the number of elements in the time series.
Equation (3) was used.
τ = 2 s n n 1
where τ is Mann–Kendall tau, s is the sign and n is the number of elements of the time series.
The Mann–Kendall monotonic trend consists of a non-parametric test that compares the measurements of a given year and measurements from previous years, thereby obtaining the sum of positive and negative values. When added, these values indicate the intensity and direction of the trend [41].

2.5.3. Vegetation Seasonality

A Seasonal Trend Analysis (STA) of vegetation index data was performed. This technique consists of a harmonic regression, in its first stage, which is applied to each pixel of the temporal session for each year of the series, thus extracting the amplitude (0, 1 and 2) and semi-annual amplitude (0), annual cycle (amplitude 0), annual cycle (amplitude 1 and phase 1) and semi-annual cycle (amplitude 2 and phase 2), thus producing five parameters describing the seasonal cycle (phases 1 and 2), according to Equation (4).
y = α 0 + 1 2 α n × s i n 2 π t T + φ n
where y is the variable resulting from the sum of the harmonics, α 0 is the constant term of amplitude, α n are amplitudes, φ n are phase angles ranging from 0 to 359°, n is a harmonic (an integer multiplier), t is the time and T is the time series length.
Applying the procedures used in this tool, we arrived at the second stage, where nonparametric analyses were performed for each pixel using the Theil–Sen median slope operator option to evaluate short or noisy series. The calculation used by this STA tool determines the slope between each pixel and combines them to obtain the median value. To elaborate on this median trend, this tool rejects degradation above 29% of the time series, resulting in five maps; with three amplitudes and two phases (A0, A1, A2, F1 and F2) forming a Red/Green/Blue (RGB) composition.

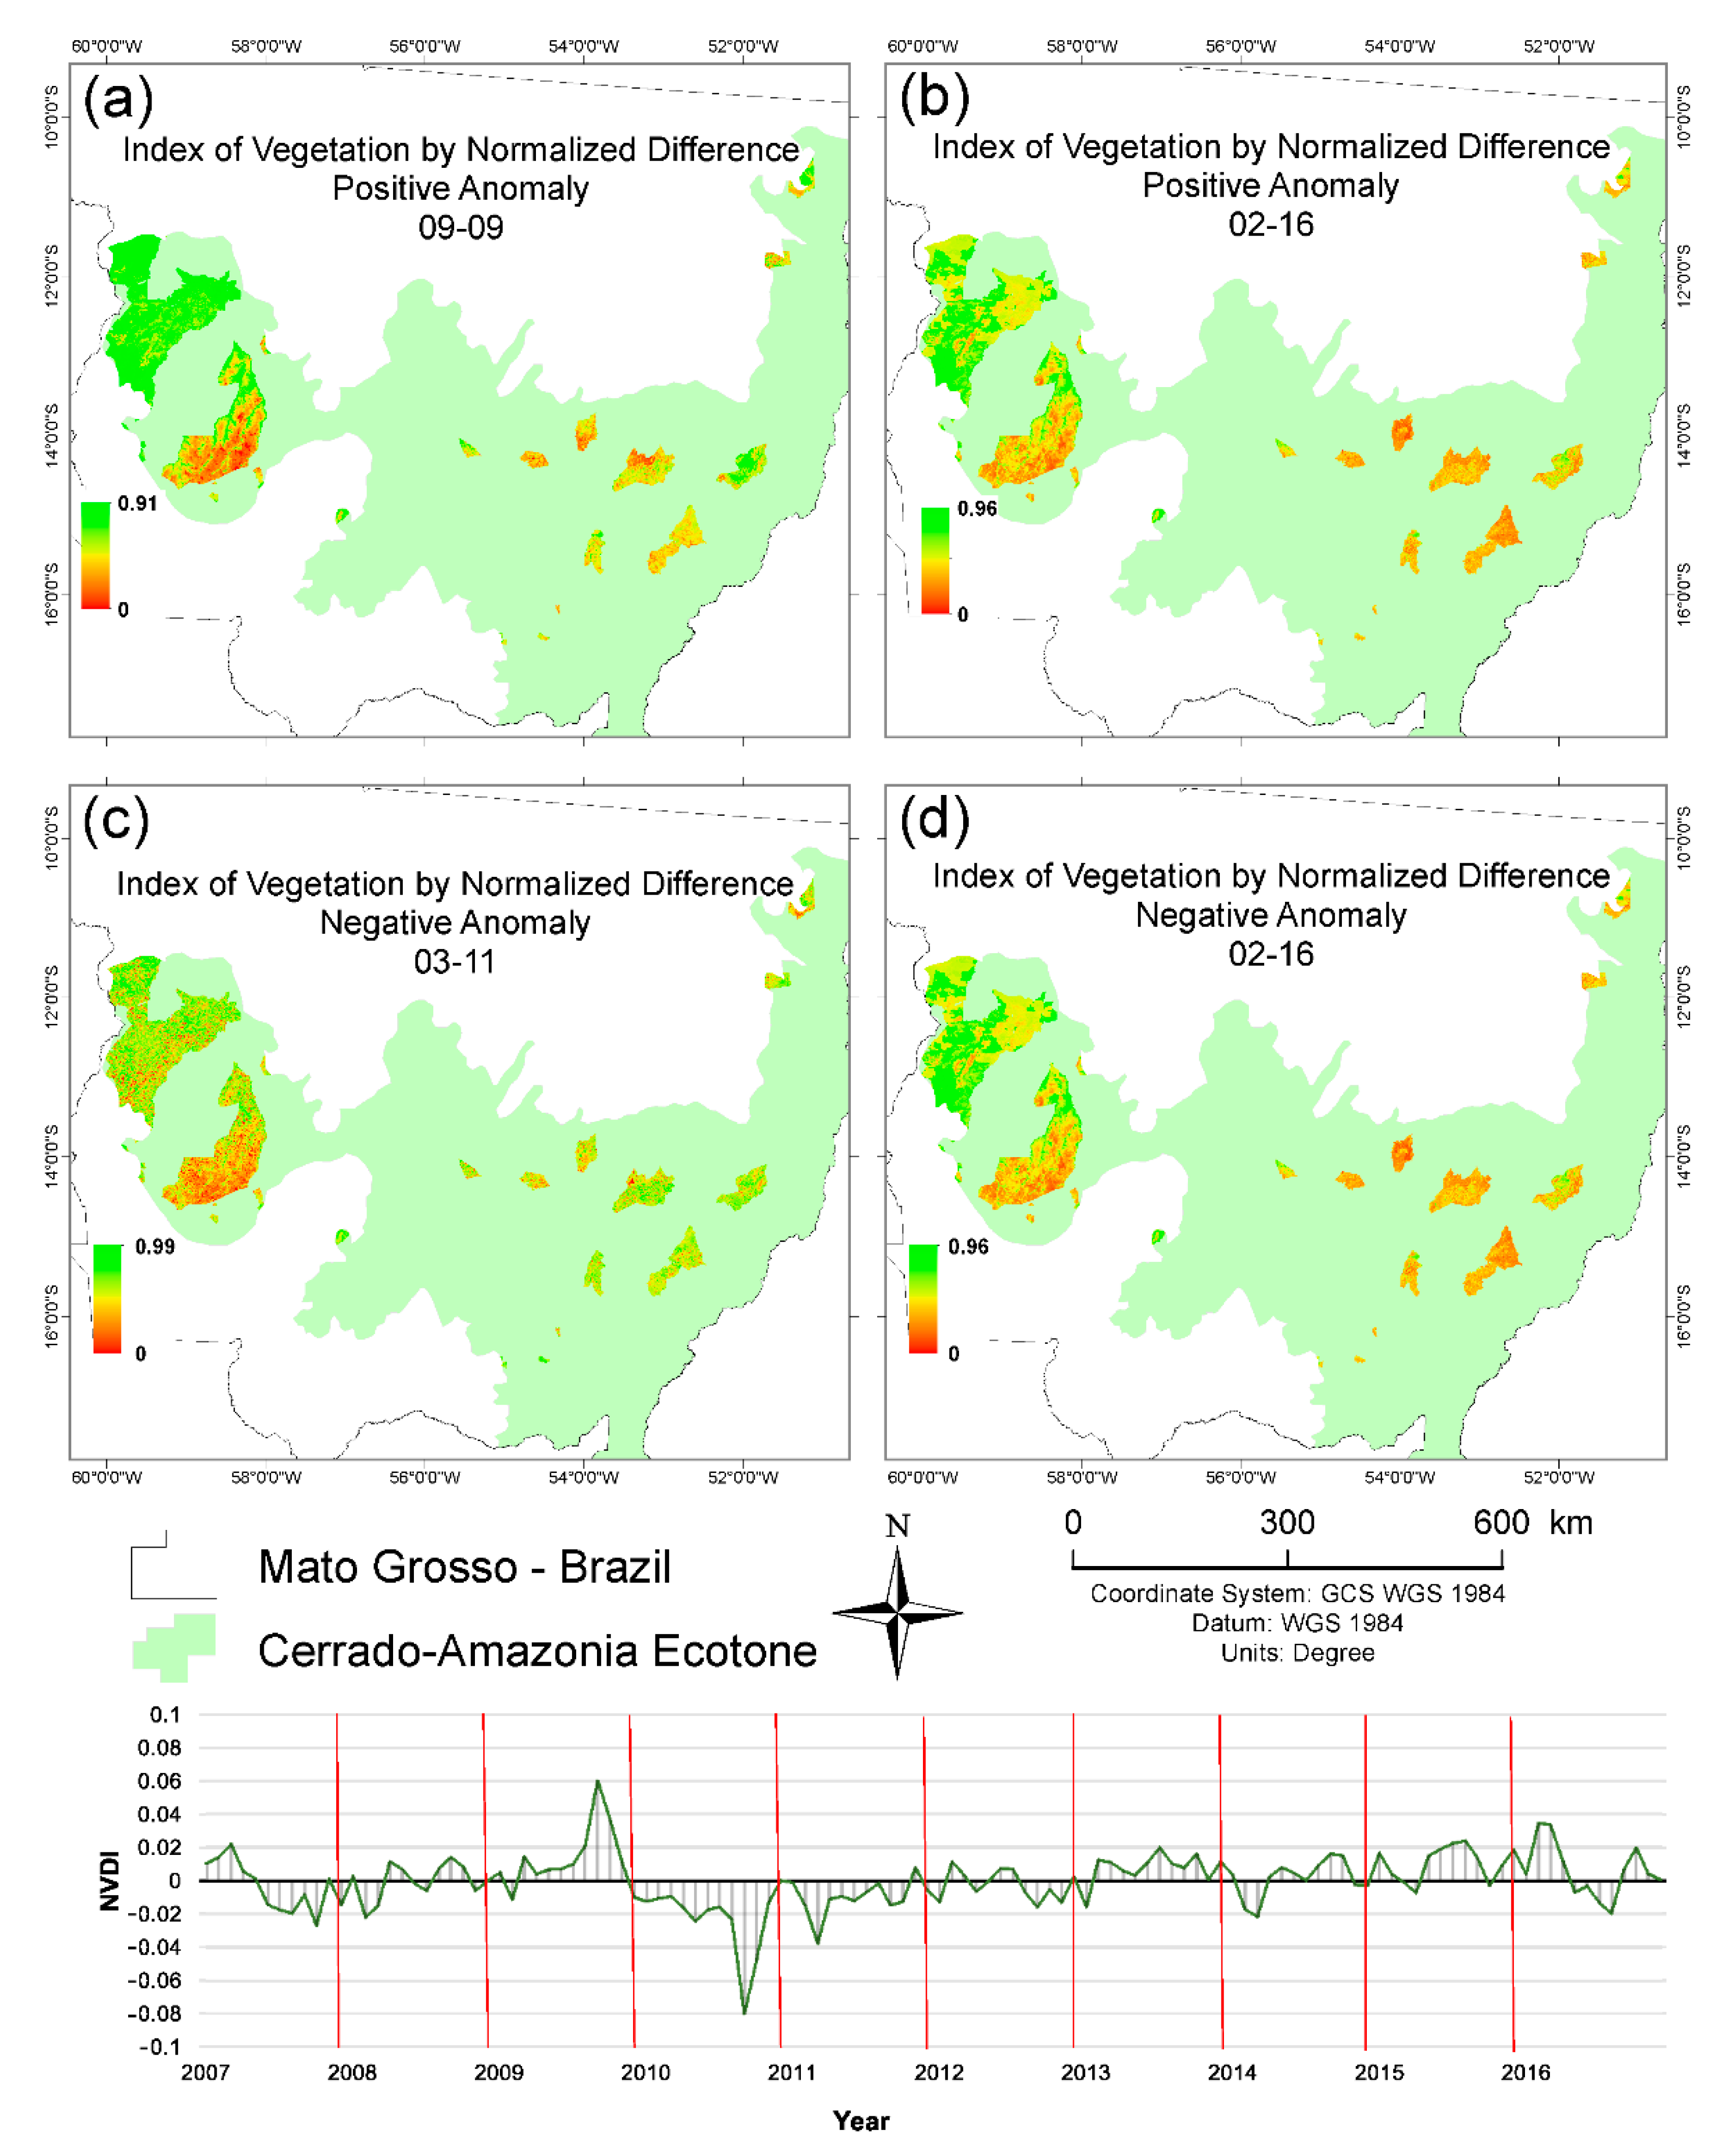
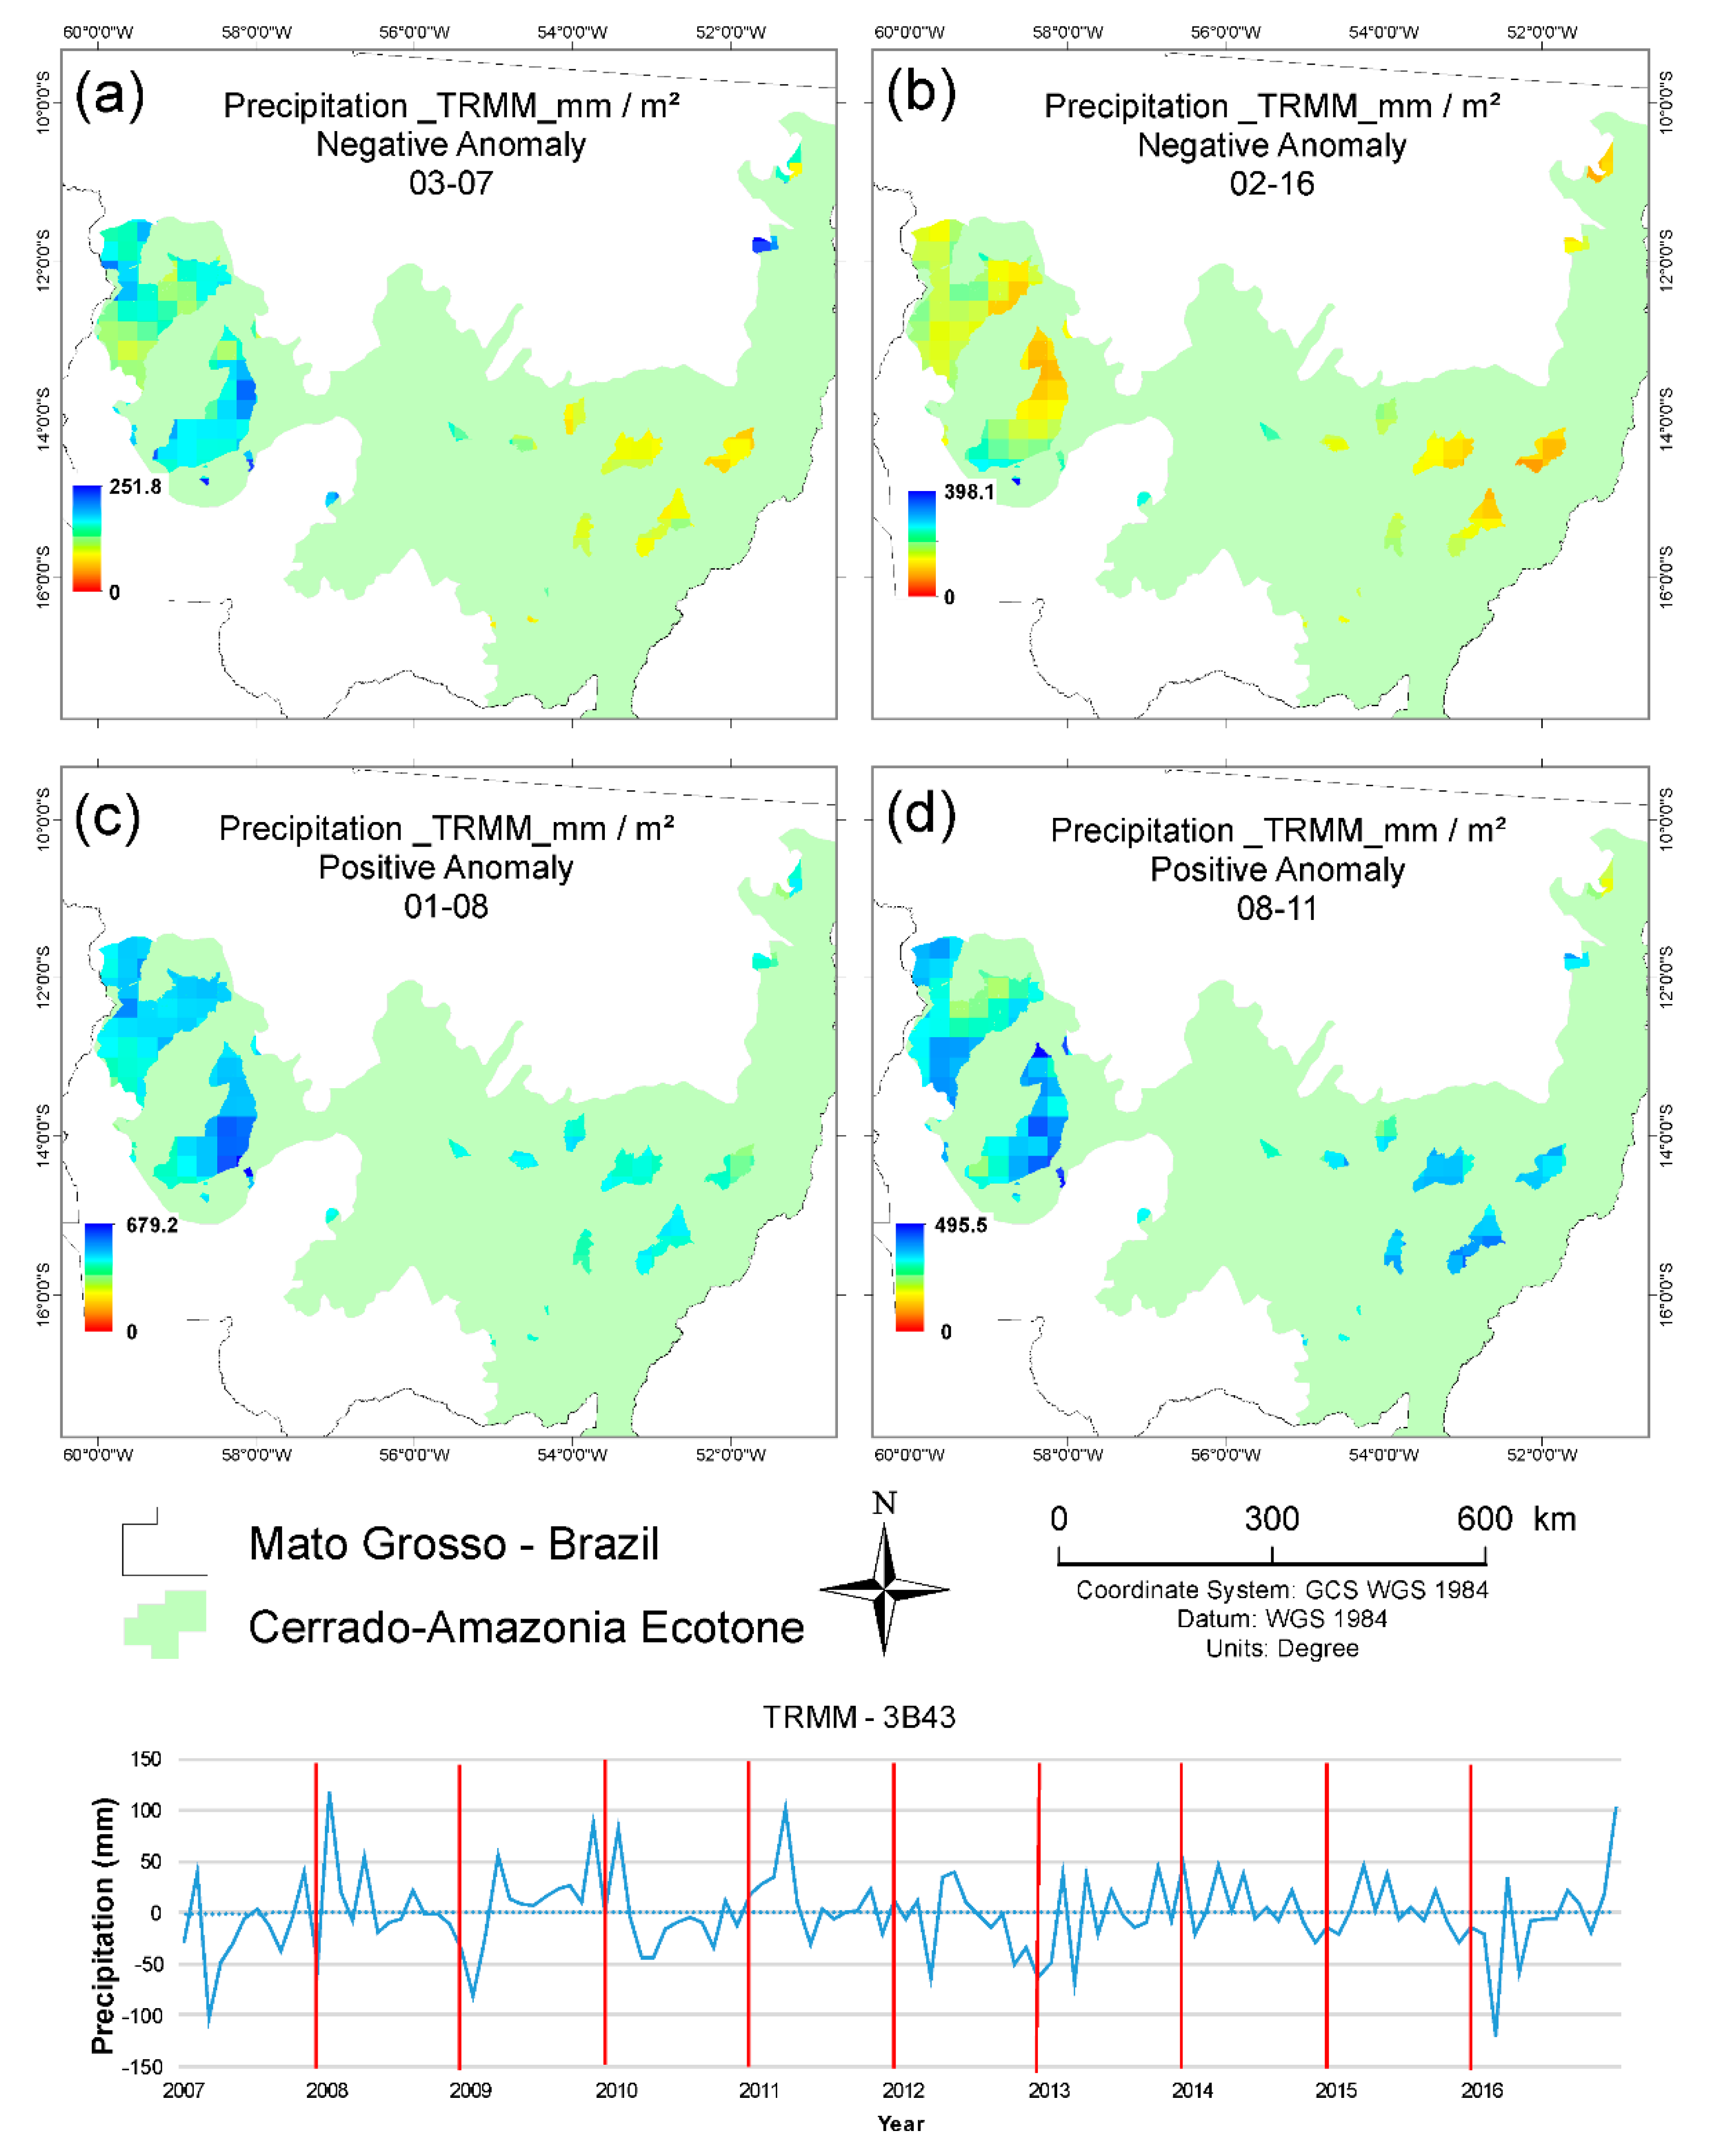
2.5.4. NDVI Anomalies, Rainfall and Burnt Area

In order to generate the temporal profile for the vegetation index (MOD13Q1), rainfall (TRMM3B43) and burnt area (MCD45A1), deviations were calculated in relation to the mean values. Standardized anomalies include division by standard deviation. With this average data, anomaly charts were plotted, which presented the difference between the monthly average of the index for the whole period evaluated and its averages for each month over the 10 years evaluated. Therefore, by comparing the monthly data referring to each month, with the monthly average of the 10-year time series, it was possible to infer the occurrence of anomalies in the variables analyzed. The methodology used is summarized in Figure 4.

3. Results

3.1. Linear Modeling

To better understand the relationships between the variables analyzed, images of the relationships obtained between Vegetation Index (NDVI) and Precipitation (TRMM) (a/b), Burnt Area and Vegetation Index (c/d) and Burnt Area and Precipitation (e/f) are presented in Figure 5. Therefore, Figure 5 presents the following information: (a) value of R for Vegetation Index (dependent) and Precipitation (independent), lag +1; (b) value of R2 for Vegetation Index (dependent) and Precipitation (independent), lag +1; (c) value of R for Burnt Area (dependent) and Vegetation Index (independent), lag −1; (d) value of R2 for Burnt Area (dependent) and Vegetation Index (independent), lag −1; (e) value of R for Burnt Area (dependent) and Precipitation (independent), lag 0; (f) value of R2 for Burnt Area (dependent) and Precipitation (independent), lag 0.
Using the relationship between NDVI and precipitation, it was possible to obtain the R and R2 values (Figure S1, Supplementary Materials) through linear modeling, considering the best lag +1 result, which shifts the independent variable to a later month. With this, it was possible to verify how much of the independent variable (rainfall) explains the variations of the dependent variable (NDVI). Except for one, the Indigenous lands located in the extreme west of the state (Aripuanã, Enawenê-Nawe Mendkeü, Perineus de Souza and Nambikwara villages), presented correlation values (R) that did not follow the pattern of the other lands, being negative in some places. This response could be due to the relationship between NDVI and precipitation, taking into consideration different lags (lag −1, −2, −3, +1 and +2) and the land location in the transition zone between Cerrado and Amazon forest.

3.2. Time Profiles and Anomalies

According to information from Figure S1 of the Supplementary Materials, which describes the temporal profile of NDVI and precipitation over the evaluated ten years (2007–2016), it was observed that rainfall distribution is seasonal, directly reflecting the NDVI dynamic response. Rainfall distribution (Figure S1, Supplementary Materials) presents well-defined periods. From May, it generally decreases for a six-month period in all evaluated years, reaching values close to zero, and remaining at this level until October. It was observed that the Cerrado-Amazonia Ecotone vegetation in the study area takes some time to reduce its NDVI after rainfall decreases, this response does not occur immediately, but only after a period known as a lag. Therefore, there is some association between the variables, considering the month-lag period necessary for this response.
It can be inferred that the NDVI presented a significant relation to rainfall, because its growth coincides with the beginning of the rains, demonstrating the strong seasonality of precipitation in the Cerrado-Amazonia Ecotone and its impact on vegetative vigor. Additionally, it is evident that in the less rainy months, fires occur, showing the strong relationship between these variables (Figure S2, Supplementary Materials).
Based on the anomalies time profile for NDVI (Figure 6), it is possible to notice that there was not much variation over the time, except for some dates, specifically 09/09 (a) and 02/16 (b), with positive values close to 0.06 and 0.04 respectively, and 03/11 and 02/16, with negative values close to 0.08 and 0.04 respectively. These values were found in the variation of vegetation index. It is also worth noting that vegetation dynamics followed a linear pattern, without anomalous alterations, due to its series of adaptive mechanisms that can explain NDVI variation in relation to precipitation. One of the factors determining vegetation distribution at different scales is the presence or availability of water [42,43].
The analysis of forest fires describes a strong occurrence of fires in the study area, as in August 2010 and 2012 (Figure 5a,b), which found a positive anomaly (values above average), with approximately 15,000.00 and 11,000.00 ha (respectively) of Burnt Area in relation to the average of all the months of August of the temporal season (2007–2016).
By analyzing the anomaly profile graph (Figure 7), it can be observed that the differences in the monthly averages of the index throughout the whole evaluated period and its averages for each month, during the evaluated period, did not follow Figure 7a or February 2016 (Figure 7b), which presented the largest negative precipitation anomaly of approximately 100 mm. However, January 2008 (Figure 7c) and March 2011 (Figure 7d) presented positive anomalies, with rainfall gains of approximately 100 mm.

3.3. Mann–Kendall Monotonic Trend

The Mann–Kendall coefficient works pixel by pixel along the time series (2007–2016) for the vegetation index, shown in Figure S3 of the Supplementary Materials. This methodology offers information on trend linearity and measures using the range of −1 to +1. Values closer to −1 indicate that the trend is decreasing while those close to +1 indicate that the trend is increasing. Values close to zero indicate no trend, i.e., positive values (+) indicate biomass gains, while negative values (−) indicate biomass losses.

3.4. NDVI Seasonality

Through the seasonal trend analysis (STA), in Figure S4 of the Supplementary Materials, it was possible to verify that there were several types of phases and amplitudes. The seasonal trend module uses the colors red, green and blue, which respectively refer to amplitude 0, amplitude 1 and phase 1, and amplitude 2 and phase 2. These amplitudes and phases represent NDVI cycles and peaks, that is, annual biomass gains. Amplitude “0” indicates that the vegetation presents no defined vegetative cycle; amplitude 1 indicates the maximum annual vegetation growth; amplitude 2 represents the presence of semi-annual seasonality.
In this way, several phase and amplitude combinations were observed in all Indigenous lands, producing new colorations. The combination of amplitudes 0 and 2, for example, generated a coloration close to pink. This coloration is present in Indigenous lands (Vale do Guaporé, Tiracatinga, Utiariti, Uirapuru Juininha and Paresi), showing a predominance of red and blue, which describes the presence of semi-annual seasonality. This region is composed of open field vegetation containing almost solely grass and shrub vegetation. Consequently, its phenological responses are directly related to rainfall, which presents well-defined dry and rainy seasons.

4. Discussion

4.1. Linear Modeling: NDVI X TRMM

The correlation obtained between the studied variables (Figure 5) was of relevant values, suggesting a high degree of association with R values that vary between 0.84 and −0.61, and showing a strong association between the variables, for the lag of + 1. Thus, a great part of the Indigenous lands showed correlations of up to 0.84, demonstrating the importance of rainfall in the study of vegetation dynamics. However, one of the evaluated units did not follow the standard of the R values, presenting a negative correlation, with values close to −0.61 and mostly near to zero, especially gallery forest regions that showed no correlation with the independent variable.
The R2 values obtained for a large part of the area were low, especially in areas presenting higher vegetation density and gallery forest regions, where the independent variable could not explain the phenological alterations of NDVI. However, the highest R2 values were obtained with less dense vegetation, such as grasslands with shrub presence, identified in many places for the superficial roots and lower tolerance to water deficits. These results corroborate those found by [44], when studying the metabolism and phenology of vegetation using satellite images. There they described a low correlation, close to zero in riparian forest regions, between the constant water supply in the soil and the presence of a deeper soil in the Cerrado-Amazonia Ecotone, which affects the maintenance of photosynthetic activities of all vegetation, thus reducing the association degree between vegetation and rainfall.
In studies related to the temporal evaluation of vegetation and precipitation, vegetation is sensitive to accumulated precipitation, however, this response is not immediately found and a gap between them is usually observed [45,46]. Refs. [47,48], when evaluating the desert landscape in the Sahel-Africa region and Skukuza area of the Kruger National Park, respectively, found results that corroborate those of the present study, since the authors report that the phenological issues of vegetation are closely related to rain seasonality, and its higher productivity occurs during wetter summer months, which strongly influence vegetation productivity. However, the results obtained by those authors considered a lag value of −1 while the present study considered a +1 value.
Additionally, [49] report that the Cerrado-Amazonia Ecotone presents seasonally defined climatic characteristics with few precipitation events for five months of the year and the other months presenting high rainfall. [50] report that precipitation is concentrated almost entirely in the interval between October and April with the other months at times reaching zero and showing a relative humidity below 20%.
The interaction between vegetation and climate describes the phenology of the biome, which means that vegetation can act as an extremely sensitive indicator of climate change [51]. In this sense, changes in vegetation dynamics may be a response to both local and global climate [52]. Ref. [53] report that in some vegetation types a delay of up to 17 days can be necessary to obtain vegetation responses in relation to precipitation. [54,55], studying the estimation of biomass in the Cerrado and California oak/grass savannah, respectively, found that this biome has several types of response to water availability, due to its great variety of phytophysiognomies.
The forests constituted by dense areas in Cerrado and the ecotone zone have fewer temporal responses to water variations in dry and humid periods. These factors explain the low degree of association between the extreme western region (Aripuanã, Enawenê-Nawe Mendkeü, Perineus de Souza and Nambikwara villages) and rainfall. Given the above, [56] found that there are few studies related to the effects of rainfall on vegetation dynamics. Additionally, the authors argue that rainfall significantly varies when faced with high or extremely sloping topography, directly affecting water availability during the main stages of vegetation growth.
Increased NDVI was observed together with increased rainfall, considering the +1 delay, reflecting the biomass gain and increased photosynthetic activity, showing a strong interaction between the Cerrado-Amazonia Ecotone and rainfall. However, the coefficient of determination shows that rainfall alone does not explain NDVI increases or reductions.

4.2. Linear Modeling: Burnt Area and Vegetation Index

The Burnt Area and NDVI values were calculated using linear modeling, considering lag −1 (changes to the Vegetation Index in May, for example, will affect Burnt Area results in June), therefore, corresponding to a negative delay that shifts the independent variable (NDVI) to its previous month. Given this, correlation results (R) ranged from 0.28 to −0.74, and a large part of the studied area presented negative values, showing the negative association between NDVI and Burnt Area. This demonstrated that in the case of NDVI reduction, there was a concomitant increase in Burnt Area, while an increase of NDVI leads to a smaller Burnt Area. Thus, similar to the values obtained between NDVI and rainfall, the correlation remained constant throughout the study area. However, in particular for Indigenous lands already described, defining this behavior was not possible, probably due to the land location in the ecotone region between the Cerrado and Amazonia biomes.
For the determination coefficient R2, this value allowed the verification of the quality of the adjustment obtained and the fairness of the response, to the extent that the independent variable explains the dependent one. Therefore, the maximum value found for R2 was 0.55, which describes the need to introduce further variables to explain the phenomenon. However, the coefficient of determination R2 once again did not have an explanatory character in the western region (Aripuanã, Enawenê-Nawe Mendkeü, Perineus de Souza, Tiracatinga and Nambikwara villages) or in the other northeastern region of the state (Urubu Branco village), which were both in ecotone regions, and presented R2 values close to zero.
Ref. [57], for the temperate tropical forest of Mexico, reported a high occurrence of surface fires, whose main source of fuel is organic matter (dead leaves, branches and bark) over the soil and undergrowth such as grass in senescence. These materials are abundant in the Cerrado-Amazonia Ecotone, where the significant presence of grasses and shrub vegetation contributes to starting and propagating forest fires. These issues are also reported by [58], who demonstrate that the Cerrado-Amazonia Ecotone presents significant biomass production, especially during rainy seasons and droughts, in particular grasses fall into a state of dormancy or reduction in their photosynthetic activity, leading to aerial part senescence. Forest fires mainly consume this finer vegetation, thereby generating surface fires [59].
Further, [60] confirm the global presence of organic matter in the soil presenting carbon quantities over three times greater than that found in the atmosphere or terrestrial vegetation. These factors define the relationship between forest fires and vegetation as a crucial element to understand fires. In addition, there are other reasons, such as the relationship between the occurrence of fires and deforestation, which have a positive correlation between the occurrence of fires and changes in land use and occupation within a given biome [61,62]. In this sense, [61] remark that public policies had a prominent role in the advance of fires, as there was a substantial reduction in environmental monitoring and inspection of this biome, reflecting in the advance of deforestation and consequently allied with fires in the region.

4.3. Linear Modeling: Burnt Area X Rainfall

Results found in the regression analysis between the Burnt Area and Rainfall variables, considering lag 0, vary between 0.28 and −0.74, demonstrating that a large part of the study area presented a negative correlation between the analyzed variables and again the two landed (Aripuanã, Enawenê-Nawe Mendkeü, Perineus de Souza, Nambikwara, Utiariti, Paresi, Tiracatinga and Guaporé Valley) and northeast (Urubu Branco village) which showed a positive though negligible correlation, with a value of 0.28. Several authors, applying linear regression when working with multitemporal ecological data in remote sensing studies, obtained excellent results, showing that this method is effective in these types of studies [33,63,64,65,66].
The temporal dynamics of forest fires are directly related to climatic conditions. In addition, the synergistic effect between a landscape of increased flammability and climatic factors determined by large-scale atmospheric phenomena (ENSO) could be to amplify the occurrence of large forest fires, as described in other countries such as France and Greece [67]. In addition, the suppression of fires also promotes the accumulation of fuel, causing fires to present greater intensity with a lower probability of fire control, leading to catastrophic consequences [68,69].
According to the authors of [70], the rainy season in the Cerrado region is concentrated almost entirely in the period from October to April and the remaining months can reach zero precipitation and relative humidity with values lower than 20%. These factors were also observed by [71,72,73], who describe the strong seasonality of the climate that directly affects fire regimes worldwide. Given the above, it is important to note that the dependent variables were fit to the various lags in order to verify the response time of the dependent variables in relation to the independent variables. Thus, the response time of the vegetation index and the burnt area in relation to the independent variable was obtained, making it possible to infer at what stage of vegetative vigor and rainfall most fires occur in different regions of the Cerrado in Mato Grosso.

4.4. Temporal Profile

The temporal profile in the areas shows their variation during the 10 years evaluated and their strong inter-annual seasonality, results that lead us to infer that there is a strong influence of rainfall on vegetation phenology. The occurrence of vegetative vigor peaks in the rainy season, and their significant reduction during the driest period was observed, which led to senescence and significant physiological changes, also described in [74]. This leads us to believe that the seasonal precipitation in the study area, with well-defined rainy and dry seasons, is one of the elements that most contributes to the phenology of the environment, as well as to the occurrence of fires, making the contribution of this variable to the others evident. This seasonality of precipitation was also described by [75], who found the same distribution of precipitation over time.
All years presented fires. Considering that the Indigenous lands in the Mato Grosso state totals 4.5 million ha, some years presented a burnt area of approximately 1.2 million ha, as described in the temporal profile for 2007 and 2012 (Figure S1, Supplementary Materials). Further, it can be observed that the main fires occurred almost entirely in the periods between May and October, coinciding with the lower NDVI and almost no precipitation. Therefore, the reduction of these factors influenced the fire occurrence phenomenon.

4.5. Anomalies

The small variation in this index could be caused by the ability of this vegetation to cope with water stress through physiological adaptations. As described in [76], some xeromorphic characteristics are found in the Cerrado-Amazonia Ecotone and, through adaptive strategies, this vegetation has created ways to face droughts at a certain time of the year and intense solar radiation. In addition, it has mechanisms that help the leaves of the biome’s vegetation to withstand the extensive water deficit [77]. Additionally, the Cerrado shows significant tolerance to water scarcity due to its root system, which in most species reaches deeper soil layers [49]. In studies on the water relationship of the Cerrado-Amazonia Ecotone, [78] describe that most of the energy of this vegetation is spent supporting and maintaining the long, deep roots since they are responsible for searching and supplying the plant with stable water sources available at greater depths. This data is also corroborated by [79], who report the presence of 50% of the biomass in the Cerrado-Amazonia Ecotone in plant root systems, being one of the few studies that estimate above and belowground biomass for Cerrado [80].
However, many biomes have the ability to rapidly send out new shoots. [81] cite the resilience capacity of several ecosystems as adaptive strategies in the face of forest fires. These factors corroborate those described by [82], that reported the tendency and high capacity of the Cerrado species to emit new shoots after a fire. Meanwhile, in the negative anomalies, the values maintained a constant burnt area, varying between 1000 and 5000 ha, since forest fires were detected in all years. However, there was no direct relationship between precipitation anomalies and burnt areas, as the less rainy periods did not coincide. However, a lag must be considered, and fire occurrence may have been influenced by the high water mean of previous years as reported (Figure 8).
It can be inferred that the annual average found was 1759 mm× m−2 in the time series (2007–2016), and the anomalous periods presented negative variations. However, positive anomalies were also observed, indicating that there is rainfall loss and a redistribution of rain during the year, i.e., if there was a negative anomaly in January, then a positive anomaly may occur in the following month of the next year. Therefore, the Mato Grosso Indigenous lands, due to their large territorial extension and intact vegetation, contribute to the balance of rainfall distribution and vegetative vigor (Figure 7).

4.6. Mann–Kendall Monotonic Trend

Many sites with biomass gains are constituted by the vegetation of open fields, sidewalks or a large number of grasses. Therefore, this type of vegetation was dominant in the biomass gain, due to the easiness of gaining and losing biomass. As [54] highlight, more open phytophysiognomies present greater variation in biomass quantities. However, [83], when using NDVI to evaluate the temporal trend of vegetation in the Brazilian and Uruguayan Pampas region, through the Mann–Kendall monotonic trend, reported that there was biomass loss verified by the index, highlighting a direct relation with shallow soils, water deficits and intensive cattle grazing, leading to changes in the Pampas vegetation dynamics and a reduction of vegetative vigor.
These results are in agreement with those presented in the present study (Figure S3, Supplementary Materials) since the areas presenting the highest biomass gains were open fields. In the region where there was biomass loss, large burnt areas (fires occurrence) were found, and this biome stands out due to the large amount of surface litter, a material that is highly interactive with fires, which contributes to fire intensity, thereby impacting on biomass loss.

4.7. NDVI Seasonality

The junction of the amplitudes 0 and 1 generates a yellow coloration while that of 1 and 2 generates a cyan color (light blue). The other overlapping amplitudes and phases, in addition to these colors, can generate primary colors again. The combination of cyan (amplitude 1 and 2) and magenta (amplitude 0 and 2) for example, produces the red of amplitude 0, which represents an environment with no cycles or peaks of vegetative gain.
Ref. [84] report that data generated by the tool are difficult to interpret. Throughout the study area, overlapping amplitudes and phases were observed, showing different seasonal patterns distributed in the Cerrado-Amazonia Ecotone. The first Indigenous land, from west to east for example (Aripuanã, Enawenê-Nawe Mendkeü, Perineus de Souza and Nambikwara), presented several amplitude and phase overlaps. This generated several colorations, such as amplitude 0, 1 and 2 and phases 1 and 2, showing a significant variation in the annual and semi-annual cycles.
In the second Indigenous land, from west to east (Vale do Guaporé, Tiracatinga, Utiariti and Paresi), there was greater uniformity in the seasonal patterns, showing a magenta coloration over much of the territory, which represents a combination of amplitude 0 and 2 with phase 2, describing an absence of annual cycles, without seasonal responses. Further, it can be observed that the hydrography margins have cyan coloration, indicating the presence of the amplitude and phases 1 and 2, which shows that the gallery forest regions have annual and semi-annual seasonal characteristics, with gains in vegetative growth.
In many places in the study area, grayscales were also observed which indicate an absence of trends and seasonal changes [84]. In the eastern and northeastern regions (respectively Areões and Urubu Branco villages) of the Cerrado-Amazonia Ecotone, there are three Indigenous lands with predominantly green and cyan coloration, showing the presence of seasonality of amplitude and phases 1 and 2, which represent strong annual and semi-annual seasonality and vegetative growth.
Results obtained by [85], when applying the same methodology in a study region comprising Asia and Australia (India, South and Southeast China, Burma, Malaysia, Indonesia, the Philippines, Taiwan and Japan), observed annual NDVI increases in more than 27.7% of the region. The author used the term greening to describe this biomass gain. Therefore, all the Indigenous lands surveyed showed the presence of annual and semi-annual cycle trends with some being greater than others. Many of them presented a combination of trends or the absence of trends. This showed the significant biodiversity of this biome and the heterogeneity of the ecosystem. Therefore, this biome is diverse in terms of its distribution and seasonal responses, which is closely connected to its vegetative formation, since the biomes productivity shows wide variability, caused by its various physiognomies.

5. Conclusions

In all years, large burnt areas were quantified, totaling approximately one million hectares per year. In relation to trends, their variability demonstrated the diverse phytophysiognomies and their responses to biomass gains and losses. When analyzed, the best correlation and regression response of the NDVI x Rainfall was observed as a function of the open field vegetation type. The Burnt Area tended to increase with NDVI reductions, mainly in regions with more open vegetation.
In relation to seasonality, no definite pattern of vegetation cycles or phases was found. The results indicate that, in future works, there is a need to introduce additional variables to achieve greater clarity regarding Cerrado-Amazonia Ecotone vegetation dynamics, in order to understand the relation of such phenomena to the occurrence of forest fires, given the natural environmental variables and an on-site survey.
The application of geotechnologies in large-scale environmental studies has opened space for more complex and low-cost research. The combination of tools and concepts of environmental management has provided an increasingly broad exploration of problems related to the management of natural areas, with emphasis on Indigenous lands. Finally, the methodology employed can be expanded and applied in other areas, aiming to generate significantly accurate information.

Supplementary Materials

The following supporting information can be downloaded at: https://www.mdpi.com/article/10.3390/su14116919/s1, Figure S1: NDVI temporal profile (green) with rainfall (blue) in the study area, representing the studied period (2007 to 2016); Figure S2: Temporal profile of Burnt Area in Cerrado-Amazonia Ecotone represented by the amount of burnt area throughout the entire studied period (2007 to 2016); Figure S3: Mann-Kendall Monotonic Trend; Figure S4: Seasonal trend analysis for NDVI; Interactive map.

Author Contributions

Conceptualization, F.G.R.S. and A.R.d.S.; methodology, F.G.R.S., A.R.d.S., N.C.F. and J.B.P.; validation, F.G.R.S., A.R.d.S., R.S.A., S.G.d.O.S.R.S., P.A.G.F. and F.G.M.; formal analysis, F.G.R.S., R.S.A., R.G.d.S., M.M.M., S.F.d.S. and R.M.A.C.; investigation, F.G.R.S., P.A.G.F., R.G.d.S., M.M.M. and S.F.d.S.; resources, A.R.d.S., E.F.d.S., S.G.d.O.S.R.S. and R.M.A.C.; data curation, F.G.R.S., R.G.d.S., S.F.d.S., W.A.F. and P.A.G.F.; writing—original draft preparation, F.G.R.S., A.R.d.S., R.G.d.S., R.M.A.C. and W.A.F.; writing—review and editing, F.G.R.S., M.M.M., E.F.d.S. and P.A.G.F.; visualization, F.G.R.S., E.F.d.S., W.A.F. and F.G.M.; supervision, N.C.F. and J.B.P.; project administration, A.R.d.S. and N.C.F.; funding acquisition, A.R.d.S., N.C.F. and J.B.P. All authors have read and agreed to the published version of the manuscript.

Funding

This study was financed in part by the Coordination of Improvement of Higher Level Personnel (CAPES)—Finance Code 001.

Acknowledgments

The authors thank the promoting agency Coordination of Improvement of Higher Level Personnel (CAPES) and National Council for Scientific and Technological Development (CNPq), the government agency National Institute of Meteorology (INMET) and Federal Institute of Mato Grosso (IFMT). To the researchers that compose the research group of the CNPq Geotechnology Applied to Global Environment (GAGEN) for the help and dedication related throughout the research. Maps throughout this article were created using ArcGIS® software by Esri.

Conflicts of Interest

The authors declare no conflict of interest.

References

  1. Gallois, D.T. Instituto Socioambiental: Povos Indígenas No Brasil. Available online: https://pib.socioambiental.org/pt/Localização_e_extensão_das_TIs (accessed on 1 January 2019).
  2. Lima, M.; Vale, J.C.E.D.; Costa, G.D.M.; dos Santos, R.C.; Filho, W.L.F.C.; Gois, G.; de Oliveira-Junior, J.F.; Teodoro, P.E.; Rossi, F.S.; Junior, C.A.D.S. The forests in the indigenous lands in Brazil in Peril. Land Use Policy 2020, 90, 104258. [Google Scholar] [CrossRef]
  3. Zimmerman, B.; Peres, C.A.; Malcolm, J.R.; Turner, T. Conservation and development alliances with the Kayapó of south-eastern Amazonia, a tropical forest indigenous people. Environ. Conserv. 2001, 28, 10–22. [Google Scholar] [CrossRef] [Green Version]
  4. Silva, E.C.D.A. Povos indígenas e o direito à terra na realidade brasileira. Serviço Soc. Soc. 2018, 480–500. [Google Scholar] [CrossRef]
  5. Welch, J.R.; Santos, R.V.; Flowers, N.M.; Coimbra, C.E.A., Jr. Na primeira margem do rio: Território e ecologia do povo xavante de wedezé. Cad. Public Health 2013, 30, 248. [Google Scholar]
  6. De Melo, M.M.; Saito, C.H. The practice of burning savannas for hunting by the xavante Indians based on the stars and constellations. Soc. Nat. Resour. 2013, 26, 478–487. [Google Scholar] [CrossRef]
  7. Strassburg, B.B.N.; Brooks, T.; Feltran-Barbieri, R.; Iribarrem, A.; Crouzeilles, R.; Loyola, R.; Latawiec, A.E.; Oliveira Filho, F.J.B.; De Scaramuzza, C.A.M.; Scarano, F.R.; et al. Moment of truth for the Cerrado hotspot. Nat. Ecol. Evol. 2017, 1, 99. [Google Scholar] [CrossRef]
  8. Barbieri, A.R.M.; Szabó, M.P.J.; Costa, F.B.; Martins, T.F.; Soares, H.S.; Pascoli, G.; Torga, K.; Saraiva, D.G.; Ramos, V.N.; Osava, C.; et al. Species richness and seasonal dynamics of ticks with notes on rickettsial infection in a natural park of the Cerrado biome in Brazil. Ticks Tick. Borne. Dis. 2019, 10, 442–453. [Google Scholar] [CrossRef] [PubMed]
  9. Neary, D.G.; Ryan, K.C.; DeBano, L.F. Wildland Fire in Ecosystems, Effects of Fire on Soil and Water; USDA-FS General Technical Report; U.S. Department of Agriculture, Forest Service, Rocky Mountain Research Station: Ogden, UT, USA, 2005; Volume 4, 250p, ISBN 9704981392.
  10. Fiedler, N.C.; Nuno, I.; De Azevedo, C.; De Medeiros, M.B.; Venturoil, F. Efeito de incêndios florestais na estrutura E composição effect of fire onthe structure and floristic composition of a Cerrado sensu stricto area in fazenda água limpa-Df. Rev. Árvore 2002, 28, 129–138. [Google Scholar] [CrossRef] [Green Version]
  11. Gomes, L.; Miranda, H.S.; Bustamante, M.M.D.C. How can we advance the knowledge on the behavior and effects of fire in the Cerrado biome? For. Ecol. Manag. 2018, 417, 281–290. [Google Scholar] [CrossRef]
  12. Bendini, H.D.N.; Garcia Fonseca, L.M.; Schwieder, M.; Sehn Körting, T.; Rufin, P.; Del Arco Sanches, I.; Leitão, P.J.; Hostert, P. Detailed agricultural land classification in the Brazilian Cerrado based on phenological information from dense satellite image time series. Int. J. Appl. Earth Obs. Geoinf. 2019, 82, 101872. [Google Scholar] [CrossRef]
  13. Machado, R.B.; Neto, M.G.P.; Caldas, E.F.; Gonçalves, D.A.; Santos, N.A.; Tabor, K.; Steininger, M. Estimativas de perda da área do Cerrado Brasileiro. Int. Bras. 2004, 1–23. [Google Scholar] [CrossRef] [Green Version]
  14. Cairney, J.W.G.; Bastias, B.A. Slash burning, faunal composition, and nutrient dynamics in a Eucalyptus grandis plantation in South Africathis. Article is one of a selection of papers published in the special forum on towards sustainable forestry—The living soil: Soil biodiversity and functions. Can. J. For. Res. 2007, 37, 226–235. [Google Scholar] [CrossRef]
  15. Jesús, S.-M.-A.; Schulte, E.; Schmuck, G.; Camia, A.; Strobl, P.; Liberta, G.; Giovando, C.; Boca, R.; Sedano, F.; Kempeneers, P.; et al. Comprehensive monitoring of wildfires in Europe: The European forest fire information system (EFFIS). In Approaches to Managing Disaster—Assessing Hazards, Emergencies and Disaster Impacts; Tiefenbacher, P.J., Ed.; IntechOpen: London, UK, 2012; pp. 87–108. ISBN 978-953-51-0294-6. [Google Scholar]
  16. Pausas, J.G.; Vallejo, V.R. The role of fire in European Mediterranean ecosystems. In Remote Sensing of Large Wildfires in the European Mediterranean Basin; Springer: Berlin/Heidelberg, Germany, 1999; pp. 3–16. [Google Scholar]
  17. French, N.H.F.; Kasischke, E.S.; Williams, D.G. Variability in the emission of carbon-based trace gases from wildfire in the Alaskan boreal forest. J. Geophys. Res. 2003, 108, 8151. [Google Scholar] [CrossRef]
  18. Gomes, L.; Miranda, H.S.; Silvério, D.V.; Bustamante, M.M.C. Effects and behaviour of experimental fires in grasslands, savannas, and forests of the Brazilian Cerrado. For. Ecol. Manag. 2020, 458, 8. [Google Scholar] [CrossRef]
  19. Pettorelli, N.; Vik, J.O.; Mysterud, A.; Gaillard, J.M.; Tucker, C.J.; Stenseth, N.C. Using the satellite-derived NDVI to assess ecological responses to environmental change. Trends Ecol. Evol. 2005, 20, 503–510. [Google Scholar] [CrossRef] [PubMed]
  20. Tagliabue, G.; Panigada, C.; Celesti, M.; Cogliati, S.; Colombo, R.; Migliavacca, M.; Rascher, U.; Rocchini, D.; Schüttemeyer, D.; Rossini, M. Sun–induced fluorescence heterogeneity as a measure of functional diversity. Remote Sens. Environ. 2020, 247, 111934. [Google Scholar] [CrossRef]
  21. Tian, F.; Brandt, M.; Liu, Y.Y.; Verger, A.; Tagesson, T.; Diouf, A.A.; Rasmussen, K.; Mbow, C.; Wang, Y.; Fensholt, R. Remote sensing of vegetation dynamics in drylands: Evaluating vegetation optical depth (VOD) using AVHRR NDVI and in situ green biomass data over West African Sahel. Remote Sens. Environ. 2016, 177, 265–276. [Google Scholar] [CrossRef] [Green Version]
  22. Wimberly, M.C.; Reilly, M.J. Assessment of fire severity and species diversity in the southern Appalachians using landsat TM and ETM+ imagery. Remote Sens. Environ. 2007, 108, 189–197. [Google Scholar] [CrossRef] [Green Version]
  23. Giglio, L.; Loboda, T.; Roy, D.P.; Quayle, B.; Justice, C.O. An active-fire based burned area mapping algorithm for the MODIS sensor. Remote Sens. Environ. 2009, 113, 408–420. [Google Scholar] [CrossRef]
  24. Dalponte, M.; Marzini, S.; Solano-Correa, Y.T.; Tonon, G.; Vescovo, L.; Gianelle, D. Mapping forest windthrows using high spatial resolution multispectral satellite images. Int. J. Appl. Earth Obs. Geoinf. 2020, 93, 102206. [Google Scholar] [CrossRef]
  25. Harris, S.; Veraverbeke, S.; Hook, S. Evaluating spectral indices for assessing fire severity in chaparral ecosystems (Southern California) using modis/aster (MASTER) airborne simulator data. Remote Sens. 2011, 3, 2403–2419. [Google Scholar] [CrossRef] [Green Version]
  26. Justice, C.O.; Townshend, J.R.G.; Vermote, E.F.; Masuoka, E.; Wolfe, R.E.; Saleous, N.; Roy, D.P.; Morisette, J.T. An overview of MODIS land data processing and product status. Remote Sens. Environ. 2002, 83, 3–15. [Google Scholar] [CrossRef]
  27. Roy, D.P.; Boschetti, L.; Trigg, S.N. Remote sensing of fire severity: Assessing the performance of the normalized burn ratio. IEEE Geosci. Remote Sens. Lett. 2006, 3, 112–116. [Google Scholar] [CrossRef] [Green Version]
  28. Crimmins, T.M.; Crimmins, M.A.; David Bertelsen, C. Complex responses to climate drivers in onset of spring flowering across a semi-arid elevation gradient. J. Ecol. 2010, 98, 1042–1051. [Google Scholar] [CrossRef]
  29. Meier, G.A.; Brown, J.F.; Evelsizer, R.J.; Vogelmann, J.E. Phenology and climate relationships in aspen (Populus tremuloides Michx.) forest and woodland communities of southwestern Colorado. Ecol. Indic. 2015, 48, 189–197. [Google Scholar] [CrossRef]
  30. De Jong, R.; Verbesselt, J.; Schaepman, M.E.; De Bruin, S. Trend changes in global greening and browning: Contribution of short-term trends to longer-term change. Glob. Chang. Biol. 2012, 18, 642–655. [Google Scholar] [CrossRef]
  31. Forkel, M.; Carvalhais, N.; Verbesselt, J.; Mahecha, M.D.; Neigh, C.S.R.; Reichstein, M. Trend change detection in NDVI time series: Effects of inter-annual variability and methodology. Remote Sens. 2013, 5, 2113–2144. [Google Scholar] [CrossRef] [Green Version]
  32. Abdi, O.; Kamkar, B.; Shirvani, Z.; Silva, J.A.T.; Buchroithner, M.F. Spatial-statistical analysis of factors determining forest fires: A case study from Golestan, Northeast Iran. Geomat. Nat. Hazards Risk 2018, 9, 267–280. [Google Scholar] [CrossRef] [Green Version]
  33. Mota, P.H.S.; Rocha, S.J.S.S.; Castro, N.L.M.; Marcatti, G.E.; França, L.C.J.; Schettini, B.L.S.; Villanova, P.H.; Santos, H.T.; Santos, A.R. Forest fire hazard zoning in Mato Grosso state, Brazil. Land Use Policy 2019, 88, 104206. [Google Scholar] [CrossRef]
  34. Alvares, C.A.; Stape, J.L.; Sentelhas, P.C.; de Moraes Gonçalves, J.L.; Sparovek, G. Köppen’s climate classification map for Brazil. Meteorol. Z. 2013, 22, 711–728. [Google Scholar] [CrossRef]
  35. NASA MODIS—Moderate Resolution Imaging Spectroradiometer. Available online: https://modis.gsfc.nasa.gov/about/design.php (accessed on 2 January 2021).
  36. Didan, K.; Munoz, A.B.; Solano, R.; Huete, A. MODIS Vegetation Index User ’s Guide (Collection 6); The University of Arizona: Tucson, AZ, USA, 2015. [Google Scholar]
  37. JAXA—Japan Aerospace Exploration Agency Tropical Rainfall Measuring Mission (TRMM). Available online: https://global.jaxa.jp/projects/sat/trmm/ (accessed on 1 February 2020).
  38. Boschetti, L.; Roy, D.; Hoffman, A.A.; Humber, M. MODIS Collection 5 Burned Area Product MCD45. Version 1. 2015. Available online: https://modis-fire.umd.edu/files/MODIS_Burned_Area_Collection51_User_Guide_3.1.0.pdf (accessed on 25 March 2022).
  39. Mann, H.B. Nonparametric tests against trend. Econometrica 1945, 13, 245. [Google Scholar] [CrossRef]
  40. Kendall, M.G. Rank Correlation Measures, 4th ed.; Charles Griffin: London, UK, 1975; ISBN 0195208374. [Google Scholar]
  41. Beurs, K.M.; Wright, C.K.; Henebry, G.M. Dual scale trend analysis for evaluating climatic and anthropogenic effects on the vegetated land surface in Russia and Kazakhstan. Environ. Res. Lett. 2009, 4, 45012. [Google Scholar] [CrossRef]
  42. Santos, G.M.; Melendez-Pastor, I.; Navarro-Pedreño, J.; Koch, M. Assessing water availability in Mediterranean regions affected by water conflicts through MODIS data time series analysis. Remote Sens. 2019, 11, 1355. [Google Scholar] [CrossRef] [Green Version]
  43. Schulze, E. Vapor exchange in response to drought in the atmosphere and in the soil 1. Plant Physiol. 1986, 37, 247–274. [Google Scholar] [CrossRef]
  44. Huete, A.R.; Didan, K.; Shimabukuro, Y.E.; Ratana, P.; Saleska, S.R.; Hutyra, L.R.; Yang, W.; Nemani, R.R.; Myneni, R. Amazon rainforests green-up with sunlight in dry season. Geophys. Res. Lett. 2006, 33, 2–5. [Google Scholar] [CrossRef] [Green Version]
  45. Wang, J.; Rich, P.M.; Price, K.P. Temporal responses of NDVI to precipitation and temperature in the central great plains, USA. Int. J. Remote Sens. 2003, 24, 2345–2364. [Google Scholar] [CrossRef]
  46. Herrmann, S.M.; Anyamba, A.; Tucker, C.J. Recent trends in vegetation dynamics in the African Sahel and their relationship to climate. Glob. Environ. Chang. 2005, 15, 394–404. [Google Scholar] [CrossRef]
  47. Hulme, M. Climatic perspectives on Sahelian desiccation: 1973–1998. Glob. Environ. Chang. 2001, 11, 19–29. [Google Scholar] [CrossRef] [Green Version]
  48. Archibald, S.; Scholes, R.J. Leaf green-up in a semi-arid African Savanna: Separating tree and grass responses to environmental cues. J. Veg. Sci. 2007, 18, 583–594. [Google Scholar] [CrossRef]
  49. Bucci, S.J.; Scholz, F.G.; Goldstein, G.; Meinzer, F.C.; Franco, A.C.; Zhang, Y.; Hao, G.Y. Water relations and hydraulic architecture in Cerrado trees: Adjustments to seasonal changes in water availability and evaporative demand. Braz. J. Plant Physiol. 2008, 20, 233–245. [Google Scholar] [CrossRef]
  50. Correia Filho, W.L.F.; Oliveira-Júnior, J.F.; Barros Santiago, D.; Bodas Terassi, P.M.; Teodoro, P.E.; De Gois, G.; Blanco, C.J.C.; De Almeida Souza, P.H.; da Silva Costa, M.; Gomes, H.B.; et al. Rainfall variability in the Brazilian northeast biomes and their interactions with meteorological systems and ENSO via CHELSA product. Big Earth Data 2019, 3, 315–337. [Google Scholar] [CrossRef] [Green Version]
  51. Richardson, A.D.; Andy Black, T.; Ciais, P.; Delbart, N.; Friedl, M.A.; Gobron, N.; Hollinger, D.Y.; Kutsch, W.L.; Longdoz, B.; Luyssaert, S.; et al. Influence of spring and autumn phenological transitions on forest ecosystem productivity. Philos. Trans. R. Soc. B Biol. Sci. 2010, 365, 3227–3246. [Google Scholar] [CrossRef] [Green Version]
  52. Gallinat, A.S.; Primack, R.B.; Wagner, D.L. Autumn, the neglected season in climate change research. Trends Ecol. Evol. 2015, 30, 169–176. [Google Scholar] [CrossRef]
  53. Kong, D.; Miao, C.; Wu, J.; Zheng, H.; Wu, S. Time lag of vegetation growth on the loess plateau in response to climate factors: Estimation, distribution, and influence. Sci. Total Environ. 2020, 744, 140726. [Google Scholar] [CrossRef]
  54. Kuntschik, G. Estimativa de Biomassa Vegetal Lenhosa Em Cerrado Por Meio de Sensoriamento Remoto Óptico e de Radar. Ph.D. Thesis, Universidade de São Paulo, São Paulo, Brazil, 2004. [Google Scholar]
  55. Liu, Y.; Hill, M.J.; Zhang, X.; Wang, Z.; Richardson, A.D.; Hufkens, K.; Filippa, G.; Baldocchi, D.D.; Ma, S.; Verfaillie, J.; et al. Using data from landsat, MODIS, VIIRS and phenocams to monitor the phenology of California oak/grass savanna and open grassland across spatial scales. Agric. For. Meteorol. 2017, 237–238, 311–325. [Google Scholar] [CrossRef]
  56. Derner, J.D.; Hess, B.W.; Olson, R.A.; Schuman, G.E. Functional group and species responses to precipitation in three semi-arid rangeland ecosystems. Arid Land Res. Manag. 2008, 22, 81–92. [Google Scholar] [CrossRef]
  57. Herrera, M.C.P.; Correa, C.A.P. An Assessment of El Niño and La Niña impacts focused on monthly and seasonal rainfall and extreme dry/precipitation events in mountain regions of Colombia and México. Adv. Geosci. 2016, 42, 23–33. [Google Scholar] [CrossRef] [Green Version]
  58. Klink, C.A.; Solbrig, O.T. Efeito do fogo na biodiversidade de plantas do Cerrado. In Biodiversidad y Funcionamiento de Pastizales y Sabanas en America Latina; Sarmiento, G., Cabido, M., Eds.; Cyted y Cielat: Merida, Venezuela, 1996; pp. 231–244. [Google Scholar]
  59. Miranda, H.S.; Bustamante, M.M.C.; Miranda, A.C. The fire factor. In The Cerrados of Brazil: Ecology and Natural History of a Neotropical Savanna; Columbia University Press: Chichester, UK, 2002; pp. 51–68. ISBN 0231120427. [Google Scholar]
  60. Schmidt, M.W.I.; Torn, M.S.; Abiven, S.; Dittmar, T.; Guggenberger, G.; Janssens, I.A.; Kleber, M.; Kögel-Knabner, I.; Lehmann, J.; Manning, D.A.C.; et al. Persistence of soil organic matter as an ecosystem property. Nature 2011, 478, 49–56. [Google Scholar] [CrossRef] [PubMed] [Green Version]
  61. Durigan, G. Zero-fire: Not possible nor desirable in the Cerrado of Brazil. Flora Morphol. Distrib. Funct. Ecol. Plants 2020, 268, 151612. [Google Scholar] [CrossRef]
  62. Mayaux, P.; Holmgren, P.; Achard, F.; Eva, H.D.; Stibig, H.-J.J.; Branthomme, A. Tropical forest cover change in the 1990s and options for future monitoring. Philos. Trans. R. Soc. Lond. B. Biol. Sci. 2005, 360, 373–384. [Google Scholar] [CrossRef] [Green Version]
  63. Moreira, T.R.; Ferreira, S.; Marques, S.; Souza, K.B.; Senhorelo, A.P.; Heitor, F.D.; Parajara, C.; Ribeiro, W.R.; Gonçalves, M.S.; Pinheiro, A.A.; et al. Thermal favorability for the Oidium caricae and Asperisporium caricae in areas of edaphoclimatic aptitude for the Carica papaya. J. Therm. Biol. 2020, 92, 45. [Google Scholar] [CrossRef]
  64. Pirovani, D.B.; Pezzopane, J.E.M.; Xavier, A.C.; Pezzopane, J.R.M.; Jesus Júnior, W.C.; Machuca, M.A.H.; Santos, G.M.A.D.A.; Silva, S.F.; Almeida, S.L.H.; Oliveira Peluzio, T.M.; et al. Climate change impacts on the aptitude area of forest species. Ecol. Indic. 2018, 95, 405–416. [Google Scholar] [CrossRef]
  65. Santos, A.R.; Paterlini, E.M.; Fiedler, N.C.; Ribeiro, C.A.A.S.; Lorenzon, A.S.; Domingues, G.F.; Marcatti, G.E.; Castro, N.L.M.; Teixeira, T.R.; Santos, G.M.A.D.A.; et al. Fuzzy logic applied to prospecting for areas for installation of wood panel industries. J. Environ. Manag. 2017, 193, 345–359. [Google Scholar] [CrossRef] [PubMed]
  66. Santos, G.M.A.D.A.; Santos, A.R.; Teixeira, L.J.Q.; Saraiva, S.H.; Freitas, D.F.; Pereira, O.S.; Ribeiro, C.A.A.S.; Lorenzon, A.S.; Eugenio, F.C.; Neves, A.A.; et al. GIS applied to agriclimatological zoning and agrotoxin residue monitoring in tomatoes: A case study in Espírito Santo state, Brazil. J. Environ. Manag. 2016, 166, 429–439. [Google Scholar] [CrossRef] [PubMed]
  67. Ganteaume, A.; Jappiot, M. What causes large fires in Southern France. For. Ecol. Manag. 2013, 294, 76–85. [Google Scholar] [CrossRef] [Green Version]
  68. Argañaraz, J.P.; Landi, M.A.; Scavuzzo, C.M.; Bellis, L.M. Determining fuel moisture thresholds to assess wildfire hazard: A contribution to an operational early warning system. PLoS ONE 2018, 13, e0204889. [Google Scholar] [CrossRef] [Green Version]
  69. Lloret, F. Régimen de incendios y regeneración. In Ecología del Bosque Mediterráneo en un Mundo Cambiante; Mundo Cambiante: Madrid, Spain, 2004; pp. 101–126. [Google Scholar]
  70. Silva, F.A.M.; Evangelista, B.A.; Malaquias, J.V. Normal climatológica de 1974 a 2003 da estação principal da Embrapa Cerrados. Embrapa Cerrados Planaltina Doc. 2014, 321, 98. [Google Scholar]
  71. Archibald, S.; Lehmann, C.E.R.; Gómez-Dans, J.L.; Bradstock, R.A. Defining pyromes and global syndromes of fire regimes. Proc. Natl. Acad. Sci. USA 2013, 110, 6442–6447. [Google Scholar] [CrossRef] [Green Version]
  72. Argañaraz, J.P.; Pizarro, G.G.; Zak, M.; Bellis, L.M. Fire regime, climate, and vegetation in the Sierras de Córdoba, Argentina. Fire Ecol. 2015, 11, 55–73. [Google Scholar] [CrossRef]
  73. Bradstock, R.A. A biogeographic model of fire regimes in Australia: Current and future implications. Glob. Ecol. Biogeogr. 2010, 19, 145–158. [Google Scholar] [CrossRef]
  74. Ponzoni, F.J.; Shimabukuro, Y.E.; Kuplich, T.M. Sensoriamento Remoto Da Vegetação, 2nd ed.; Oficina de Textos: São Paulo, Brazil, 2012; ISBN 978-85-7975-053-3. [Google Scholar]
  75. Becerra, J.A.B.; Shimabukuro, Y.E.; Alvalá, R.C.S. Relação do padrão sazonal da vegetação com a precipitação na região de Cerrado da Amazônia legal, usando índices espectrais de vegetação. Rev. Bras. Meteorol. 2009, 24, 125–134. [Google Scholar] [CrossRef] [Green Version]
  76. Rossatto, D.R.; Kolb, R.M.; Franco, A.C. Leaf anatomy is associated with the type of growth form in neotropical savanna plants. Botany 2015, 93, 507–518. [Google Scholar] [CrossRef]
  77. Kenzo, T.; Ichie, T.; Watanabe, Y.; Hiromi, T. Ecological distribution of homobaric and heterobaric leaves in tree species of malaysian lowland tropical rainforest. Am. J. Bot. 2007, 94, 764–775. [Google Scholar] [CrossRef]
  78. Scholz, F.G.; Bucci, S.J.; Goldstein, G.; Moreira, M.Z.; Meinzer, F.C.; Domec, J.C.; Villalobos-Vega, R.; Franco, A.C.; Miralles-Wilhelm, F. Biophysical and life-history determinants of hydraulic lift in neotropical savanna trees. Funct. Ecol. 2008, 22, 773–786. [Google Scholar] [CrossRef]
  79. Castro, E.A.; Kauffman, J.B. Ecosystem structure in the Brazilian Cerrado: A vegetation gradient of aboveground biomass, root mass and consumption by fire. J. Trop. Ecol. 1998, 14, 263–283. [Google Scholar] [CrossRef]
  80. Ribeiro, S.C.; Fehrmann, L.; Soares, C.P.B.; Jacovine, L.A.G.; Kleinn, C.; de Oliveira Gaspar, R. Above- and belowground biomass in a Brazilian Cerrado. For. Ecol. Manag. 2011, 262, 491–499. [Google Scholar] [CrossRef]
  81. Veraverbeke, S.; Gitas, I.; Katagis, T.; Polychronaki, A.; Somers, B.; Goossens, R. Assessing post-fire vegetation recovery using red-near infrared vegetation indices: Accounting for background and vegetation variability. ISPRS J. Photogramm. Remote Sens. 2012, 68, 28–39. [Google Scholar] [CrossRef] [Green Version]
  82. Coutinho, L.M. O Bioma do Cerrado. In Eugen Warming e o Cerrado Brasileiro: Um Século Depois; Editora da UNESP: São Paulo, Brazil, 2000; pp. 77–91. ISBN 8571394849. [Google Scholar]
  83. Wagner, A.P.L.; Fontana, D.C.; Fraisse, C.W.; Weber, E.J.; Hasenack, H. Tendências temporais de índices de vegetação nos campos do pampa do Brasil e do Uruguai. Pesqui. Agropecuária Bras. 2013, 48, 1192–1200. [Google Scholar] [CrossRef] [Green Version]
  84. Eastman, R.J.; Sangermano, F.; Ghimire, B.; Zhu, H.; Chen, H.; Neeti, N.; Cai, Y.; Machado, E.A.; Crema, S.C. Seasonal trend analysis of image time series. Int. J. Remote Sens. 2009, 30, 2721–2726. [Google Scholar] [CrossRef]
  85. Chen, B.; Xu, G.; Coops, N.C.; Ciais, P.; Innes, J.L.; Wang, G.; Myneni, R.B.; Wang, T.; Krzyzanowski, J.; Li, Q.; et al. Changes in vegetation photosynthetic activity trends across the Asia-Pacific region over the last three decades. Remote Sens. Environ. 2014, 144, 28–41. [Google Scholar] [CrossRef]
Figure 1. Aerial images of the Tapirapé Indigenous Territory, Urubu Branco village. (a,b) Variations in typical vegetation of the denser Cerrado; (c) transition zone between dense Cerrados and sparse and rocky Cerrados; (d) during the acquisition of representative images of the study area, occurrence of forest fires was observed.
Sustainability 14 06919 g001
Figure 2. Aerial images of the Tapirapé Indigenous Territory, Urubu Branco village. (a,b) The different phytophysiognomies found in the same biome, the transition from dense Cerrado to sparse Cerrado; (c) the extremity of the Indigenous territory (the border is represented by the trail in the middle of the forest) is already surrounded by agricultural properties where soy, corn and sesame are planted; (d) during the acquisition of representative images of the study area, occurrence of forest fires was observed.
Sustainability 14 06919 g002
Figure 3. Indigenous lands located in Cerrado-Amazonia Ecotone of Mato Grosso state, Brazil.
Sustainability 14 06919 g003
Figure 4. Methodological flowchart containing the steps necessary for spatialization of vegetation dynamics and its relationship with forest fires, which include: (1) database acquisition; (2) pre-processing; (3) partial results; (4) processing; (5) statistics; (6) generated results.
Sustainability 14 06919 g004
Figure 5. Correlation (R) and coefficients of determination (R2) of the analyzed variables. (a) R value for Vegetation Index (dependent) and Precipitation (independent), lag +1; (b) R2 value for Vegetation Index (dependent) and Precipitation (independent), lag +1; (c) R value for Burnt Area (dependent) and Vegetation Index (independent), lag −1; (d) R2 value for Burnt Area (dependent) and Vegetation Index (independent), lag −1; (e) R value for Burnt Area (dependent) and Precipitation (independent), lag 0; (f) R2 value for Burnt Area (dependent) and Precipitation (independent), lag 0.
Sustainability 14 06919 g005
Figure 6. Profile of positive (a,b) and negative (c,d) anomalies of the Vegetation Index in the study area along the analyzed period (2007 to 2016).
Sustainability 14 06919 g006
Figure 7. Profile of negative (a,b) and positive (c,d) Precipitation anomalies in the study area, from 2007 to 2016.
Sustainability 14 06919 g007
Figure 8. Profile of negative (a,b) and positive (c,d) anomalies of Burnt Area in the study area, between 2007 and 2016.
Sustainability 14 06919 g008
Table 1. MOD13Q1 product pixel reliability and description.
Pixel ValueQualityDescriptionAssigned Value after Reclassification
0Good DataHigh degree of reliability0
1Marginal dataCan be used, but look at other quality information0
2Snow and iceTarget covered with ice or snowNoData
3CloudsData affected by the presence of cloudsNoData
Source: Adapted from [36].
Publisher’s Note: MDPI stays neutral with regard to jurisdictional claims in published maps and institutional affiliations.

