1. Introduction
Information is an essential ingredient in ensuring that stakeholders place trust in a firm, thus providing the firm with a market, capital and legitimacy. A critical point in this regard is symmetry in the distribution of information among agents. Asymmetric information, defined as the situation in which one of the parties involved in a transaction has different information than the other about what has been negotiated, has been recognized as a key element of the agency problem [
1]. Digitization is another force that has been linked to information asymmetries, usually in the context of highlighting its positive contribution to creating more transparent markets [
2]. However, the effect of information asymmetries on the competitive dynamics of the markets has received very little attention. At most, the resource-based view (RBV) has shown the benefits of investing in information assets which have the characteristics of strategic factors and which help increase the information asymmetries in real markets in order to exploit competitive advantages [
3,
4]. This approach thus focuses on information asymmetries between competitors and above all on undisclosed information. However, there is still a significant gap in the understanding of the competitive impact of the heterogeneous distribution of information to stakeholders and the actions undertaken to improve the transparency of the information about the firm in market and non-market environments. This article examines the effects of information asymmetries versus information transparency on the competitive strength of the firm. To that end, it centres on the wealth of tacit knowledge and the digital structure of the different types of disclosed information.
Modern society calls for firms to show an ever-stronger commitment to information transparency, leading to wholesale structural change [
2]. A more transparent firm needs appropriate reporting systems that transmit the required information about its strategies, practices, and outcomes in the broader context of its business strategy and social and environmental responsibility, to related interest groups [
5]. There is an extensive literature that studies the independent effects of information practices on business outcomes but not their comparative effects. The first contribution made by this paper is to present new empirical evidence for the value-creation potential of the information a firm discloses to external stakeholders, to distinguish this information according to its nature and intensity, and highlight the central role that corporate reputation plays in this process.
Along with the call for greater information transparency, the adequacy and reliability of disclosed financial information has been questioned [
6,
7,
8,
9]. Given the loss of relevance of the financial information disclosed in compliance with legal obligations, firms have come under pressure to provide additional, non-financial information to meet the various demands of the different stakeholders [
10]. This social demand for more non-financial information has centred first on extending the financial-related information in the public registries [
11,
12], before seeking to bolster the corporate and institutional information that the firm distributes via various media, as well as the conversations it has over the internet. However, there is still a notable lack of understanding of the impact on competitiveness and performance resulting from this increase in non-financial information disclosed by firms. This research clarifies the different strategic value of financial and non-financial information disclosure practices. Specifically, this study adds another variable to the collection of explanatory variables for financing capacity; namely, the types of information that reduce the information asymmetries between the firm and the suppliers of capital.
The debate on the issue of information has been amplified by the transition from the industrial era to the information age [
13]. The penetration of the broad spectrum of information and communication technologies (ICTs) has led to intense intra- and inter-organizational information flows, and has therefore, been associated with improving market transparency and efficiency [
2]. However, few studies have addressed the consequences of this fact at a strategic level: in an environment of perfect information, it is impossible to achieve the sustainable competitive advantages that yield economic rents [
14]. A basic reading of the RBV indicates that perfect market transparency is an obstacle to achieving competitive advantage, whereas imperfect transparency offers an ideal field for creating it. ICT alone is not sufficient to convert information asymmetries into competitive asymmetries. A firm’s efforts to protect its information assets that are key to its competitive positioning in the markets [
15] lead to applications that are harder to access, and thus to markets becoming more complex and less transparent, despite the intensity of the information flows that pass through them. Competitive asymmetries are, therefore, linked to firms’ possession of complementary, co-specialized and hard-to-replicate sets of resources, used to form information management capabilities (IMC). The third contribution this study makes to the literature is the finding that the digitization of non-standardized corporate reporting could be behind the creation of favourable digital gaps for firms with a better endowment of these capabilities, which they can exploit to improve their reputation and achieve competitive advantages.
Advanced digitization, therefore, gives rise to a paradox since it can simultaneously foster information transparency and information asymmetry. The present study posits that the problem initially arises from overlooking the broad range of information asset types, whose strategic value and effect on market transparency depend on their very nature [
16]. Indeed, the final relevant contribution of this paper is to propose a taxonomy of the types of disclosed corporate information and to carry out a comparative analysis of their potential to improve competitive strength.
The structure of the Spanish tourism industry is highly fragmented in terms of market share. Therefore, given that the Spanish tourism industry a world leader, the keys to success do not lie in size but in competitive strategies that generate sustainable competitive advantages based on intangibles and innovation. The incorporation of ICT in the tourism industry has led to important structural changes in the business models of its leading companies, turning information management into a source of competitive advantage for tourism firms. This transformation was accelerated with the outbreak of COVID-19 in 2019, which motivated the tourism client to search for companies with better relationships through digital platforms that allow them to reduce risks and improve the shopping experience [
17]. This is particularly relevant given the intense nature of the tourist product as an asset of experience [
15] where competitive advantages arise from the informational asymmetries between the firm and the client.
2. Theoretical Framework & Hypotheses
Corporate information is defined as information disseminated outside of the firm in order to comply with regulatory obligations, to secure legitimacy and confidence, and to achieve social, public and political support for its activities [
16]. Three levels of corporate information can be identified according to the stakeholders it addresses and the channels it uses:
- (1)
Non-Standardized Corporate Information (NSCI) is communicated in a discretionary manner by the company and focuses on primary or secondary stakeholders that may affect the organization’s results.
- (2)
Standardized Corporate Information (SCI) is public information contained in standardized formats (e.g., quality certificates) and which is focused primarily on secondary stakeholders who are especially qualified to interpret specialized information.
- (3)
Accountability Information (ACI) is directed to public registry agencies for accounting information, whose purpose is to compile and disseminate financial information on companies in order to achieve greater transparency in capital markets.
This classification identifies different information categories with different potential as a source of competitive advantage, depending on their position along the datum-information-knowledge continuum [
16]. The asset with the lowest strategic value is the datum. The greatest wealth of data is found in ACI. As we move on to SCI, the data content reduces compared with the informational and cognitive content. The data content reaches its lowest value in the NSCI, which is the richest in tacit knowledge.
The analysis framework provided by the
RBV points to information asymmetries and the imperfect transparency of competitive advantage [
4,
18] as the key cause of competitive asymmetries. It thus emphasizes the strategic value of classified information as a source of information asymmetries as such information has the characteristics to generate and sustain competitive advantages; it also emphasizes the obstacle to them posed by transparent markets. There is a limitation to this transparency-information asymmetry paradox resulting from state-of-the-art ICT; namely, it does not take into account the potential effects that improved information transparency can have on a firm’s competitive position, under the premise that it incorporates perfect markets and market transparency, and therefore, does not offer opportunities for competitive advantage. This consideration does not address the compliance and agency problems that may arise with the absence of information transparency.
Compliance problems have traditionally been defined as those resulting from the irregular, insufficient or erroneous provision of legally-required information. However, the concept of compliance goes beyond legal compliance to cover prevention and observance of other non-legal standards which a firm has adopted voluntarily but which, once accepted, entail periodic audit processes to verify the firm’s adherence. This is the case with ISO standards, environmental standards, ethical codes, corporate governance codes and other process management and monitoring protocols [
19]. These initiatives oblige companies to report their practices and results, which are periodically analysed and validated, as a form of moral compliance. Thus, compliance fits within an overall transparency policy, which should lead to the implementation of corporate information management practices, such as those included in the SCI category. Organizational compliance is thus influenced by the SCI disclosed by the firm.
In turn,
agency problems can arise when the agent hides behind the lack of information transparency in order to evade their obligation to serve the interests of the principal in the best way possible, rather than pursuing of their own ends [
20,
21]. These are, therefore, situations that may occur when the principal contracts an agent under asymmetric information conditions [
21]. The risk of agency problems can be mitigated by, among other measures, information practices targeted at stakeholders to ensure control over the agent by means of symmetric information and the effectiveness of incentives to align the interests of the two parties in the contract. Agency costs will thus be determined by the stock of information assets of the three identified categories (NSCI, SCI and ACI).
The increased amount of information disclosed by a firm to stakeholders who do not have access to classified information—whether they be investors and regulators (ACI, NSCI), or institutions that monitor the quality of its processes, products and management systems (SCI)—can reduce compliance and agency problems. The greater information transparency between a firm and these pressure groups, which provide essential assets for the development of the business, can help it to acquire quality resources and capabilities of limited transferability in transactions where there is a high degree of uncertainty about the convergence of interests and questionable confidence in the integrity of the agent. Information transparency with the stakeholders can thus bring about indirect positive effects on a firm’s competitive strength through the capabilities based on compliance and the avoidance of agency problems.
The primary manifestation of the stakeholders’ assessment of a firm to which they are linked is its reputation [
22,
23]. Corporate reputation is an intangible asset built on the information that external interest groups glean about the company [
24,
25,
26], as well as the ability of the organization to meet their expectations [
27,
28]. The literature has extensively studied the positive influence that a firm’s social responsibility information has on corporate reputation, thanks to the improvement in the customers’ attitude towards it [
29,
30,
31,
32]. However, what remains unknown is the impact on corporate reputation of different types of external information resources which may present heterogeneous potential for competitive value.
NSCI is a key factor in building the corporate reputation defined in a firm’s communication strategy as it is the way to minimize the agency costs caused by information asymmetries with stakeholders. Recipients include both primary and secondary stakeholders. Most notable among the former are the clients. A strong component of the tourist product is its experiential attributes, whereby consumers’ value judgements are formed only after having received the provision of the service [
33] precisely because of its nature as a service firm [
34]. The client’s ex ante unfamiliarity with some of the characteristics of the product is the source of information asymmetries with the seller, who has full information; this could create an adverse selection problem, resulting in the supply of products of lower quality [
35], damaging client confidence and impeding sustainable growth [
36]. A firm does have some means of preventing adverse selection problems; for example, it can complement the market information with information related to other processes and activities in order to build an integrated, coherent image that focuses on the aspects the firm wants to highlight for strategic reasons, thus alleviating clients’ uncertainty about the products sold [
37]. Conversely, the secondary stakeholders form their perception of the firm exclusively from information circulating through external channels, and that which the organization itself discloses voluntarily or under obligation. Societal demand for increased information transparency has made it obligatory to ensure the visibility of corporate behaviour and results both through traditional channels as well as via the internet [
38]. Stakeholders’ moral credit and trust in firms requires the disclosure of relevant and accurate information that goes beyond accounting obligations to include social and environmental impacts [
39], as well as the establishment of effective mechanisms for stakeholders to access said information [
40].
The variety of recipients explains why a firm disseminates its NSCI through those channels where it can customize its message and tailor it to the needs of specific audiences. When using these channels, the recipient does not generally need to have any specific knowledge as it is the firm itself that breaks down the information into an understandable and easily interpretable format. A case in point is the dissemination of information through the firm’s corporate website or through electronic advertising and promotion channels. In any case, digitization plays a major role in the ability of this information to create value. The digitization of processes has radically transformed the way in which companies interact with consumers, with a growing presence of new digital corporate communication spaces and greater efforts to ensure the effective development of digitized messages. These changes have created unprecedented opportunities to optimize the customer’s experience. No less significant are the changes in how consumers find and consume these messages, along with the transformation of analogue documentation to digital format and the proliferation of new applications based on cloud computing services or social networks. The possibilities offered by ICT enable not only the optimal management of the relationships with the entire value chain, but also the creation of a unique, coherent digital corporate image, the extraction of information from customers and markets, and the conversion of that information into useful knowledge for the firm’s service, processes and product portfolio. As a result, NSCI based on integrated digitization of the firm’s image, visibility, responsibility, ethical issues and content (branding) will significantly increase the effectiveness of the information messages sent by the firm to its external stakeholders. The following hypothesis can thus be formulated:
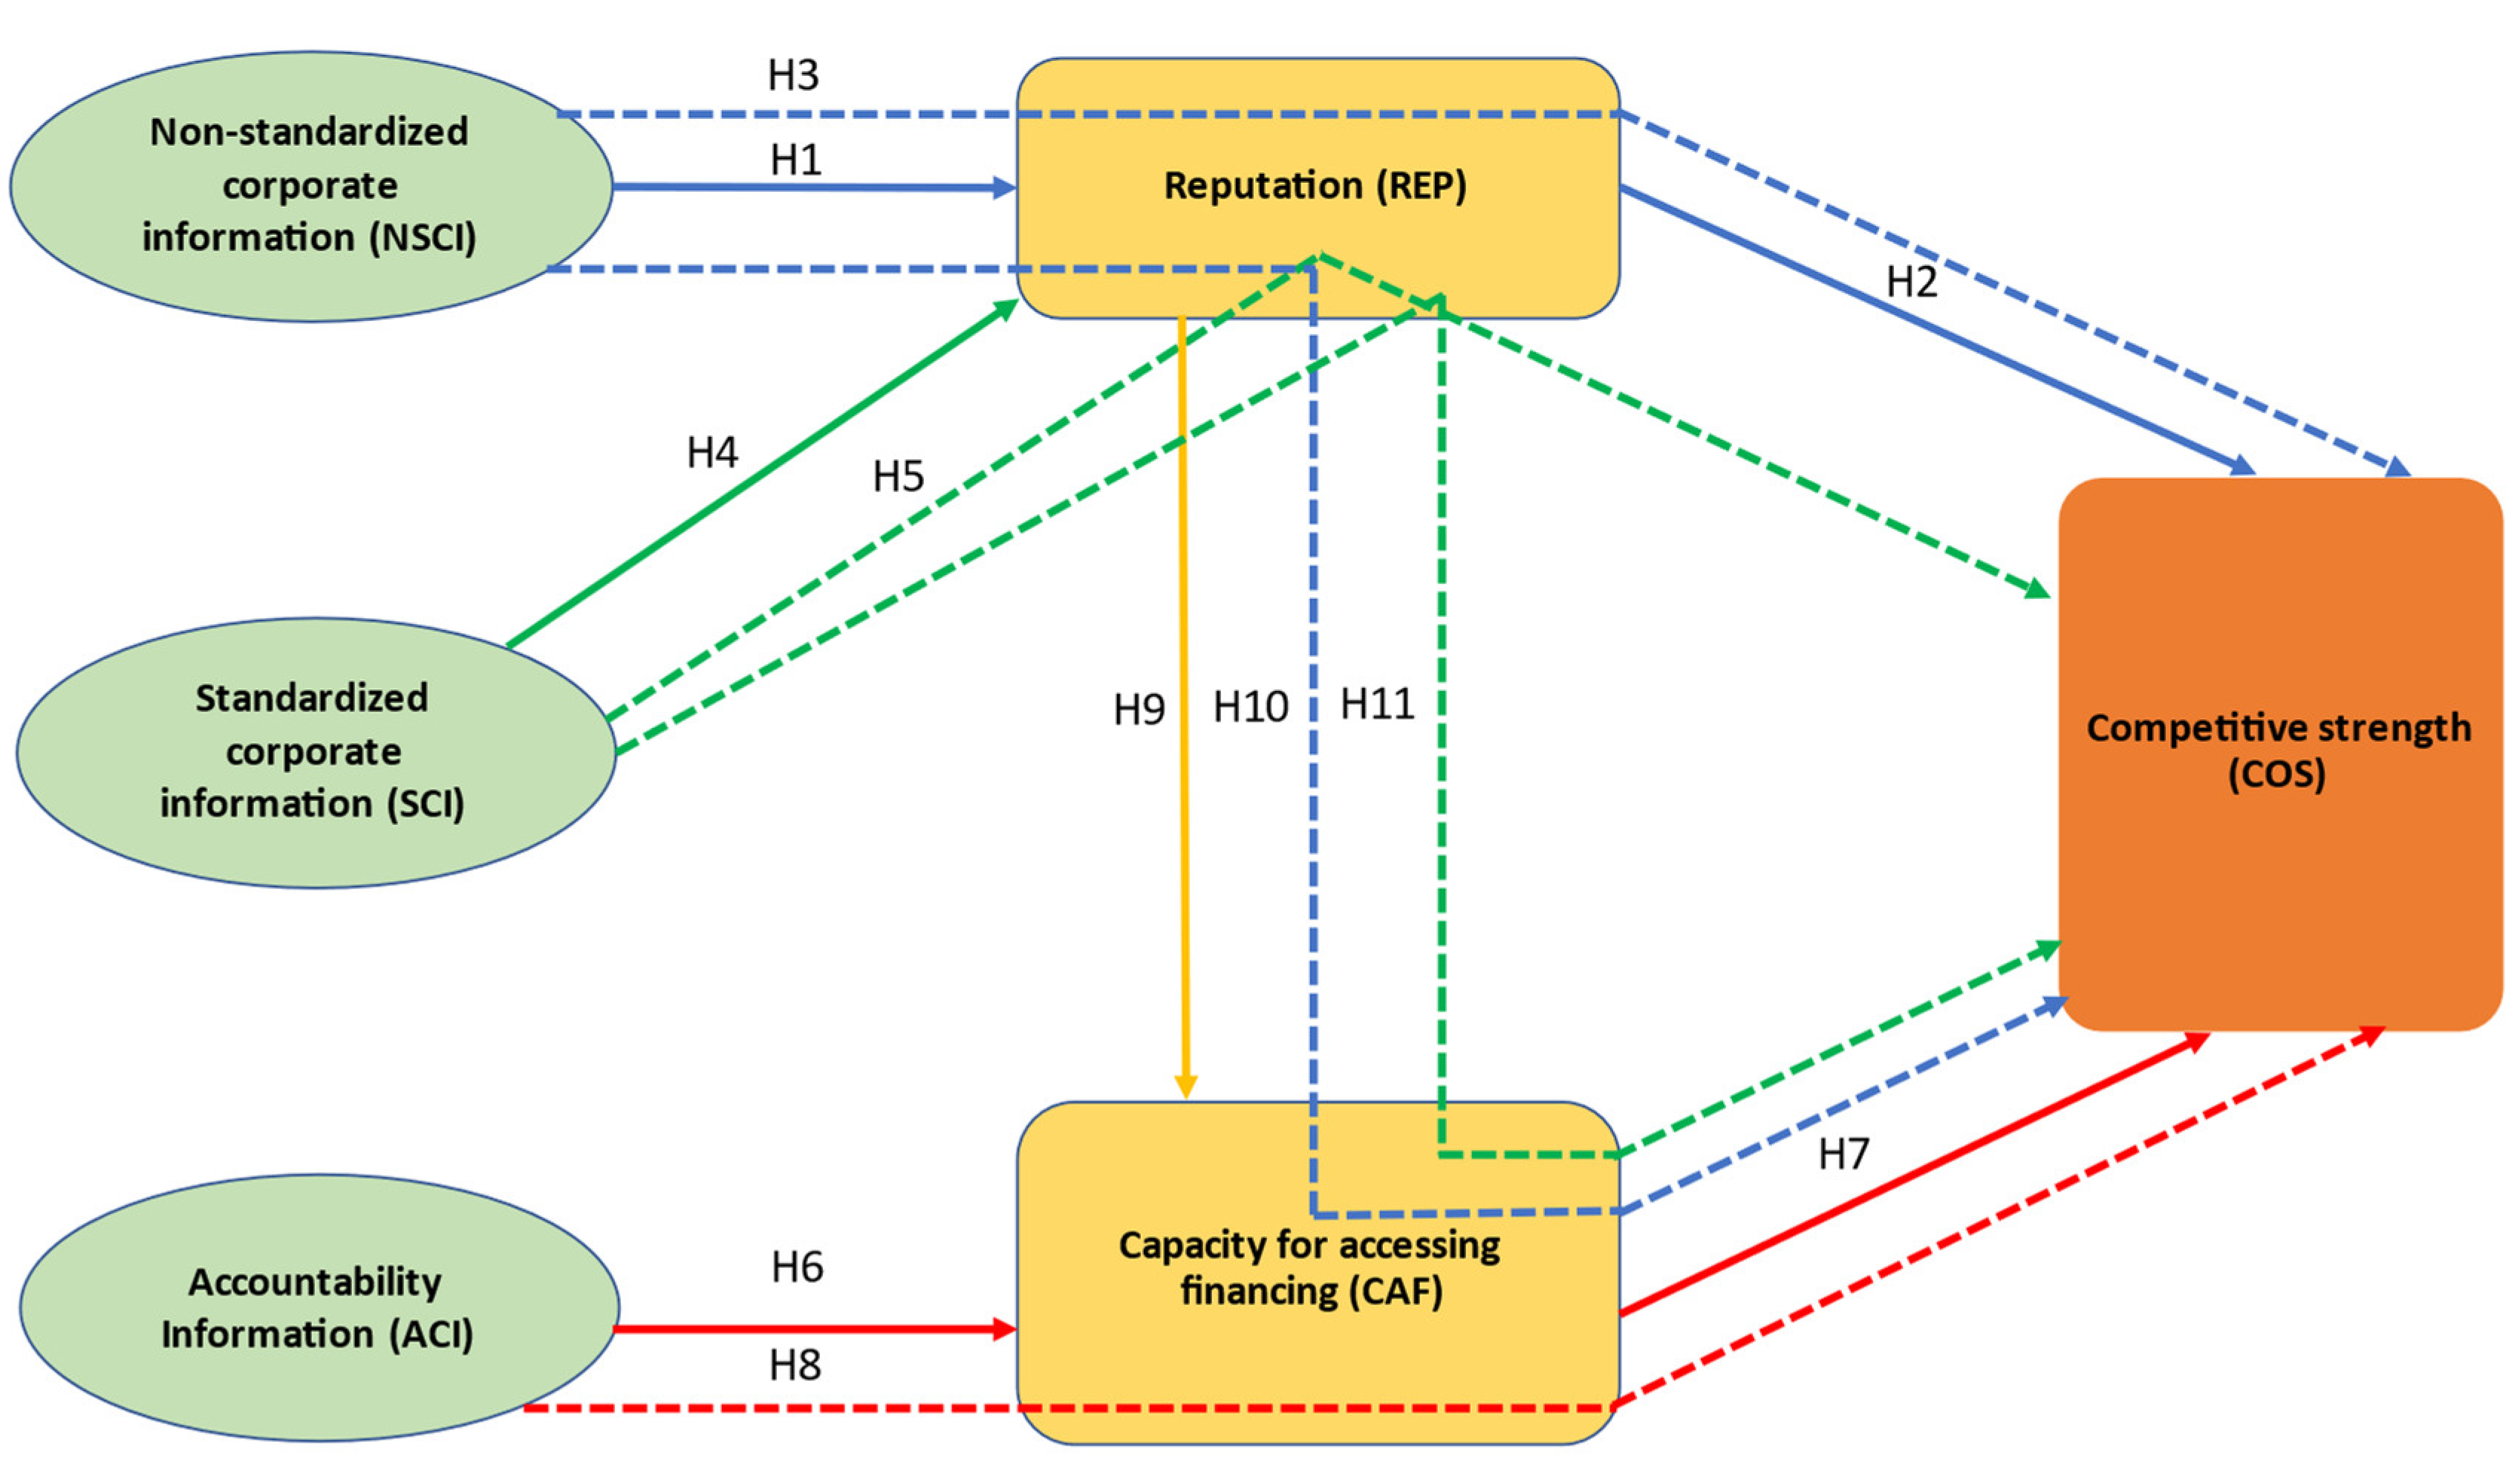
Hypothesis 1. There is a positive relationship between the information disclosed through NSCI using advanced digitization, and corporate reputation.
A good corporate reputation, in addition to being a rare and valuable intangible asset in all markets, is a strategic asset that is inimitable, non-substitutable and displays imperfect mobility; it thus combines all the properties needed to create and sustain a competitive advantage [
41]. This positive contribution is reinforced if we take into account the fact that a firm’s reputation is usually interpreted as an indicator of the underlying quality of its products, and that this perception of superior quality may allow a premium price to be set [
42,
43,
44]. The following hypothesis can therefore be proposed:
Hypothesis 2. There is a positive relationship between corporate reputation and competitive strength.
The integrated digitization of NSCI not only provides a springboard for improving corporate reputation, it also calls for, alongside technological familiarity with new tools, the development of new digital and analytical capabilities. In other words, in today’s world, a good reputation requires the deployment of new capabilities, without which the application of ICT is entirely ineffective. Indeed, the hypothesis of complementarity and co-specialization [
45,
46,
47,
48,
49] holds that ICT can provide the basis for sustainable competitive advantages when combined with other resources that are complementary, co-specialized and hard to replicate, as together they form idiosyncratic capabilities that are difficult to imitate.
The concept of information management capability (IMC) [
45] is an important contribution to the analysis of the strategic value of information [
50]. This capability refers to the set of valuable ICT-based resources, as well as to a firm’s ability to deploy these resources in human, managerial and organizational capabilities, usually in a coordinated way, to develop tasks or activities and to effectively manage information both internal and external to the organization. In the case of corporate reporting, a company that has implemented advanced digital NSCI systems and that manages to use these systems to ensure the salience of its corporate reputation in the market will have already successfully resolved the need to accumulate complementary and co-specialized resources. Among this set of resources that make NSCI a form of IMC are the digital solutions for managing client relations and corporate communication, as well as the firm’s accumulated explicit and tacit knowledge about products, prices, customers and markets. The transformation of NSCI into an IMC suggests that this information flow may be a source of competitive advantages. Therefore, we can postulate the existence of a direct positive effect of NSCI on competitive strength.
Corporate reputation is an intangible asset that is also built on the information issued by secondary stakeholders who develop their own campaigns that can work together or interfere with the corporate information issued by a firm. In other words, there is tacit knowledge distributed among different actors which a firm does not control and which can even cancel out the positive contributions to a firm’s competitive strength resulting from information transparency with the market. Therefore, a firm that manages to transform its NSCI into an IMG may have gained the capacity to influence its entire network of external stakeholders. This would allow it to effectively manage the interpretation of the information it discloses, reinforce trust in the reliability of that information, and widely broadcast the positive assessments expressed by opinion-makers among a large group of followers. Cultivating this credibility requires complex efforts over an extended period of time to demonstrate the honesty of the firm and the reliability of its products. In light of the above arguments, an additional hypothesis can be proposed:
Hypothesis 3. There is a positive relationship between the information disclosed through NSCI and competitive strength, which is partially mediated by corporate reputation.
One aim of standardized corporate information (SCI) is to monitor firms’ regulatory compliance and the administration of accreditation seals and logos for certain certifications. Therefore, the extent of the SCI provided is directly related to a firm’s degree of compliance. In this case, the format of the message is not discretionary; rather the firm is obliged to comply with information requirements stipulated in predefined structures, contents, and production and disclosure processes. Nevertheless, certification can lead to a substantial competitive difference. With SCI incorporated into quality certification, a firm is essentially buying from the certifier an indisputable reputation that it cannot by itself offer to its clients. Certification thus becomes an efficient way of solving the problem of information asymmetry stemming from a product’s confidence attributes. A firm will adopt SCI practices that enjoy a wider social consensus, as it believes they confer greater legitimacy by better satisfying the expectations of the relevant groups [
51]. In light of the above, the following hypothesis can be formulated:
Hypothesis 4. There is a positive relationship between the information disclosed through the SCI and corporate reputation.
Conversely, no significant direct relationship is expected between SCI and a firm’s competitive position. The information reported by a firm to publicize its legal responsibility and its compliance with the commitments required for certification and disseminate information about its economic, social and environmental responsibility may positively influence corporate reputation. However, without this improvement to its reputation, signalling the quality of corporate behaviour does not offer the firm sufficient differentiation to ensure it cannot be imitated if the market recognizes it as such. The effects of SCI on competitive strength, therefore, depend entirely on its impact on reputation. A new hypothesis can therefore be postulated:
Hypothesis 5. There is a positive relationship between the information disclosed through SCI and competitive strength, which is fully mediated by corporate reputation.
Although the direct recipients of ACI are the public registries for accounting information who are concerned with the financial and fiscal monitoring of the firm, other key recipients are agents in the capital markets. This is because the aim of ACI is to ensure greater information transparency regarding a firm’s creditworthiness and expected profitability of its investment opportunities, which helps to reduce agency costs and boost financing capacity. ACI does have a significant influence on the information asymmetries in the financial markets and between a firm and its suppliers of external capital (lenders and investors), helping the suppliers of capital to resolve any uncertainty about the solvency of the firm and its business prospects. This reduction in the perceived risk involved in the supply of capital thus helps firms that offer more and better information to achieve greater financing capacity at a lower cost [
11,
52,
53]. The following hypothesis can, therefore, be proposed:
Hypothesis 6. There is a positive relationship between the information disclosed through ACI and financing capacity.
A necessary condition for improving a firm’s competitive strength is to have a capacity for accessing financing that allows it to choose the source of financing best aligned with its operational needs and strategic objectives. The capacity for accessing financing is defined not only by the traditional ability to access bank credit, but also by a set of characteristics such as flexibility in the choice of type of financing, diversification in the source from which credit or capital is secured, and improved price, term or renegotiation conditions, among others. The capacity for accessing financing for projects aimed at accumulating strategic assets, therefore, represents a key competence for creating competitive advantages. It can thus be hypothesized that:
Hypothesis 7. There is a positive relationship between financing capacity and competitive strength.
Given the public nature of ACI, its standardization, its limited correspondence with the critical success factors in the industry, and its minimal value in generating exploitable information asymmetries in real markets, the production of this information is an obligatory process but one with little scope for generating sustainable competitive advantages. The potential for corporate information to make a direct contribution to firm competitiveness is, therefore, questionable in the case of information released in the form of ACI. However, the dissemination of ACI may have an indirect effect on competitive strength because complete, reliable ACI has a positive influence on the confidence of investors and financiers, and on their willingness to supply capital for the firm to invest in quality assets that may give rise to sustainable competitive advantages. The hypothesis can thus be stated as follows:
Hypothesis 8. There is a positive relationship between the information disclosed through ACI and competitive strength, which is fully mediated by financing capacity.
A key element in generating sufficient confidence in financial markets to ensure a firm has access to external capital is the corporate reputation it enjoys. In addition, a good corporate reputation increases partners’ willingness to contribute more capital (via an increase in equity) or increase self-funding (by setting aside a greater proportion of the profits as reserves rather than paying out dividends) as the partners trust that the short-term economic sacrifice will yield a greater long-term value. Corporate reputation is, therefore, an input used by investors and financiers, and a facilitating element helping firms to satisfy their need for capital. The following hypothesis can therefore be formulated:
Hypothesis 9. There is a positive relationship between corporate reputation and financing capacity.
Since NSCI and SCI indirectly influence competitive strength through corporate reputation, partially and fully mediating the relationship, respectively, the last two hypotheses to be tested can be stated as follows:
Hypothesis 10. There is a positive relationship between the information disclosed through NSCI and competitive strength, which is partially mediated by corporate reputation and financing capacity.
Hypothesis 11. There is a positive relationship between the information disclosed through SCI and competitive strength, which is partially mediated by corporate reputation and financing capacity.
The full relational model and hypotheses can be observed in
Figure 1.
4. Results and Discussion
Table 5 shows the structural model, which defines the degree to which the endogenous variables are explained by the individual antecedent variables. For the final dependent variable, COS, 43% is explained by its immediate antecedent variables: NSCI, SCI, ACI, REP and CAF. All these indicators are above the minimum of 0.10 recommended by [
72]. In addition, in the case of the final dependent variable in the model (COS) the result is above 0.33, a value considered moderate by [
73].
When it comes to analysing the validity of the global model, the Standardized Root Mean Square Residual (SRMR) proposed by [
74,
75] measures the difference between the observed matrix of correlations and that predicted by the model, reflecting the mean magnitude of these differences. Thus, a lower SRMR indicates a better fit of the global model. The value of the SRMR is significantly below the 0.08 considered valid [
74], registering a value of 0.05 which is indicative of a well-fitted model. Furthermore, the Normed Fit Index (NFI) proposed by [
76] assesses the reduction in the χ2 of the model compared to that of the null model. This index takes values between 0 and 1 according to the increasing quality of the fit. By convention, a value exceeding 0.90 is considered acceptable [
77]. The NFI of the model is 0.928, thus indicating, once again, a good fit of the global model.
The analysis of the structural model also yields positive results, with all VIF statistics below 5; thus, according to [
78], multicollinearity among the antecedent variables of each endogenous construct can be ruled out (
Table 6).
To statistically test the hypotheses, the beta coefficients of the direct relationships between constructs and their level of significance are first calculated. The effect size
f2 is also estimated [
79]. This value measures the contribution of an exogenous construct in explaining a particular endogenous construct in terms of
R2.
The results are positive, confirming hypotheses 1, 2, 4, 6, 7 and 8, in this first relational model of external information and COS (
Table 7). The effect of NSCI on REP is positive and significant, registering a coefficient of 0.347 and confirming hypothesis 1. It has an effect size of 0.154, which is considered a moderate effect [
80]. This is consistent with the results obtained for SCI, which also has a positive and significant effect on REP and registers a coefficient of 0.304; however, it has an effect size of 0.108, which that author considers small. This allows us to draw the first significant conclusion of the model, as it shows how the NSCI—information over which the firm has full control in terms of the format for release and distribution—has a greater effect on corporate reputation than SCI.
Furthermore, the effect of ACI on CAF is positive and significant, with a coefficient of 0.209 and an effect size of 0.051, which is considered low. Again, the relationship between REP and CAF is positive and significant, with a coefficient of 0.217 and an effect size of 0.049, also considered low. This confirms hypotheses 6 and 8, and shows how, when it comes to improving the conditions of access to financing, a firm should not focus exclusively on the disclosure of financial information; the effects of reputation as an intangible asset on the financing capacity of a firm are of a similar magnitude.
The REP-COS and CAF-COS relationships are also positive and significant, confirming hypotheses 2 and 7. However, the effect sizes are very different. The coefficient for the first relationship reaches 0.439, yielding an effect size of 0.274, which is considered moderate. Conversely, the coefficient of the second lies at just 0.140, representing an effect size of 0.035, which is considered small. This difference underlines how financing capacity, although inarguably significant, does not come close to corporate reputation in terms of its ability to generate competitive advantages in real markets.
It is also revealing to analyse the relationships of NSCI, SCI and ACI with the final dependent variable COS. The results show that only the effect of NSCI is significant, with a coefficient of 0.226 and a small effect size of 0.066. The effects of SCI and ACI are not significant. The subsequent analysis of the relationships between the dimensions of internal information and competitive strength allows a more in-depth examination of this issue.
The analysis of the indirect effects (
Table 8) also yields significant results, which allow us to draw certain conclusions that reinforce those obtained from the analysis of direct effects and confirm some of the hypotheses. Especially relevant is the analysis of the effects of the different types of corporate information, NSCI and SCI, on COS. When it comes to generating COS through corporate reputation, the effect of NSCI, with a significant coefficient of 0.152, is very similar to the effect of SCI, whose beta coefficient is 0.133. The results regarding these two relationships confirm hypotheses 3 and 5, respectively.
Such similarity is also observed when analysing the indirect effect of NSCI and SCI on COS through improvements in the capacity for accessing finance (CAF) stemming from an increase in REP; the coefficient for NSCI is 0.011 and is 0.009 for SCI. The significance of these two relationships allows us to confirm hypotheses 10 and 11, respectively. These values are surpassed by the effect of ACI on COS through CAF, which registers a value of 0.029, confirming hypothesis 8. However, the effect is smaller than that of any form of corporate information on competitive strength as mediated by corporate reputation.
Lastly, the control variables show non-significant results in all cases, both in terms of belonging to a particular sector and the size of the organization.
5. Conclusions
This study relates to three previous lines of research focusing on the independent analysis of information asymmetries (and the effect of ICT on these asymmetries), the configuration of resources and capabilities, and a firm’s sources of competitive advantages. The theoretical reflection indicates that, in order to explain a firm’s competitive performance, there is a need to jointly consider management and information transmission practices (both financial and non-financial), strategic decision-making regarding investment in assets, and financing decisions. In this regard, this article facilitates the identification of two distinct groups of information dimensions, distinguished according to their direct potential for creating competitive advantages from which economic rents can be extracted.
First, there are the information dimensions that are considered ICT-based IMC. Some of the paradoxes concerning information reveal how ICT alone, if it is not combined with other resources, is not sufficient to generate lasting competitive advantages in real markets. The literature review and empirical study that underpin this article point to a need to make coordinated use of ICT together with other complementary and co-specialized strategic factors. It is this combined use which ultimately enables information assets and ICT to be transformed into digital IMC from which economic rents can be extracted, such as is the case with NSCI.
Information transparency with stakeholders, resulting from the provision of NSCI to real and financial markets, is manifested in the development of an improved and more far-reaching corporate reputation. The nature of the tourist product as a confidence and experiential good only serves to intensify this relationship. The development of flexible outward communication channels, which allow the firm to tailor the message to the recipient, but at the same time to standardize content according to firm’s needs, undoubtedly facilitates the development of its reputation. The effect of NSCI on a firm’s competitive position thus draws on multiple sources, stemming from both the direct effects of this IMC and the indirect effects derived from a better corporate reputation.
The second type of information resources lacks this potential for value creation and is, therefore, not directly related to a firm’s competitive strength. This is the case with ACI, an information disclosure practice that essentially concerns the financial information linked to the annual accounts, released to satisfy the demands of regulators and to reduce information asymmetries in financial markets. At any rate, this information resource is not designed to be combined with other resources to create IMC, and it, therefore, tends to have little potential for creating competitive advantages. The same is true of SCI, which fails to fulfil the inimitability condition since its content is encapsulated in standardized formats that are easy to replicate.
However, the non-strategic nature of SCI and ACI does not imply that they are of no use, nor that they should not be maintained and competently managed. They may make an indirect rather than a direct value contribution.
Even given its shortcomings, SCI remains a signal for the quality of the product, reducing problems of adverse selection for products such as tourist goods, which have a high proportion of confidence good attributes. A firm’s degree of compliance and its alignment with the increasingly intense demands of certain interest groups (especially environmental) will help it gain acceptance and legitimacy in its social and geographical environs [
81,
82,
83]. Corporate reputation can thus be largely explained by the degree of SCI released by the organization into the real markets.
Regarding ACI, financial theories posit the desirability of reducing the financial asymmetries in financial markets through the disclosure of information to increase the capacity for accessing finance. The relevance of the disclosed financial information has been called into question due to the diminished association with financial variables that are theoretically correlated, such as price, profitability, profits, cash flow and book value [
7,
8,
9]. The logical result of this loss in the quality of financial information [
6,
83] has been the weakening of the relationship between accounting information, credit decisions and investment since the 1990s. Nor has the expansion of the disclosed information to include non-financial information linked to the financial information in public registries substantially reduced information asymmetries in financial markets [
11,
12,
52,
53].
This article addresses this issue by demonstrating how the impact of ACI on the firm’s financing capacity is smaller than the impact generated by its corporate reputation. This is a revealing fact since it highlights the need for companies to release information, not only to the financial markets and the institutional and professional entities and agents that operate in them, but also to the real markets. The latter are home to potential investors, who will clearly prefer to participate in transparent companies with a strong homogeneity in the projection of their brand, products, services and organizational practices, among others.
Having empirically confirmed the hypotheses, the practical implications of the study are that managers should combine their strategic and financial decision making when it comes to effective information management based on the ability of the different information dimensions to generate sustainable competitive advantages over time. Understanding the conditions under which ICT-based resources will generate sustainable competitive advantages is critical when allocating capital for ICT investment, which is a very significant cost in the context of the accelerated digitalization of the tourism industry. This paper’s conclusions highlight the fact that managers should not make capital structure design decisions without considering their effects on the firm’s competitiveness and profitability, due to the inherent orientation of debt and equity financing towards investments in tangible and intangible assets, respectively. Similarly, managers should not undertake information strategies or ICT investment decisions without carefully analysing their impact on the capital market and its reaction in terms of willingness to grant credit and the cost of credit, as well as the valuation of the company itself.
The paper also offers interesting conclusions regarding the management of information and its external disclosure. The dominant attitude of companies in terms of their disclosure policy has been to adhere to legal and administrative obligations, providing the financial information compiled in the financial statements. The shock of major corporate scandals and the need to reduce information asymmetries that seriously damage credibility and trust in the financial markets, and even the very image of corporate icons, as well as the growing demand from different users, are forcing the adoption of a new approach that guarantees organizational legitimacy and paves the way for its success and survival. The new approach to the management of disclosed information includes both the expansion of the financial information disclosed and the improvement in its quality. This ensures its reliability, timeliness, completeness and updating, so as to enable all stakeholders to anticipate the potential risks and benefits to be extracted from their transactions with the company. However, this is no longer sufficient, and a company must also provide non-financial information that is required for the correct interpretation of the financial information and for stakeholders to be aware of other potential risks. Without this type of information, a firm’s attractiveness to the financial markets, its corporate reputation, and the commitment of the members could be seriously weakened.
This study is not free of limitations. The study of a particular industry and a particular country does not allow the extrapolation of the results. Future research should try to confirm the results obtained in multi-country and multi-industry databases. The data is also cross-sectoral. Therefore, other future lines of research could work with longitudinal databases.


