Article

Sustainable Development of Economic Growth, Energy-Intensive Industries and Energy Consumption: Empirical Evidence from China’s Provinces

1
School of Mathematics and Statistics, Changshu Institute of Technology, Changshu 215500, China
2
School of Economics, Hangzhou Dianzi University, Hangzhou 310018, China
3
School of Economics, Sichuan Agricultural University, Chengdu 625014, China
*
Authors to whom correspondence should be addressed.
Sustainability 2022, 14(12), 7009; https://doi.org/10.3390/su14127009
Submission received: 9 May 2022 / Revised: 4 June 2022 / Accepted: 6 June 2022 / Published: 8 June 2022

Abstract

:
At present, there is much literature on economic growth and energy consumption, but there is little literature combined with the industry perspective. This paper aims to clarify whether the development of energy-intensive industries is an indirect way for economic growth to affect energy consumption, which can provide a reference for the coordination of economic growth goals, industry development and reducing energy consumption. Based on China’s provincial panel data from 2000 to 2019, this paper measures the scale of provincial energy-intensive industries by entropy method and uses the panel regression model to test its transmission effect on energy consumption. The results show that 23.96% of the effects of economic growth on energy consumption are indirectly generated through the transmission of energy-intensive industries. Moreover, the transmission effects are only established in the eastern and western regions but are not significant in the central region. Therefore, controlling the rapid development of energy-intensive industries is an effective way to curb the expansion of China’s energy consumption scale. Green technology innovation, new-type urbanization construction and other supportive measures should be taken in accordance with local conditions. This research contributes to the coordinated and sustainable development of the economy, industry, and energy.

1. Introduction

In recent decades, China has made remarkable achievements in economic development. However, with the extensive economic growth, especially the rapid expansion of energy-intensive industries, China’s energy demand continues to rise substantially [1,2,3,4]. As early as 2009, China surpassed the United States to become the world’s largest energy consumer. Even under the influence of COVID-19, China’s primary energy consumption still increased by 2.1% in 2020, ranking first among the few countries with increased energy demand (BP World Energy Statistical Yearbook 2021). At the same time, China’s energy security problems are becoming more and more serious. For example, the dependence on foreign oil has gradually increased, reaching 73.6% in 2020, which is much higher than the warning line of 50%. Moreover, environmental pollution caused by irrationality and excessive energy consumption has become increasingly prominent [5,6]. Serious environmental pollution not only causes large economic losses but also reduces social welfare [7,8]. At present, energy-saving and consumption reduction are recognized as the only way for China to alleviate the pressure of energy demand, reduce energy security risks and solve ecological and environmental problems [9,10]. Then, how to control the further growth of total energy consumption under the condition of maintaining the medium-high speed of economic growth? It is necessary to clarify the impact mechanism of economic development on energy consumption.
Academic circles have conducted extensive discussions on this, and the early literature mostly focused on the relationship between economic growth and energy consumption. For example, Kraft et al. found that U.S. national income was the Granger reason for energy consumption [11], and Yu Eden et al. believed that there was no long-term cointegration relationship between U.S. energy consumption and economic growth [12]. While Yuan et al. and Wang et al. supported the long-term stable relationship between China’s GDP and energy use [13,14], so did the relationship between GDP per capita and energy consumption [15]. With the deepening of research, some scholars found that the changing trend of China’s economic aggregate and total energy consumption was not completely synchronized. Subsequently, many scholars began to turn to the impact of industrial structure on energy consumption. For example, due to the different nature of the three industries, the industrial structure also had an impact on energy demand, such as electricity [16,17]. Increasing the development of tertiary industries such as information transmission, computer service and software, and finance had huge potential for energy conservation and emission reduction in Beijing, China [18].
In addition to the three industries, some scholars paid attention to the influence of industry and its sub-sectors. For example, Hofman et al. found that changes in the industrial structure within China’s industry had a more obvious impact on energy consumption [19]. Chan et al. believed that the share of heavy industry output in national income was also an important factor affecting China’s energy demand [20]. This view was also agreed by Chai et al., Kahrl et al. and Liao et al. The former believed that China’s increased energy consumption was due to the faster growth of heavy industry than light industry [21], and the latter insisted that heavy industry had driven much of the growth in China’s physical energy consumption [2], especially the development of energy-intensive industries [3]. Therefore, strengthening the supervision of energy-intensive industries was key for China to achieve the goal of total energy consumption control [22]. There is also evidence from other regions and countries. For example, the high proportion of manufacturing in Taiwan’s industry was one of the main reasons for its energy consumption [23]. Due to the rapid transformation of industrial structure from heavy industry to service industry, Japan’s energy demand became stable [24]. The change in manufacturing structure in Korea was an important factor affecting its energy consumption [25]. American industry consumed huge amounts of energy, and the energy intensity of the manufacturing industry was higher than that of any other sector [26,27]. The above research fully shows that the industrial sector is the main sector of energy demand in a country or region. As far as China is concerned, the expansion of heavy industry is one of the leading factors for the rapid rise of its energy consumption, especially the development of energy-intensive industries. Therefore, it is very necessary to explore the influence of China’s industrial internal structure, especially the development of energy-intensive industries, on its energy consumption.
Throughout the existing literature, the relationship between economic growth and energy consumption can be investigated by either a two-variable [28,29,30] or multi-variable analysis framework. The main explanatory variables involved are energy price [31,32,33], technological progress [1,34,35], industrial structure [16,17,36], urbanization level [37,38,39], and foreign trade [40,41,42]. In addition to exploring the cointegration relationship between national or global economic growth and energy consumption [43,44,45,46], they paid more attention to the Granger causality between the two. Furthermore, the four cases of economy–energy causality have been verified, such as the one-way causality from economic growth to energy consumption (energy-saving hypothesis) [47,48,49], the one-way causality from energy consumption to economic growth (growth hypothesis) [29,50,51], the two-way causality relationship (feedback hypothesis) [52,53,54] and no causality relationship (neutral hypothesis) [55,56]. It should be noted that the economy–energy neutral hypothesis only exists for renewable energy and biomass energy. There are also studies supporting mixed conclusions of energy–economic causality, such as country heterogeneity [57,58,59,60], regional heterogeneity [61], income heterogeneity [62], and energy source-specific variety [63]. Moreover, empirical evidence shows that the conclusions of multi-variable analysis are more stable [64]. In addition, there is also literature involving energy-intensive industries, but only the descriptive analysis of direct effects [3,65]. Little literature has considered the energy demand caused by the development of energy-intensive industries driven by economic growth, that is, the indirect effect of economic growth. However, both theory and practice have shown that the impact of China’s energy-intensive industries on its energy consumption cannot be ignored. Therefore, this paper puts the economic aggregate, the development of energy-intensive industries and energy consumption under the same analytical framework and analyzes the impact of economic growth on energy consumption while paying attention to the transmission effect of energy-intensive industries. In addition, considering that there are significant differences in energy consumption and economic growth among China’s regions [5,66,67], this paper discusses from the national and regional levels, respectively. At the theoretical level, this study further expands the impact mechanism of economic growth on energy consumption. At the practical level, its conclusions can provide a direction for China’s energy conservation and consumption reduction in the future. It also has great reference value for other developing countries.
The contributions of this paper are as follows. First, starting from the factual characteristics, and combined with relevant theories, this paper clarifies that China’s energy-intensive industrial development is an indirect way for its economic growth to affect energy consumption. Second, regional differences are considered when testing the direct and indirect effects of China’s economic growth on energy consumption. Thirdly, the entropy method is used to comprehensively measure China’s provincial energy-intensive industries’ development level, which avoids the influence of multicollinearity on the regression estimation, and the estimation results are more reliable.
The remainder of this paper is structured as follows. Section 2 analyzes the theoretical mechanism. Section 3 provides the variables, methods, and data. Section 4 presents the empirical results and discussion. Section 5 concludes and proposes relevant policy recommendations.

2. Transmission Mechanism of Economic Growth, Energy-Intensive Industries’ Development and Energy Consumption

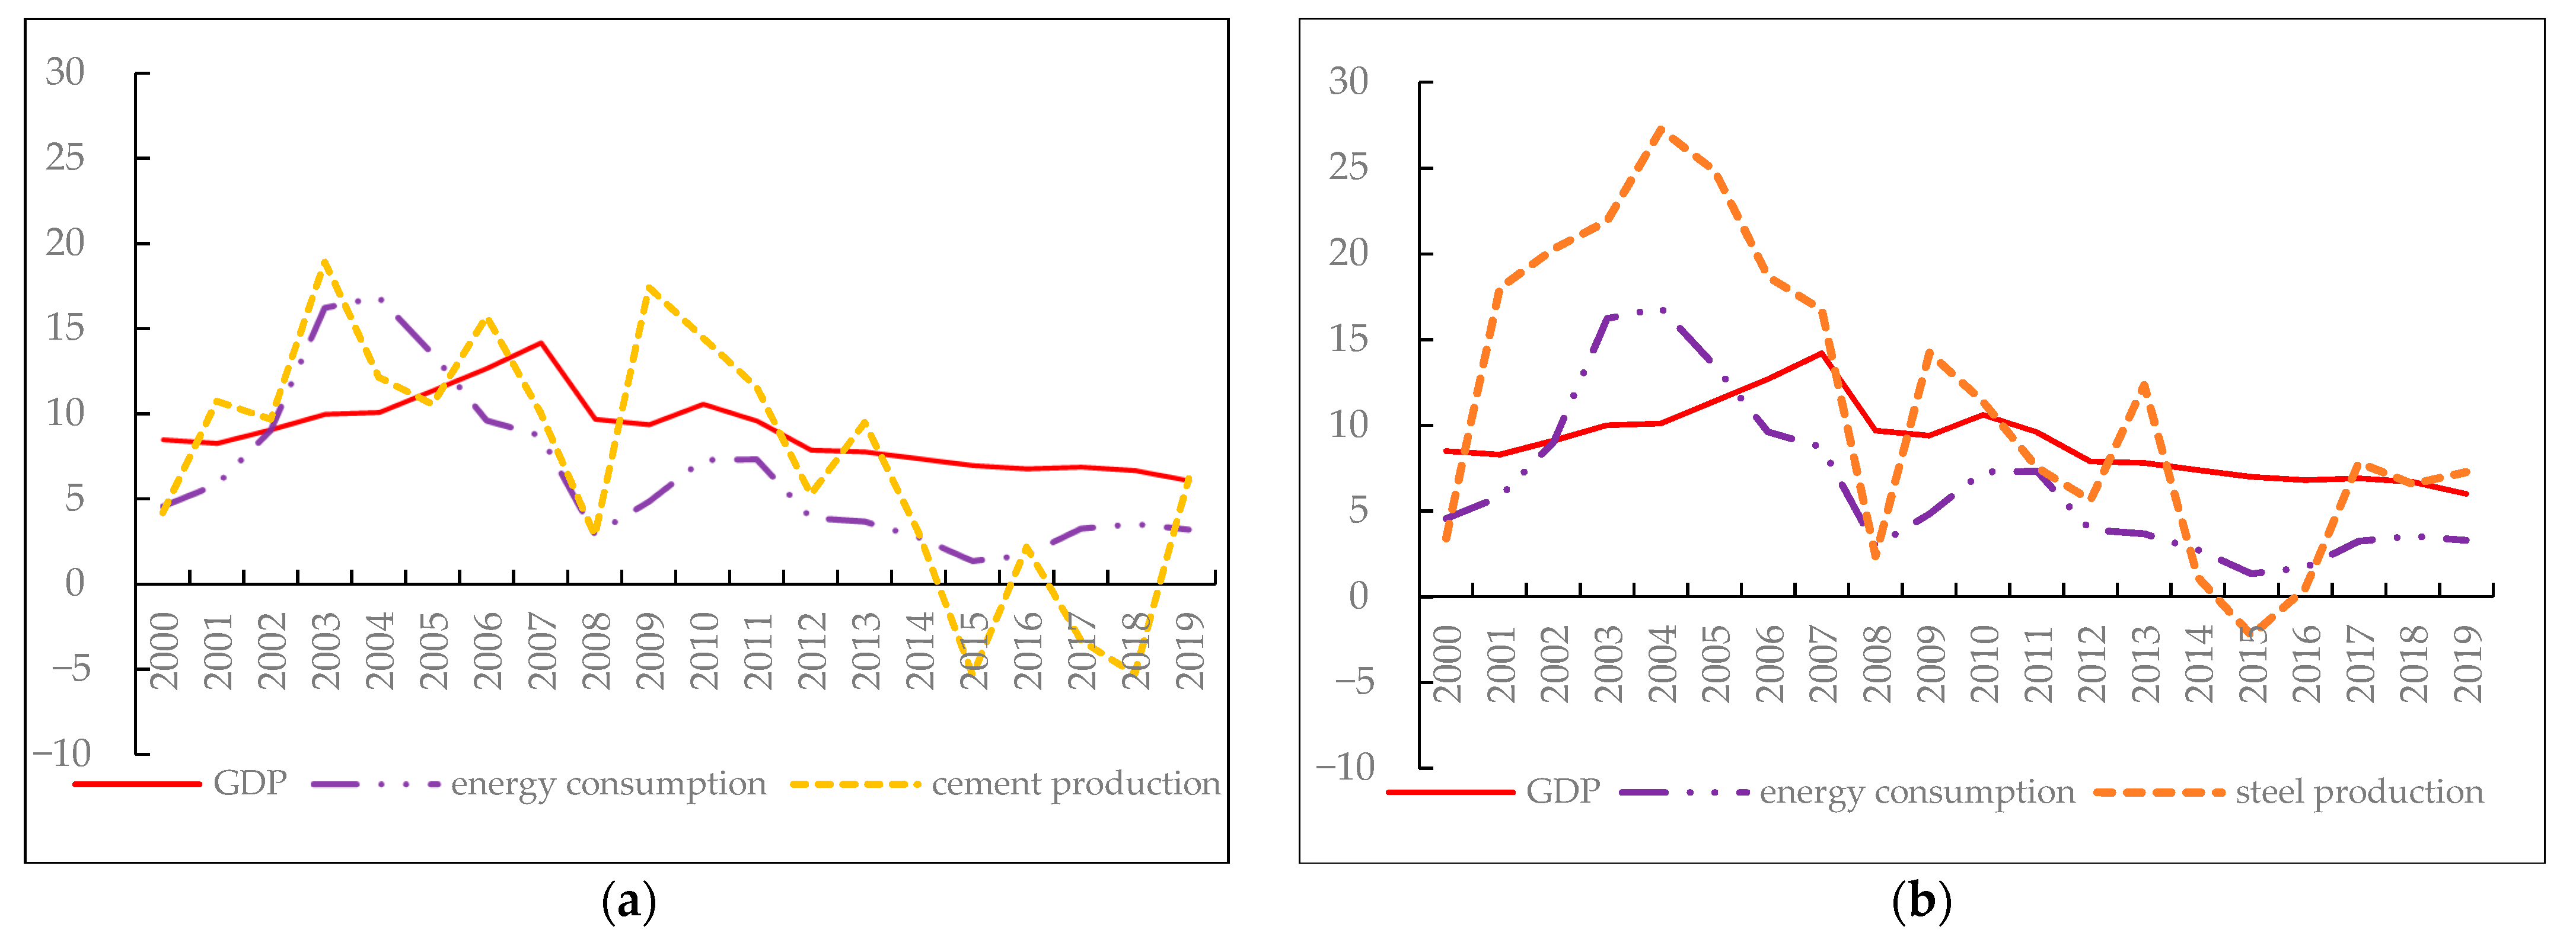
2.1. Factual Features

China’s energy-intensive industries’ development has a significant impact on its energy consumption [68,69]. Data show that from 2000 to 2019, the proportion of energy consumption in China’s industrial sector remained at around 70%. Among them are chemical raw materials and chemical products manufacturing, non-metallic mineral manufacturing, ferrous metal smelting and rolling processing industry, non-ferrous metal smelting and rolling processing industry, petroleum processing coking and nuclear fuel processing industry, and electricity and heat production and supply of six energy-intensive industries contributed more. Since 2005, the energy consumption share of the six energy-intensive industries has exceeded 50% and reached 52.45% in 2019. It can be seen that China’s energy-intensive industrial expansion has become one of the root causes of the increase in its energy consumption during this period.
Further, consider the correlation between energy consumption and the production of energy-intensive products. Figure 1a,b plot scatter charts of cement and steel production and energy consumption in 29 Chinese provinces from 2000 to 2019 (except Tibet and Hainan). The correlation coefficient between the two and the p-value for the significance test are also reported. It can be seen from the p-value that there is a significant positive linear correlation between the production of cement and steel and energy consumption. Therefore, there is a strong positive correlation between the output of energy-intensive products and energy consumption in China’s provinces.
Figure 2a,b plot the line graphs of the growth rates of China’s GDP, energy consumption and cement production, and steel production during the same period (if 29 provinces are considered, the dynamic trends of the growth rate of GDP, energy consumption and cement (steel) production are not suitable for descriptive analysis, so the data at the national level are analyzed). In terms of the changing trends of the three, on the one hand, energy consumption has a certain convergence with the output of cement and steel. The growth rate of energy consumption experienced multiple ups and downs from 2000 to 2019. The same is true for the trend of cement and steel production growth rates, which are basically consistent with the change in energy consumption growth rates. On the other hand, energy consumption is not completely synchronized with the trend of GDP. During the sample period, the overall performance of the GDP growth rate continued to increase and then decreased with fluctuations, and the range was relatively narrow; it was different from the repeated fluctuations of the energy consumption growth rate. However, the continuous expansion of economic scale will often drive the further increase in cement and steel production demand.

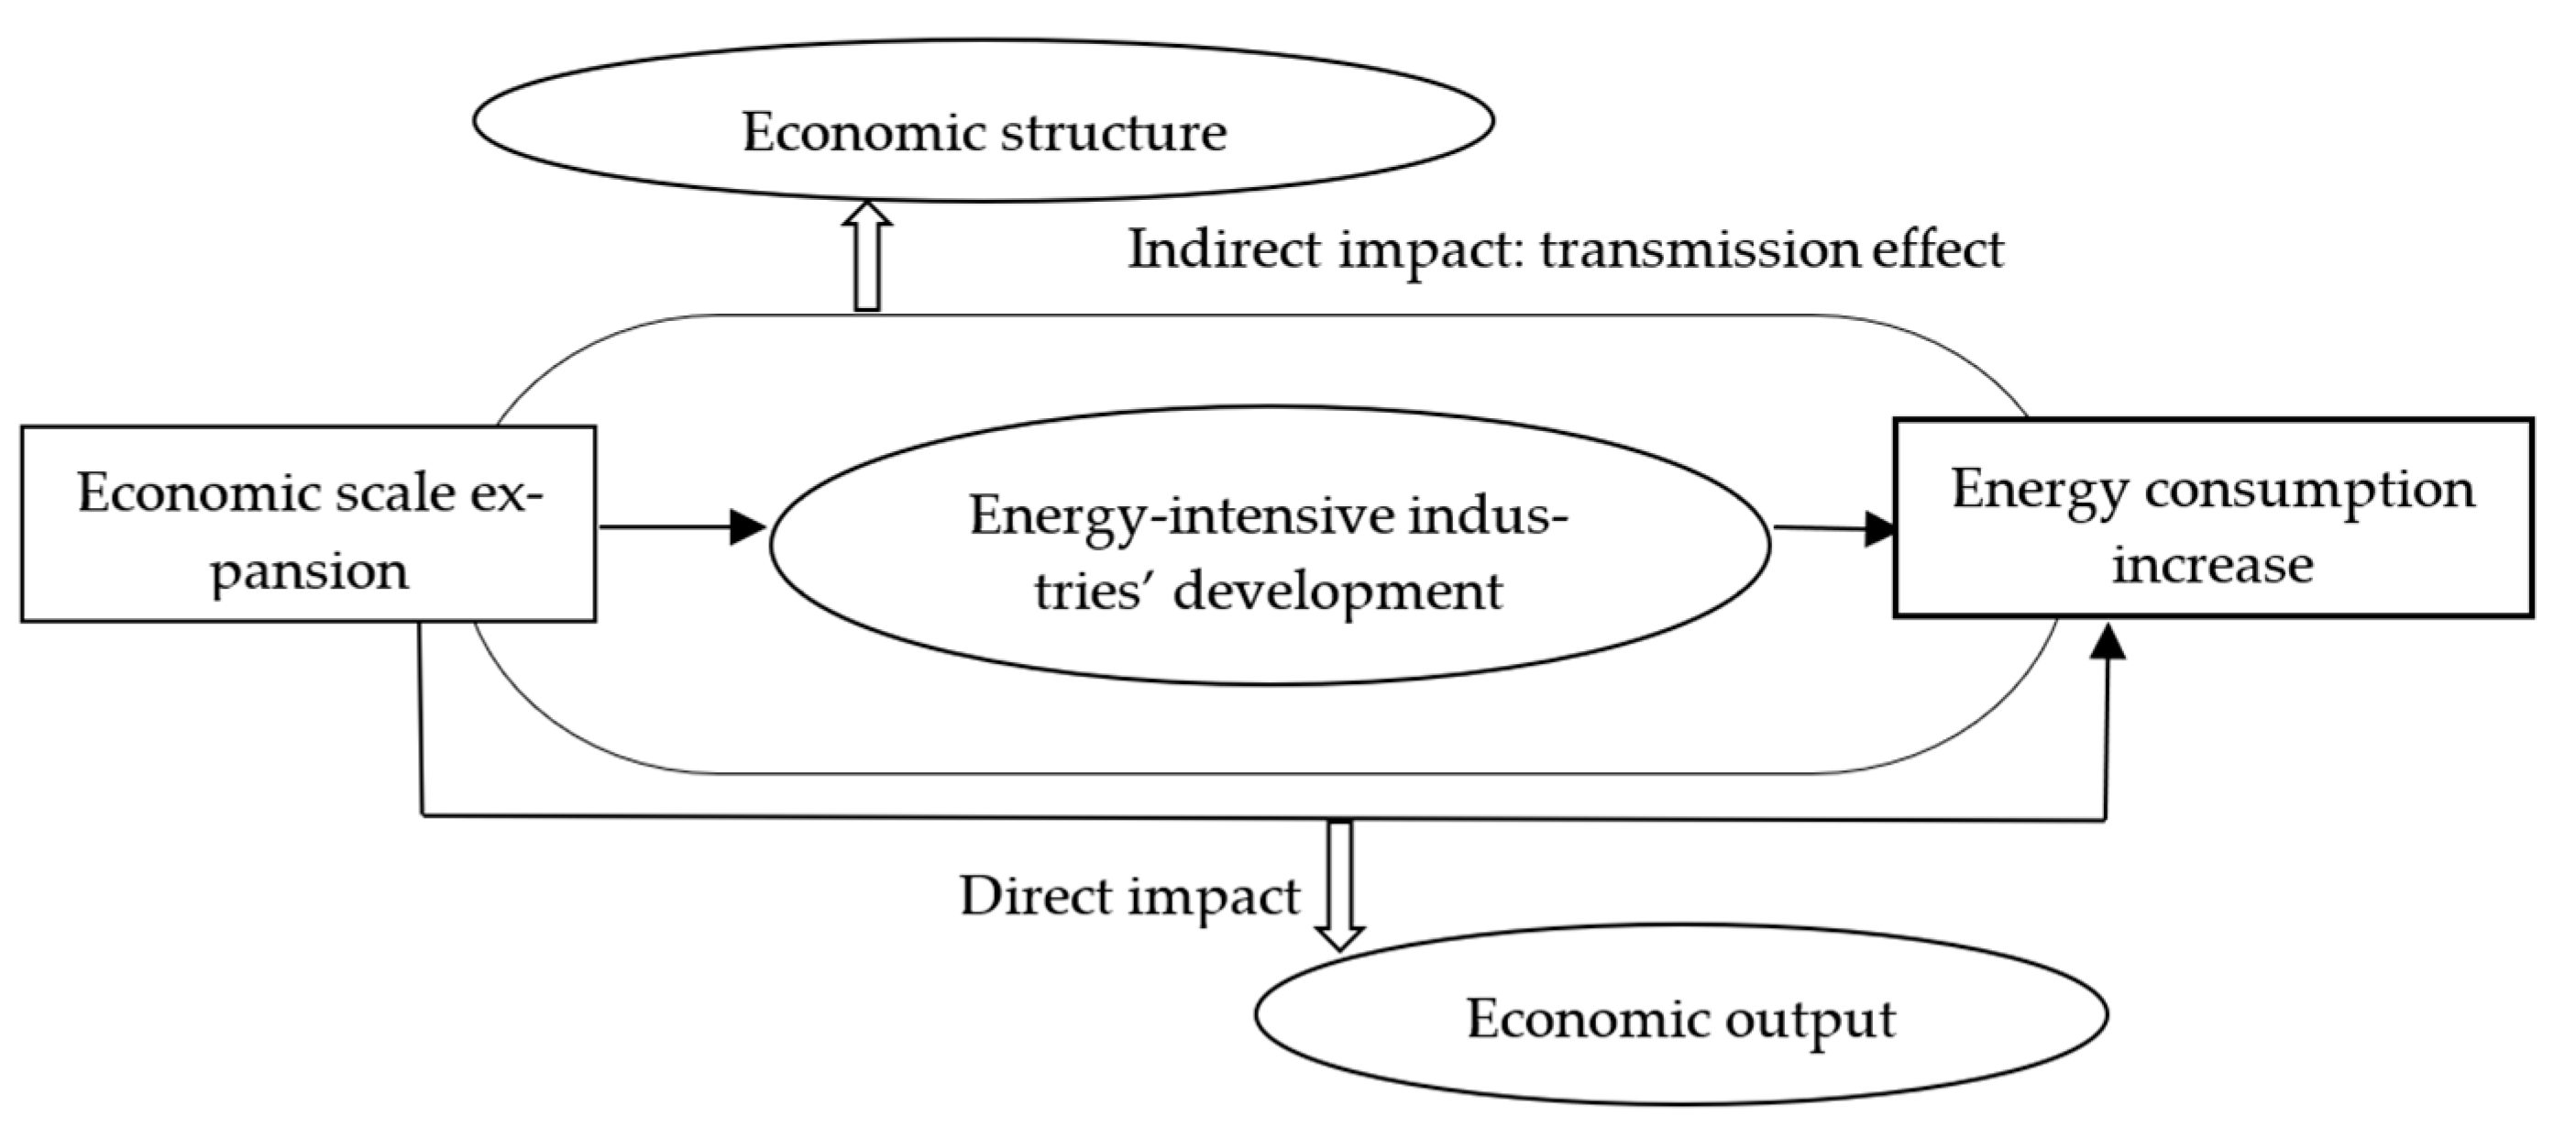
2.2. Transmission Mechanism

The fact that China’s economic growth and energy consumption trends are not completely synchronized shows that economic growth has an impact on energy consumption, but it is not comprehensive. This has been recognized by the academic community [3]. China’s energy-intensive industries contribute more than 50% of its total energy consumption, and there is a significant correlation between provincial cement and steel production and energy consumption, indicating that the development of energy-intensive industries will bring about changes in energy consumption.
From the perspective of the industrial chain, most of the energy-intensive industries are upstream, and their products are often used as input elements for downstream industries, involving a wide range and closely related to the macroeconomic environment. For example, real estate, infrastructure, and rural construction are the main consumption forces for cement. When economic development accelerates, it is bound to stimulate a sharp rise in demand for energy-intensive products such as cement; when the growth slows, demand for them will also decrease. The trend of China’s economic growth rate and the growth rate of cement and steel production also verified this mechanism.
To sum up, changes in the level of economic development drive changes in the scale of energy-intensive industries, which in turn lead to increases or decreases in energy consumption. In this paper, the impact of this approach is defined as an indirect effect, that is, the transmission effect of energy-intensive industries affected by economic growth on energy consumption. Therefore, the impact of economic aggregates on energy consumption can be summarized as direct and indirect effects. See Figure 3 for details. In the following, the panel data model is used to carry out a specific quantitative analysis of its indirect effect and pays attention to regional heterogeneity.

3. Methods, Variables and Data

3.1. Methods

This paper focused on the indirect effect of the development of energy-intensive industries caused by economic growth on energy consumption. Therefore, the regression model was constructed as follows:
E c i t = β 0 + β 1 Y i t + β 2 Z i t + τ i + η t + ε i t
E c i t = δ 0 + δ 1 Y i t + δ 2 D e i i t + δ 3 Z i t + γ i + λ t + ε i t
In Equations (1) and (2), i and t represent province and year respectively, τ i and γ i are individual effects, η t and λ t are time effects, and ε i t is a random-disturbance term. E c i t , Y i t and D e i i t represent energy consumption, economic growth and the development of energy-intensive industries, respectively. And Z i t are the control variables. If the coefficients of Y i t in models (1) and (2) change and the coefficient of D e i i t is significantly different from 0, which means that the indirect effect of economic growth on energy demand does exist and is caused by the development of energy-intensive industries.
In order to consider the transmission effect of the energy-intensive industries on energy consumption, we further established a model of economic growth’s impact on the energy-intensive industries’ development. The details are as follows:
D e i i t = θ 0 + ψ Y i t + κ i + ν t + μ i t
In Equation (3), κ i is an individual effect, υ t is a time effect, and μ i t is a random disturbance term. The rest of the symbols are the same as Equations (1) and (2). The transmission effect of energy-intensive industries on energy consumption is estimated by the coefficients δ 2 , ψ and δ 1 . Specifically,
δ 2 ψ δ 1 + δ 2 ψ × 100 %

3.2. Variables

3.2.1. Dependent Variable and Core Independent Variables

Energy consumption, which refers to the energy consumed in production and living, including coal, oil, natural gas, etc., was the explained variable. In order to eliminate the influence of population size [70,71], this paper selected energy consumption per capita (unit: a ton of standard coal). Using the cluster analysis method, China’s provincial energy consumption per capita in different years was divided into four categories. Figure 4a,b report the results in 2000 and 2019. They show that provinces with higher energy consumption in 2000 were concentrated in the eastern region, such as Beijing, Shanghai, Liaoning, and Tianjin. In 2019, provinces with higher energy consumption shifted to the western regions, such as Inner Mongolia, Ningxia, Qinghai, and Xinjiang. Most of the provinces at the midstream level were in the eastern regions, such as Liaoning, Tianjin, Shanghai, Hebei, Shandong, Jiangsu, and Zhejiang. The provinces with low energy consumption in 2000 and 2019 were distributed in the eastern, central, and western regions, such as Guangdong, Jiangxi, and Guangxi. It can be seen that the regional and temporal imbalance of China’s energy consumption is more prominent.
Economic growth and the development of energy-intensive industries were the core explanatory variables. Among them, economic growth is measured by GDP per capita (unit: RMB yuan). In order to exclude the impact of price factors, GDP per capita in the sample period was adjusted to the data of comparable prices in 2000. Similarly, Figure 5a,b report the spatial distribution of China’s provincial GDP per capita in 2000 and 2019. They show that GDP per capita exhibits significant spatiotemporal heterogeneity. From the perspective of the time dimension, the province with the lowest GDP per capita in 2000 was Guizhou (2759 RMB yuan), and the lowest province in 2019 was Gansu (32,995 RMB yuan), with a difference of 11 times. Shanghai, which ranked first, was also five times different in 2000 (29,671 RMB yuan) and 2019 (164,220 RMB yuan). From a spatial perspective, the GDP per capita was higher in the eastern region but was lower in the central and western regions. For example, the top eight provinces in 2000 and 2019 were all from the eastern region. In 2000, the 14 provinces in the last category were located in the central and western regions, and in 2019, 15 of the 17 provinces in the last category were from the central and western regions.
Measuring the development scale of energy-intensive industries was a difficulty in this paper. Two basic questions needed to be solved: First, there are many kinds of products in the six energy-intensive industries, and which products should be selected for analysis? Second, how to deal with the multicollinearity problem caused by the common variation trend of different energy-intensive products’ output in time? For the first question, referring to the list of China’s energy-intensive products and taking into account the availability of data, seven products, including thermal power, cement, flat glass, soda, ten non-ferrous metals, coke, and steel were selected. For the second problem, this paper used the entropy method to measure the development level of energy-intensive industries to solve the multicollinearity problem. The reason for this was that the entropy method is an objective evaluation method, and the weight of each variable is not affected by the subjective bias of decision-makers [72]. The specific steps are as follows.
Step1: Setting the initial values of the variables as X = { X α i t } , use the range method to perform dimensionless processing on them, and translate them by 0.001 units. The specific Equation is:
{ x α i t = X α i t min ( X α i t ) max ( X α i t ) min ( X α i t ) + 0.001 Positive   indicator x α i t = X α i t min ( X α i t ) min ( X α i t ) max ( X α i t ) + 0.001 Inverse   indicator
In Equation (5), α ( α = 1 , 2 , , K ) , i ( i = 1 , 2 , , N ) , and t ( t = 1 , 2 , , T ) represent the type, province and year of energy-intensive products in turn. X α i t is the output of energy-intensive products, max ( X α i t ) and min ( X α i t ) are the maximum and minimum values of X α i t .
Step2: Quantify the same degree of variables and calculate the ratio P α i t . The specific Equation is:
P α i t = x α i t i = 1 N t = 1 T x α i t
Step3: Calculate the entropy values E α , entropy redundancy D α and weight W α . The specific Equations are as follows:
{ E α = 1 ln ( N T ) i = 1 N t = 1 T P α i t ln ( P α i t ) D α = 1 E α W α = D α α = 1 K D α
Step4: Calculate the development index of energy-intensive industries Z x i t . The Equation is as follows:
Z x i t = α = 1 K W α ( x α i t 0.001 )
At the same time, the output of energy-intensive products in this paper was measured by physical quantity. There are two reasons. One was to avoid the impact of price factors, and the other was the lack of value-added data on provincial energy-intensive industries since 2012. In order to eliminate the influence of population size, the per capita indicator was also adopted. We collected the output data of seven kinds of energy-intensive products in 29 provinces of China (because there are many missing data for the variables in Tibet and Hainan, so they are not included) from 2000 to 2019 and converted them into per capita output X = { X a i t } based on the average resident population of each province. Using the entropy method, the panel data were calculated to obtain the development index of provincial energy-intensive industries in the corresponding period ( Z x i t ), that is, D e i i t . The larger the value D e i i t , the higher the development level of energy-intensive industries. Figure 6a,b report the spatial distribution of China’s provincial energy-intensive industry development index in 2000 and 2019.
Figure 6a,b show that in 2000, most of the provinces with higher levels of development of energy-intensive industries were concentrated in the eastern region, such as Shanxi, Tianjin, Shanghai, Liaoning, and Beijing. In 2019, the index in the western provinces of Ningxia, Inner Mongolia, Qinghai, and Xinjiang jumped to the top four; Some eastern provinces were relatively high, such as Tianjin, Shandong, and Hebei, and while some provinces were extremely low, such as Beijing and Shanghai. The regional imbalance of the index is more prominent, which is more consistent with the spatial distribution of energy consumption per capita in China. From the time point of view, the index changes are also more obvious. For example, compared with 2000, the development index of energy-intensive industries in Inner Mongolia in 2019 increased by 0.5070, an increase of 908.64%. It is worth noting that a few provinces, such as Beijing and Shanghai, also saw a decline in the index.

3.2.2. Control Variables

With reference to relevant literature (See Section 1 for details), this paper selects five control variables. Details are as follows.
  • Energy price ( P r i t ). Energy price was one of the important factors affecting energy demand [73]. Considering that the total amount of energy includes coal, oil and other varieties, this paper adopted the fuel and power purchasing price index in the industrial producers purchasing price index to measure energy prices. Referring to the practice of Kenneth et al. [31], take 2000 as 1, and multiply the indexes over the years to obtain the energy price data of 29 provinces in the corresponding years.
  • Technological progress ( K c i t ). R&D investment and independent R & D contribute to the decline of energy intensity [10,35]. However, if the technological advance is not green-biased but of production scale expansion, it will stimulate an increase in energy demand [39]. This paper adopts the measure of science and technology innovation, which specifically uses the ratio of provincial R&D expenditure to GDP, namely the measure of science and technology investment intensity.
  • Industrial structure ( I s i t ). Industrial structure adjustment has a major impact on energy demand [17]. In order to fully describe the impact of economic restructuring on China’s energy consumption, the proportion of the tertiary industry is introduced into the model as a control variable. Compared with the primary and secondary industries, the tertiary industry is relatively “cleaner” and thus contributes to the reduction in energy consumption. This paper adopts the measurement of the share of the tertiary industry’s added value in GDP.
  • Urbanization level ( U r i t ). Energy demand has rigid growth characteristics in the rapid urbanization stage [74]. At present, China’s urbanization level is still in the stage of accelerated development. Therefore, urbanization is a factor that cannot be ignored in analyzing China’s energy demand [75]. This paper adopts the proportion of the urban resident population to the regional resident population to measure the urbanization level.
  • Level of opening-up ( T r i t ). In theory, trade liberalization can bring knowledge and technology spillovers to the host country, thereby improving energy efficiency and reducing energy demand [41]. However, due to the looser environmental standards of the host country, may also lead to a “pollution paradise effect” [40]. Moreover, related research showed that China’s foreign trade affected its energy intensity mainly through exports, and imports had no significant impact [1]. Therefore, this paper uses the proportion of export trade to GDP to measure the level of opening-up.

3.3. Data Sources and Processing

Considering the availability of data, this paper selected 2000–2019 as the research period. GDP per capita, the output of seven energy-intensive products such as cement, the proportion of the tertiary industry’s added value, the export value, the resident population, and the urban resident population were obtained from the provincial statistical yearbooks. The energy-consumption data were from the China Energy Statistical Yearbook; the research and development expenses (R&D) data came from the China Statistical Yearbook of Science and Technology; the data on fuel and the power purchasing price index for industrial producers came from the China Price Statistical Yearbook. The above four types of yearbooks all involved the years 2001–2020. At the same time, in order to eliminate the effects of heteroscedasticity and singularity, the data on energy consumption per capita and GDP per capita were logarithmically processed.

3.4. Descriptive Statistical Analysis

Table 1 lists the descriptive statistical analysis of all variables. The minimum value of l n E c is −0.6469, the maximum value is 2.3983, and the standard deviation is 0.5655, which indicates that the energy consumption per capita is relatively stable and continues to increase. The minimum value of D e i is 0.0104, and the maximum value is 0.5531. However, some of the data, including the control variables, show significant differences between the maximum and minimum values. This means that China’s provincial economic and social development is extremely unbalanced.

4. Results and Discussion

4.1. Full-Sample Analysis

4.1.1. Direct Effect of Economic Growth on Energy Consumption

Much literature found that there was a long-term cointegration relationship between economic growth and energy consumption and existed a two-way Granger causality between the two in a specific period. Therefore, following the practice of Vo [76], this paper selected the instrumental variables in the lag period of explanatory variables and carried out a two-stage least squares estimation (TSLS) for Equations (1) and (2) to avoid the adverse effects of the endogenous economic growth on the estimation. The results are listed in columns 2 and 3 of Table 2. Specifically, use ln Y i t 1 and ln Y i t 2 as instrumental variables. The reason is that ln Y i t 1 , ln Y i t 2 and ln Y i t are highly relevant; Meanwhile, as far as t period is concerned, ln Y i t 1 and ln Y i t 2 have been “determined”. In essence, they are all pre-determined variables, and may not be correlated with the random error term of t-period ε i t . Therefore, the condition of high correlation with the explanatory variable and the exogenous condition with the perturbation term are satisfied.
Moreover, the results of the under-identification and weak-identification test highly reject the null hypothesis. Because the corresponding p values of statistics χ 2 and F are both less than the 1% significance level. At the same time, over identification test statistic χ 2 also highly rejects the null hypothesis. It can be seen that the instrumental variables are appropriate. See the last three lines of Table 2 for details.
Equation (1) in Column 2 of Table 2 only considers the influence of economic growth and control variables on energy consumption. At this time, the regression coefficient of ln Y is positive and passes the significance test of 1%. This shows that GDP per capita significantly promotes the growth of energy consumption. The third column, namely Equation (2), is the estimation results of introducing the development index of energy-intensive industries, and the regression coefficients of D e i and ln Y are all greater than 0, and pass the significance test of 1%. Obviously, the coefficients of ln Y in Equations (1) and (2) have changed from 0.4220 to 0.3485. This means that after considering the energy-intensive industries, the elasticity coefficient of GDP per capita on energy consumption decreases. In other words, part of the effect of economic growth on energy consumption is indeed caused by the development of energy-intensive industries, which verifies the previous point of view.

4.1.2. Indirect Effect of Economic Growth on Energy Consumption—Transmission Effect of Energy-Intensive Industries’ Development

Estimate the Equation (3). Similarly, in order to solve the endogenous problem of economic growth variable, we select ln Y i t 1 and ln Y i t 2 as the instrumental variables to estimate the two-stage least squares estimator of the development index of energy-intensive industries ( D e i i t ) . The specific results, namely Equation (3), are summarized in column 4 of Table 2.
Equation (3) passes the instrumental variable test, which means that the two-stage least squares estimator is valid. The results show that the regression coefficient of ln Y is 0.0905 and passes the significance test of 1%. This means that GDP per capita growth has significantly stimulated the development of energy-intensive industries. That is to say, the expansion of economic scale will often lead to an increase in the demand for energy-intensive industries’ products such as cement and coke. This is consistent with the factual features between the two in Section 2.1. Furthermore, quantify the indirect impact of economic growth on energy consumption through the development of energy-intensive industries. Combined with the correlation estimation coefficients and Equation (4), the indirect effect of economic growth on energy consumption is calculated. The specific results are shown in Table 3.
As can be seen from Table 3, the direct effect coefficient of GDP per capita on energy consumption per capita is 0.3485, and the indirect effect caused by the output of energy-intensive products is 0.1098. In terms of relative influence degree, direct effect accounts for 76.04%, and indirect effect accounts for 23.96%. Combined with the weight of output of seven kinds of energy-intensive products determined by the entropy method in Section 2.2, the transmission effects of different products are calculated, and the results are listed in Table 4. It shows that, in terms of weight, ten non-ferrous metals, soda and coke are relatively high, exceeding 15%; While flat glass, steel, thermal power and cement are low, especially cement, less than 10%. However, when converted into a relative contribution rate, the differences in energy consumption caused by the expansion of seven energy-intensive products are relatively small. This also indicates that there is no significant industry heterogeneity in the indirect effects of energy-intensive industries on energy consumption in China.
For the control variables, the estimated coefficients of I s , P r , and K c are less than 0 and those of U r and T r are greater than 0. Among them, the 1% significance test of I s shows that the negative relationship between the proportion of the tertiary industry’s added value and energy consumption is established; that is, increasing the proportion of the tertiary industry significantly inhibits the increase in energy consumption; this is consistent with the conclusion of Mi et al. [18]. The failure to pass the significance test of P r means that energy price negatively inhibits the increase in energy consumption, but the effect is not significant. The possible reason is that China’s energy prices have been regulated for a long time and are distorted to a certain extent [77], and cannot truly and quickly reflect the price level of the energy market. Therefore, the regulating effect of energy price on energy demand is relatively limited and insignificant, which is consistent with the conclusions of Amusa et al. and Song et al. [32,33]. Similar to P r , the inhibitory effect of K c on the increase in energy consumption is not significant, which is consistent with the conclusion of the literature [39]. This shows that, over a long period of time, China’s technological improvement was an energy-intensive technological advance in the direction of increasing production scale and production capacity, thus increasing energy demand. The significance test of T r shows that export trade significantly promotes an increase in energy consumption, which is consistent with the conclusions of Chen et al. and Zheng et al. [1,40]. They agreed that expanding exports would increase the energy intensity of China’s economy or industrial sector. Raising the level of U r increased China’s energy consumption is consistent with Yan’s research on how urbanization significantly increases China’s comprehensive energy intensity, power intensity, and coal intensity [78]. It is worth noting that when the development index of energy-intensive industries is introduced into the model, the positive effect of urbanization becomes insignificant. This means that the positive effect of urbanization on the increase in energy consumption may be related to the development of energy-intensive industries. Relevant studies showed that urbanization mainly achieved the increase in energy through the increase in transportation, infrastructure construction, and residents’ energy demand [79], among which the energy use caused by urban infrastructure was the most important channel for China’s urbanization to affect energy consumption [80].

4.2. Robustness Test Based on Different Estimation Methods

In order to test the robustness of the analysis results, the two-way fixed-effect (TW-FE) model was used to estimate the Equations (1)–(3) and to re-estimate the direct and indirect effects of economic growth on energy consumption. Since we mainly focused on the existence and size of the transmission effect of energy-intensive industries, the estimated coefficients of the core variables are only listed, and the specific results are shown in Table 5. The results show that before and after the introduction of D e i , the estimated coefficient of ln Y has changed significantly from 0.3780 to 0.3005. Furthermore, there is a significant positive correlation between the GDP per capita and the development index of energy-intensive industries. It can be seen that the results of the two-way fixed effect model also show that the transmission effect of the development of energy-intensive industries on energy consumption does exist. Further estimating the degree of its impact, results are listed in columns (4) and (5) of Table 3. The results show that the impact of economic growth on energy consumption caused by the development of energy-intensive industries is 0.2141, accounting for 41.60%, which is higher than the results calculated by the two-stage least square method. Thus, 23.96% may be a conservative estimate of the indirect impact of economic growth on energy consumption. This fully validates our point of view.

4.3. Regional Analysis

It can be seen from the description in Section 2.2 that there are significant spatial differences in China’s energy consumption, economic growth, and development level of energy-intensive industries. Then, is there regional heterogeneity in the transmission effect of energy-intensive industries? Combined with China’s geographical divisions, 29 provinces are divided into eastern (Beijing, Tianjin, Hebei, Liaoning, Shanghai, Jiangsu, Zhejiang, Fujian, Shandong, and Guangdong), central (Shanxi, Jilin, Heilongjiang, Anhui, Jiangxi, Henan, Hubei, and Hunan) and western regions (Inner Mongolia, Guangxi, Chongqing, Sichuan, Guizhou, Yunnan, Shaanxi, Gansu, Qinghai, Ningxia, and Xinjiang) for further discussion.
Similarly, TSLS was used to estimate Equations (1)–(3). Due to space limitations, the estimation results of Equation (1) were omitted and can be obtained from the authors if necessary. Equations (2) and (3) results are listed in Table 6. Among them, Equations (4)–(8) correspond to the eastern, central, and western subsamples in turn.
The results show that the two-stage least squares estimators of the Equations (1)–(3) in the eastern, central and western regions are all valid. The results of Equation (4) in column 2 of Table 6 show that the estimated coefficients of ln Y and D e i is significantly positive, and the estimated coefficient of ln Y is smaller than that of D e i without introduction (0.4050), indicating that economic growth in the eastern region has driven the expansion of energy-intensive industries, further triggering an increase in energy consumption. In other words, the transmission effect of energy-intensive industries in the eastern region on energy consumption is significantly established. Equation (8) shows that the situation in the western region is consistent with that in the eastern region. However, the central region is different. Equation (6) shows that the estimated coefficient of D e i is greater than 0 but not significant, and the coefficients of ln Y are very close (0.3099 and 0.3045) before and after the addition of D e i into the model. This means that the indirect effect of economic growth in the central region on energy consumption is not significant. Further, the mean of D e i in the central region from 2000 to 2019 is 0.1024, which is relatively low compared with the eastern and western regions (their means are 0.1415 and 0.1485, respectively), and the degree of variation is small because the coefficient of variation is 0.0769, which is lower than 0.0820 in the eastern region and 0.1341 in the western region. It can be seen that the development level of energy-intensive industries in the central region during this period is relatively stable, so its impact on the regional energy consumption per capita is weak and insignificant. Therefore, the estimated coefficient of ln Y is very close before and after D e i is added to the model. Meanwhile, the mean of ln e in the central region is 0.7135, which is lower than 0.9209 in the western region and 1.1240 in the eastern region. It can be seen that the energy consumption per capita in the central region was relatively low during this period, so the impact of economic growth is lower than that in the eastern and western regions.
Further, compare the regional differences in the impact effects of economic growth. See Table 7 for the results. It can be seen that the transmission effect of energy-intensive industries on energy consumption is 0.1453 in the western region, 0.1003 in the eastern region, and only 0.0102 in the central region, which is not significant. In terms of relative contribution, the eastern and western regions are relatively close, accounting for 21.05% and 25.52%, respectively, while the central region is very small, only 3.24%.
As for the influence of control variables on energy consumption, I s in the eastern, central, and western regions consistently shows a significant negative correlation; that is, increasing the proportion of tertiary industry significantly inhibits the increase in energy consumption. However, there are regional differences in the effects of other variables. Among them, P r and T r have different significance, while K c and U r have different influence directions. Specifically, the estimated coefficient of P r is less than 0, and only the central region passes the significance test. Therefore, the moderating effect of energy price on energy demand is significant in the central region while is not significant in the eastern and western regions. T r is just the opposite. The regression coefficient is greater than 0, but the central region fails the significance test. This shows that the stimulating effect of export trade on energy demand is not significant in the central region, while significant in the eastern and western regions. The data show that the means of T r in the eastern, central, and western regions are 33.6758%, 5.8517%, and 6.5265%, respectively, and the coefficients of variation are 20.4708, 2.5678, and 4.6947, in turn. The coefficient of K c is less than 0 in the central and western regions and greater than 0 in the eastern region, which is not significant. This means that technological innovation in the eastern region stimulates an increase in energy demand, while the central and western regions are hindered. The possible reason lies in the rapid economic development in the eastern region, and technological innovation is not green-oriented, but more technological progress in pursuit of economic expansion, which leads to the increase in energy consumption. The regression coefficients of U r are positive in the eastern and central regions and negative in the western region, which is not significant, indicating that the positive promoting effect of urbanization in the eastern and central regions is not significant, and the western region has an insignificant negative inhibitory effect. The conclusions are consistent with that of Lin et al., who believed that new-type urbanization had energy-saving effects in resource-rich regions [81]. It can be seen that the effect of urbanization on energy consumption is different in three regions, which has also been verified in the literature of Zhang et al. and Wang et al. [66,67].

5. Conclusions and Enlightenment

5.1. Conclusions

Combined with the relevant literature and facts, this paper proposes that China’s energy-intensive industries’ development is an indirect way for economic growth to affect energy consumption. Further, using the entropy method to comprehensively measure China’s provincial development level of energy-intensive industries from 2000 to 2019, the two-stage least squares method was used to estimate the transmission effect on energy consumption. Furthermore, regional heterogeneity was also considered. As far as its analysis method is concerned, this paper used the entropy method to measure the development level of seven kinds of energy-intensive products, which avoided the influence of the multicollinearity caused by the simultaneous introduction of them into the model on the regression estimation. At the same time, the panel model was estimated by the two-stage least squares method to deal with the adverse effect of the endogeneity of economic growth on the regression analysis. Therefore, the reliability of the empirical analysis is guaranteed by the method. In terms of its empirical results, the main conclusions are as follows:
First, from a national perspective, the transmission effect of energy-intensive industries on energy consumption does exist. China’s economic growth drives the development of energy-intensive industries, and the expansion of energy-intensive industries leads to energy consumption growth. The direct impact of economic growth on energy consumption is 76.04%, and the remaining 23.96% is caused by the development of energy-intensive industries. Moreover, there is no significant difference in the degree of transmission effect of the seven energy-intensive products. At the regional level, the eastern and western regions support the transmission effect of the energy-intensive industries, and the relative contribution is relatively close. However, the effect in the central region is very low and not significant.
Second, the industrial structure has significantly hindered the increase in energy consumption in the eastern, central, and western regions. The energy price is also depressing, but the effects in the eastern and western regions are not significant. Foreign trade is a positive effect, but the impact on the central region is not significant. The situations of scientific and technological innovation and urbanization are more complicated. Both in the eastern region promote an increase in regional energy consumption, but in the western region, both are the blocking effect, and the central region is inhibited and promoted in turn. Furthermore, the impacts of the two on the energy consumption of the three regions are not significant.

5.2. Recommendations

Based on the above research conclusions, this paper puts forward some suggestions to alleviate the excessively rapid increase in China’s energy consumption.
First, continue to moderately control the expansion of energy-intensive industries and focus on improving their quality and efficiency, especially in the eastern and western regions. At present, China is actively working to promote the high-quality development of cement, steel, and other industries and pays attention to improving their quality on the basis of moderately controlling the scale. The government has further strengthened the implementation of the policy of eliminating backward production capacity, such as providing preferential policies and financial support to encourage energy-intensive enterprises to upgrade their original process structure. At the same time, vigorously develop the tertiary industry, especially financial services, information technology and other modern service industries, and further explore the role of industrial structure adjustment in energy conservation and consumption reduction.
Second, strive to improve the level of green technology and strengthen the construction of new-type urbanization. Increase investment in green research and development, promote technological innovation in energy conservation and environmental protection, accelerate the development and utilization of clean energy and renewable energy, and promote the rational and efficient use of energy. In particular, the eastern region, where the economic level is relatively developed, should pay more attention to the promotion of green innovation technology so as to change the unfavorable situation where extensive technology has promoted increases in regional energy consumption in the past as soon as possible. Meanwhile, focus on the construction of new-type urbanization. Urbanization construction is not only the urbanization of the population, nor is it just the expansion of the urban scale. It is more necessary to pay attention to the all-around development of urbanization and take the road of economic and intensive development at the cost of wasting energy.
Third, actively improve the foreign trade structure and moderately relax energy price controls. In the future, we should pay more attention to the export of products with low energy consumption, low pollution, and high value-added, and optimize the export trade structure, so as to reverse its positive role in promoting the increase in energy consumption. Furthermore, we can try to formulate and implement a sustained slight increase system of energy prices and continue to play a restraining role for energy prices, especially in the eastern and western regions, so as to achieve the goal of controlling the excessive growth of energy consumption.
This paper has conducted beneficial discussions in many aspects to propose the transmission path of energy-intensive industries to energy consumption, thereby expanding the impact mechanism of economic growth on energy consumption, and also clarifies the directions of China’s efforts to control the excessive growth of energy consumption. These views and conclusions also have great reference value for other developing countries. However, there are still shortcomings: First, limited to data, only seven products are considered in measuring the development level of energy-intensive industries. In addition, this paper has not considered the spatial effect of provincial energy consumption. These two points are also the direction of future research [82,83].

Author Contributions

Writing—original draft preparation, Y.J.; writing—review and editing, J.X. and Z.F. All authors have read and agreed to the published version of the manuscript.

Funding

This research is funded by the National Statistical Science Research Project of China (grant number 2020LY083).

Institutional Review Board Statement

Not applicable.

Informed Consent Statement

Not applicable.

Data Availability Statement

The data presented in this study are available on request from provincial statistical yearbooks, China Energy Statistical Yearbook, China Statistical Yearbook of Science and Technology and China Price Statistical Yearbook from 2001 to 2020.

Conflicts of Interest

The authors declare no conflict of interest.

References

  1. Chen, S.S.; Zhang, H.Y.; Wang, S.H. Trade openness, economic growth, and energy intensity in China. Technol. Forecast. Soc. Change 2022, 179, 121608. [Google Scholar] [CrossRef]
  2. Kahrl, F.; Roland-Holst, D.; Zilberman, D. Past as prologue? Understanding energy use in post-2002 China. Energy Econ. 2013, 36, 759–771. [Google Scholar] [CrossRef]
  3. Liao, H.; Fan, Y.; Wei, Y.M. What induced China’s energy intensity to fluctuate: 1997–2006? Energy Policy 2007, 35, 4640–4649. [Google Scholar] [CrossRef]
  4. Lin, B.Q.; Chen, G.Y. Energy efficiency and conservation in China’s manufacturing industry. J. Clean. Prod. 2018, 174, 492–501. [Google Scholar] [CrossRef]
  5. Meng, G.F.; Liu, H.X.; Li, J.H.; Sun, C.W. Determination of driving forces for China’s energy consumption and regional disparities using a hybrid structural decomposition analysis. Energy 2022, 239, 122191. [Google Scholar] [CrossRef]
  6. Li, Y.; Sun, L.Y.; Feng, T.W.; Zhu, C.Y. How to reduce energy intensity in China: A regional comparison perspective. Energy Policy 2013, 61, 513–522. [Google Scholar] [CrossRef]
  7. Appiah, M.O. Investigating the multivariate Granger causality between energy consumption, economic growth and CO2 emissions in Ghana. Energy Policy 2018, 112, 198–208. [Google Scholar] [CrossRef]
  8. Chen, L.; Li, W.L.; Yuan, K.B.; Zhang, X.Q. Can informal environmental regulation promote industrial structure upgrading? Evidence from China. Appl. Econ. 2022, 54, 2161–2180. [Google Scholar] [CrossRef]
  9. Wei, C.; Zheng, X.Y. A new perspective on raising energy efficiency: A test based on market segmentation. Soc. Sci. China 2020, 41, 59–78. [Google Scholar]
  10. Dong, K.Y.; Sun, R.J.; Hochman, G.; Li, H. Energy intensity and energy conservation potential in China: A regional comparison perspective. Energy 2018, 155, 782–795. [Google Scholar] [CrossRef]
  11. Kraft, J.; Kraft, A. On the relationship between energy and GNP. J. Energy Dev. 1978, 3, 401–403. [Google Scholar]
  12. Yu Eden, S.H.; Jin, J.C. Cointegration tests of energy consumption, income, and employment. Resour. Energy 1992, 14, 259–266. [Google Scholar]
  13. Yuan, J.H.; Kang, J.G.; Zhao, C.H.; Zhao, G.H. Energy consumption and economic growth: Evidence from China at both aggregated and disaggregated levels. Energy Econ. 2008, 30, 3077–3094. [Google Scholar] [CrossRef]
  14. Wang, S.S.; Zhou, D.Q.; Zhou, P.; Wang, Q.W. CO2 emissions, energy consumption and economic growth in China: A panel data analysis. Energy Policy 2011, 39, 4870–4875. [Google Scholar] [CrossRef]
  15. Li, F.; Suo, C.D.; Li, X.; Quan, X.L.; Wang, Z.Y. Energy consumption-economic growth relationship and carbon dioxide emissions in China. Energy Policy 2011, 39, 568–574. [Google Scholar]
  16. Adom, P.K.; Bekoe, W.; Akoena, S.K.K. Modelling aggregate domestic electricity demand in Ghana: An autoregressive distributed lag bounds cointegration approach. Energy Policy 2012, 42, 530–537. [Google Scholar] [CrossRef]
  17. Fan, Y.; Xia, Y. Exploring energy consumption and demand in China. Energy 2012, 40, 23–30. [Google Scholar] [CrossRef]
  18. Mi, Z.F.; Pan, S.Y.; Yu, H.; Wei, Y.M. Potential impacts of industrial structure on energy consumption and CO2 emission: A case study of Beijing. J. Clean. Prod. 2015, 103, 455–462. [Google Scholar] [CrossRef] [Green Version]
  19. Hofman, B.; Labar, K. Structural change and energy use: Evidence from China’s provinces. World Bank China Work. Pap. Ser. 2007. [Google Scholar] [CrossRef]
  20. Chan, H.L.; Lee, S.K. Forecasting the demand for energy in China. Energy J. 1996, 1, 19–30. [Google Scholar]
  21. Chai, J.; Guo, J.E.; Wang, S.Y.; Lai, K.K. Why does energy intensity fluctuate in China? Energy Policy 2009, 37, 5717–5731. [Google Scholar] [CrossRef]
  22. Zheng, X.Y.; Wu, S.M.; Li, F.H. Changes in the economic structure and trends in China’s future energy demands. Soc. Sci. China 2021, 42, 116–137. [Google Scholar]
  23. Liou, H.M. Policies and legislation driving Taiwan’s development of renewable energy. Renew. Sustain. Energy Rev. 2010, 14, 1763–1781. [Google Scholar] [CrossRef]
  24. Uchiyama, Y.H. Present efforts of saving energy and future energy demand/supply in Japan. Energy Convers. Manag. 2002, 43, 1123–1131. [Google Scholar] [CrossRef]
  25. Tae, Y.J.; Tae, S.P. Structural change of the manufacturing sector in Korea: Measurement of real energy intensity and CO2 emissions. Mitig. Adapt. Strateg. Glob. Change 2000, 5, 221–238. [Google Scholar]
  26. Mukherjee, K. Energy use efficiency in U.S. manufacturing: A nonparametric analysis. Energy Econ. 2008, 30, 76–96. [Google Scholar] [CrossRef]
  27. Carmona, M.; Feria, J.; Golpe, A.A.; Iglesias, J. Energy consumption in the US reconsidered. Evidence across sources and economic sectors. Renew. Sustain. Energy Rev. 2017, 77, 1055–1068. [Google Scholar] [CrossRef]
  28. Cheng, B.S. Causality between energy consumption and economic growth in India: An application of cointegration and error-correction modeling. Indian Econ. Rev. 1999, 34, 39–49. [Google Scholar]
  29. Lee, C.C. Energy consumption and GDP in developing countries: A cointegrated panel analysis. Energy Econ. 2005, 27, 415–427. [Google Scholar] [CrossRef]
  30. Tiwari, A.K.; Eapen, L.M.; Nair, S.R. Electricity consumption and economic growth at the state and sectoral level in India: Evidence using heterogeneous panel data methods. Energy Econ. 2021, 94, 105064. [Google Scholar] [CrossRef]
  31. Kenneth, B.; Medlock, I.; Ronald, S. Economic development and end-use energy demand. Energy J. 2001, 22, 77–105. [Google Scholar]
  32. Amusa, H.; Amusa, K.; Mabugu, R. Aggregate demand for electricity in South Africa: An analysis using the bounds testing approach to cointegration. Energy Policy 2009, 37, 4167–4175. [Google Scholar] [CrossRef]
  33. Song, F.; Zheng, X.Y. What drives the change in China’s energy intensity: Combining decomposition analysis and econometric analysis at the provincial level. Energy Policy 2012, 51, 445–453. [Google Scholar] [CrossRef]
  34. Alam, M.M.; Murad, M.W. The impacts of economic growth, trade openness and technological progress on renewable energy use in organization for Economic Co-operation and Development countries. Renew. Energy 2020, 145, 382–390. [Google Scholar] [CrossRef]
  35. Huang, J.B.; Du, D.; Tao, Q.Z. An analysis of technological factors and energy intensity in China. Energy Policy 2017, 109, 1–9. [Google Scholar] [CrossRef]
  36. Lin, B.Q.; Zhu, J.P. Energy and carbon intensity in China during the urbanization and industrialization process: A panel VAR approach. J. Clean. Prod. 2017, 168, 780–790. [Google Scholar] [CrossRef]
  37. Liu, Y.B. Exploring the relationship between urbanization and energy consumption in China using ARDL (autoregressive distributed lag) and FDM (factor decomposition model). Energy 2009, 34, 1846–1854. [Google Scholar] [CrossRef]
  38. Sharif Hossain, M. Panel estimation for CO2 emissions, energy consumption, economic growth, trade openness and urbanization of newly industrialized countries. Energy Policy 2011, 39, 6991–6999. [Google Scholar] [CrossRef]
  39. Shahbaz, M.; Chaudhary, A.R.; Ozturk, I. Does urbanization cause increasing energy demand in Pakistan? Empirical evidence from STIRPAT model. Energy 2017, 122, 83–93. [Google Scholar] [CrossRef] [Green Version]
  40. Zheng, Y.M.; Qi, J.H.; Chen, X.L. The effect of increasing exports on industrial energy intensity in China. Energy Policy 2011, 39, 2688–2698. [Google Scholar] [CrossRef]
  41. Sbia, R.; Shahbaz, M.; Hamdi, H. A contribution of foreign direct investment, clean energy, trade openness, carbon emissions and economic growth to energy demand in UAE. Econ. Modell. 2014, 36, 191–197. [Google Scholar] [CrossRef] [Green Version]
  42. Destek, M.A.; Sinha, A. Renewable, non-renewable energy consumption, economic growth, trade openness and ecological footprint: Evidence from organization for Economic Co-operation and Development countries. J. Clean. Prod. 2020, 242, 118537. [Google Scholar] [CrossRef]
  43. Shiu, A.; Lam, P.L. Electricity consumption and economic growth in China. Energy Policy 2004, 32, 47–54. [Google Scholar] [CrossRef]
  44. Boontome, P.; Therdyothin, A.; Chontanawat, J. Investigating the causal relationship between non-renewable and renewable energy consumption, CO2 emissions and economic growth in Thailand. Energy Proc. 2017, 138, 925–930. [Google Scholar] [CrossRef]
  45. Masih, A.M.M.; Masih, R. Energy consumption, real income and temporal causality: Results from a multi-country study based on cointegration and error-correction modelling techniques. Energy Econ. 1996, 18, 165–183. [Google Scholar] [CrossRef]
  46. Ozturk, I.; Aslan, A.; Kalyoncu, H. Energy consumption and economic growth relationship: Evidence from panel data for low and middle income countries. Energy Policy 2010, 38, 4422–4428. [Google Scholar] [CrossRef]
  47. Coers, R.; Sanders, M. The energy–GDP nexus; addressing an old question with new methods. Energy Econ. 2013, 36, 708–715. [Google Scholar] [CrossRef] [Green Version]
  48. Ben Jebli, M.; Ben Youssef, S. The environmental Kuznets curve, economic growth, renewable and non-renewable energy, and trade in Tunisia. Renew. Sustain. Energy Rev. 2015, 47, 173–185. [Google Scholar] [CrossRef] [Green Version]
  49. Fang, Z.; Chang, Y.H. Energy, human capital and economic growth in Asia Pacific countries—Evidence from a panel cointegration and causality analysis. Energy Econ. 2016, 56, 177–184. [Google Scholar] [CrossRef]
  50. Aslan, A. The causal relationship between biomass energy use and economic growth in the United States. Renew. Sustain. Energy Rev. 2016, 57, 362–366. [Google Scholar] [CrossRef]
  51. Bhattacharya, M.; Paramati, S.R.; Ozturk, I.; Bhattacharya, S. The effect of renewable energy consumption on economic growth: Evidence from top 38 countries. Appl. Energy 2016, 162, 733–741. [Google Scholar] [CrossRef]
  52. Salim, R.H.; Rafiq, S. Why do some emerging economies proactively accelerate the adoption of renewable energy? Energy Econ. 2012, 34, 1051–1057. [Google Scholar] [CrossRef]
  53. Lin, B.Q.; Moubarak, M. Renewable energy consumption–Economic growth nexus for China. Renew. Sustain. Energy Rev. 2014, 40, 111–117. [Google Scholar] [CrossRef]
  54. Kahia, M.; Aïssa, M.S.B.; Lanouar, C. Renewable and non-renewable energy use-economic growth nexus: The case of MENA net oil importing countries. Renew. Sustain. Energy Rev. 2017, 71, 127–140. [Google Scholar] [CrossRef]
  55. Alsaleh, M.; Abdul-Rahim, A.S. Bioenergy consumption and economic growth in the EU-28 region: Evidence from a panel cointegration model. GeoJournal 2020, 86, 1245–1260. [Google Scholar] [CrossRef]
  56. Justice, G.; Seth, P.; George, N.; Philip, S.; Hayford, I.S. Do globalization and economic development promote renewable energy use in Ghana? Int. J. Adv. Eng. Res. Sci. 2021, 8, 109–117. [Google Scholar] [CrossRef]
  57. Akif Destek, M.A.; Aslan, A. Renewable and non-renewable energy consumption and economic growth in emerging economies: Evidence from bootstrap panel causality. Renew. Energy 2017, 111, 757–763. [Google Scholar] [CrossRef]
  58. Alper, A.; Oguz, O. The role of renewable energy consumption in economic growth: Evidence from asymmetric causality. Renew. Sustain. Energy Rev. 2016, 60, 953–959. [Google Scholar] [CrossRef]
  59. Mutascu, M. A bootstrap panel Granger causality analysis of energy consumption and economic growth in the G7 countries. Renew. Sustain. Energy Rev. 2016, 63, 166–171. [Google Scholar] [CrossRef]
  60. Chang, T.Y.; Chu, H.P.; Chen, W.Y. Energy consumption and economic growth in 12 Asian countries: Panel data analysis. Appl. Econ. Lett. 2013, 20, 282–287. [Google Scholar] [CrossRef]
  61. Wang, J.; Zhang, S.L.; Zhang, Q.J. The relationship of renewable energy consumption to financial development and economic growth in China. Renew. Energy 2021, 170, 897–904. [Google Scholar] [CrossRef]
  62. Kahsai, M.S.; Nondo, C.L.; Schaeffer, P.V.; Gebremedhin, T.G. Income level and the energy consumption–GDP nexus: Evidence from Sub-Saharan Africa. Energy Econ. 2012, 34, 739–746. [Google Scholar] [CrossRef]
  63. Dogan, E. Analyzing the linkage between renewable and non-renewable energy consumption and economic growth by considering structural break in time-series data. Renew. Energy 2016, 99, 1126–1136. [Google Scholar] [CrossRef]
  64. Costantini, V.; Martini, C. The causality between energy consumption and economic growth: A multi-sectoral analysis using non-stationary cointegrated panel data. Energy Econ. 2010, 32, 591–603. [Google Scholar] [CrossRef] [Green Version]
  65. Greening, L.A.; Gale, B.; Joseph, M.R. Modeling of industrial energy consumption: An introduction and context. Energy Econ. 2007, 29, 599–608. [Google Scholar] [CrossRef]
  66. Zhang, C.G.; Yan, L.Y. Panel estimation for urbanization, energy consumption and CO2 emissions: A regional analysis in China. Energy Policy 2012, 49, 488–498. [Google Scholar] [CrossRef]
  67. Wang, Q.; Wu, S.D.; Zeng, Y.E.; Wu, B.W. Exploring the relationship between urbanization, energy consumption, and CO2 emissions in different provinces of China. Renew. Sustain. Energy Rev. 2016, 54, 1563–1579. [Google Scholar] [CrossRef]
  68. Lin, B.Q.; Xie, X. Energy conservation potential in China’s petroleum refining industry: Evidence and policy implications. Energy Convers. Manag. 2015, 91, 377–386. [Google Scholar] [CrossRef]
  69. Yue, Q.; Chai, X.C.; Zhang, Y.J.; Wang, Q.; Wang, H.M.; Zhao, F.; Ji, W.; Lu, Y.Q. Analysis of iron and steel production paths on the energy demand and carbon emission in China’s iron and steel industry. Environ. Dev. Sustain. 2022, prepublish. [Google Scholar] [CrossRef]
  70. Dong, K.Y.; Hochman, G.; Zhang, Y.Q.; Sun, R.J.; Li, H.; Liao, H. CO2 emissions, economic and population growth, and renewable energy: Empirical evidence across regions. Energy Econ. 2018, 75, 180–192. [Google Scholar] [CrossRef]
  71. Bilgen, S. Structure and environmental impact of global energy consumption. Renew. Sustain. Energy Rev. 2014, 38, 890–902. [Google Scholar] [CrossRef]
  72. Zhao, D.Y.; Ma, Y.Y.; Lin, H.L. Using the Entropy and TOPSIS Models to Evaluate Sustainable Development of Islands: A Case in China. Sustainability 2022, 14, 3707. [Google Scholar] [CrossRef]
  73. Kaufmann, R.K. The effect of expected energy prices on energy demand: Implications for energy conservation and carbon taxes. Resour. Energy Econ. 1994, 16, 167–188. [Google Scholar] [CrossRef]
  74. Lin, B.Q.; Ouyang, X.L. Energy demand in China: Comparison of characteristics between the US and China in rapid urbanization stage. Energy Convers. Manag. 2014, 79, 128–139. [Google Scholar] [CrossRef]
  75. Jiang, Z.J.; Lin, B.Q. China’s energy demand and its characteristics in the industrialization and urbanization process: A reply. Energy Policy 2013, 60, 538–585. [Google Scholar] [CrossRef]
  76. Vo, X.V. Net private capital flows and economic growth—The case of emerging Asian economics. Appl. Econ. 2010, 42, 3135–3146. [Google Scholar] [CrossRef]
  77. Ju, K.Y.; Su, B.; Zhou, D.Q.; Wu, J.M. Does energy-price regulation benefit China’s economy and environment? Evidence from energy-price distortions. Energy Policy 2017, 105, 108–119. [Google Scholar] [CrossRef]
  78. Yan, H.J. Provincial energy intensity in China: The role of urbanization. Energy Policy 2015, 86, 635–650. [Google Scholar] [CrossRef]
  79. Jones, D.W. How urbanization affects energy-use in developing countries. Energy Policy 1991, 19, 621–630. [Google Scholar] [CrossRef]
  80. Ma, B. Does urbanization affect energy intensities across provinces in China? Long-run elasticities estimation using dynamic panels with heterogeneous slopes. Energy Econ. 2015, 49, 390–401. [Google Scholar] [CrossRef]
  81. Lin, B.Q.; Zhu, J.P. Impact of China’s new-type urbanization on energy intensity: A city-level analysis. Energy Econ. 2021, 99, 105292. [Google Scholar] [CrossRef]
  82. Zhong, K.Y. Does the digital finance revolution validate the Environmental Kuznets Curve? Empirical findings from China. PLoS ONE 2022, 17, e0257498. [Google Scholar] [CrossRef] [PubMed]
  83. Zhong, K.; Li, C.; Wang, Q. Evaluation of Bank Innovation Efficiency with Data Envelopment Analysis: From the Perspective of Uncovering the Black Box between Input and Output. Mathematics 2021, 9, 3318. [Google Scholar] [CrossRef]
Figure 1. (a) Scatter chart of provincial cement production and energy consumption; (b) Scatter chart of provincial steel production and energy consumption.
Sustainability 14 07009 g001
Figure 2. (a) Line graphs of the growth rates of China’s GDP, energy consumption and cement production; (b) Line graphs of the growth rates of China’s GDP, energy consumption, and steel production.
Sustainability 14 07009 g002
Figure 3. Relationship between economic growth, development of energy-intensive industries and energy consumption.
Sustainability 14 07009 g003
Figure 4. (a) Spatial distribution of energy consumption per capita in 2000; (b) Spatial distribution of energy consumption per capita in 2019.
Sustainability 14 07009 g004
Figure 5. (a) Spatial distribution of GDP per capita in 2000; (b) Spatial distribution of GDP per capita in 2019.
Sustainability 14 07009 g005
Figure 6. (a) Spatial distribution of development index of energy-intensive industries in 2000; (b) Spatial distribution of development index of energy-intensive industries in 2019.
Sustainability 14 07009 g006
Table 1. Descriptive statistical analysis.
VariableObsMeanStd. Dev.MinMax
l n E c (lntons of standrad coal)5800.93370.5655−0.64692.3983
l n Y (lnRMB yuan)58010.13470.86027.922612.0090
D e i 5800.14880.10810.01040.5531
P r (%)5802.05250.73960.92085.5135
I s (%)58042.84689.094428.600083.5000
K c (%)5801.40411.07070.20126.3147
U r (%)58050.917315.409623.200086.9000
T r (%)58015.705018.01420.681190.5325
Table 2. TSLS regression estimation and instrumental variable test (national level).
Variable(1)(2)(3)
l n E c l n E c D e i
l n Y 0.4220 ***
(17.63)
0.3485 ***
(16.85)
0.0905 ***
(28.09)
D e i 1.2138 ***
(14.30)
P r −0.0133
(−0.94)
−0.0131
(−1.09)
I s −0.0099 ***
(−8.12)
−0.0075 ***
(−7.54)
K c −0.0287
(−1.58)
−0.0094
(−0.61)
U r 0.0077 ***
(3.72)
0.0019
(1.07)
T r 0.0019 **
(2.24)
0.0020 ***
(2.80)
C
N522522522
Adj.R20.89900.92830.6138
F719.81 ***893.46 ***787.23 ***
Under identification test459.594 ***458.528 ***489.781 ***
Weak identification test3343.12 ***3225.653 ***37,000 ***
Over identification test8.858 ***46.239 ***7.224 ***
Note: The t values in parentheses, *** and ** correspond to passing the significance tests of 1% and 5%, respectively.
Table 3. Effects of China’s economic growth on energy consumption: direct and indirect effects.
TSLSTW-FE
δ 1 + δ 2 ψ Relative Impact (%) δ 1 + δ 2 ψ Relative Impact (%)
Direct effect0.348576.040.300558.40
Indirect effect0.109823.960.214141.60
Total effects0.45831000.5146100
Table 4. Transmission effect of seven kinds of energy-intensive products on energy consumption.
CementPlate GlassSodaTen Non-Ferrous MetalsCokeSteelThermal PowerTotal
Weight8.8413.5117.5020.1216.4912.5810.96100.00
Relative impact (%)2.123.244.194.823.953.012.6323.96
Table 5. Two-way fixed effect regression results.
Variable l n E c l n E c D e i
l n Y 0.3780 ***
(7.98)
0.3005 ***
(8.09)
0.1557 ***
(9.45)
D e i 1.3749 ***
(18.50)
Control YesYesYes
Year fixed effectYesYesYes
Province fixed effectYesYesYes
N580580580
Adj.R20.93500.96060.6609
F302.48 ***492.66 ***51.75 ***
Note: The t values in parentheses, *** corresponds to passing the significance tests of 1%.
Table 6. TSLS regression estimation and instrumental variable test (regional level).
Variable(4)(5)(6)(7)(8)(9)
l n E c D e i l n E c D e i l n E c D e i
l n Y 0.3762 ***
(9.73)
0.0724 ***
(13.99)
0.3045 ***
(6.91)
0.0609 ***
(23.54)
0.4240 ***
(6.87)
0.1192 ***
(20.14)
D e i 1.3850 ***
(6.27)
0.1683
(0.39)
1.2190 ***
(9.70)
P r −0.0210
(−1.19)
−0.1219 ***
(−3.86)
−0.0016
(−0.08)
I s −0.0104 ***
(−5.87)
−0.0082 ***
(−3.97)
−0.0041 *
(−1.88)
K c 0.0096
(0.48)
−0.0327
(−0.57)
−0.0367
(−0.88)
U r 0.0010
(0.39)
0.0062
(1.40)
−0.0048
(−0.84)
T r 0.0015 *
(1.78)
0.0043
(1.04)
0.0059 ***
(2.60)
C
N180180144144198198
Adj.R20.91090.53300.91880.80520.94790.6809
F237.57 ***194.48 ***206.78 ***550.20 ***466.16 ***403.49 ***
Under identification test154.493 ***168.690 ***123.784 ***135.055 ***155.154 ***185.960 ***
Weak identification test806.974 ***11,000 ***648.529 ***9571.940 ***436.039 ***17,000 ***
Over identification test7.555 ***3.619 **10.333 ***4.784 **25.087 ***18.185 ***
Note: The t values in parentheses, ***, ** and * correspond to passing the significance tests of 1%, 5% and 10%, respectively.
Table 7. Effects of economic growth in eastern, central, and western regions: direct and indirect effects.
EasternCentralWestern
δ 1 + δ 2 ψ Relative Impact (%) δ 1 + δ 2 ψ Relative Impact (%) δ 1 + δ 2 ψ Relative Impact (%)
Direct effect0.376278.950.304596.760.424074.48
Indirect effect0.100321.050.01023.240.145325.52
Total effects0.47651000.31471000.5693100
Note: Indirect effect of central region is not significant.
Publisher’s Note: MDPI stays neutral with regard to jurisdictional claims in published maps and institutional affiliations.

