Article

The Correlation Analysis between Air Quality and Construction Sites: Evaluation in the Urban Environment during the COVID-19 Pandemic

1
The Bartlett Real Estate Institute, University College London (UCL), London WC1E 6BT, UK
2
Department of Architecture and Built Environment, University of Nottingham Ningbo China, Ningbo 315100, China
3
Network for Education and Research on Peace and Sustainability (NERPS), Hiroshima University, Higashi-Hiroshima 739-8527, Hiroshima, Japan
4
Center on Smart and Connected Health Technologies, Mays Cancer Center, School of Nursing, UT Health San Antonio, San Antonio, TX 78229, USA
5
School of Public Health, Southeast University, Nanjing 210009, China
6
School of Computer Science, University of Nottingham Ningbo China, Ningbo 315100, China
7
Digital Design Lab, University of Nottingham Ningbo China, Ningbo 315100, China
*
Author to whom correspondence should be addressed.
Sustainability 2022, 14(12), 7075; https://doi.org/10.3390/su14127075
Submission received: 8 April 2022 / Revised: 3 June 2022 / Accepted: 7 June 2022 / Published: 9 June 2022
(This article belongs to the Collection Impact of COVID-19 on the Environment, Energy and Economics)

Abstract

:
This research studies the data on air quality and construction activities from 29 January 2020 to 30 April 2020. The analysis focuses on three sample districts of Hangzhou’s Xiacheng, Gongshu, and Xiaoshan districts. The samples, respectively, represent low-level, mid-level, and high-level districts in the scale of construction projects. The correlative relationships are investigated, respectively, in the periods of ‘pandemic lockdown (29 January 2020–20 February 2020)’ and ‘after pandemic lockdown (21 February 2020–30 April 2020)’. The correlative equations are obtained. Based on the guideline values of air parameters provided by the Chinese criteria and standards, the recommended maximum scales of construction projects are defined. The numbers of construction sites are 16, 118, and 311 for the Xiacheng, Gongshu, and Xiaoshan districts during the imposed lockdown period, respectively, and 19, 88, 234, respectively, after the lockdown period. Because the construction site is only one influential factor on the air quality, and the database is not large enough, there are some limitations in the mathematical model and the management plan. Possible problem solving techniques and future studies are introduced at the end of the research study.

1. Introduction

At the end of December 2019, the Wuhan Center for Disease Control and Prevention (CDC) detected an unknown type of pneumonia. Subsequently, it rapidly spread to other regions and countries worldwide at the beginning of 2020 and continues to date (November 2021). On 11 March 2020, the World Health Organization (WHO) declared that the COVID-19 caused by the new coronavirus SARS-Cov-2 had been characterized as a pandemic [1]. Control and safety measures were then introduced to reduce the spread and contain the disease at the city and regional levels, if not at the national level. It has impacted both economies and environments (Liu et al., 2020a) [2]. Urban development has been restricted and slowed down because of the restriction of public transportation, person-to-person distancing, and restricted policies on non-essential industries. In such circumstances, as suggested by [2], it is increasingly urgent and necessary to assess the environmental and economic impact of the COVID-19 to inform decision-makers at all levels.
Air quality is a significant indicator of the environmental aspect and urban development, especially during the prevalence of COVID-19. Current research studies indicated that air quality and pollutant concentration affected the infection ratio of COVID-19 [3,4,5,6,7]. It was noted that the COVID-19 prevalence had a positive impact on air quality, which showed some signs of improvement during the lockdown. Such effects were associated with travel restriction measures, temporary closure of businesses, and the implementation of large-scale remote working [8,9] Although air quality has been observed to increase in some regions of the world through the comparison of conditions before and during the prevalence of COVID-19 [10,11], it cannot be fully ascertained whether the decrease is due to a result of the pandemic. Seasonal cycles and climate patterns are also potential causes of air quality changes [2]. Many factors influence air quality, and earthwork could be one of the crucially influential factors [12]. As the city of Hangzhou began gradual reopening, more and more construction projects have begun, involving new construction projects and those halted by the imposed lockdown measures. As air quality index and pollutant concentration are the most prominent indicators of air quality, building a proper mathematical model that indicates the correlations between these parameters and construction sites is critical in order to implement a pragmatic economic and urban reopening for Hangzhou.
Hangzhou is selected as a case due to its political and geographical importance, and because of how it managed to contain the disease at an early stage. As the capital city of the Zhejiang province of China, Hangzhou is a large city consisting of eight main districts with an urban population of 7,590,000 and a vast construction industry. The city is characterized with a high number of construction sites. The total gross output value of construction in 2019 was 68.20 billion dollars. The city’s floor space of the building under construction was 268.4 million square meters, and the completed area was 6.7 million square meters [13]. Additionally, the development level of the construction industry and construction project distribution had significant differences at the district level. Xiaoshan district had the largest scale of construction industry and projects, while the scale of the construction industry in the downtown district was only 1/11 of Xiaoshan district, according to the report of the Hangzhou Statistical Yearbook, 2019. Based on the huge scale of the construction industry and the complex distribution of construction projects, a proper mathematical model based on air quality can help the local government manage better, especially in this particular period, or in future events of a similar nature.

Aim and Objectives

This paper aims to analyze the correlations between air quality indicators (i.e., air quality index, pollutant concentration, PM10, and PM2.5) and the number of construction sites in Hangzhou. This study provides an alternative construction site plan to decision-makers. The investigation and analysis are based on data mining, involving the number of construction sites, and several properties of air quality parameters to find potential correlations. In light of this overarching aim, the study’s objectives are as follows:
  • Collect data of the air quality index of Hangzhou city from 29 January 2020 to 30 April 2020, and information of construction sites, to analyze the correlative relationship between air quality and the number of construction sites;
  • Evaluate and visualize the data, and build a relevant mathematical model for the guidelines on the number of construction sites;
  • Discuss the probable reasons and provide solutions for improving the resiliency of construction sites to pandemics.
At first, this research analyzes the relationship between air quality and building construction sites in the literature review section. The selection of air indicators is based on the criteria mentioned in the literature review. After processing the collected data and the selection of sample districts, SPSS software is used to analyze the linear and non-linear regression. Finally, the results are provided, followed by a corresponding discussion, and conclusions are made based on the findings and related to the study’s objectives. There are some limitations of conducting research in the next step, such as the limited air quality data and complex air monitoring sites. The research data are processed adequately before the correlative analysis.

2. Literature Review: The Impact of Construction Sites on Air Quality

Numerous research studies in the literature analyze the impact of construction sites on air quality. The case study in Qingyuan, China, found that the average daily concentration of total suspended particulates (TSP), namely PM10 and PM2.5, surrounding a construction site increased by 42.24%, 19.76%, and 16.27%, respectively [14]. The large diameter particulate matter is the most prominent pollutant caused by the construction site and mainly contributed to the city’s dust [15,16]. In another case study of Germany’s construction sites, Faber et al. (2015) found that the PM10 emissions from building construction sites contribute to 44% of the total PM10 emissions from total construction activities in Germany.
Hence, construction sites result in many air pollutants and damage to air quality. Still, the specific influential factor related to the construction site on air quality is much more complicated. For instance, pollutant emissions can be caused by various mechanical processes, including transporting and handling bulk materials, drilling, sawing, milling, compacting, and grading the ground [17]. Additionally, the transportation of construction vehicles on the surrounding dirty and unpaved temporary roads may lead to the same order of magnitude or even higher than those caused by other construction site activities [14,17,18]. For instance, 6% of NOx pollutants and 10% of traffic-related PM emissions in Germany have resulted from mobile construction vehicles [19]. In terms of the mechanical and thermal building process, the combustion exhaust of machinery will increase particle and trace gas emissions from construction sites [20]. In addition, influential factors from the external environment will also affect the air quality in the vicinity of construction sites. Wind, humidity, and temperature can affect pollutant emissions. Existing scholarly research found that the pollutant emissions caused by construction sites have an imperatively positive correlation with wind speed, relative humidity, and that they have a weakly correlativity with temperature [21]. According to Araujo’s research [22], weather conditions could also have a potential effect, but the correlation cannot be further proved due to limitations of the size and complexity of the construction sites studied. Two factors of ‘air pollutant diffusion’ and ‘air quality parameters’ are discussed below.

2.1. Air Pollutant Diffusion

The diffusion law is an imperative aspect of research on building construction dust [14]. Different air diffusion methods directly impact the recording data of various climate stations in Hangzhou. Firstly, studies about diffusion law found that pollutant dispersion occurs from construction sites, and that the pollutant concentration decays at increasing distances or proximities [23]. In other similar studies of pollutant diffusion, Hitchins et al. [24] determined the PM concentration at an increasing distance at two sides of a road in Australia. They found that PM2.5 and ultrafine particles can decay to around 50% of the maximum, occurring at 100–150 m from the road. Additionally, according to the concentration results in weekly traffic conditions in Italy, it is reported by Buonanno et al. [25] that PM10 concentration would decrease exponentially away from the freeway. Secondly, wind can change the way of dispersion and affect the decay rate [23]. According to the measurement results of monitoring construction sites by Azarmi et al. [23], the concentration level of PM2.5 and PM10 increase when wind direction is from construction sites to the monitoring station. Another case study of Azarmi and Kumar [23] in Haywards Heath in West Sussex, United Kingdom, indicated that the particular matters emitted by the demolition process in construction sites are much more significant in the downwind direction and decreased logarithmically with downwind distance.
All research studies considering the concentration of pollutants have defined locations because construction sites’ location and the surrounding environment data pose some uncertainties. For example, in Nakada and Urban’s case study of air quality in São Paulo State, Brazil [9], the decrease in pollutant concentration in the main urban road was lower than in the other analyzed areas. Their result is probably due to the effects of transportation that was connected with several highways. Furthermore, the height of construction would also have an impact, because it determined the emission source. Based on a numerical simulation of dust dispersion at the urban building construction site by Wen [26], the influence of construction dust from pollution sources in a high position on surrounding air quality is much lower than that from pollution sources in a low position. This fact indicates that the advantage of height is conducive to the rapid dilution of dust and reduces air pollution in the surroundings.

2.2. Air Quality Parameters
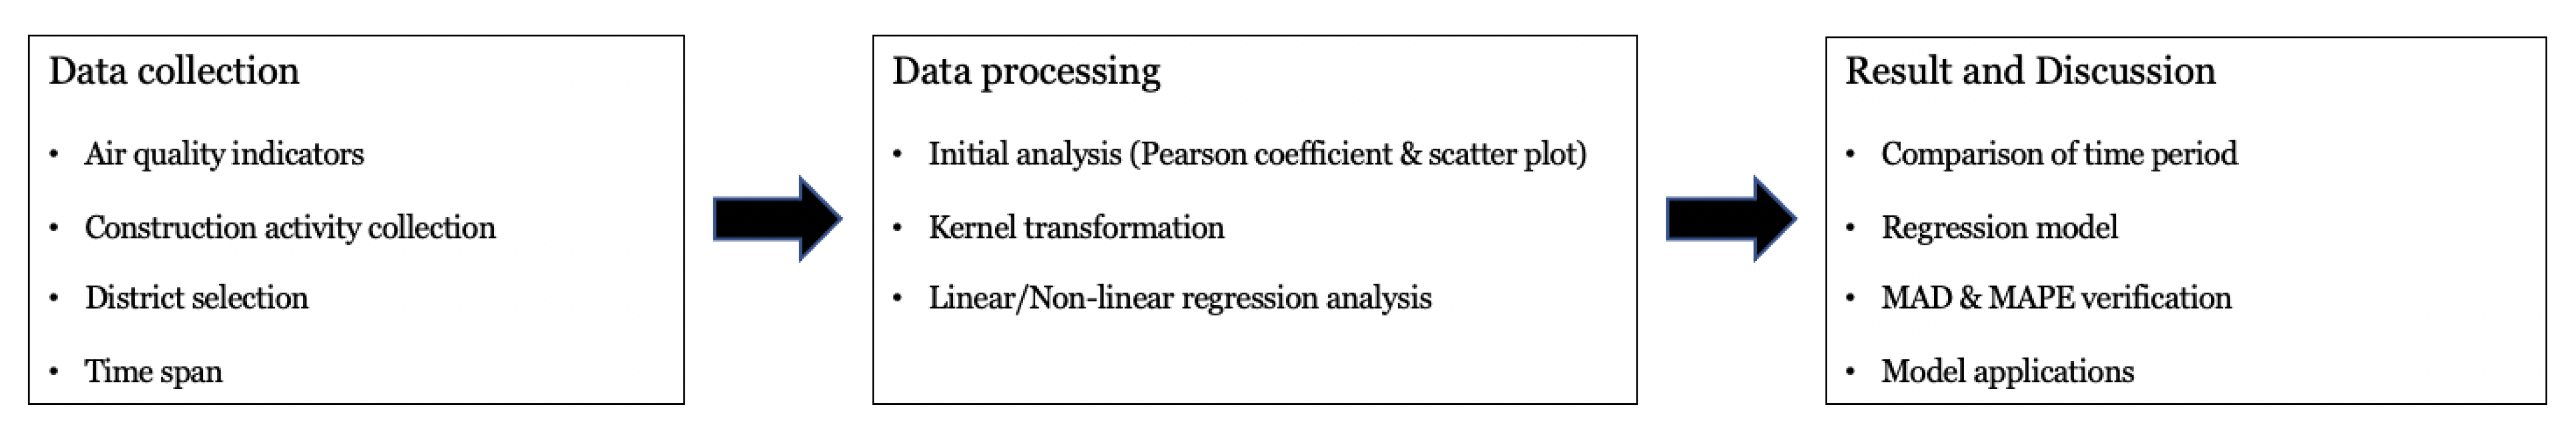
Gabriele et al. drew attention to the fact that the risk of infection and death by the COVID-19 pandemic could be associated with long-term exposure to air pollutants [7]. For instance, for every 1 μm/m3 above the mean, the infection ratio increased by 2.7% for NO2 and 3.0% for PM10 [27]. Therefore, proper selection of air parameters is the imperative precondition of a comprehensive and precise correlative mathematical model. The air quality index (AQI) is selected here to indicate the overall urban air quality, which is widely used by governmental environmental protection agencies and scientists worldwide [28]. The AQI refers to a combination number representing the total air quality and pollutant concentration [29]. It is calculated by the concentrations of each main category of pollutants. Other air quality parameters are selected based on the ‘Air Pollutant Guidelines’ provided by WHO, involving particulate matter (PM), ozone (O3), nitrogen dioxide (NO2), and sulfur dioxide (SO2) [1,30].
Particulate matter (PM) is a common proxy indicator for air pollution [31]. PM10 ( 10   μ m ) and PM2.5 ( 2.5   μ m ) are selected as air quality indicators in this research, as they are two kinds of respirable particulate matter air pollutants mainly related to construction work. More importantly, they pose a formidable public health threat in cardiovascular and respiratory disease, as well as in cancers [32,33], leading to approximately 4.2 million premature deaths worldwide in 2016 [31]. In this situation, WHO air quality guidelines provide strict and detailed guide values and interim targets for PM2.5 and PM10. Current research results indicate that the PM2.5 and PM10 mainly generated by dust at the constructions site would impact air quality to a certain degree [12,15,16,17,33,34,35]. In terms of PM2.5, it normally suspends in the air for a longer time and has a longer and worse influence on air quality than PM10 due to its small diameter [32]. Furthermore, PM2.5 has a seasonal characteristic due to its seasonal impact of gardens and farms in the city [36]. In a case study of construction sites and projects in London, the PM10 concentration in the working period was about 2.2-fold higher when compared with the non-working period [16]. However, according to the analysis result of case studies in Qingyuan city, the impact was limited in a range [34]. The fact that PM10 concentration exceeds the limit is mainly caused by the external atmospheric environment rather than the construction site itself (ibid). Particulate matter is more special and crucial during the course of the COVID-19 pandemic as it is likely related to the infection ratio. Indeed, PM10 is suggested as an indicator with relevance to the majority of the epidemiological data [30]. To a greater extent, PM10 has been an independent predictor of the spatial spread of COVID-19 [27]. For instance, Gabriele et al. [7] analyzed the correlations between atmospheric pollutant concentration and spatial-temporal distribution of cases and deaths. Their studies found that PM2.5 and PM10 had a higher non-linear correlation than NO2 and other air parameters.
Furthermore, ozone (O3), nitrogen dioxide (NO2), and sulfur dioxide (SO2) are air pollutants that can have a marked effect on human health [31]. Their effects include nose and throat irritation, lung inflammation, ischemic stroke, the triggering of asthma, etc. [30,31,37,38,39,40,41]. The sources of these three air pollutants are complicated to identify. It is said that they are partly relative to the construction project, but mainly result from the combustion of fuels in industry and vehicles [30,31,42]. In the combined impact of building sites on air quality, these air quality parameters (i.e., air quality index, PM10, PM2.5, O3, NO2, and SO2) would be selected in this research to provide a comprehensive and accurate assessment of air quality.
Many scholars and institutions have regulated the guideline value or the limit value of the pollutant concentrations. These are shown in Table S1 of Supplementary Materials, indicating China’s ambient air quality standard, published by the Ministry of Environmental Protection (MEP) in China [43]. Generally, most Chinese cities should be within the level-1 concentration limit, including Hangzhou city. In special cases, it can exceed the level-1 limit to some extent, but it cannot exceed the level-2 limit. Therefore, the level-1 and level-2 concentration limits are the primary and secondary references, respectively.
In addition, WHO has defined the guidelines and the interim target of air quality parameters in the second edition of their report on ‘air quality guidelines for Europe’ [44]. The detailed values are shown in Table S2. The guideline value represents the health effect that poses lower or no risk to the public. As highlighted by WHO [31], the interim target combines the observation in the studies on long-term health effects and the necessity of urban development. Based on the existing literature review on the topic, the impact of construction sites on air quality and pollutant emissions are complicated and related to multiple dimensional factors. Due to the limitation of the effect’s extent, construction sites usually affect the air quality by environmental and constructional factors. In the same environment and construction activity situation, a proper micro-management plan of the construction sites (i.e., on numbers and locations) can help the local governments make better decisions, especially during COVID-19 and similar disruptive events.

3. Methodology

This study aims to find the correlative relationship between seven air quality indicators (i.e., the air quality index, PM2.5, PM10, O3, NO2, SO2, and CO) and the number of construction sites in Hangzhou, China. The study is conducted at the district level, using available data for comparative analysis. Firstly, the daily air quality data and construction sites are available and collected from DATA.ZJ.GOV.CN [45,46]. The details of the data are further discussed in the following section. In the next step, the data is processed to evaluate the correlation. The comparison of the period, regression model, model verification, and the guideline number of construction sites are revealed based on data processing results. The procedures of the conducted research are shown in Figure 1 below.

3.1. Data Collection

3.1.1. Air Quality Indicators Collection

The selected air quality indicators correspond with China’s ambient air quality standard. The main air pollutant concentrations and air quality index (AQI) are selected as the indicators in this research. The recorded data of these air parameters were collected from 16 climate monitoring sites. The specific data were accessible at the government website of Zhejiang province [45]. The specific location of these monitoring sites is plotted in Figure 2. All districts have at least one air quality monitoring site, and some include more than one (see Table 1).
For those districts with only one air quality monitoring station, the air quality data from that monitoring station will be adopted for correlation research. In comparison, for those districts with two or more air quality monitoring stations, the mean values of those monitoring stations will be adopted for correlation analysis.

3.1.2. Construction Activity Collection

The Zhejiang Province Department obtains data of construction activity (2020b), including in the city of Hangzhou, as well as all the construction projects in other cities of the Zhejiang province. The data is sorted out in this step. During the investigated period, the scales of the constriction projects of eight districts in Hangzhou city were recorded. The data is summarized in Table 2.

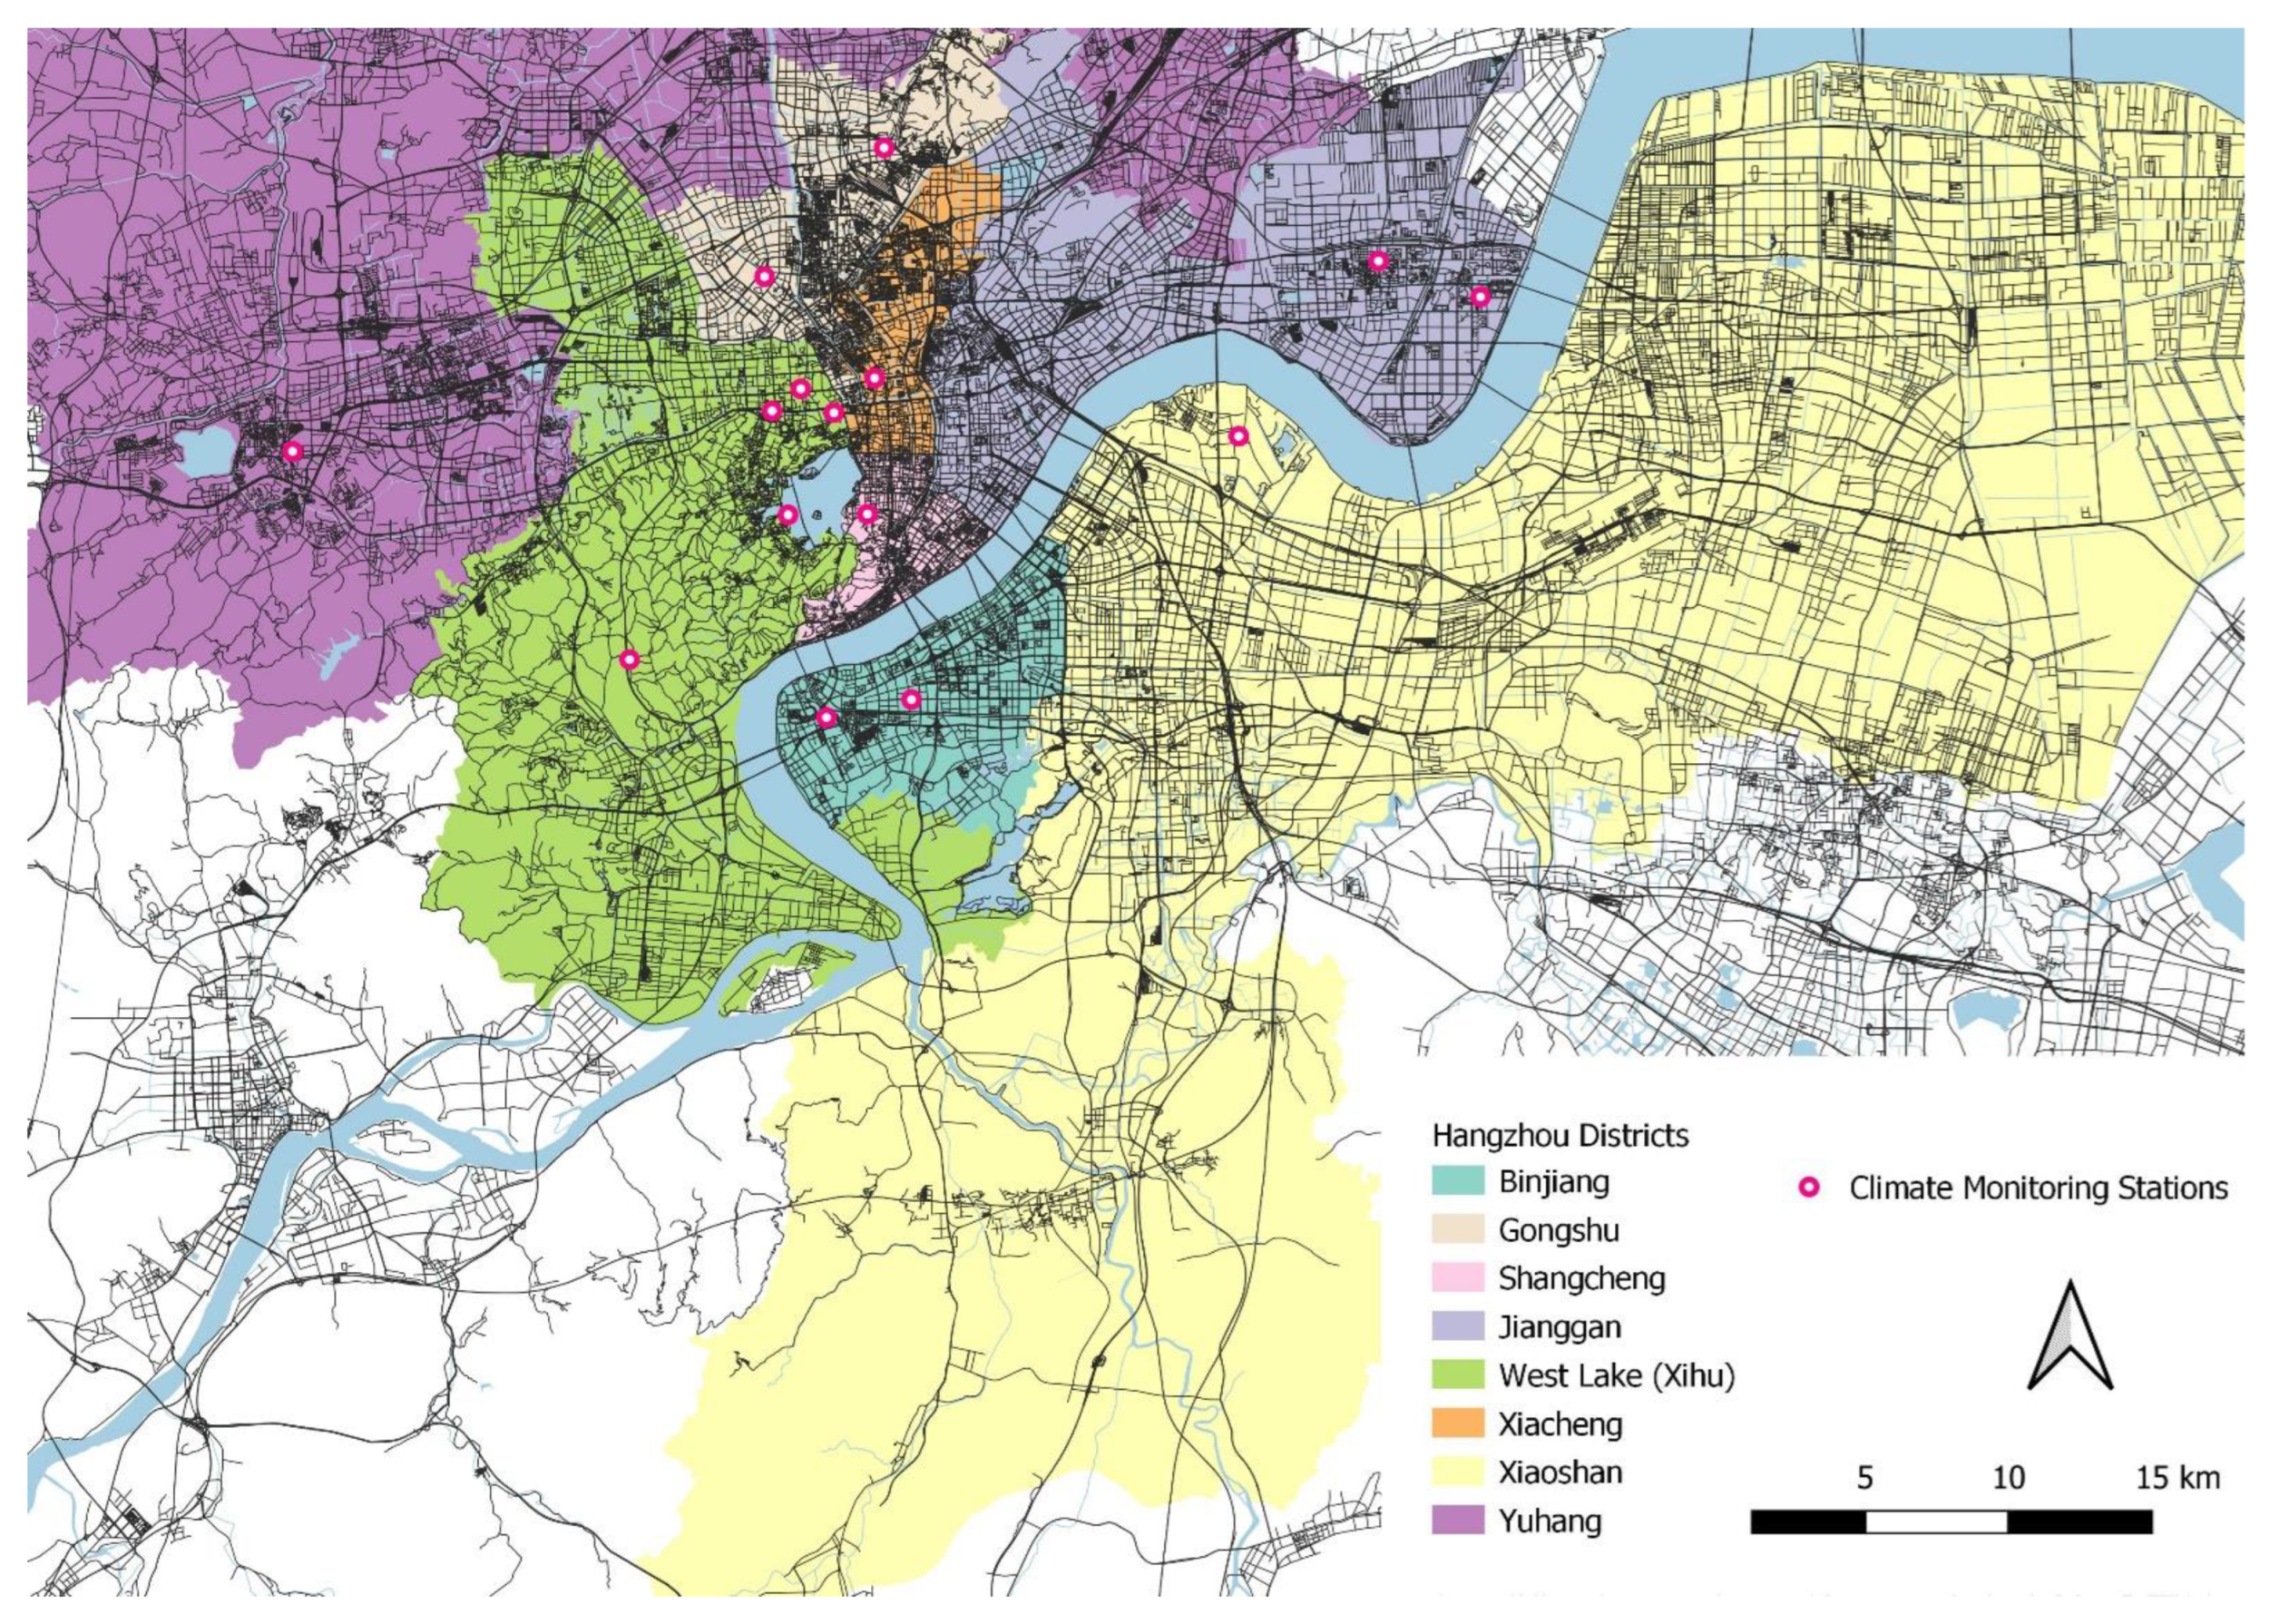
3.1.3. The Selection of Districts

Based on the detailed information of each district, Hangzhou’s eight districts could be classified into three tiers, including high-level districts (Yuhang district and Xiaoshan district), mid-level districts (Xihu district, Jianggan district, Gongshu district, and Binjiang district), and the low-level districts (Shangcheng district and Xiacheng district), as shown in Table 3.
The high-level districts have the largest scale of construction projects and a significant change in the number of construction sites, while the low-level districts had the least number of construction sites and had minimal changes in the total number of construction sites. The mid-level districts are intermediate between these two levels. Similarly, in the area aspect, the high-level districts had the largest area, and the areas of low-level districts were the smallest. Therefore, it is practical to select three samples to present each tier. The selection is based on the availability and consistency of data related to this study. The final selection includes the Xiacheng district, the Gongshu district, and the Xiaoshan district, highlighted in Table 3 as sample districts of this research study. Figure 3 shows the geographical locations of the construction sites in the selected districts.

3.1.4. Timespan

As the impact of construction is different in the lockdown period, the timespan should be specified. The air quality and construction site databases are continuous from 29 January 2020 to 3 April 2020. In this situation, this research is constrained in this timespan.
The lockdown of Hangzhou city is from 25 January 2020 to 20 February 2020, so the research time would be divided into two parts, as follows: closure period, and after the closure period. All construction activities were stopped during the lockdown period, so the air pollutant concentrations were supposed to decrease in the closure period and recover to increase after the closure.

3.1.5. Summary of Data Collection

This study uses a database of 93 samples of air quality data and construction site numbers, including 24 samples before the lockdown period and 69 samples after the period. The data is collected on the district level, which means that each district will have an individual database. As mentioned in the section on district selection, the Xiacheng, Gongshu, and Xiaoshan districts are selected for correlative analysis.
In this study, two sets of models are built in the period of lockdown and after lockdown, respectively. For model verification, five samples are taken from 16 February 2020 to 20 February 2020, which are used for the model verification during the lockdown period. Consequently, seven database samples from 24 April 2020 to 30 April 2020 are used for the model verification after the lockdown period. Therefore, 18 samples and 63 database samples are used for model training, respectively.

3.2. Data Processing

The data processing was performed using IBM Statistical Product and Service Solutions (SPSS—SPSS Version Number: R26.0.0.0, IBM Corp., New York, NY, USA). The IBM SPSS is a computer statistical software package, which could perform many types of data-oriented tasks and a huge range of statistical procedures [48]. In this research, the progress of regression is carried out using SPSS, involving the scatter plots, coefficient analysis, etc.
The regression method of SPSS can be initially divided into two parts of ‘input regression’ and ‘stepwise regression’. Moreover, the approach is divided into linear and non-linear regression. Input regression includes all parameters in the correlative model, while the stepwise method only uses the most influential parameter to build a model. Thus, the input method can increase the R square of the result in the circumstance of the disqualified accuracy of mathematical models. Still, the stepwise method can screen out the most influential factors [48]. Multiple methods are used to provide a comprehensive analysis. Non-linear input regression is the final modelling method, as it can produce the model with the highest accuracy. Thus, all the results from four modelling methods (stepwise linear regression, input linear regression, stepwise non-linear regression, and input non-linear regression) will be listed to make a comparison.

3.2.1. Initial Analysis

The regression method of linear or non-linear will be determined by the result of the Pearson correlative coefficient, and the performance of the scatter plot in this section. The Pearson correlative coefficient indicates the linear correlation extent between two parameters [49]. It will be used here to give an initial analysis of the extent of linear correlations. The result of the Pearson correlative coefficient consists of the Pearson correlation coefficient (PCC) and the value of significance (Sig.). Generally, the relationship between the extent of linear correlation and the value of the Pearson correlation is demonstrated in Table 4.
The value of significance presents the certainty that something will happen. Table 5 shows the certainty at each level of the value of significance.
Subsequently, the scatter plot shows the mutual changing trend of each parameter. In terms of the objectives of this research, these methods can generally evaluate the correlative relationship between the number of construction sites and each air quality parameter. In many cases, the linear model could not fit the data. Thus, it is required to have non-linear regression models [50]. As there is a weak linear correlation in this research, non-linear regression will be used for modelling.

3.2.2. Regression Analysis

Four regression models will be created including stepwise linear regression, input linear regression, stepwise non-linear regression, and input non-linear regression. The stepwise regression method can select the most relevant variables from all input variables. As the number of input variables decreases, the model becomes more concise, but the accuracy of the model drops. The input regression method uses all available variables as the input, including those poorly correlated variables.
Kernel transformation is used in this study to build non-linear regression models. Formally, Kernel transformation provides an effective method to achieve non-linear regression analysis [51]. Kernels can map complex non-linear data into a high-dimensional feature space where linear regression analysis is available [52]. The kernel transformation for the dataset N p = { x 1 ,   x 2 ,   x 3 ,   x 4 ,   x 5 ,   x 6 ,   x 7 } is expressed in the following steps [51]:
N p 1 = { x 1 ,   x 2 ,   x 3 ,   x 4 ,   x 5 ,   x 6 ,   x 7 } N p 2 = { x 1 2 ,   x 2 2 ,   x 3 2 , x 4 2 , x 5 2 , x 6 2 , x 7 2 , x 1 x 2 , x 1 x 3 , x 1 x 4 , x 1 x 5 , x 1 x 6 , x 1 x 7 , x 2 x 3 , x 2 x 4 , x 2 x 5 , x 2 x 6 , x 2 x 7 , x 3 x 4 , x 3 x 5 , x 3 x 6 , x 3 x 7 , x 4 x 5 , x 4 x 6 ,   x 4 x 7 , x 5 x 6 , x 5 x 7 , x 6 x 7 , x 1 , x 2 , x 3 , x 4 , x 5 , x 6 , x 7 }
The dataset N p 2 is utilized in the non-linear regression model because the SPSS linear regression is available. The air parameters analyzed in the non-linear regression are shown in Table 6.

3.3. MAD and MAPE Verification of Model

Prediction errors are common and exist in almost all predicted results of forecasting methods [53]. These prediction errors are estimated by computing the mean absolute deviation (MAD) and mean absolute percentage error (MAPE), which are used to calculate margin error from the predicted least square method of data [54]. Both approaches have different concepts in performing calculations with different results.
  • Mean Absolute Deviation
Mean absolute deviation (MAD) measures the accuracy of the prediction by averaging the alleged error. The value of MAD can be calculated by Equation (1), as follows:
MAD = | N x N p | n
where N x is the real construction sites number of the objective district ,   N p is the predictive number of construction sites in objective district, and   n is the number of validation group.
  • Mean Absolute Percentage Error
Mean absolute percentage error (MAPE) can be calculated by the Equation (2), as follows:
MAPE = | N x N p | N x n × 100 %
where   N x is the real construction sites number of the objective district ,   N p is the predictive number of construction sites in objective district, and n is the number of validation group.

3.4. Application of Correlative Model

After the production and verification of the correlative model, the model will be used for estimating the recommended construction sites by inputting the recommended value of each air parameter. Additionally, the model’s performance at the same district level is analyzed. If the performance is reasonable, the model can also indicate the recommended number of construction sites for other districts that are in the same district level.

4. Result & Discussions

4.1. The Comparison of Time Period

The average level of air quality and air pollutant concentrations are shown in Supplementary Materials of Table S1.
As shown in the table, most air parameters have increased after the lockdown period. The AQIs of the three tiers of districts were all increased to some extent. The results show that the air quality had been decreased since the lockdown of the city of Hangzhou was canceled. Among these air parameter changes, NO2 had the most increase in these three districts. Moreover, O3, PM10, and PM2.5 also increased to some extent. In this situation, the distinction of the period is imperative for this research.

4.2. Model Result

4.2.1. Pearson Correlative Coefficient

The Pearson correlation coefficient refers to the degree of correlation between the construction site numbers and each air quality indicator in this research. The result of the Pearson correlative coefficient of the three tiers of districts are shown in Tables S6–S8 in Supplementary Materials.
The high level of significance and the Pearson correlation coefficient are highlighted by marks (* for 0.01 significance level, and ** for 0.05 significance level) and highlights, respectively. Only CO and AQI have a robust linear correlation with the number of construction sites of the Xiaoshan district in lockdown, with a significant certainty to have happened. Other cases do not have substantial certainty or robust correlations. Generally, the result is not good enough for linear regression from this analysis.

4.2.2. Linear Correlative Analysis by Scatter Plots

The findings are summarized in Figures S1–S6 in Supplementary Materials for both time spans and three selected districts of the city of Hangzhou. The correlative scatter plot can roughly indicate the correlative relationship. The x-axis and y-axis consist of each parameter, including the construction site and air quality indicators. The scatter plot at the intersection of each plot matrix represents the relative changes of its corresponding x-axis parameters and y-axis parameters.
Therefore, the scatter plots in the first row and the first line of the scatter matrix indicate the correlative relationship between the construction numbers and the air parameters. The findings show the construction project scale in Xiacheng and Gongshu is small, especially in the Xiacheng district during the lockdown period. This result is caused by the small total number and the small change of the construction sites. Additionally, there is only a handful of daily data during the lockdown period. The scatter plots’ changing trend does not correspond to the linear correlation. As the scatter plot of the first row and first line of the matrix are complicated, non-linear regression method should be used.

4.3. Regression Analysis

The SPSS statistics achieve the non-linear regression. In addition, the result of the correlation model is shown in the following sub-sections.

4.3.1. Modelling Abstract

Tables S12–S17 in Supplementary Materials demonstrate the regression information of the model, including modeling number, the correlative coefficient R and R2, the adjusted R2, and the standard error of the estimated. Models 1 and 2 are the results obtained by stepwise and input multiple linear regression methods, respectively. Models 3 and 4 are the results obtained by the stepwise and input multiple non-linear regression methods, respectively. In addition, the predictors of the models are listed below the corresponding table.
Based on the regression results, model 4 has the largest R-value and R square, which suggests that the multiple non-linear regression of the input method can lead to the most relative correlations. The coefficient results of the non-linear regression analysis by input methods are listed in the next section.

4.3.2. Correlative Coefficient

This series of tables (see Tables S18–S23 in Supplementary Materials) demonstrate all the estimated regression coefficients of all the mathematical models which involve non-standardized coefficients B and standard error.
The value of non-standardized coefficient B is the corresponding coefficient of each parameter in the correlative equation. The approach helps to integrate the parameters and coefficients and produce the correlative equation.

4.3.3. Correlative Equation by SPSS Stepwise Non-Linear Regression Analysis

The non-standardized coefficients of the best-simulated model indicated the correlative equation coefficients. Therefore, the correlative equations of each district are shown in Equations (A1) to (A6) in Appendix A.

4.4. MAD & MAPE Verification of Multiple Non-Linear Regression Models

The result of the MAD and MAPE verifications are shown in Table 7 below.
According to the results in Table 7, most of the mathematical models are not overfitting because the differences between validation and training errors are not significant, except for the model of the Xiacheng district in the lockdown period. The probable reason is the small number of data groups in the lockdown period (only 18 groups of training data and 5 validation groups). The change in the number of construction sites in the Xiacheng district is also small, contributing to the overfitting. The mathematical model can accurately predict the correlative relationship in the Gongshu and Xiaoshan districts in the lockdown period and after the lockdown, as the value of MAPE is less than 10% [47]. Although the correlative relationships of Xiacheng district models are not accurate to a great extent, the value of MAD is small (3.692 & 3.350). That may be caused by the small number of construction sites in the Xiacheng district, so the cardinal number would be small, which will lead to smaller errors and MAD, while the mathematical model had a great performance on Xiaoshan district because the MAPE showed that the percentage errors were small (4.429% & 2.491%), but MAD is larger than other districts.

4.5. Predicted Guidelines Value of Construction Sites in Three Tiers of Districts

The recommended values of the air quality index and the concentrations of each air pollutants are provided in Table S1 in Supplementary Materials. The value of air indicators at level-1 and level-2 are input into the model’s correlative equation as independent variables. Subsequently, the corresponding number of recommended construction sites can be obtained, respectively.
Based on the results in Table 8, most of the data are invalid due to the deviation between the predicted value and the real number of construction sites, while some of them are negative. This was mainly caused by the impractical air guideline concentrations of CO and SO2. According to the mean concentration level mentioned in Tables S3–S5 in Supplementary Materials, most of the mean concentration of CO is less than 1 mg/m3 in both periods, except in the Xihu district after the lockdown. Nevertheless, the guideline concentration is 2 mg/m3 for CO in Table S1 of Supplementary Materials. It is similar for SO2, as the concentration of SO2 of all districts fluctuate at 5 μ g/m3, but the guideline concentration is 50 μ g/m3, which is much larger than the real concentration levels in the two periods. It is imperative to reset the input value of the air parameters into the correlative equations. The results of the reset are shown in Table 9.
These values are based on the recorded air parameters and the guideline values in the criteria. By inputting these values to each corresponding correlative equation, the outcomes of the predicted number of construction sites are shown (see Table 10). The findings can be used as the guideline values of each district tier. Moreover, we can take the same mean absolute percentage error (MAPE) value as the range for the guideline number of construction sites (i.e., the boundary value will be taken as an integer number).
The range of recommended number of construction sites is provided in Table 10. The Hangzhou government can probably control the construction site number in the recommended range to enhance the management in the situation in terms of the efficacy of the construction impact on air quality.

4.6. Performance of the Models in Other Districts That in the Same Tiers

With the input of the mean value of each air indicator into the corresponding equations, the outputs of guideline numbers of construction sites are calculated. The results are summarized in Table 11.
Table 11 indicate that model performances were poor in other districts. The predicted recommended number of construction sites was close to the sample district. Thus, it can be argued that the models could not fit other districts in the same tiers.

4.7. Discussion of The Final Result

Although the construction activities were suspended during the lockdown period, construction sites can also affect air quality by dust emissions. Wind can bring dust to neighborhoods. Based on the correlative equations from Equations (A1) to (A6) in Appendix A, Table 10 presents the difference in the recommended numbers of construction sites in lockdown and after lockdown. The recommended number of construction sites in lockdown and after lockdown periods represent the capacity of the largest scale of building construction that the district could undertake, respectively. The difference in the number of construction sites in the two periods also represents the impact of construction activities on surrounding air quality. For instance, the impacts include the effect of 13 ongoing construction sites on the surrounding air as 16 construction sites without construction activity to some extent in the Xiacheng district.

5. Further Discussions

5.1. Air Parameters Analysis in Correlative Mathematical Models

According to the literature review, PM10 and PM2.5 are closely related air parameters with the number of construction sites. In later parts of the modeling study, the first and third models show stepwise multiple linear and non-linear regression results, respectively. The findings indicate the most influential factors in a statistical sense. The results verify that only PM2.5 appeared among these most influential factors in the Gongshu and Xiaoshan districts after the lockdown periods. The AQI could reveal the impact of construction sites on the particulate matter (PM) from the sidewise, but it only appeared in the period models after the lockdown.
The probable reason for this deviation is the limited influence of particulate matter (PM) on the distance. Research by Yan et al. [14] found a similar characteristic. Additionally, there are only one or two air quality monitoring sites in these three districts, and the area of these three districts are 29.33 km2, 69.25 km2, 1417.83 km2, respectively [55]. Thus, the recorded air parameter value could not represent the real mean level, especially of PM10 with limited dispersion in the air. Indeed, PM2.5 could have a better performance in air dispersion than PM10, which is also evident in the result of the stepwise multiple regression.

5.2. Comparison Analysis

The comparison results in the earlier sections demonstrated the increase of air pollutant concentration after the lockdown period. However, it could not be fully proven that the building construction activities led to this increase. According to the 2020’s Spring Festival definition by the National Development and Reform Commission of China [56], the Spring Festival rush of transformation started on 10 January 2020 and ended on 18 February 2020. Due to the lockdown policies of the city of Hangzhou, the actual rushing back period after the Spring Festival was started on 20 February 2020 when the lockdown period was ended. Therefore, the phenomenon of the increase of air pollutant concentration may be a comprehensive result of multiple sources, including construction activities, traffic pollutant emissions, residents’ mobility, etc.

5.3. Poor Performance in Other Districts

Although the models indicated the correlative relationships and the guideline number of construction sites in the sample district, the study results show that it is challenging to apply the sample models to other districts of the same tiers, specifically in the mid-level and high-level districts. The major probable reason for this phenomenon was the large value of R square so that the model would fit data in the sample district to a greater extent. Additionally, although there were some differences in daily data among eight districts, the specific daily air quality data were close to a mean level on the same day. In this situation, the predicted numbers of construction sites in other districts would only depend on the real number of construction sites in each sample district.

5.4. Limitation of This Research & Future Studies

Based on the earlier discussions, other factors could affect air quality, such as wind, rainfalls, humidity, etc. However, the scope of this study is only on the recorded value of air quality concentration. Thus, the model and its predicted guideline number of construction sites could only provide a general proposal for the city managers. Future studies are expected to evaluate the comprehensive relationship between the construction sites and air quality, considering more variables and more case study samples.
In addition, several improvements could be made to enhance the accuracy of the research and reduce the deviation in the results. For instance, it is suggested to set up air quality monitoring sites or points near construction sites to record air quality directly and more precisely. As the study shows, the locations of the air monitoring sites were also influential, as results were affected by of wind and rainfalls. The air pollutant dispersion study by Yan [14] introduces a monitoring method of up-downwind direction, which combines the influence of wind, the reference points, and monitoring points set up on eight sides of the wind. As the existing reference points, the recorded data could reveal the impact of construction sites on air quality to a greater extent. Furthermore, the rainfalls have an apparent inhibitory effect on dust dispersion [57]. Thus, we should only consider air quality data on sunny and cloudy days and select more meteorological data for future studies. Other data should include wind speed and direction, temperature, humidity, and atmospheric pressure. These methods can decrease the effect of other influential factors.

6. Conclusions

In this research, the SPSS linear and non-linear multiple regression methods were adopted to analyze the correlative relationship between air quality and the number of construction sites. As an effect of lockdown, the research time was divided into two periods based on the end of lockdown closure in the sample city of Hangzhou, China. To analyze different district tiers, three samples of districts were selected. This approach helped to have a more accurate discussion on comparisons and case study research. Comprehensive indicators of O3, TSP (PM10 and PM2.5), CO, NO2, SO2, and AQI were selected in this research to quantify and characterize the impact of air quality from building construction sites comprehensively. The data of construction activities of each district were collected at the same time.
The main conclusions of this research are summarized as the following four points:
  • The air pollutant concentrations decreased during the lockdown period and started to increase after the lockdown period. As all the construction activities were stopped during the closure of the city of Hangzhou, the data shows that the building construction sites would increase the dust and air pollutant emissions. Specifically, NO2 had the largest increase. It increased by more than 150% in all eight districts. Thus, we see an opportunity to have limitations on construction sites and upgrade standards on pollution levels for construction sites.
  • The most influential air indicators screened by the SPSS stepwise regression method are NO2, SO2, CO, and PM2.5. These are highlighted in AQI of two periods, in the lockdown and after the lockdown time. The deviation between this result and the literature review analysis was mainly caused by the limitation of the number and location of air monitoring sites.
  • The correlative equations for three sample districts were provided in the results section. Subsequently, the recommended number of construction sites for the Xiacheng, Gongshu, Xiaoshan districts were 10–16, 113–118, and 285–311, respectively, in the lockdown period, and 13–19, 77–88, and 223–234, respectively, after the lockdown period.
  • The performances of models and correlative equations were poor in other districts that belong to the same tiers at the construction project level. The forecasting number of construction sites was highly dependent on the real number of construction sites in the sample districts.
The research findings show that the construction sites have an imperative impact on the air quality in Hangzhou and at the district level. The study provides a guideline to help the management of construction sites for local government based on the correlative analysis. The current cases and studies show that construction management is mostly based on the project itself within its lifecycle [58,59]. In this situation, this research can fill the gap on the construction management processes at the macro-level (i.e., either city level or district level), especially during special situations like the COVID-19 prevalence period.

Supplementary Materials

The following supporting information can be downloaded at: https://www.mdpi.com/article/10.3390/su14127075/s1, Table S1: Ambient air quality standard in China (Source: Adapted by the Authors, data extracted from the Chinese Environmental protection Agency).; Table S2: WHO Guidelines value for air pollution (WHO, 2000); Table S3: Mean level of air indicators in low-level districts; Table S4: Mean level of air indicators in mid-level districts; Table S5: Mean level of air indicators in high-level districts; Table S6: Pearson correlation coefficient of Xiacheng district in lockdown; Table S7: Pearson correlative coefficient of Gongshu district in lockdown; Table S8: Pearson correlative coefficient of Xiaoshan district in lockdown; Table S9: Pearson correlative coefficient of Xiacheng district after the lockdown; Table S10: Pearson correlative coefficient of Gongshu district after the lockdown; Table S11: Pearson correlative coefficient of Xiaoshan district after the lockdown; Figure S1: Correlative scatter plot of XiaCheng district; Figure S2: Correlative scatter plot of Gongshu district; Figure S3: Correlative scatter plot of Xiaoshan district; Figure S4: Correlative scatter plot of XiaCheng district; Figure S5: Correlative scatter plot of Gongshu district; Figure S6: Correlative scatter plot of Xiaoshan district; Table S12: Model summary of Xiacheng district in the lockdown period; Table S13: Model summary of Gongshu district in the lockdown period; Table S14: Model summary of Xiaoshan district in the lockdown period; Table S15: Model summary of Xiacheng district after the lockdown; Table S16: Model summary of Gongshu district after the lockdown; Table S17: Model summary of Xiaoshan district after the lockdown; Table S18: Correlative coefficients of XiaCheng district; Table S19: Correlative coefficients of Gongshu district; Table S20: Correlative coefficients of Xiaoshan district; Table S21: Correlative coefficients of XiaCheng district; Table S22: Correlative coefficients of Gongshu district; Table S23: Correlative coefficients of Xiaoshan district.

Author Contributions

Conceptualization, H.L., A.C. and S.P.A.; Data curation, Z.Z. and M.S.; Formal analysis, H.L., Z.Z., Z.S., S.P.A. and M.S.; Funding acquisition, A.C.; Investigation, A.C. and A.D.; Methodology, Z.S., S.P.A. and A.D.; Supervision, A.C. and Z.Z.; Validation, H.L., Z.Z. and A.D.; Visualization, H.L. and M.S.; Writing—original draft, H.L. and A.C.; Writing—review & editing, A.C., Z.Z., Z.S., S.P.A., M.S. and A.D. All authors have read and agreed to the published version of the manuscript.

Funding

The corresponding author acknowledges the National Natural Science Foundation of China (NSFC) for the provision of funding for project number 71950410760. He also acknowledges the Ministry of Education, Culture, Sports, Science and Technology (MEXT), Japan Government, and the Network for Education and Research on Peace and Sustainability (NERPS), Hiroshima, Japan.

Institutional Review Board Statement

Not applicable.

Informed Consent Statement

Not applicable.

Data Availability Statement

All data are publicly available and are provided as supplementary materials to this paper.

Conflicts of Interest

The authors declare no conflict of interest.

Appendix A. Correlated Model

  • In the lockdown period
For the Xiacheng district:
N 1 = 3.509 + 0.025 O 3 + 9.975 C O + 1.035 N O 2 + 1.692 S O 2 0.006 ( N O 2 ) 2 0.064 ( S O 2 ) 2 0.002 O 3 · N O 2 + 0.003 O 3 · S O 2 0.001 P M 10 · S O 2 0.548 C O · N O 2 + 0.004 N O 2 · P M 2.5 0.043 N O 2 · S O 2 0.007 P M 2.5 · S O 2 + 0.001 S O 2 · A Q I
For the Gongshu district:
N 2 = 82.219 + 7.725 C O 2.210 N O 2 + 0.117 P M 2.5 + 2.186 S O 2 4.375 × 10 5 ( O 3 ) 2 1.279 ( C O ) 2 0.730 ( S O 2 ) 2 0.003 O 3 · N O 2 + 0.001 O 3 · P M 2.5 0.019 P M 10 · N O 2 1.943 C O · N O 2 + 0.013 C O · P M 2.5 + 0.667 N O 2 · S O 2 + 0.010 N O 2 · A Q I  
For the Xiaoshan district:
N 3 = 294.222 + 0.05 O 3 57.723 C O 1.607 N O 2 + 0.249 P M 2.5 4.927 S O 2 0.287 A Q I 0.001 ( O 3 ) 2 + 15.398 ( C O ) 2 + 0.045 ( N O 2 ) 2 0.004 ( P M 2.5 ) 2 + 0.003 O 3 · P M 10 + 0.690 O 3 · C O 0.018 O 3 · N O 2 0.253 P M 10 · C O 0.004 P M 10 · N O 2 + 0.221 N O 2 · S O 2 + 0.047 S O 2 · A Q I
  • After the lockdown period
For the Xiacheng district:
N 1 = 14.725 0.005 O 3 + 0.016 P M 10 + 9.206 C O + 0.006 N O 2 0.234 P M 2.5 + 0.051 S O 2 + 0.072 A Q I + 1.006 × 10 5 ( O 3 ) 2 7.026 ( C O ) 2 0.001 ( P M 2.5 ) 2 0.029 ( S O 2 ) 2 + 0.038 O 3 · C O 0.001 O 3 · N O 2 0.001 O 3 · P M 2.5 0.001 O 3 · S O 2 + 0.001 O 3 · A Q I 0.024 P M 10 · C O 4.310 × 10 5 P M 10 · N O 2 + 0.003 P M 10 · S O 2 0.001 P M 10 · A Q I + 0.196 C O · N O 2 + 0.254 C O · P M 2.5 + 0.511 C O · S O 2 0.334 C O · A Q I 0.004 N O 2 · S O 2 0.003 P M 2.5 · S O 2 + 0.003 P M 2.5 · A Q I + 0.002 S O 2 · A Q I
For the Gongshu district:
N 2 = 91.825 0.054 O 3 + 0.062 P M 10 10.688 C O 0.271 N O 2 + 0.509 P M 2.5 0.356 S O 2 0.316 A Q I 1.194 × 10 5 ( P M 10 ) 2 0.958 ( C O ) 2 0.005 ( N O 2 ) 2 0.002 ( P M 2.5 ) 2 0.037 ( S O 2 ) 2 0.001 ( A Q I ) 2 0.001 O 3 · P M 10 + 0.023 O 3 · C O + 0.001 O 3 · N O 2 0.001 O 3 P M 2.5 0.010 O 3 · S O 2 + 0.003 O 3 · A Q I 0.132 P M 10 · C O + 0.007 P M 10 · N O 2 0.004 P M 10 · S O 2 + 0.825 C O · N O 2 + 0.286 C O · P M 2.5 + 0.749 C O · S O 2 0.394 C O · A Q I 0.012 N O 2 · P M 2.5 0.005 N O 2 · S O 2 0.002 N O 2 · A Q I 0.033 P M 2.5 · S O 2 + 0.048 S O 2 · A Q I
For the Xiaoshan district:
N 3 = 253.375 0.208 O 3 0.117 P M 10 + 7.083 C O 1.652 N O 2 + 0.583 P M 2.5 + 4.943 S O 2 + 0.417 A Q I 0.002 ( P M 10 ) 2 25.430 ( C O ) 2 + 0.012 ( N O 2 ) 2 + 0.005 ( P M 2.5 ) 2 0.185 ( S O 2 ) 2 0.016 ( A Q I ) 2 + 0.003 O 3 · P M 10 + 0.102 O 3 · C O 0.007 O 3 · N O 2 0.005 O 3 · P M 2.5 0.005 O 3 · S O 2 + 0.006 O 3 · A Q I 0.665 P M 10 · C O + 0.004 P M 10 · N O 2 + 0.050 P M 10 · S O 2 + 0.795 C O · N O 2 + 1.328 C O · P M 2.5 2.082 C O · S O 2 0.215 C O · A Q I 0.031 N O 2 · P M 2.5 + 0.087 N O 2 · S O 2 + 0.018 N O 2 · A Q I 0.081 P M 2.5 · S O 2 + 0.013 P M 2.5 · A Q I 0.078 S O 2 · A Q I

References

  1. World Health Organization (WHO). WHO Direct-General’s Opening Remarks at the Media Briefing on COVID-19—11 March 2020. 2020. Available online: https://www.who.int/dg/speeches/detail/who-director-general-s-opening-remarks-at-the-media-briefing-on-covid-19---11-march-2020 (accessed on 18 October 2020).
  2. Liu, Q.; Harris, J.; Chiu, L.; Sun, D.L.; Houser, P.; Yu, M.Z.; Duffy, D.; Little, M.; Yang, C.W. Spatiotemporal impacts of COVID-19 on air population in California, USA. Sci. Total Environ. 2021, 750, 141592. [Google Scholar] [CrossRef] [PubMed]
  3. Marc, S.; Aurelio, T.; Maria, B. Effects of long-term exposure to air pollutants on the spatial spread of COVID-19 in Catalonia, Spain. Environ. Res. 2020, 191, 110177. [Google Scholar]
  4. Ming, W.; Zhou, Z.; Ai, H.; Bi, H.; Zhong, Y. COVID-19 and Air Quality: Evidence from China. Emerg. Mark. Financ. Trade 2020, 56, 2422–2442. [Google Scholar] [CrossRef]
  5. Shi, K.; Wu, L. Forecasting air quality considering the socio-economic development in Xingtai. Sustain. Cities Soc. 2020, 61, 102337. [Google Scholar] [CrossRef]
  6. Zhang, D.; Yang, S.; Wang, Z. Assessment of ecological environment impact in highway construction activities with improved group AHP-FCE approach in China. Environ. Monit. Assess. 2020, 192, 451. [Google Scholar] [CrossRef]
  7. Gabriele, A.; Stefano, L.; Giovanni, A. Assessing correlations between short-term exposure to atmospheric pollutants and COVID-19 spread in all Italian territorial areas. Environ. Pollut. 2021, 268, 115714. [Google Scholar]
  8. Cheshmehzangi, A. The City in Need: Urban Resilience and City Management in Disruptive Disease Outbreak Events; Springer: Singapore, 2020. [Google Scholar]
  9. Nakada, L.Y.K.; Urban, R.C. COVID-19 pandemic: Impacts on the air quality during the partial lockdown in Sao Paulo state, Brazil. Sci. Total Environ. 2020, 730, 139087. [Google Scholar] [CrossRef]
  10. Liu, F.; Page, A.; Strode, S.; Yoshida, Y.; Choi, S.; Zheng, B. Abrupt decline in tropospheric nitrogen dioxide over China after the outbreak of COVID-19. Sci. Adv. 2020, 6, eabc2992. [Google Scholar] [CrossRef]
  11. Liu, Q.; Sha, D.X.; Liu, W.; Houser, P.; Zhang, L.Y.; Hou, R.Z.; Lan, H.; Flynn, C.; Lu, M.Y.; Hu, T.; et al. Spatiotemporal patterns of COVID-19 impact on human activities and environment in mainland China using nighttime light and air quality data. Remote Sens. 2020, 12, 1576. [Google Scholar] [CrossRef]
  12. Faber, P.; Drewnick, F.; Borrmann, S. Aerosol particle and trace gas emissions from earthworks, road construction, and asphalt paving in Germany: Emission factors and influence on local air quality. Atmos. Environ. 2015, 122, 662–671. [Google Scholar] [CrossRef]
  13. Hangzhou Statistical Yearbook. Population and Employment, Construction. 2019. Available online: http://tjj.hangzhou.gov.cn/art/2020/9/8/art_1229279688_56705074.html (accessed on 22 October 2020).
  14. Yan, H.; Ding, G.L.; Li, H.Y.; Wang, Y.S.; Zhang, L.; Shen, Q.P.; Feng, K.L. Field Evaluation of the dust impacts from Construction Sites on surrounding Areas: A City Case Study in China. Sustainability 2019, 11, 1906. [Google Scholar] [CrossRef]
  15. Zhang, R.; Jing, J.; Tao, J.; Hsu, S.C.; Wang, G.; Cao, J.; Lee, C.S.L.; Zhu, L.; Chen, Z.; Zhao, Y.; et al. Chemical characterization and source apportionment of PM2.5 in Beijing: Seasonal perspective. Atmos. Chem. Phys. 2013, 13, 7053–70704. [Google Scholar] [CrossRef]
  16. Azarmi, F.; Kumar, P. Ambient exposure to coarse and fine particle emissions from building demolition. Atmos. Environ. 2016, 137, 62–79. [Google Scholar] [CrossRef]
  17. Muleski, G.E.; Cowherd, C., Jr.; Kinsey, J.S. Particulate emissions from construction activity. J. Air Waste Manag. Assoc. 2005, 55, 772–783. [Google Scholar] [CrossRef] [PubMed]
  18. Kinsey, J.; Linna, K.; Squier, W.; Muleski, G.; Cowherd, C. Characterization of the fugitive particulate emissions from construction mud/dirt carryout. J. Air Waste Manag. Assoc. 2004, 54, 1394–1404.A. [Google Scholar] [CrossRef] [PubMed]
  19. Helms, H.; Jamet, M.; Heidt, C. Renewable Fuel Alternatives for Mobile Machinery. Heidelberg: Institut für Energie-und Umweltforschung. 2017. Available online: https://www.ifeu.de/fileadmin/uploads/ifeu-Erneuerbare-Kraftstoffalternativen-fu%CC%88r-mobile-Maschinen-20171011_Final.pdf (accessed on 21 October 2020).
  20. Ketchman, K.; Bilec, M. Quantification of particulate matter from commercial building excavation activities using life-cycle approach. J. Constr. Eng. Manag. 2013, 139, A4013007. [Google Scholar] [CrossRef]
  21. Luo, Y. Study on Dust Emission Characteristics of Typical Construction Site in Chongqing; Southwest University: Chongqing, China, 2017. [Google Scholar]
  22. Araujo, I.P.S.; Costa, D.B.; Moraes, R.J.B.D. Identification and Characterizations of Particulate Matter Concentrations at Construction Jobsites. Sustainability 2014, 6, 7666–7688. [Google Scholar] [CrossRef]
  23. Azarmi, F.; Kumar, P.; Marsh, D.; Fuller, G. Assessment of the long-term impacts of PM10 and PM2.5 particles from construction works on surrounding areas. Environ. Sci.-Processes Impact 2016, 18, 208–221. [Google Scholar] [CrossRef]
  24. Hitchins, J.; Morawska, L.; Wolff, R.; Gilbert, D. Concentrations of submicrometre particles from vehicle emissions near a major road. At. Environ. 2000, 51–59. [Google Scholar] [CrossRef]
  25. Buonanno, G.; Dell’Isola, M.; Stabile, L.; Viola, A. Uncertainty Budget of the SMPS–APS System in the Measurement of PM1, PM2. 5, and PM10. Aerosol Sci. Technol. 2009, 43, 1130–1141. [Google Scholar] [CrossRef]
  26. Wen, L.L. Numerical Simulation of the Spatial Migration Rule of Fugitive Dusts at Urban Building Construction Sites; Lanzhou University: Gansu, China, 2011. [Google Scholar]
  27. Ali, N.; Islam, F. The effects of air pollution on COVID-19 infection and mortality—A review on recent evidence. Front. Public Health 2020, 779, 580057. [Google Scholar] [CrossRef] [PubMed]
  28. Lekkas, T.; Kolokythas, G.; Nikolaou, A.; Kostopoulou, M.; Kotrikla, A.; Gatidou, G.; Thomaidis, N.S.; Golfinopoulos, S.; Makri, C.; Babos, D.; et al. Evaluation of the pollution of the surface waters of Greece from the priority compounds of list II, 76/464/EEC directive, and other toxic compounds. Environ. Int. 2004, 30, 995–1007. [Google Scholar] [CrossRef] [PubMed]
  29. Ministry of Ecology and Environment of China (MEEC). Technical Regulation on Ambient Air Quality Index. HJ 633-2012. 2012. Available online: http://www.mee.gov.cn/ywgz/fgbz/bz/bzwb/jcffbz/201203/W020120410332725219541.pdf (accessed on 18 December 2020).
  30. WHO (World Health Organization). Air Quality Guidelines Global Update 2005; WHO Regional Office for Europe: Copenhagen, Denmark, 2005; p. 13. ISBN 92 890 2192 6. [Google Scholar]
  31. World Health Organization (WHO). Ambient (Outdoor) Air Pollution. 2018. Available online: https://www.who.int/en/news-room/fact-sheets/detail/ambient-(outdoor)-air-quality-and-health (accessed on 3 November 2020).
  32. Cao, C.; Jiang, W.J.; Wang, B.Y.; Fang, J.H.; Lang, J.D.; Tian, G.; Jiang, J.; Zhu, T.F. Inhalable Microorganisms in Beijing’s PM2.5 and PM10 Pollutants during a Severe Smog Event. Environ. Sci. Technol. 2014, 48, 1499–1507. [Google Scholar] [CrossRef] [PubMed]
  33. Jung, S.H.; Kang, H.; Sung, S.; Hong, T. Healthy risk assessment for occupants as a decision-making tool to quantify the environmental effects of particulate matter in construction projects. Build. Environment. 2019, 161, 106267. [Google Scholar] [CrossRef]
  34. Yan, H.; Ding, G.L.; Zhang, Y.; Huang, X.H.; Wang, Y.S.; Li, H.Y. Measurement and Influencing Factors Analysis of PM10 Emissions in Construction Site. In Proceedings of the International Conference in Construction and Real Estate Management 2018, Charleston, SC, USA, 9–10 August 2018. [Google Scholar]
  35. Zhang, M.; Liu, X.; Ding, Y. Assessing the influence of urban transportation infrastructure construction on haze pollution in China: A case study of Beijing-Tianjin-Hebei region. Environ. Impact Assess. Rev. 2021, 87, 106547. [Google Scholar] [CrossRef]
  36. Li, C.M.; Zhang, K.; Zhao, Z.X.; Ma, Z.T.; Liu, X.L. Investigation of the impact of land-use distribution on PM2.5 in Weifang seasonal variations. Int. J. Environ. Res. Public Health 2020, 17, 5135. [Google Scholar] [CrossRef]
  37. Lisabeth, L.; Escobar, J.; Dvonch, T.; Sanchez, B.; Majersik, J.; Brown, D.; Smith, M.; Morgenstern, L. Ambient air pollutant and risk for ischemic stroke and transient ischemic attack. Ann. Neurol. 2008, 64, 53–59. [Google Scholar] [CrossRef]
  38. Shusterman, D. The effects of air pollutants and irritants on the upper airway. Proc. Am. Thorac. Soc. 2011, 8, 101–105. [Google Scholar] [CrossRef]
  39. Vallero, D. Fundamentals of Air Pollution, 5th ed.; Elsevier Science & Technology: San Diego, CA, USA, 2014. [Google Scholar]
  40. Jiang, X.; Xi, M.; Feng, D. Air pollution and chronic airway disease: What should people know and do? J. Thorac. Dis. 2016, 8, 31–40. [Google Scholar]
  41. Maji, A. Air pollution and lungs. Assoc. Chest Phys. 2018, 6, 1–3. [Google Scholar] [CrossRef]
  42. Anenberg, S.; Miller, J.; Minjares, R.; Li, D.; Henze, D.; Lacey, F.; Malley, C.; Emberson, L.; Franco, V.; Klimont, Z.; et al. Impacts and mitigation of excess diesel-related NOx emissions in 11 major vehicle markets. Nature 2017, 545, 467–471. [Google Scholar] [CrossRef] [PubMed]
  43. Ministry of Environmental Protection (MEP). Ambient Air Quality Standards. NO. GB 3095-2012. 2012. Available online: http://www.mee.gov.cn/ywgz/fgbz/bz/bzwb/dqhjbh/dqhjzlbz/201203/W020120410330232398521.pdf (accessed on 21 November 2020).
  44. World Health Organization (WHO). Air Quality Guidelines for Europe, 2nd ed.; WHO Regional Publications, European Series, No. 91; WHO Regional Office for Europe: Copenhagen, Denmark, 2000; pp. 324–415. [Google Scholar]
  45. Zhejiang Province Gov. Air Environment Monitoring: Daily Information of Monitoring Results. 2020. Available online: http://data.zjzwfw.gov.cn/jdop_front/detail/data.do?iid=13348&searchString= (accessed on 12 October 2020).
  46. Zhejiang Province Gov. Information of under Construction Sites. 2020. Available online: http://data.zjzwfw.gov.cn/jdop_front/detail/data_preview.do?iid=13868 (accessed on 12 October 2020).
  47. Khair, U.; Fahmi, H.; Al-Hakim, S.; Rahim, R. Forecasting Error Calculation with Mean Absolute Deviation and Mean Absolute Percentage Error. J. Phys. Conf. Ser. 2017, 930, 012002. [Google Scholar] [CrossRef]
  48. Meyers, L.S.; Gamst, G.C.; Guarino, A.J. Performing Data Analysis Using IBM SPSS; John Wiley & Sons: Hoboken, NJ, USA, 2013. [Google Scholar]
  49. Sweet, S.A.; Grace-Martin, K. Data Analysis with SPSS; Allyn & Bacon: Boston, MA, USA, 1999; Volume 1. [Google Scholar]
  50. Bates, D.; Watts, D.G. Nonlinear Regression Analysis and Its Applications; Wiley: Hoboken, NJ, USA, 1988; p. 102. [Google Scholar]
  51. Liu, X.P.; Li, X.; Shi, X.; Wu, S.K.; Liu, T. Simulating complex urban development using kernel-based non-linear cellular automata. Ecol. Model. 2008, 211, 169–181. [Google Scholar] [CrossRef]
  52. Postma, G.J.; Krooshof, P.W.T.; Buydens, L.M.C. Opening the kernel of kernel partial least squares and support vector machines. Anal. Chim. Acta 2011, 705, 123–134. [Google Scholar] [CrossRef]
  53. Kitani, K.M.; Ziebart, B.M.; Bagnell, J.A.; Hebert, M. Activity forecasting. In Lecture Notes in Computer Science (Including Subseries Lecture Notes in Artificial Intelligence and Lecture Notes in Bioinformatics); Springer: Cham, Switzerland, 2012; Volume 7575, pp. 201–214. [Google Scholar]
  54. Moon, Y.; Shabri, A. Time series forecasting using least support vector machine for Canadian lynx data. J. Teknol. 2014, 38, 1251–1258. [Google Scholar]
  55. Hangzhou Government. Basic Information of the First National Geography Survey. 2018. Available online: https://baike.baidu.com/reference/161006/2e15V8lQ3ktwO-vJS9o_tNMSva6c-RlfQvZefM3TRduJ15GfiH6C_-P7rGea4jhtZ2qOitTQtd8WQrTo_INBSC8Shrz9o1kFvGyqxgNVlOu_gzCTb8cPybHNfiXzrQ (accessed on 22 April 2021).
  56. National Development and Reform Commission (NDRC). Suggestions on Coping Well with the 2020 Spring Festival Travel Rush. 2019. Available online: https://www.ndrc.gov.cn/xxgk/zcfb/tz/201912/t20191218_1213696.html (accessed on 8 May 2021).
  57. Chen, H.; Wu, D.; Yu, J. Comparison of characteristics of aerosol during rainy weather and cold air-dust weather in Guangzhou in late March 2012. Theor. Appl. Climatol. 2016, 124, 451–459. [Google Scholar] [CrossRef]
  58. Bhargav, D.; Lauri, K. Collaborative knowledge management—A construction case study. Autom. Constr. 2009, 18, 894–902. [Google Scholar]
  59. Gonzalo, F.S.; Fernando, R.L. A methodology to identify sustainability indicators in construction project management—Application to infrastructure projects in Spain. Ecol. Indic. 2010, 10, 1193–1201. [Google Scholar]
Figure 1. Summary of research framework.
Sustainability 14 07075 g001
Figure 2. The location of 16 climate monitoring sites in Hangzhou, China. (note: West Lake District is Xihu District).
Sustainability 14 07075 g002
Figure 3. The location of the construction sites in the selected districts in Hangzhou, China.
Sustainability 14 07075 g003
Table 1. Information about air quality monitoring sites at the district level.
DistrictNumber of Monitoring Sites and Stations
1. Shangcheng1
2. Xiacheng1
3. Xihu5
4. Jianggan2
5. Gongshu2
6. Binjiang2
7. Yuhang2
8. Xiaoshan1
Table 2. The scale of construction projects in each district.
DistrictShangchengXiachengXihuJiangganGongshuBinjiangYuhangXiaoshan
Construction number, N14–1517–1838–4350–6076–8142–47142–160228–253
Area (km2) *26.0629.33309.4120069.2572.221228.411417.82
Density of construction sites0.537–0.5760.580–0.6140.123–0.1390.25–0.31.10–1.170.582–0.6510.116–0.1300.161–0.178
* The areas of each district were provided by the Hangzhou government [47].
Table 3. District tiers (Districts highlighted in yellow are selected samples).
High-Level DistrictsYuhang District, Xiaoshan District
Mid-level districtsXihu district, Jianggandistrict, Gongshu district, Binjiang district
Low-level districtsShangcheng district, Xiacheng district
Table 4. Pearson correlation coefficient (PCC).
Pearson Correlation Coefficient (PCC) 0.7 P C C < 1 0.4 P C C < 0.7 P C C < 0.4
Extent of linear correlationVery strongStrongGeneral
Table 5. Value of significance (P).
Value of Significance (P) P 0.01 0.01 < P 0.05 0.05 < P
Certainty99%95%No significance certainty
Significant certainty
Table 6. Air parameters in the non-linear regression by kernel transformation.
Second Order TermO32, PM102, CO2, NO22, PM2.52, SO22, AQI2
O3xPM10, O3xCO, O3xNO2, O3xPM2.5, O3xSO2, O3xAQI, PM10xCO, PM10xNO2,
PM10xPM2.5, PM10xSO2, PM10xAQI, COxNO2, COxPM2.5, COxSO2, COxAQI, NO2xPM2.5, NO2xSO2, NO2xAQI, PM2.5xSO2, PM2.5xAQI, SO2xAQI.
First Order TermO2, PM10, CO, NO2, PM2.5, SO2, AQI
Table 7. Model validation.
PeriodDistrict Real   Construction   Site   Number   ( N x ) Predicted Construction Site Number
( N p )
Validation ErrorTraining Error
MAPEMADMAPEMAD
In the lockdown periodXiacheng district1715.89021.716%3.6928.727%1.473
1717.389
1720.880
1723.730
1723.349
Gongshu district8178.6462.051%1.6610.583%0.472
8178.318
8181.456
8180.599
8183.412
Xiaoshan district247258.0564.429%10.9283.292%8.222
247259.811
247256.686
246259.761
247254.495
After the lockdownXiacheng district1713.70619.708%3.35018.244%3.254
1714.734
1710.714
1713.721
1716.564
1714.146
1711.962
Gongshu district7781.8256.789%5.1883.254%2.544
7781.482
7782.809
7781.638
7680.405
7680.116
7683.041
Xiaoshan district229221.8452.491%5.6991.993%4.738
229221.252
229225.082
229236.101
229226.919
229224.449
228220.660
Table 8. The guideline number of construction sites (original version).
Time PeriodIn the Lockdown PeriodAfter the Lockdown Period
District TiersXiacheng DistrictGongshu DistrictXiaoshan DistrictXiacheng DistrictGongshu DistrictXiaoshan District
Recommended number of construction sites (level-1)−171.15505.241107.12−19.3264.34−78.10
Recommended number of construction sites (level-2)−1903.02−8961.853120.36−407.58−340.95−4670.33
Table 9. Reset of guideline parameters as input values.
O3PM10CONO2PM2.5SO2AQI
100   μ g/m3501 mg/m340 μg/m335 10   μ g/m350
Table 10. Recommended number of construction sites.
Time PeriodDistrictPredicted Number of Construction Sites (Np)MAPERange of NP
In the lockdown periodXiacheng district13.31621.716%10–16
Gongshu district115.8182.051%113–118
Xiaoshan district298.0624.429%285–311
After the lockdownXiacheng district16.09419.708%13–19
Gongshu district82.3646.789%77–88
Xiaodhan district228.7682.491%223–234
Table 11. The recommended number of construction sites in other districts.
TiersDistrictRecommended Number of Constriction Sites (Lockdown)Recommended Number of Constriction Sites
(After Lockdown)
Low-level districtsShangcheng district15.8915.24
Mid-level districtsXihu district77.6178.36
Jianggan district70.7878.62
Binjiang district77.9979.27
High-level districtsYuhang district262.92221.76
Publisher’s Note: MDPI stays neutral with regard to jurisdictional claims in published maps and institutional affiliations.

