1. Introduction
In terms of environmental conservation, biogas is a renewable source of energy and is more sustainable than traditional fossil fuels because it lowers the amount of greenhouse gas emissions that enter into the atmosphere. The biogas yield resulting from anaerobic digestion depends on a biomass matrix that consists of methane (CH
4, 40–75%) and carbon dioxide (CO
2, 15–60%). It also includes other materials, such as hydrogen sulphide, water vapour, and ammonia [
1]. Biogas has been utilised in many applications, including in the municipal and industrial sectors. However, non-combustible gases, and CO
2 in particular, limit biogas applications due to having a lower burning efficiency and a high risk of equipment corrosion. Therefore, the removal of CO
2 from raw biogas is a crucial process for biomethane production.
Different upgrading technologies have been implemented to achieve higher purity biogas, such as adsorption [
2], absorption [
3], membrane separation, [
4] biological capture [
5], and catalytic conversion [
6]. Notably, chemical absorption using an amine-based solvent is considered to be the state-of-the-art method for the elimination of CO
2 components from gas streams due to its excellent removal efficiency, high CH
4 purity, and low CH
4 losses [
7,
8]. In liquid–gas absorption, packed columns are a remarkable type of mass transfer equipment that is applied in the industrial process due to their higher liquid–gas interfacial area and throughput, lower pressure drop and capital cost [
9,
10]. However, it is worth mentioning that the biggest challenge in chemical absorption technology is the selection of a solvent with optimal removal efficiency and operational costs [
11].
Commercially available amine-based solvents include monoethanolamine (MEA) [
12], diethanolamine (DEA) [
13], 2-amino-2-methyl-1-propanol (AMP) [
14], 2-amino-aminoethyl ethanolamine (AEEA) [
15], methyl diethanolamine (MDEA) [
16], and diisopropylamine (DIPA) [
17]. The absorption performance of each solvent varies according to its chemical molecular characteristics [
18,
19]. Yet, the published literature reports that single amines cannot fully satisfy essential characteristics, such as a high reaction rate and CO
2 loading capacity, with low regeneration energy, degradation, and corrosivity [
11,
20]. For instance, a well-established solvent, MEA, has been extensively implemented in commercial plants due to its high reaction performance with CO
2, low cost, and wide availability. The biggest challenges facing MEA during the removal process are the CO
2 loading capacity (0.5 mol CO
2/1 mol MEA) [
12], the intense energy required for the regeneration process, and the high corrosion rate [
21]. These drawbacks of MEA lead to increases in operational costs.
Recently, AMP, a sterically hindered amine, has gained the attention of researchers. It offers a higher CO
2 loading capacity (1 mol CO
2/1 mol AMP), with lesser regeneration energy, solvent degradation, and corrosivity. The only drawback of AMP is its low reaction rate [
22]. Given this concern, many studies combine more than one amine solvent to form a blended amine solution. Several of these studies report that the main idea of a blended amine solutions, such as DEEA + MEA [
23], AMP + MEA [
24], AMP + DA2MP [
25], DEEA + MAPA [
26], and DMEA + MEA [
27], is to take the advantages of each amine to achieve a higher CO
2 removal.
Moreover, remarkable absorption performance was reported using activators such as piperazine (PZ). When added to a single amine solution, PZ acts as a rate accelerator to improve the limitations of a single amine solvent in terms of its reaction rate [
28,
29,
30,
31,
32]. Presently, the published literature has reported on the performance of a blended PZ + AMP solution concerning aspects of CO
2 absorption tested in the range of 1.5 to 15 kPa, such as CO
2 solubility [
33,
34], kinetic reaction [
35,
36], simulation analysis [
37], and mass transfer performance [
38], as well as on the absorption and regeneration characteristics [
39] of the blended solution. For example, Khan et al. [
39] investigated CO
2 removal in a range of 10 to 15 kPa from the exhaust gas from a boiler stack into a blended PZ + AMP solution. It was proven that a significant enhancement in CO
2 absorption performance occurred, with a maximum CO
2 removal of 99.63% being achieved.
Although studies have proven the excellent ability of blended PZ + AMP solutions in capturing CO2, they have to date only been able to remove lower CO2 concentrations from the feed gas, mainly flue gas, in the range of 1.5–20 kPa. To apply the blended solutions for biogas applications, CO2 absorption must be operated at a CO2 partial pressure that is higher than 20 kPa due to the presence of high CO2 concentrations in the feed gas. Yet, using a blended PZ + AMP solution to remove concentrated CO2 in feed gas, with a partial pressure of 20 kPa or higher, has not been explored in a packed column.
The current study examines the ability of a blended PZ + AMP solution to remove CO2 from the simulated biogas in a packed column with a total pressure of 200 kPa. Since the CO2 concentration in biogas falls within 15–60%, the present study is conducted with CO2 partial pressures ranging from 20 to 110 kPa. The results are compared to MEA as an industrial benchmark solvent to assess the prospects of using a blended PZ + AMP solution as an alternative solvent to upgrade biogas applications. The CO2 absorption performances are reported with the removal efficiency of CO2 along with the average of the volumetric overall mass transfer coefficient in the gas phase, . The current study also describes the effect of the process parameters, at various CO2 partial pressures, gas flow rates, liquid flow rates, chemical concentrations, and inlet liquid temperatures, on the CO2 absorption.
Reaction Mechanisms of CO2 Absorption into a PZ + AMP Blended Solution
During CO
2 absorption into an amine absorbent in the presence of water, hydrogen bonds form during the CO
2-amine-water reaction. The formation of weak hydrogen bonds leads to a reversible reaction mechanism. Therefore, the reversible reaction in which CO
2 is absorbed into the blended PZ + AMP solution in the presence of water is governed as follows [
40]:
Base-catalysed hydration reaction:
Monocarbamate formation by PZ/AMP:
Dicarbamate formation reaction:
Dicarbamate formation reaction by PZCOO
−/AMP:
Bicarbonate formation reaction:
Protonation of monocarbamate:
Dissociation of the water molecule:
Considering the reaction between CO
2 and AMP during the absorption process, AMP-catalysed CO
2 hydration was also considered [
41,
42]. The CO
2-AMP-H
2O reaction did not lead to carbamate formation because AMP showed a low stability constant [
43]. Thus, bicarbonate formation was considered, as represented by Equation (1). Additionally, the subsequent reactions between CO
2 and PZ (including the CO
2-PZCOO
− reaction) with AMP are represented by Equations (2)–(5). The CO
2-PZ reaction involved a two-step reaction: zwitterion formation followed by zwitterion deprotonation by PZ, AMP, and PZCOO
−, which produced PZ-carbamate, PZ-dicarbamate, and a protonated base [
44]. The concentration of each base defined its contribution to the reduced concentrations of H
2O and OH
− during zwitterion deprotonation. For instance, if the AMP concentration is significantly higher than the PZ concentration, AMP appears to catalyse the reaction between CO
2 and PZ to form carbamate, leading to AMP deprotonation. Based on Equation (6), CO
2 hydration was considered, but the reaction was extremely slow and was usually neglected [
45]. As represented by Equations (6)–(11), the instant and reversible proton transfer reaction was considered in the column according to mass transfer and the process being at equilibrium [
8].
Based on the reaction mechanism, AMP-carbamate is not stable and would form bicarbonate upon being hydrolysed and subsequently release free amines for an extra reaction [
46]. Thus, the reaction between CO
2 and free AMP molecules would increase the overall CO
2 loading capacity up 1 mol of CO
2 per 1 mol of AMP. Besides, the stoichiometry of the PZ-CO
2 reaction allows the loading of 2 mol of CO
2 per 1 mol of PZ [
47]. Thus, in terms of reaction rate and CO
2 loading capacity, the addition of PZ is a good alternative to enhance the low reaction rate of AMP. Theoretically, a blended PZ + AMP solution has a potential to replace the industrial amine, MEA which react with CO
2 to form stable carbamates and the CO
2 loading is limited to 0.5 mol of CO
2 reacting with 1 mol of MEA. Hence, this study aims to examine the CO
2 removal performance using a blended PZ + AMP solution in a packed column at CO
2 partial pressures ranging from 20 to 110 kPa.
3. Results and Discussion
3.1. Comparing MEA and PZ + AMP in Terms of CO2 Absorption
The efficiency of CO2 absorption into blended PZ + AMP solutions is discussed in these subsections. The removal performance of the blended solution was compared to that of MEA, a commercial primary amine, and AMP, a sterically hindered amine that offered attractive characteristics for enhancing the absorption process.
The performance of the blended PZ + AMP solution during CO
2 absorption was analysed according to the different PZ concentrations (0, 3, 5, 7, and 9 wt.%) that were added to an AMP solution being maintained at a total amine concentration of 30 wt.%. This performance was benchmarked with a 30 wt.% MEA solution.
Figure 1 illustrates the CO
2 removal efficiency (%) profiles along the column using different amine absorbent compositions.
The removal behaviour of the absorbents can be further elaborated based on the trendlines observed in the CO
2 removal profiles from along the column. Referring to the trendline of AMP, as shown in
Figure 1, a steady increase in CO
2 removal can be observed from 0 to 2.04 m of the column height, and this absorbent exited the column without reaching a plateau. The CO
2 absorption achieved by 30 wt.% AMP contributed to the lowest CO
2 removal among all of the absorbents, achieving a 52% removal. As expected, the CO
2 absorption performance of MEA surpassed the performance of AMP. The MEA solution was 24% better at absorbing CO
2 than the AMP solution. The results show that AMP absorbed CO
2 at a slower absorption rate, while MEA was faster. The different performance observed was due to the reaction constant of AMP being 810.4 m
3/kmol·s compared to the higher reaction constant of MEA at 4090 m
3/kmol·s [
49]. Koronaki et al. [
50] conducted an experimental study to compare the absorption performance between MEA and AMP. The same conclusion was reported in their studies, with MEA capturing 97% of CO
2 from the gas stream, which was 42% higher than the amount absorbed by AMP.
In this study, at a CO
2 partial pressure of 80 kPa, an increased CO
2 removal was observed when the PZ concentration was gradually increased in the AMP solution in 2 wt.% increment, with 3, 5, 7, and 9 wt.% additions of PZ. This observation is in line with the observations made by Khan et al. [
39], which conducted their study at a low CO
2 partial pressure (10–15 kPa). The experimental result similarly showed an increased CO
2 removal performance at higher PZ concentrations in an AMP solution. This behaviour can be explained by the presence of two nitrogen atoms in the molecular structure of PZ, and these nitrogen atoms are beneficial for direct reactions with CO
2 molecules [
29]. The enhanced removal performance could also be due to the increasing formation of stable PZ-dicarbamate molecules, leading to a higher percentage of CO
2 being absorbed [
51].
Based on
Figure 1, the most reactive section of the column for the different blended PZ + AMP solutions was at the top of the column (1.7 to 2.04 m from the bottom). For instance, a solution with a 9 wt.% of PZ + 21 wt.% of AMP was able to remove 45% of the CO
2 in this section. The highest CO
2-amine reaction was achieved in this section due to the interaction between CO
2 and the liquid, which has a CO
2 loading capacity of zero, since CO
2 was introduced at the top of the column. As the liquid travelled downwards, the CO
2 loading in the liquid phase gradually increased, limiting the CO
2-amine reactions. It was also observed that, from 0 to 1.7 m of the column height, the blended solution with 9 wt.% PZ + 21 wt.% AMP was only able to remove 42% of the CO
2 in the process.
The process performances for the mass transfer coefficients are presented in
Figure 2. As shown in
Figure 1 (previously), the benchmarking absorbent, MEA, has the ability to remove 76% of CO
2 under these operation conditions. As expected, the performance of AMP was lower than that MEA, with only 52% CO
2 removal and a
0.041 kmol/m
3∙h∙kPa. This phenomenon is reasonable because of AMP’s reaction rate is lower than that of the primary amine, MEA. Therefore, PZ was added to the AMP solution at different ratios to enhance its performance as a potential blended solution. The added PZ acted as a reaction rate accelerator during the process. The increased absorption performance at higher PZ concentrations was due to the increased formation of PZ-carbamate and PZ-dicarbamate, which consequently enhanced the reaction rate [
51]. The experimental results show that the CO
2 removal performance gradually increased from 55% to 88% when the PZ concentration in the solution increased from 3 to 9 wt.%. The
values also showed a steady improvement of approximately 2.46 times, increasing from 0.046 to 0.113 kmol/m
3∙h∙kPa.
Both figures show that the blend containing a 9 wt.% of PZ + 21 wt.% of AMP solution contributed to the best CO
2 absorption performance. However, due to PZ’s low solubility, crystallisation might occur at high PZ concentrations [
52,
53]. Thus, the PZ concentration was suggested to be limited by up to 10 wt.% to avoid clogging the process equipment [
54]. Based on the process performance, the most promising PZ + AMP blend for use as a potential industrial absorbent contained a 7 wt.% of PZ + 23 wt.% of AMP. This is because this blend showed similar performance to 30 wt.% MEA, with a 76% CO
2 removal and a
0.078 kmol/m
3∙h∙kPa achieved under these operating conditions. Although the performance observed was similar in MEA and the blended PZ + AMP solution, MEA requires high energy for regeneration and are more corrosive compared to other groups of amines. Therefore, the blend of PZ + AMP is preferable and the weight percent ratio of PZ to AMP was maintained at 7 wt.% of PZ + 23 wt.% of AMP during the process parameter study.
3.2. Effect of CO2 Partial Pressure
CO
2 partial pressure is related to the feed gas composition and total gas pressure in the column. Since biogas consists of a higher CO
2 concentration, a CO
2 concentration range from 10% to 55% was used as the base concentration in this study, which was conducted at 200 kPa of the total operating pressure in the column. CO
2 absorption experiments were conducted using the best performed blended solution, i.e., 7 wt.% PZ + 23 wt.% AMP. The solution was continuously pumped to the top of the column at 3.97 m
3/m
2∙h. The total gas flow rate was supplied at 26.52 kmol/m
2∙h.
Table 2 shows the variations in the CO
2 partial pressure and
ratio for these runs. The ratio of
is the main driving force in this chemical absorption process. It indicates the availability of CO
2 and amines molecules for the reaction at the initial condition of the experiment. As the CO
2 partial pressure in the gas stream increased (refer to
Table 2), the
ratio decreased.
Figure 3 depicts the CO
2 removal efficiency profiles along the column. At the column height of 2.04 m, the CO
2 removal performance decreased from 100% to 58% when the CO
2 partial pressure increased from 20 to 110 kPa.
For a CO2 partial pressure at 20 and 50 kPa, the CO2 was effectively absorbed from the gas stream, achieving a 100% CO2 removal at a column height of 2.04 m. This result indicates that an value higher than 2.13 was sufficient for complete CO2 removal. It was observed that, at 20 kPa, this system was able to achieve the fastest complete removal at the column height of 1.36 m. This behaviour was mainly due to the high value of 5.32, which resulted in higher CO2-amine reactions in the column. The removal performance at 20 kPa indicated that the reaction was able to take place when there was an excess supply of free amine molecules during operation. Consequently, all of the CO2 molecules in the gas phase were completely absorbed into the liquid phase. Then, the removal performance reached a plateau beyond 1.36 m of the column height.
Based on the trendline observed at the CO2 partial pressure of 50 kPa, the CO2 removal was almost linear along the column compared to at 20 kPa. This behaviour was expected due to the lower value supplied to the system at 50 kPa (2.13), which was less than half of the value at 20 kPa (5.32). It was observed that the CO2 molecules were constantly removed along the column and reached complete removal at the column height of 2.04 m without any excess active amine being discharged during the regeneration process.
On the other hand, by increasing the CO2 partial pressure from 50 kPa to 80 kPa and 110 kPa, the values decreased to 1.33 and 0.97, respectively. Without a sufficient ratio, the system was unable to completely remove CO2. This was observed even in the most reactive area for CO2-amine reactions, which was within the top section of the column (1.36 to 2.04 m). Within this section, this system was only able to remove 49% and 44% of CO2 at 80 and 110 kPa, respectively. In this section, CO2 was aggressively absorbed due to the presence of fresh amines with zero CO2 loading when it first came into contact with the gas in the top section of the column. As liquid travels downward, CO2 loading would gradually increase in the liquid phase, resulting in a reduction in amine molecules available for CO2-amine reactions when the column height ranges from 0 to 1.36 m. Therefore, incomplete CO2 removal can be observed due to there being insufficient amines for the reaction to take place.
Figure 4 shows the CO
2 removal efficiency and mass transfer performance at different CO
2 partial pressures upon entry to the packed column. As discussed in the earlier part of this section, 100% CO
2 removal was observed at the CO
2 partial pressures of 20 and 50 kPa due to the low concentration of CO
2 molecules reacting with a sufficient amount of amine molecules in the liquid phase. By further increasing the CO
2 partial pressure to 110 kPa, the CO
2 removal efficiency was reduced to 58%.
In terms of mass transfer performance, a significant decrease in from 0.630 to 0.039 kmol/m3∙h∙kPa was observed when the CO2 partial pressure was increased from 20 to 110 kPa. The increased CO2 partial pressure led to a reduction in the mass transfer performance of approximately 94%. Generally, the reaction between CO2 and the amines would occur instantaneously at the gas–liquid interface, which would lead to a steeper CO2 gradient while enhancing the mass transfer process in the liquid. These reactions can reduce the equilibrium partial pressure of CO2 () throughout the solution, which can greatly increase the driving force for mass transfer. This reaction is strongly influenced by the amine (reactant) concentration, in which the availability of amine molecules in a continuous process is represented by the amine’s molar flow rate () as it is being pumped into the column.
As listed in
Table 2, the
is reduced as the CO
2 partial pressure increases. As expected, the mass transfer performance (
) was also reduced in this condition due to the decreasing driving force for mass transfer in the packed column. Furthermore, when the CO
2 partial pressure is higher, more CO
2 molecules can react with the limited number of amine molecules in the liquid film, which could reduce the enhancement factor (
E) in the process [
55].
E is one of the factors contributing to the resistance in the liquid film
. Consequently, this condition would increase the resistance of the liquid film, reducing the mass transfer performance when the CO
2 partial pressure is higher.
3.3. Effect of Gas Flow Rate
The effect of the gas flow rate on the removal performance was observed in the range from 22.10 to 35.36 kmol/m
2∙h. The blended solution screened from
Section 3.1 that performed the best, i.e., 7 wt.% PZ + 23 wt.% AMP, flowed into the column at a liquid flow rate of 4.69 m
3/m
2∙h.
Table 3 shows the variations in the gas flow rate and in the
ratio for these experiments. The
values decreased as the gas flow rate increased.
Figure 5 shows the CO
2 removal profiles along the absorption column over gas flow rates ranging between 22.10 and 35.36 kmol/m
2·h. At 2.04 m of the column height, the experimental findings indicated that the increased gas flow rate caused the CO
2 removal percentage to decrease from 100% to 72%.
The trendline for the gas flow rate at 22.10 kmol/m2∙h shows that complete CO2 removal can be achieved in the middle section of the column. A significant reduction in the CO2 concentration from 40% to 0% was achieved at column heights ranging from 0 to 1.36 m. These results indicate that a shorter column height is adequate for full CO2 removal from the gas stream when the system is conducted with the value of 1.88. This behaviour shows that the absorption process operates with excessive free amine molecules in the system, which could increase operational costs due to the expensive cost of absorbents and energy for regeneration.
Moreover, increasing the gas flow rate from 22.10 to 26.52 kmol/m2∙h reduced CO2 removal to 97%. The removal trend was almost linear along the column, with the most reactive region being observed in the middle section of the column, within a height range from 0.68 to 1.36 m. Within this section, approximately 48% of the CO2 was successfully removed during the process. Using the designated column, this behaviour indicates that setting the value at 1.57 is sufficient for sale gas specifications (less than 3% of CO2 exists in the clean gas).
Additionally, further increasing the gas flow rates to 30.94 and 35.36 kmol/m
2∙h contributed to lower
values at 1.35 and 1.18, respectively. Both of these gas flow rates showed a similar increasing trendline for the CO
2 removal performance along the column. Although these process parameters were able to remove CO
2 at 89% and 72%, respectively, the CO
2 molecules were not fully absorbed at the outlet of the column. This phenomenon was expected due to a higher number of CO
2 molecules entering the column as the gas flow rate increased, whereby the reaction was limited due to insufficient free amine molecules. This observation is in line with the expectation that the
ratio decreases at higher gas flow rates, which would adversely reduce the absorption efficiency [
56].
At the gas flow rates of 30.94 and 35.36 kmol/m2∙h, the figure shows that the most reactive section is located at the top section of the column (1.36 to 2.04 m). This was where active amine molecules flowing down from the top of the column were able to remove 54% and 48% of the CO2 molecules, from the gas phase, respectively. The ability to remove CO2 molecules was slightly decreased (23% and 17%, respectively) in the middle section of the column (at 0.68 to 1.36 m), indicating that the number of free active amine molecules decreased as the liquid travelled down the column. The CO2 loading capacity of the absorbents was further increased and almost saturated at column heights ranging from 0 to 0.68 m, with less than 12% CO2 removal within this region.
As presented in
Figure 6, a decrease in the CO
2 removal efficiency from 100% to 72% can be observed when the gas flow rate increased from 22.10 to 35.36 kmol/m
2∙h. A reduction in the
values from 0.317 to 0.092 kmol/m
3∙h∙kPa was also observed during the process. The significant 71% reduction in the mass transfer performance was expected due to the higher concentration of CO
2 entering the column, and this reaction was restricted by an insufficient amount of amine molecules [
57]. This expectation is confirmed by the values of
presented in
Table 3, which show that the initial
value of 1.88 decreased to 1.18.
Thus, it was concluded that the driving force for mass transfer with the chemical reaction in the absorption column was strongly influenced by . The high mass transfer coefficient () observed when the value was 1.88 indicated a greater gas–liquid contact surface area that can maximise the mass transfer with the chemical reaction taking place during CO2 absorption. The results also show that the absorption was faster when the driving force for mass transfer (y − y*) was increased when the was higher. Such information is useful when designing a packed column and consequently for reducing the operational costs.
It should also be noted that the gas residence time in the column began to decrease at higher gas flow rates, leading to the respective decrease in the effective interfacial areas for CO
2-amine reactions [
7,
23]. Hence, increasing the gas flow rate would result in less contact time between the CO
2 and amine molecules for the reaction to occur [
31,
58]. This condition would consequently affect the process performance in terms of the removal efficiency and mass transfer in the packed column.
3.4. Influence of Liquid Flow Rate
In CO
2 absorption, the basic principle is that CO
2 molecules are transferred from the gas phase into the liquid phase. Since the CO
2-amine reaction occurs when gas comes into contact with liquid, in this study, the influence of the liquid flow rate on the process performance was investigated and was determined to range from 3.25 to 5.42 m
3/m
2∙h. The experiments were conducted using a CO
2 concentration of 40% in the feed gas, which entered the column at a gas flow rate of 26.52 kmol/m
2∙h.
Table 4 shows the variations in the liquid flow rate and
ratio applied in the experimental work. The table shows that the
ratio increases as the liquid flow rate increases.
As depicted in
Figure 7, increasing the liquid flow rate improved the CO
2 removal performance from 70% to 100% at the column height of 2.04 m. Based on the trendline at 3.25 and 3.97 m
3/m
2∙h liquid flow rates, CO
2 removal was gradually increased starting at the section of the column that was 0 to 2.04 m in height. However, both liquid flow rates showed insufficient CO
2 removal, achieving rates of 70% and 83%, respectively. The most reactive section was also observed to be at the top of the column (1.36 to 2.04 m), achieving CO
2 removal at 47% and 49% within this region, respectively. Such behaviour can be explained by the counter-current motion involved in the interaction between the fresh amine molecules in the liquid and the lower CO
2 concentration in the gas phase in the top section of the column. The transfer of the CO
2 molecules from the gas phase to the liquid phase increased the CO
2 loading capacity in the solution.
As the liquid travelled downwards to the middle section of the column (0.68 to 1.36 m), it continued to absorb more CO
2, increasing the CO
2 loading capacity [
7]. Approximately 18% to 25% of the CO
2 was removed within this region. At the bottom of the column, the absorbent came further into contact with the feed gas, which consisted of 40% of CO
2, as it was introduced into the column. While the absorbent was moving from the top to the middle section of the column, the CO
2 loading capacity began to gradually increase. The CO
2 loading capacity of the absorbent was almost saturated within the 0 to 0.68 m region since the absorbent was only able to remove less than 10% of the CO
2 during the process.
Based on the previous observations, a liquid flow rate of 4.69 m3/m2∙h (= 1.57) was considered to be a sufficient process condition, achieving a maximum removal of 97% at the exit of the column. Referring to the trendline for the reaction at the bottom of the column (0 to 0.68 m), 28% of the CO2 removal occurred in this region. The gas came further into contact with the absorbent in the middle section of the column (0.68 to 1.36 m). This was the most reactive section in the column, with CO2 removal increasing from 28% to 75% (47% increment) as the gas counter-currently came into contact with the CO2-loaded amine from the top section. The CO2 concentration in the gas that was flowing upward was significantly decreased by approximately 10% of CO2 within the section that was 1.36 m in height. This gas then continued upwards and reacted with fresh amine, which has a low CO2 loading capacity. This resulted in the further removal of 22% of CO2 from the gas phase at the top region (1.36 to 2.04 m). It was expected that the reaction in the top region would be limited by the low CO2 concentration in the gas phase when there was an excess of amine molecules. Hence, a lower CO2 removal was observed in this section compared to in the middle section of the column.
At the liquid flow rate of 5.42 m3/m2∙h ( = 1.81), a complete CO2 removal (100%) was achieved at the column height of 1.36 m. The most reactive section was at the bottom of the column (0 to 0.68 m), where 72% CO2 removal was achieved. This process subsequently removed an additional 28% of the CO2 in the middle section of the column (0.68 to 1.36 m). Beyond the column height of 1.36 m, no reaction was detected due to the absence of a reactant (CO2) in the gas phase. It was expected that the absorbent exiting at the bottom of the column was unsaturated in terms of the CO2 loading capacity. Hence, at this liquid flow rate, complete removal was able to be achieved within 67% of the column height. Thus, a shorter column can be designed for the biogas upgrading process, which will consequently reduce the capital cost of the equipment.
Figure 8 shows that the efficiency of CO
2 removal steadily increases from 70% to reach complete removal of CO
2 when the liquid flow rate is set from 3.25 to 5.42 m
3/m
2∙h. Additionally, the
values were improved by 5.9 times, from 0.066 to 0.389 kmol/m
3∙h∙kPa, when the
ratio increased from 1.09 to 1.81. This observation is in agreement with most studies [
23,
46,
50]. The possible reason for this behaviour is the presence of active amine molecules that increased as the flow rate increased, thus enhancing the reaction between CO
2 and the amine molecules [
29].
Furthermore, spreading the liquid on the surface of the packing at a higher liquid flow rate increases the interfacial area per unit volume (
av) for the reaction between CO
2 and the amine molecules [
50,
59]. The liquid side mass transfer coefficient (
kL) was also increased at a higher liquid flow rate [
60,
61]. Both
kL and
av are proportional to the enhancement of mass transfer coefficient,
. The enhancement factor (
E) is a significant factor that can influence mass transfer when there is a chemical reaction in the absorption process. According to Fu et al. [
62], a high liquid flow rate would increase the
E value and would eventually reduce the liquid film’s resistance
. In addition, increasing the
ratio with a higher liquid flow rate would reduce the mass transfer resistance due to the boundary layer of the liquid phase becoming thinner, which consequently would accelerate the mass transfer performance [
63].
Although promising performances were observed at higher liquid flow rates in terms of the removal of CO
2 molecules from the gas phase, Liao et al. [
23] stated that a higher regeneration energy is needed to regenerate a larger volume of absorbent. Moreover, Gao et al. [
29] reported their concerns regarding a high circulation flow rate at a high liquid velocity, which may lead to large amounts of free active amine molecules that are unable to react with CO
2 molecules. This may increase the energy consumption for absorbent pumping and for the regeneration process. Thus, optimal parameters should be designed to achieve higher efficiency at reasonable operational costs for industrial operations.
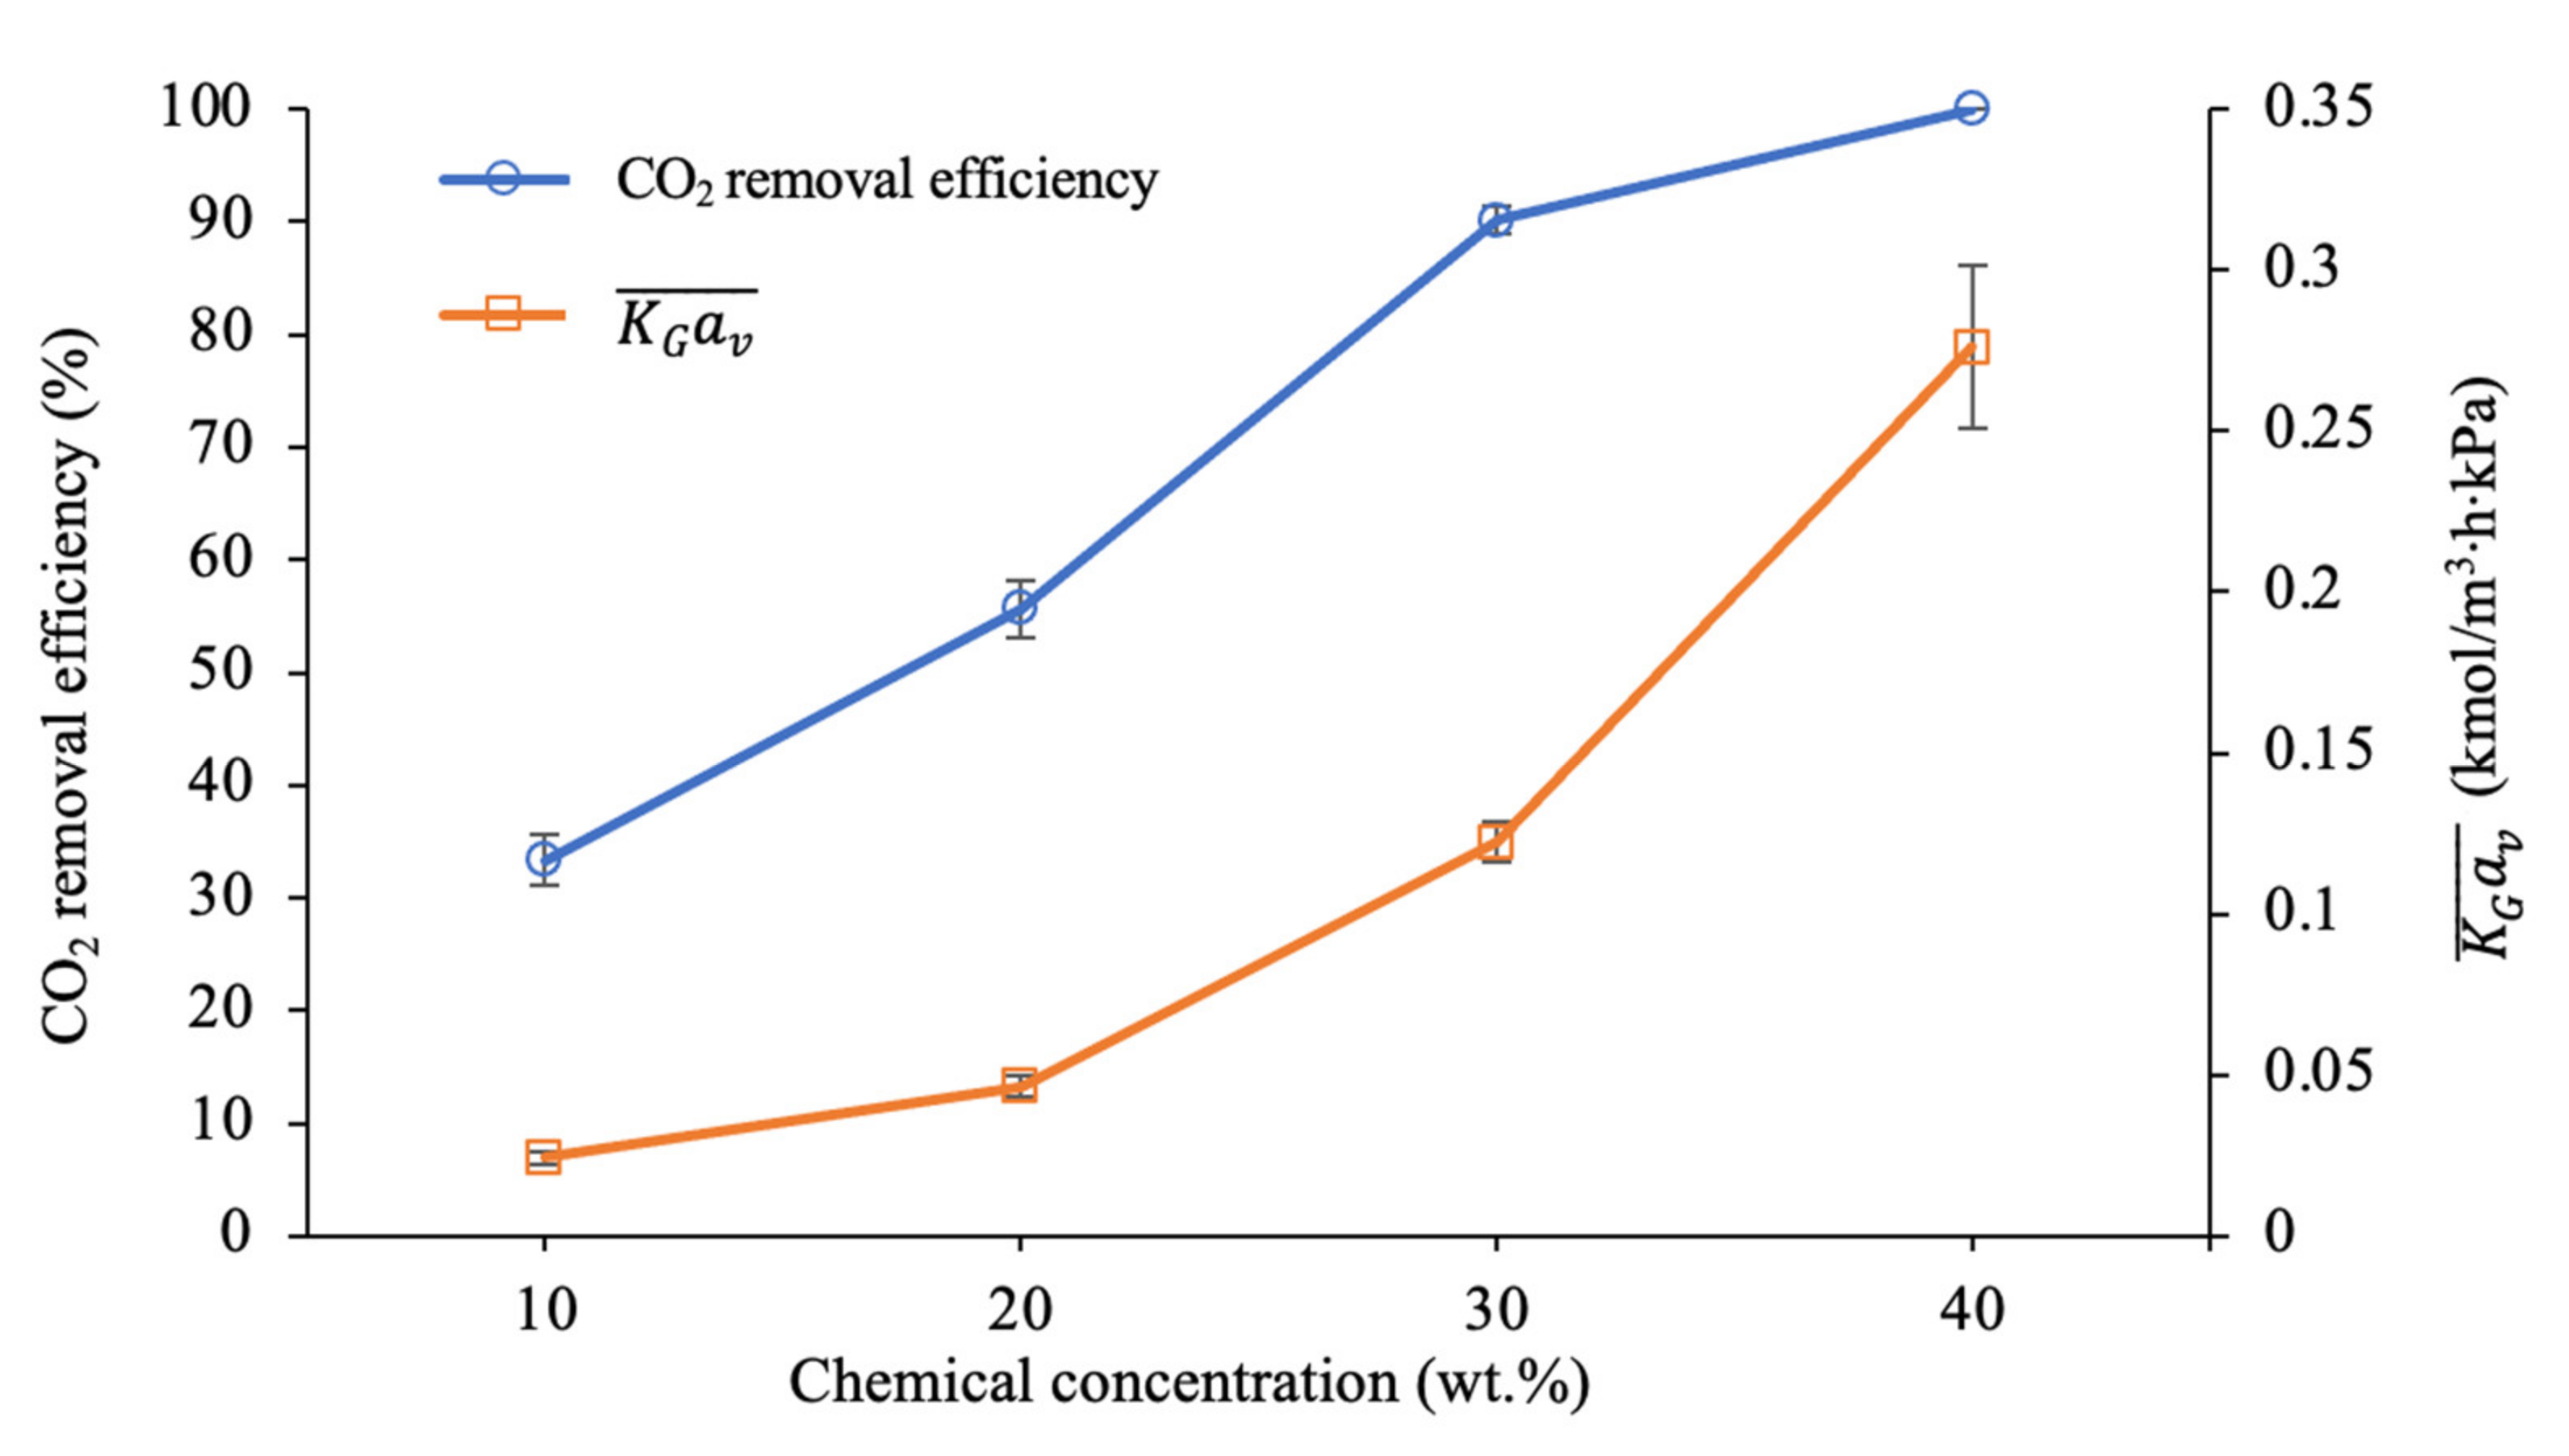
3.5. Influence of Chemical Concentration
The chemical concentration is one of the most concerning parameters that may possibly affect the removal performance. To observe the influence of the chemical concentration on the process performance, different blends of PZ + AMP were prepared by maintaining the PZ concentration at 7 wt.% and added to 3, 13, 23, and 33 wt.% concentrations of AMP. Hence, the chemical concentration was tested in the range from 10 to 40 wt.%. The gas and liquid phases were constantly supplied to the column at flow rates of 26.52 kmol/m
2∙h and 4.33 m
3/m
2∙h, respectively. The variations in the chemical concentration and
ratio that were analysed in the current experimental work are shown in
Table 5. It can be seen that the
ratio increased as the amine concentration increased.
Figure 9 shows that an increase in the chemical concentration from 10 to 40 wt.% can lead to respective increments in the CO
2 removal performance from 33% to 100% at the exit of the column. By observing the trendline for the blended solution containing 40 wt.% PZ + AMP, a significant increase was observed at the column height from 0 to 1.02 m, followed by a steady increase beyond the 1.02 m section to achieve 100% removal. A high absorption percentage was observed at the bottom section of the column (0 to 0.68 m), in which approximately 56% of the CO
2 molecules in the gas stream were absorbed by the absorbent. The remaining 18% of CO
2 in the gas phase travelled upwards in the column, where the CO
2–amine reaction began to decrease due to the decreased CO
2 concentration in the gas phase. Hence, within the middle section of the column (0.68 to 1.36 m), this system was able to remove 37% more CO
2 from the gas stream. This system achieved 100% CO
2 removal at the column height of 1.70 m. Hence, it was concluded that the blended solution containing 40 wt.% PZ + AMP (
ratio = 1.91) demonstrated excellent CO
2 removal within 83% of the column height.
At the bottom section (0 to 0.68 m) of the column, the blended solution containing 30 wt.% PZ + AMP was able to remove 15% of the CO2 followed by 24% of the CO2 in the middle section of the column (0.68 to 1.36 m). The highest removal performance occurred within the top section (1.36 to 2.04 m), where 51% of the CO2 was removed from the gas phase. Hence, the total CO2 removal performance by the blended solution containing 30 wt.% PZ + AMP was 90%. However, this condition was insufficient for meeting sale gas specifications due to the remaining 10% of CO2 in the treated gas.
On the other hand, based on the trendline for the blended solutions containing 10 wt.% and 20 wt.% PZ + AMP, CO2 absorption was enhanced at the top section of the column, as observed within the 1.36 and 2.04 m marks. Approximately 26% and 49% of the CO2 was removed within this section by the 10 wt.% and 20 wt.% blended solutions, respectively. However, no significant changes were observed in terms of CO2 removal at the column height from 0 to 1.36 m. In this section, less than 8% of the CO2 was removed from the system due to insufficient chemicals being present to react with the CO2 in the gas phase. As mentioned in the previous subsections, this behaviour might be due to the saturation in the CO2 loading capacity of the absorbent. Thus, a reduction in CO2-amine reactions can be observed in this section compared to in the top section. This observation shows that an ratio of less than 1.0 was insufficient for the CO2 removal process.
As illustrated in
Figure 10, the CO
2 absorption performance was greatly enhanced at higher chemical concentrations. The CO
2 removal efficiency substantially increased from 33% to 100%, while the
value was dramatically enhanced from 0.024 to 0.276 kmol/m
3∙h∙kPa when the chemical concentration was in the range from 10 to 40 wt.%. The
ratio was also increased from 0.50 to 1.91, leading to improvements of up to 11.5 times for the mass transfer performance. These experimental results were expected due to the increased availability of free active amine molecules at higher chemical concentrations, which helped to accelerate the reaction between the amine and CO
2 molecules [
23]. Hence, a higher
ratio resulted in a higher CO
2 removal efficiency and mass transfer performance. Based on the mass transfer, these increments were due to the increased enhancement factor,
E, in the chemical reaction, which would consequently reduce the liquid film’s resistance at higher amine concentrations [
7]. Since liquid films mainly control the CO
2 absorption process, a liquid film with low resistance can be attributed to a better mass transfer performance [
23].
Apart from the higher process performance at a higher amine concentration, the increase in viscosity as the amine concentration increases needs to be considered, as it could possibly hinder CO
2 diffusion across the gas to liquid film [
64]. It could also reduce mass transfer performance due to the reduced effective area of the absorbent on the packing surface. Furthermore, the high amine concentration could also contribute to processing equipment corrosion. Therefore, an optimal chemical concentration is vital for the potential absorbent to be applied as an industrial absorbent.
3.6. Influence of Inlet Liquid Temperature
In the CO
2 absorption process, the inlet liquid temperature is one of the critical parameters. In the current research, the absorption behaviour was observed at four different inlet liquid temperatures: 30 ± 2, 35 ± 2, 40 ± 2, and 45 ± 2 °C. The experimental work was conducted using a blended solution containing 7 wt.% PZ + 23 wt.% AMP and constant gas and liquid flow rates of 26.52 kmol/m
2∙h and 4.69 m
3/m
2∙h, respectively.
Table 6 shows the variations in inlet liquid temperature with a
ratio value of 1.57 for these studies.
Figure 11 shows the effect of different inlet liquid temperatures on CO
2 removal (%) along the column when the process was conducted at temperatures from 30 ± 2 to 45 ± 2 °C. Complete CO
2 absorption into the PZ + AMP blended solution was found when the inlet liquid temperature of the column was set to 35 ± 2 and 40 ± 2 °C. CO
2 removal at 35 ± 2 °C was faster than it was at 40 ± 2 °C, with 100% CO
2 removal being achieved in the 1.36 m section. The most reactive section for absorption at 35 ± 2 °C was the middle section (0.68 to 1.36 m), with 59% of the CO
2 being eliminated from the system. On the other hand, at the bottom section of the column (0 to 0.68 m), 41% of the CO
2 was absorbed into the absorbent.
At the inlet liquid temperature of 40 ± 2 °C, approximately 36% of the CO2 was removed from the gas phase at the bottom section of the column (0 to 0.68 m). The remaining 25.6% of CO2 in the gas that was flowing upward from this section continued to the middle section (0.68 to 1.36 m) and reacted with the absorbent that was flowing downwards. Consequently, 55% more CO2 was removed, reducing the CO2 concentration to less than 4% in the gas phase. Beyond the 1.36 m section, approximately 9% of the CO2 was further eliminated to achieve complete removal at the column height of 1.70 m. Analysing this trend, a decreased CO2 removal was able to be observed in the top section (10% of CO2) compared to in the middle section (55% of CO2) of the column. This was due to the low availability of CO2 in the top section, which limited the reaction in this section.
CO2 removal also steadily increased along the column when the inlet liquid temperature was 30 ± 2 °C. Based on the trendline at the bottom section of the column (0 to 0.68 m), the amount of CO2 was reduced by 28% in this region. It was found that the most reactive section was in the middle of the column (0.68 to 1.36 m), in which approximately 48% of the CO2 was eliminated from the gas stream as the gas continued upwards against the counter current of the CO2-loaded amine from the top section. The CO2 concentration in the gas that was flowing upward significantly decreased to approximately 10% at the 1.36 m section. This gas flow continued upwards and reacted with fresh/low CO2-loading-capacity amines. An additional 22% of CO2 was removed from the gas phase in the top region (1.36 to 2.04 m), with 97% CO2 removal being observed at the exit of the column. The reaction in the top region was expected to be limited by the low CO2 concentration in the gas phase, while the available amines were in excess. Hence, a lower CO2 removal performance was observed in this section (22% of CO2) compared to in the middle section of the column (48% of CO2).
The lowest performance was observed when the inlet liquid temperature was set at 45 ± 2 °C, in which the trendline for this temperature setting was constantly lower than at other inlet liquid temperatures. Approximately 11% of the CO2 was absorbed in the bottom section of the column (0 to 0.68 m), while a better removal performance was observed in the middle section (0.68 to 1.36 m), where approximately 37% of the CO2 was eliminated. In the top section (1.36 to 2.04 m) of the column, an additional 44% of the CO2 was absorbed, resulting in 92% CO2 removal from the process. However, this condition was insufficient for sale gas specifications.
As depicted in
Figure 12, the CO
2 removal efficiency at the liquid inlet temperature of 30 ± 2 °C was 97% with a
value of 0.18 kmol/m
3∙h∙kPa. The performance was slightly increased and reached complete removal at 35 ± 2 and 40 ± 2 °C. The increased CO
2 absorption performance at 30 ± 2 to 40 ± 2 °C may be described by the decreasing the viscosity of the solution at a higher temperature, allowing more liquid to spread on the surface of the packing. Consequently, this phenomenon resulted in the enhancement of the interfacial areas for the reaction between CO
2 and the amine molecules [
55].
Although complete CO2 absorption (100%) was achieved at both 35 ± 2 °C and 40 ± 2 °C, the mass transfer performance at 40 ± 2 °C was slightly reduced compared to at 35 ± 2 °C. A reduction of approximately 19% in the mass transfer coefficient was observed between the operation at 35 ± 2 °C and at 40 ± 2 °C. The values at 35 ± 2 °C and 40 ± 2 °C were 0.36 kmol/m3∙h∙kPa and 0.29 kmol/m3∙h∙kPa, respectively. These experimental findings reveal that the CO2-amine reactions were dominated by a forward reaction at temperatures lower than 35 ± 2 °C. Additionally, increasing the inlet liquid temperature to be over 35 ± 2 °C shifted the reaction mechanisms towards reverse reactions. Therefore, this phenomenon resulted in a significant decline in the removal performance at 45 ± 2 °C, with only 92% of the CO2 being removed from the feed gas. The value was also significantly reduced at 40 ± 2 °C and 45 ± 2 °C.
A similar trend was reported by Zeng et al. [
65], in which the forward CO
2-amine reactions were dominant at 20 °C to 35 °C. However, inlet liquid temperatures higher than 35 °C shifted the reaction to a reverse controlling mechanism. The decreased absorption performance at higher inlet liquid temperatures could also be explained by the decreased CO
2 solubility, which consequently increased the mass transfer resistance in the liquid film. Similarly, the reduction in the mass transfer performance was observed in this study, as the inlet liquid temperature was increased to beyond 35 ± 2 °C. Hence, it was proven that the inlet liquid temperature can highly affect process performance.
4. Conclusions
This research examined CO2 absorption from simulated biogas in a packed column with a blend of PZ + AMP. CO2 partial pressures ranging from 20 to 110 kPa were studied to simulate the process conditions of biogas upgrading applications. The process performance was systematically evaluated at different ratios of blended PZ + AMP solutions, in which the process parameters for the efficiency of CO2 removal as well as the values were reported. The experimental results implied that a blend of 7 wt.% PZ + 23 wt.% AMP as the most promising alternative for replacing conventional industrial solvents. This composition was proposed because its removal performance was similar to that of the conventional industrial solvent, 30 wt.% MEA, under similar testing conditions.
It was found that the ratio strongly affects the absorption performance in packed columns. In general, the availability of reactants, the CO2 composition in the gas phase, and the CO2 loading capacity of the amine molecules along the column influence the trend and magnitude of CO2 removal in each section of the packed column. At a high ratio, sufficient removal can be achieved using a shorter packed column; however, at a low ratio, there are insufficient amine molecules for the reaction, resulting in incomplete CO2 removal, and absorbent saturation could be observed in the bottom section of the column.
From this study, increasing the liquid flow rate (3.25–5.42 m3/m2∙h) and chemical concentration (10–40 wt.%) remarkably enhanced the process performance. It was also noticed that reductions in the process performance resulted from an increased gas flow (22.10–35.36 kmol/m2∙h) and CO2 partial pressure (20–110 kPa). It was concluded that the ratio in each process parameter strongly influenced the enhancement factor (E) and the resistance in the liquid film . These factors were found to significantly affect the process performance. Moreover, the inlet liquid temperature significantly affected the process performance due to reversible exothermic reactions. It was observed that the optimal inlet liquid temperature for the CO2 absorption process was 35 ± 2 °C. Overall, the blended PZ + AMP solution showed great potential to be commercialised in industrial biogas production.


 ,
, 


