Article

Evaluation of Regional Carrying Capacity under Economic-Social-Resource-Environment Complex System: A Case Study of the Yangtze River Economic Belt

1
School of Economics and Management, Beijing Jiaotong University, Beijing 100044, China
2
Chinese Academy of Natural Resources Economics, Beijing 101149, China
3
Key Laboratory of Carrying Capacity Assessment for Resource and Environment, Ministry of Natural Resources, Beijing 101149, China
4
Institute of Geographic Sciences and Natural Resources Research (IGSNRR), Chinese Academy of Sciences, 11A Datun Road, Chaoyang District, Beijing 100101, China
*
Author to whom correspondence should be addressed.
Sustainability 2022, 14(12), 7117; https://doi.org/10.3390/su14127117
Submission received: 12 April 2022 / Revised: 7 June 2022 / Accepted: 7 June 2022 / Published: 10 June 2022
(This article belongs to the Special Issue Environmental Carrying Capacity in Urban and Regional Development)

Abstract

:
As a rigid constraint of the scale and speed of regional economic-social development, carrying capacity is an endogenous variable of regional sustainable development potential. Concepts such as ecological footprint and virtual water have been introduced into the research field of carrying capacity, but dynamic and comprehensive problems in carrying capacity have not been effectively solved. This paper attempts to overcome these limitations by taking the regional factor aggregation degree as the weight and the regional green GDP as the carrying object. Based on the economic-social supplying force, resource supporting force, and environmental constraint force, from the perspective of comprehensive factors assessment, we have constructed an evaluation system of regional carrying capacity index, including mineral, water, and bioecological resources, as well as labor and other factors, and evaluated the regional carrying capacity of 11 provinces and cities along the Yangtze River Economic Belt. The results indicate that (1) the supporting force of the resource subsystem becomes the most critical factor affecting the carrying capacity of the Yangtze River Economic Belt, and the cross-regional flow potential of resource factors increases the regional carrying capacity threshold. (2) The regional carrying capacity, economic-social, resource and environmental subsystems of the Yangtze River Economic Belt are steadily improving, and the overall trend is positive. The quantified dynamic evaluation of regional economic-social, resource and environmental carrying capacity provides a theoretical support for the construction of the Yangtze River Economic Belt eco-priority green development demonstration area.

Graphical Abstract

1. Introduction

With the acceleration of China’s industrialization and urbanization, resource consumption, environmental pollution, and ecological function degradation are increasingly becoming limiting factors restricting regional sustainable development. As a consequence, the Chinese government requires that each province determine the suitability of different development, protection, and utilization modes and territorial spatial planning based on the assessment of the carrying capacity of resources and environment and the suitability of territorial space development. In January 2020, the Guidelines for assessing the Carrying Capacity of Resources and the Environment and the Suitability of Territorial Space Development (Trial) were issued.
Under the highly open man-land relationship regional system, the influence of the flow of factors among resource, environment, and economic-social systems on regional economic-social activities is gradually deepening. In the face of increasingly tight resource and environmental constraints and the needs of economic-social development, it is necessary to evaluate regional carrying capacity based on the hybrid system of economic-social, resource, and environment to realize the green and sustainable development of the region. It is also an essential foundation to realize the modernization of spatial governance capacity.
The Yangtze River Economic Belt, the focus of the analysis presented in this paper (Figure 1), is one of China’s four major regional strategies, stretching from east to west, extending from north to south, and connecting rivers and seas. Its comprehensive economic strength is the strongest in China. It is the economic axis with the most intensive population, economy, and industry in China and has an essential position for joint regional development. Currently, it is the key period of green, low-carbon, and sustainable development in China. However, the rapid development of its economy has caused serious resource and environmental problems, severe ecological environmental situations, and prominent regional development imbalances in the Yangtze River Economic Belt [1]. In 2017, The Plan for Ecological and Environmental Protection of the Yangtze River Economic Belt was formulated to implement the development strategy of “pursuing greater protection and avoiding greater opening-up”. The green and low-carbon sustainable development of the Yangtze Economic Belt requires the simultaneous development of the three factors of economic-social development, ecological environment, and resource system. Thus, it is necessary to study the regional carrying capacity of the Yangtze River Economic Belt for promoting green and low-carbon sustainable development.
Carrying capacity evaluation is related to the maximum load of regional resources, environment, economy, and society. It is generally defined as the supporting capacity in a specific region for the population and economic-social development under a certain level of development, rational exploitation and utilization of resources, adequate environmental protection, and coordinated action between man and land [2]. The academic community generally believes that carrying capacity has become an essential basis for measuring the degree of coordinated development of a man-land relationship in a country or region [3]. Before the 1950s, resource carrying capacity studied mainly discussed the supporting capacity of natural resources to the survival and development of a population (biological population) in a country or region [4]. In the 1960s and 1970s, while considering the resource factors, they began to discuss the restrictions of the environmental system on human economic and social activities, and the nature of carrying capacity changed from an absolute upper limit to a relative balance [5,6]. Since the 1990s, research on carrying capacity has shifted from classification to synthesis and integration [7]. On the one hand, the restricting effect of restrictive factors on population growth and sustainable economic-social development continued to be the main focus, and on the other hand, paying attention to the influence of resource consumption, environmental discharge, and ecological occupation caused by human activities on the stability of the man-land relationship regional system. Current academic studies on carrying capacity include single factor evaluation of resource carrying capacity [8], environmental carrying capacity [9], ecological carrying capacity [10], and economic and social carrying capacity [11], as well as comprehensive carrying capacity evaluation of resource-environmental economic system [12]. Tang et al. built a comprehensive evaluation system of carrying capacity from four aspects, namely, economy, environment, ecology, and energy [13]. Fatai et al. studied the capacity of the environment to carry economic development, taking the EU region as an example [14]. Zhou et al. proposed a single factor assessment of the carrying capacity of cultivated land, construction land, and ecological land from the perspective of a single factor assessment [15]. This reflects the deepening influence of resources, environment, economy, and society on regional carrying capacity.
It is generally believed that the classification of carrying capacity has been systematically studied. However, many scholars believe that the comprehensive research on carrying capacity is relatively weak. For example, Ren et al. found there is no consistent perspective on evaluating urban carrying capacity [16]. Zhang et al. argued that the research on resource and environmental carrying capacity lacks a comprehensive evaluation of environmental quality and human activities [17]. The evaluation is mainly focused on single and closed systems. For example, water resources-water environment system [18], mineral resources exploitation utilization system [19], and ecosystem [20] have all been the subject of carrying capacity research. The systemization and complexity of carrying capacity need to be strengthened, and the key technology and methods of comprehensive measurement need to be innovated [21]. In terms of regional carrying capacity research, it is generally considered that it is the asystematic ability of a specific society to sustain a certain number of people and their correspondent socioeconomic output, while at the same time maintaining an eucyclic ecology and reasonable resource exploitation rate [22]. Regional carrying capacity focuses more on the changes in economic, social, resource, and environment, carrying the state in a specific region, which is the deepening of carrying capacity research. [23]. Lane applied regional carrying capacity methodologies to sustainable land-use planning [24].
Many scholars have ignored the impact of dynamic changes such as technological progress, economic interaction, and factor flow on regional carrying capacity [25,26]. In particular, most regional carrying capacity evaluation studies contain the basic assumption of “business as usual” for resource production and consumption, environmental restoration, and loss [27,28,29]. Problems such as acceleration of factor flow, separation of production and consumption process, and rapid economic development change in a regional wide range are ignored, leading to a lack of dynamic evaluation of regional carrying capacity [30,31]. In introducing dynamics into regional carrying capacity evaluation, some studies have compared the carrying capacity in different regions or analyzed the change process of carrying capacity in the same region at different time points [32,33]. These studies, however, lack an analysis of the internal mechanism of carrying capacity changes, especially the relationship between various carrying systems and comprehensive systems. As a result, the study of carrying capacity evaluation is not sufficiently dynamic and complex. Based on the man-land relationship regional system theory, the concept of regional resource and environment carrying capacity is extended to regional carrying capacity in this paper. We believe that the regional system of the man-land relationship is a complex giant system composed of the economy, society, and environment. We innovatively take factor flow analysis as the breakthrough point. Based on the resource and environment carrying system, we introduce the influence of the economic-social system on regional carrying capacity to expand the analysis framework.

2. Theoretical Framework

2.1. Regional Carrying Capacity

Geography emphasizes the study of sustainable development from the perspective of the man-land relationship, while resource science emphasizes that human social development should be analyzed from the scarcity of resources. The study of resource and environmental carrying capacity has become the intersection and integration point of the two disciplines. Regional resource and environmental carrying capacity emphasize the impact of economic-social activities on regional functions, such as natural resources and ecological environment, and the one-way input of the economic-social system to the resource and environment system. System Dynamics [34] emphasizes the view of association, development, and movement among systems and that the behavior patterns and characteristics are mainly rooted in their internal dynamic structure and feedback mechanism among systems. In the continuous integration of geography and resource science, the main body of regional economic-social activities is the complex man-land relationship regional system. It is generally believed that when each system component cannot fully explain the behavior and influence, such a system is called a complex system [35]. According to the characteristics of complex systems [36], the regional man-land relationship system is a typical open complex giant system, which should contain the following two subsystems: the human social system and the geographical environment system. The regional man-land relationship system theory emphasizes that natural resources promote and control the human social system. The human social system organizes economic-social activities within the biological system to realize the output of natural resources. The man-land system includes the resource system and environmental system, but the economic-social system formed by human activities has more influence on the economic geographical pattern. The resources and ecological environment are the natural basis for creating regional surface functions. Human society is a social, economic, and natural complex ecosystem with human behavior as the leading, the natural environment as the support, resource flow as the lifeblood, and social culture as the channel [37]. From the interaction between natural ecosystems and human activities, the regional system of the man-land relationship can be regarded as a hybrid system of economy, society, resources, and environment [38].
It is generally believed that regional carrying capacity and ecological occupancy determine the potential pattern of land surface spatial order and are generally regarded as exogenous variables in economic geography research [39]. With the frequent exchange of matter and energy between the man system and the land system, the carrying capacity changes at different scales in different regions. In studying economic geographical patterns, carrying capacity should be regarded as an endogenous variable, which is endogenous to the change of factor flow and utilization efficiency under the complex system of economy, society, resources, and environment. From the integration of economic, social, resource and environmental factors, the regional resource and environmental carrying capacity is extended to study the influence mechanism of the complex giant system of economic, social, resource, and environment on human activities and analyze its influence and feedback effect on carrying capacity [40]. Regional carrying capacity can be identified as the unity of man-land interaction in a specific regional man-land relationship system, which is determined by the interaction between system subjects such as resources, environment, economy, and society and the carrying objects in a specific carrying space. Factors such as critical nodes, the chain of regional features and connected to the economic-social activities and land use, resource consumption and pollutant emissions, ecological system function change, labor input, capital input, the relationship between infrastructure construction is a complex system impact factors of person identification and factor combination and interaction mechanism of the regional capacity key variables. Therefore, regional carrying capacity is a proposition that studies the maximum suitability and security of regional economic, social, resource, and environmental conditions for specific spatial human activities under the background of coordinated and sustainable development of the man-land relationship [41]. The research object of carrying capacity should not be a simple physical space but a complex giant system integrating multiple dimensions of resources, environment, economy, and society. This complex and huge system takes the man-land system as the core and covers the following three subsystems: economic, social, ecological, and resource. Based on the regional carrying capacity of regional adhesion affected by regional function change of the space hypothesis [42], when regional function adapts to economic-social activity space organization rule changes, the use of factors of production efficiency and economic benefit will increase and improve the utilization rate of resources and the environment in the area. Regional carrying capacity increases and vice versa will produce negative effects.

2.2. Factor Flow and Regional Carrying Capacity

Factors of the economic, social, resource, and environmental complex system are flowing with each other in greater intensity and scope. They can be divided into regional and non-regional factors according to system category and to mobility, resource, environmental, and economic factors. It is generally believed that the elemental composition of the geographical environment system should include resource factors, environmental factors, and ecological factors. This paper argues that ecological factors mainly provide value services for ecological products for human beings. There are imperfect accounting methods and unclear evaluation objects. Most functions overlap with resource and environmental factors, so ecological factors are included in the resource and environmental factors according to the products provided. Resource factors mainly refer to the materials and energy that the resource subsystem provides for human activities to meet their needs for survival and development. Environmental factors are the wastes discharged to accommodate and dissolve human activities. Specific environmental factors have capacity limits, such as the atmosphere and water, which are closely related to regional-specific industrial models and economic structure. Economic factors refer to the factors that can directly affect economic-social behavior, including capital, labor, technology, knowledge, and systems. Economic geography believes that human economic activities in different areas enormously change the physical geographical pattern, causing resource changes and environmental problems at different spatial scales, thus becoming the main driving force for changing the natural environment [43].
From man-land system development, the factors of the composite system of the economy, society, resources, and environment flow and influence each other [44]. This exchange of complex materials, capital, labor, and information changes in the stock and flow of regional factors and influences non-regional factors. The flow process of factors within each subsystem and between different regions is shown in Figure 2. Under the background of high openness, the flow and exchange of non-regional factors in the resource, environmental, and economic-social subsystems between less developed region A and developed region B have occurred. Mineral and biological ecological resources between resource systems flow from A to B, resulting in a net outflow effect corresponding to as improvement in the carrying capacity of the resource subsystem in B. The two-way flow of labor, capital, and technology enhances the carrying capacity of the two economic-social subsystems.
The migration of the population, the pursuit of profit of capital, and the exchange of technology determine the flow of human social and economic activities. Most of the resource factors and part of the environmental factors also exist in trans-regional flow. The pressure transfer of resource and environmental flow across regions and factor flow between subsystems brings systematic regional carrying capacity changes. Efficient factor flow and concentration are conducive to improving the regional carrying capacity threshold, while excessive concentration leads to the decline of the regional carrying capacity threshold. The inflow, outflow, and multiplier effects caused by factor flow result in the geographical spatial aggregation of regional factors. When the inflow effect is greater than the outflow effect, the positive multiplier effect plays a role, and the regional factor concentration increases rapidly. When the inflow effect is smaller than the outflow effect, the negative multiplier effect plays a role, and the regional factor concentration decreases rapidly. When regional and non-regional factors are coordinated, factor suitability is improved. Factor aggregation produces positive externalities, and factory utilization degree is improved, thus improving relative utilization efficiency among factors. Factor flow allocates factors more reasonably, and the division of labor is clear. The unit economic output reduces the use of an absolute number of factors, achieves a larger scale of carrying capacity, and increases the threshold value of regional carrying capacity. When regional and non-regional factors were not coordinated, the suitability of regional factors decreased. Factor aggregation produces negative externalities, and the decline in factory utilization rate leads to a decrease in the regional carrying capacity threshold.

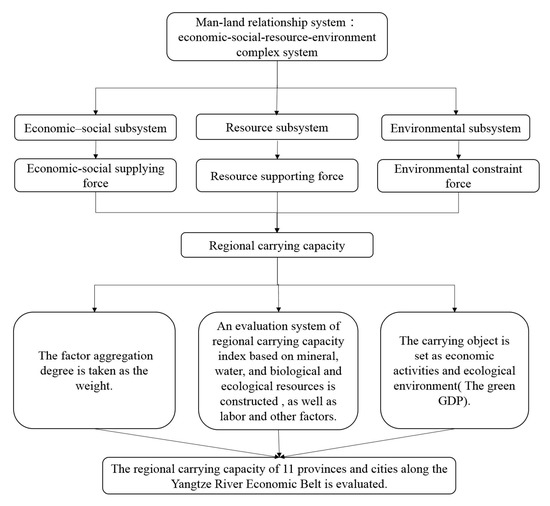
2.3. Regional Carrying Capacity Evaluation Framework

This paper puts forward an evaluation framework of regional carrying capacity from the following three aspects: resource carrying subsystem, environmental carrying subsystem and economic-social carrying subsystem, composed of “economic-social supplying force, resource supporting force, and environmental constraint force” (Figure 3). The economic-social subsystem provides a development factor supply for regional carrying capacity. The spatial aggregation of economic-social activities produces the center of economic activity. The economic factors flow in the less developed region—developed region—less developed region. In the early stages of economic-social development, the increasing marginal return of factors causes labor to flow from underdeveloped areas to developed areas. With the excessive concentration of economic factors in developed regions, factor suitability decreases, negative externalities occur, and utilization efficiency declines. With the guidance of policy and the change in the soothing environment of institutional culture, less developed areas gradually increase factor return to scale. It attracts the return of labor factors, and the aggregation of capital and innovation factors improves the supply capacity of regional economic factors, changes the regional function, and improves the regional carrying capacity threshold. The resource subsystem provides capacity support for regional carrying capacity. The efficiency of resource utilization is different in different regions and stages of development. Under the effect of “resource potential difference” [45], resource factors flow from areas with low utilization efficiency to areas with high efficiency. However, due to the favorable soft environment, the more developed regions can realize the recycling, diversified, and efficient utilization of resources in terms of policy management [46], resulting in a large concentration of resource factors. This improves the concentration of regional factors represented by mineral resources, reduces the number of resources consumed per unit of economic activity, forms an intensive and economical utilization of resources, and thus improves the carrying potential of regional resources and the environment. The constraint of an environmental subsystem on a regional carrying system mainly originates from polluter-pays environmental control. It is embodied in the capacity of the ecological environment system to produce pollution emissions from economic-social activities. Therefore, the carrying capacity of the man-land relationship regional system for economic-social activities is restricted by the high requirements of the ecological environment. This environmental constraint varies with ecosystem integrity and security in different regions. Due to the low importance of environmental safety and strong ecological vulnerability, some regions can withstand economic-social solid activities.
The construction of the regional carrying capacity evaluation system includes a target layer, criterion layer, factor layer, and indicator layer (Table 1). The paper holds that the supplying force of the economic-social subsystem to the formation of the regional man-land relationship system is mainly reflected in the spatial aggregation of economic factors under the effect of inflow and outflow. Four economic factors, including labor, capital, technological progress, and infrastructure, are selected to reflect the economic-social subsystem’s supply force to the regional carrying capacity. Regional carrying capacity is the economic and social intensity of the regional man-land relationship system. Most of our indicators are absolute. The labor force adopts the number of regional employments. Total investment in fixed assets is used to measure capital resources, and technological progress is considered by R&D expenditure and personnel input [47]. The resource subsystem measures the supporting force formed by the cross-regional flow of resources to economic-social activities and adopts mineral, land, water, and biological ecological resources [48]. Mineral resources are calculated according to solid, gas, and liquid minerals. Land resources are divided into construction land and cultivated land according to whether they are converted to agriculture or not. Biological and ecological resources mainly choose forest and food resources as raw materials for economic and social activities. The environmental subsystem mainly forms spatial constraints on the regional man-land relationship system. Therefore, four environmental factors, namely, water, soil, atmosphere, and ecological, closely related to economic-social activities, are selected as the factor layer. Based on the negative effects of constraint force, negative indicators such as total chemical oxygen demand (COD) and total ammonia nitrogen (NH3) emissions were selected to measure the emissions. The selection of specific indicators is based on comprehensive trade-offs of data availability, factor representativeness, and indicators adopted by most research.

3. Materials and Methods

In this paper, the evaluation of regional carrying capacity includes single-system evaluation and comprehensive evaluation. Through carrying state determination and zoning, the zoning distribution can be displayed in ArcGIS, which can directly display the current pattern of regional carrying capacity in the Yangtze River Economic Belt.

3.1. Evaluation Model

3.1.1. Weight

The objective of factor flow is to seek optimal allocation of factors in a certain region. China’s mineral resources and surplus labor force are mainly concentrated in the central and western regions. With the increasing mobility of factors of production, factors are highly concentrated in some developed regions [49]. The direct result of factor flow is factor aggregation and diffusion, and the final expression is factor suitability change. The carrying capacity of the “three forces” region under the combined system of economy, society, resources, and environment is evaluated using structural carrying capacity index, and the Yangtze River Economic Belt is taken as a case to evaluate and monitor the carrying capacity. The factor aggregation degree is taken as the weight. So the higher the factor aggregation degree, the higher the weight. Relevant studies believe that factor aggregation is positively correlated with output growth and total factor productivity growth within a certain moderate range [50]. Using the factor aggregation degree, as a measure of factor concentration and factor flow can better show the variation of non-regional factors among the three subsystems and also better reflect the dynamics of regional carrying capacity. Factor aggregation degree has been measured as given by Equations (1) and (2) [51].
Based on 31 provinces in China, this paper estimates the degree of aggregation of different factor indexes in 11 provinces along the Yangtze River Economic Belt.
E A i j = G i j [ 1 ( x i j ) 2 ] y i j [ 1 ( x i j ) 2 ] ( 1 y i j ) ,   G i j = k = 1 n l = 1 n | x i l x i k | 2 n 2 x i ¯ ,   x i ¯ = i = 1 m x i j m
x i j = F i j j = 1 n F i j ,   y i j = F i j i = 1 m F i j
where i refers to phase and j region. E A i j is the factor aggregation index, G i j spatial Gini coefficient, x i j the share of j regional factors in total districts and y i j the annual share of a factor F in the region j . F i j is the absolute amount of factor F in the region j , and x i ¯ the mean yearly value of factor F in the region j . n refers to the number of regions and m the number of years.

3.1.2. Regional Carrying Capacity Index

The regional carrying capacity index of the Yangtze Economic Belt is estimated based on the carrying capacity index of three subsystems in 11 provinces, and the simple weighted average method is used as given by Equation (3).
R B C i j = f ( E S C i j R C C i j E C C i j ) = { E S C i j = f ( E i j 1 , E i j 2 , , E i j n ) R C C i j = f ( R i j 1 , R i j 2 , , R i j n ) E C C i j = f ( C i j 1 , C i j 2 , , C i j n ) } = f = 1 N ( E A i j f F i j f )
where R B C i j is the regional carrying capacity index. E S C i j is the economic-social subsystem carrying index used to describe the supplying force. R C C i j is the resource subsystem carrying index, used to describe the supporting force. E C C i j is the environmental subsystem carrying index, used to describe the constraint force. E A i j f is the weight of factor f in the carrying capacity evaluation index system, and F i j f the absolute value of factor f .

3.1.3. Regional Carrying Capacity Object

The setting of carrying objects mostly takes population [52] and TOTAL GDP as objects or carries out statistical description directly through the construction of carrying capacity evaluation index system [53]. This setting does not reflect the characteristics of the research objective and object. According to the requirements of the development strategy of the Yangtze River Economic Belt, the carrying object is set as economic activities and ecological environment. The green GDP calculated by traditional GDP, loss value of natural resources, environmental pollution loss value, and positive returns on resources and environment is used to evaluate the actual carrying capacity of the region under the background of green high-quality development. Green GDP can better reflect the requirements of green, low-carbon, and sustainable development of the Yangtze River Economic Belt, and also reflect the regional carrying capacity requirements of resource regeneration and ecological environment recycling.

3.2. Data Collection

The data are mainly from China Statistical Yearbook, China Urban Statistical Yearbook, China Environmental Statistical Yearbook, China Land and Resources Statistical Yearbook, and related statistical yearbook of provinces from 2004 to 2020. Standard deviation method was used to standardize. A few indicators are missing such as the urban construction land area of Shanghai and Jiangsu in 2018, and the mean replacement method is used to supplement. The negative indicators mainly exist in the environmental subsystem. They are directly dealt with in subtraction to reflect the spatial constraint force of environment on regional economic-social activities. Due to the lack of data in some regions, green GDP of 11 provinces and cities in the Yangtze River Economic Belt from 2004 to 2005 could not be calculated. Therefore, the carrying status of 11 provinces and cities was calculated from 2006.

3.3. Criteria for Judging Regional Carrying Status

When the intensity of regional economic development exceeds the capacity of regional factor endowment, it will face a very severe and unsustainable status after a short development period. The damage to regional factor endowment caused by high-intensity development exceeding the carrying capacity threshold is often irreversible and eventually leads to the decline of the regional economy. In this paper, the specific green GDP per unit of carrying capacity is taken as the standard to judge the carrying status. The green GDP data of The Yangtze River Economic Belt from 2004 to 2019 were obtained by referring to Huang [54] and Zheng et al. [55]. We calculate the actual green GDP per unit carrying capacity index as the unit carrying capacity. Then the unit carrying capacity of the Yangtze River Economic Belt is compared with that of the whole country [56]. According to the change rate of unit carrying capacity, the regional carrying capacity is divided into three carrying statuses, namely, surplus, balance, and deficit. When the national unit carrying capacity exceeds 1% of the Yangtze River Economic Belt, the carrying status of the Yangtze River Economic Belt is deficit. When the national unit carrying capacity changes within the range of −1–1% compared with the Yangtze River Economic Belt, the carrying status is balanced. When the unit carrying capacity of the Yangtze River Economic Belt exceeds 1% of the country, the carrying status is surplus. This judgment of carrying capacity status can reflect the requirements of the Chinese government for the development of the Yangtze River Economic Belt. By comparing with the national carrying capacity index, this paper gives a criterion to judge the green and sustainable development of the Yangtze River Economic Belt, which can indicate whether its economic and social development is adapted to the resource and environment carrying capacity.

4. Results and Discussion

4.1. Evaluation Results of Regional Carrying Capacity

Table 2 shows the carrying capacity index and status of the Yangtze River Economic Belt. The regional carrying capacity index of the Yangtze River Economic Belt from 2004 to 2019 has an overall upward trend, and the carrying capacity status has a stable and favorable situation. The regional carrying capacity of the Yangtze River Economic Belt from 2010 to 2019 was in surplus. Compared with the country, the Yangtze River Economic Belt has achieved regional economic-social growth and maintained the quality of resources and environment under regional resources and the environmental constraints. The carrying capacity of the economic, social, resource and environmental subsystems also differs from deficit—balance—surplus. The carrying status from 2004 to 2009 fluctuated between deficit, balance, and surplus. However, after 2010, they all showed surplus, and the corresponding regional carrying capacity also showed deficit first, middle balance, and surplus later. In terms of the performance of the “three forces”, the supporting force of the resource subsystem and the constraint force of the environmental subsystem of the Yangtze River Economic Belt are better than the national data and have an evident impact on the regional carrying capacity. The supplying force of the economic-social subsystem is lower than the national average and has the most downward influence on the regional carrying capacity. The carrying status of the regional carrying capacity of the Yangtze River Economic Belt and the three subsystems is steadily improving. It is consistent with the conclusion that the index value of the resource and environmental carrying capacity in the Yangtze River Economic Belt shows a trend of fluctuation and rise in general.
The Yangtze River Economic Belt made remarkable progress in green development from 2004 to 2019, as shown in Figure 4. In terms of its contribution to the national green economic growth, the overall development level of green GDP in the Yangtze River Economic Belt has remained stable. The proportion fluctuated around 40%, peaking at 46.06% in 2016 and 13.79% higher in 2019 than in 2004. Regarding the performance of “three forces”, the environmental constraint force index is the most stable, followed by the economic-social supplying force index and the resource-supporting force index. The regional carrying capacity and resource supporting force variation are consistent and highly overlapped. This shows that the supporting force of the resource subsystem becomes the most critical factor affecting the carrying capacity of the Yangtze River Economic Belt. The regional carrying capacity and the three subsystem carrying capacity indexes of the Yangtze River Economic Belt also have an increasing trend year by year. The regional carrying capacity and environmental constraint force reached their peak values in 2016, and the economic-social supplying force and resource-supporting force reached their maximum values in 2019, respectively. The carrying capacity is consistent with the change in green GDP in the Yangtze River Economic Belt at the national level. Overall, the regional carrying capacity of the Yangtze River Economic Belt shows steady growth, especially the change in the supporting force of the regional resource system is noticeable, which has an apparent supportive effect on the regional carrying capacity. Driven by China’s green development policy and increasing returns to scale, resources have produced efficient flow and effective aggregation, which has promoted high-quality economic development in the Yangtze River Economic Belt. The evaluation results of green GDP development based on unit carrying capacity show that the green development effect of the Yangtze River Economic Belt has gradually become prominent, which is also consistent with the conclusion of relevant research [57,58] that the green development of the Yangtze River Economic Belt has achieved significant results.

4.2. Spatial and Temporal Distribution of Carrying Capacity in the Yangtze River Economic Belt

4.2.1. Distribution of Regional Carrying Capacity

Figure 5 shows the distribution of regional carrying capacity in the Yangtze River Economic Belt in 2006 and 2019. From the perspective of spatial structure, 11 provinces along the Yangtze River Economic Belt were compared in terms of regional carrying capacity status and carrying capacity index, showing apparent differences in spatial distribution. The deficit distribution areas are reduced from seven provinces and cities to five provinces, among which Anhui and Hubei have achieved the balance of carrying capacity. Except for Shanghai, which changed from surplus to deficit, other provinces have realized carrying status improvement, among which Jiangsu and Zhejiang have kept surplus. The carrying capacity index does not quite fit the status. In particular, the carrying capacity indexes of Hunan, Yunnan, and Guizhou in 2006, and Guizhou, Chongqing, Yunnan, and Jiangxi in 2019, are high. Still, the carrying capacity was in deficit, related to the low level of economic development and the overall level of green GDP. Although the carrying capacity of Sichuan province was not high in 2006 and 2019, it was at the lowest level. However, the high level of green development has also achieved a carrying status balance or surplus. On the other hand, Jiangsu has achieved double high carrying status and a carrying capacity index, which is truly green and high-quality development. Although the carrying capacity of Shanghai and Zhejiang varies due to the high level of economic growth and significant green development benefits, the carrying capacity balance or surplus is also achieved. Anhui, Hubei, and Jiangxi have improved their carrying capacity, and Jiangxi has also completed the transition to high-quality green development. The results confirm the findings of Tian et al. regarding the comprehensive carrying capacity of the Yangtze River Economic Belt [59]. Tian et al. found approximately 50 cities in the Yangtze River Economic Belt lay on the rising segment of the “U” curve in 2014.

4.2.2. Distribution of the Economic-Social Supplying Force

Figure 6 shows the distribution of economic-social supplying forces in the Yangtze River Economic Belt in 2006 and 2019. The supplying force of the economic-social subsystem has little difference in spatial distribution and a narrow variation range. From 2006 to 2019, Hubei, Anhui, and Jiangxi realized the transition from deficit to balance and Shanghai from surplus to balance, but other provinces did not see any change. The carrying status of the economic-social subsystem of the Yangtze River Economic Belt completed the quantitative change from high deficit to high balance, which promoted the qualitative economic-social development shift. The great variation of the economic-social supplying force also indicates that the factors between the economic-social subsystems consisting of technology, labor force, capital, and infrastructure flow frequently, and the concentration degree is deepened. Shanghai, Jiangsu, Hunan, Jiangxi, Zhejiang, Chongqing, Anhui, and other provinces, which were originally relatively high level, appeared to be the phenomenon of aggregation diseconomy caused by excessive concentration of factors and factor diffusion, which resulted in the decline of economic and social supply force. However, Sichuan, Yunnan, and Guizhou still have positive externalities due to factor flow, which belongs to the effective aggregation scope and realizes the improvement of the economic and social supply force. The results of the economic-social supplying force index in this paper are consistent with Chai and Zhou’s research on the water environment and social-economic system of the Yangtze River Economic Belt [60], although there is a slight difference. Our study found that the carrying capacity of the economic-social subsystem increased from east to west, while Chai and Zhou‘s study stated that it showed an absolute change from east to west.

4.2.3. Distribution of the Resource Supporting Force

Figure 7 shows the distribution of resource supporting forces in the Yangtze River Economic Belt in 2006 and 2019. The spatial distribution of the supporting force of the resource subsystem in the Yangtze River Economic Belt is consistent with the supplying force of the economic-social subsystem, and the overall transformation is from deficit to balance and surplus. The only significant change was in Shanghai. The reason is that the resource-supporting capacity increased from 77.46 to 99.67, with a growth rate of 28.67%. Its green GDP growth rate is lower than the national average. From 2006 to 2019, China’s green GDP grew by 325.86 percent. The growth rate of green GDP in Shanghai was 145.45%. Exponentially, there has been a general decline in resource support. With the development intensity of economic activities increasing, resource consumption also increases day by day. The land used for urban construction increased significantly, while cultivated land and effective irrigated area in some areas decreased, just like Shen et al.‘s conclusion [61]. For example, the cultivated land of Zhejiang, where the resource supporting force index changes the most, decreased from 2.09 million hectares in 2000 to 1.97 million hectares in 2017, down 5.37%. This conclusion confirms the findings of some studies (Tang et al. [62]; Zou and Ma [63]) but is contrary to those of others (Bao et al. [64]), due to the difference in spatial scale of research objects.

4.2.4. Distribution of the Environmental Constraint Force

Figure 8 shows the distribution of environmental constraint forces in the Yangtze River Economic Belt in 2006 and 2019. From 2018 to 2021, the central government allocated 321 billion yuan for the Yangtze Economic Belt. It was used to compensate for key ecological function zones; prevent and control air, water, and soil pollution; protect and restore mountains, rivers, forests, farmland, lakes, and grasslands; control pollution from non-point agricultural sources; control domestic sewage and garbage in rural areas. From 2006 to 2019, the carrying status of the environmental subsystem in the Yangtze River Economic Belt showed an overall improvement trend, which is consistent with Liu et al. [65] and Yang et al. [66], but contrary to Zhang et al. [67]. Anhui, Hubei, and Jiangxi realized the transition from ecological deficit to balance, Sichuan from balance to surplus, and other provinces and cities except Shanghai maintained their original status. The environmental constraint force has generally achieved a step forward from a low level to a high level. In 2019, Chongqing and Guizhou entered the highest level of environmental constraint capacity, Jiangsu and Shanghai were in the second level, and Hunan was the lowest. Due to the Women Mountain restoration project, Guizhou’s environmental constraint force has always been at the highest level. It can be seen that the environmental constraint force is related to the background of natural factors and has a specific impact on the investment and efficiency of ecological environment maintenance.

5. Conclusions and Policy Recommendation

The paper explores the interaction mechanism between regional carrying capacity and factor flow and forms a carrying capacity mechanism composed of economic-social supplying, resource supporting, and environmental constraint forces. We constructed an evaluation system of the regional carrying capacity index based on mineral, water, and biological and ecological resources, as well as labor and other factors, and evaluated the regional carrying capacity of 11 provinces and cities along the Yangtze River Economic Belt. The following conclusions can be drawn from the analysis:
  • The factor concentration is caused by the factor flow in and among the subsystems of economy, society, resources, and environment in the man-land relationship regional system. Effective aggregation can improve resource utilization efficiency, thus realizing the positive externality and enhancing the carrying capacity;
  • Regional carrying capacity is a comprehensive status formed by the interaction of the economy, society, resources, and environment under the open perspective of the man-land system. The supporting force of the resource subsystem has become the most critical factor affecting the carrying capacity of the Yangtze River economic belt. The carrying status of economic-social subsystems, resources, and the environment are highly consistent with the regional carrying status, indicating that the economic-social subsystem also constitutes a part of the regional carrying capacity and has a significant impact on the regional carrying capacity. This verifies the theory proposed in this paper, in which the economic-social subsystem is a part of the regional carrying system;
  • The functions of different systems should be treated separately to find out the main factors restricting regional carrying capacity in different periods. The influence of factor flow and material exchange on regional carrying capacity should be emphasized from the perspective of multi-system and multi-factor integration. In particular, economic development and technological progress help improve the efficiency of resource exploitation and utilization and the maximum capacity of the environment to make up for the lack of regional resource and environmental carrying capacity. The regions along the Yangtze River Economic Belt present a relatively balanced regional development trend of carrying capacity, economic-social supplying force, resource supporting force, and environmental constraint force from the eastern part to the central part to the western part.
The paper puts forward the following policy suggestions:
  • The evaluation system of regional carrying capacity formed in this study can be well applied to the evaluation of regional sustainable development and the monitoring of regional carrying capacity in urban spatial planning and can better track the changes in regional resources and the environment. It is suggested that the central government and local governments should apply this system to establish a regional bearing capacity evaluation database;
  • The variation of factor flow and the difference in regional factor endowment should be paid attention to in the evaluation of regional carrying capacity in both developed and less developed regions. Green and low-carbon sustainable development should be based on regional differences in resource and environmental endowment and economic and social development status. China’s planning for regional development should be based on the current situation of regional carrying capacity. For example, the Yangtze River Economic Belt should play the role of a growth pole;
  • China should continue to carry out ecological civilization construction and carry out ecological protection and restoration projects. According to the evaluation results of carrying capacity, China’s ecological protection and restoration effects are obvious. Financial investment in ecological protection and restoration and ecological compensation should be continuously increased to reduce environmental pollution and improve regional carrying capacity.
The regional carrying capacity evaluation studied in this paper is a relative carrying status, not an absolute carrying capacity. The criteria of carrying capacity status are also compared with the carrying capacity of the whole country. Affected by economic development, technological progress, environmental change, and resource consumption, the index and status of regional carrying capacity are changing with the intensification of factor flow. At present, there is no particular accurate measurement method to determine the regional carrying capacity. Because it is so hard to incorporate all the economic, social, resource, and environmental factors. Although this paper uses the relative evaluation method, the evaluation method can be applied to any region or province. The results can also be compared with any other region. The next step is to do in-depth and detailed research on the evaluation framework, including more economic-social factors, resource factors, and environmental factors, and further optimize the judgment criteria in order to calculate the absolute regional carrying capacity. It is recommended for future research to conduct empirical studies for the application of the regional carrying capacity evaluation framework established in this study.

Author Contributions

Z.Z. conceived and wrote the paper. G.O. contributed to review and supervision. A.E. contributed to review and editing. R.L. contributed to graphic processing. All authors have read and agreed to the published version of the manuscript.

Funding

This work was supported by the National Social Science Foundation of China [Grant No. 20&ZD099].

Institutional Review Board Statement

Not applicable.

Informed Consent Statement

Not applicable.

Data Availability Statement

Data of minerals, land, water, and bioecological resources has been obtained from the Ministry of Natural Resources of the People’s Republic of China (http://tddc.mnr.gov.cn/to_Login). Data of water environment, edatope, atmosphere, and ecotope has been obtained from the Ministry of Ecology and Environment of the People’s Republic of China (https://www.mee.gov.cn/). Data of labor, capital, technology and infrastructure in the Yangtze River Economic Belt have been obtained from the China’s national bureau of statistics (http://data.stats.gov.cn/easyquery.htm?cn=C01, accessed on 11 April 2022).

Conflicts of Interest

The authors declare no conflict of financial interest.

References

  1. Yu, Y.; Zhang, N.; Kim, J.D. Impact of urbanization on energy demand: An empirical study of the Yangtze River Economic Belt in China. Energy Policy 2020, 139, 111354. [Google Scholar] [CrossRef]
  2. Meng, C.H.; Du, X.Y.; Ren, Y.T.; Shen, L.Y.; Cheng, G.Y.; Wang, J.H. Sustainable urban development: An examination of literature evolution on urban carrying capacity in the Chinese context. J. Clean. Prod. 2020, 277, 15. [Google Scholar] [CrossRef]
  3. Shen, L.Y.; Shu, T.H.; Liao, X.; Yang, N.; Ren, Y.T.; Zhu, M.C.; Cheng, G.Y.; Wang, J.H. A new method to evaluate urban resources environment carrying capacity from the load-and-carrier perspective. Resour. Conserv. Recycl. 2020, 154, 16. [Google Scholar] [CrossRef]
  4. Zhiming, F.; Tong, S.; Yanzhao, Y.; Huimin, Y. The progress of resources and environment carrying capacity: From single-factor carrying capacity research to comprehensive research. J. Resour. Ecol. 2018, 9, 125–134. [Google Scholar] [CrossRef]
  5. Fearnside, P.M. Estimation of human carrying capacity in rainforest areas. Trends Ecol. Evol. 1990, 5, 192–196. [Google Scholar] [CrossRef]
  6. Arrow, K.; Bolin, B.; Costanza, R.; Dasgupta, P.; Folke, C.; Holling, C.S.; Jansson, B.-O.; Levin, S.; Mäler, K.-G.; Perrings, C.J.E.; et al. Economic growth, carrying capacity, and the environment. Ecol. Econ. 1995, 15, 91–95. [Google Scholar] [CrossRef]
  7. Price, D.J.P. Environment, Carrying capacity reconsidered. Popul Environ. 1999, 21, 5–26. [Google Scholar] [CrossRef]
  8. Sun, T.; Feng, Z.M.; Yang, Y.Z.; Lin, Y.M.; Wu, Y.Y. Research on Land Resource Carrying Capacity: Progress and Prospects. J. Resour. Ecol. 2018, 9, 331–340. [Google Scholar]
  9. Graymore, M.L.M.; Sipe, N.G.; Rickson, R.E. Sustaining Human Carrying Capacity: A tool for regional sustainability assessment. Ecol. Econ. 2010, 69, 459–468. [Google Scholar] [CrossRef]
  10. Chai, G.P.; Xu, M.D.; Wang, F.; Zuo, C. The Comprehensive Evaluation Model of Resources and Environmental Carrying Capability. J. Geo-Inf. Sci. 2014, 16, 257–263. [Google Scholar]
  11. Han, C.Q.; Lu, B.B.; Zheng, J.H. Analysis and Prediction of Land Resources’ Carrying Capacity in 31 Provinces of China from 2008 to 2016. Sustainability 2021, 13, 20. [Google Scholar] [CrossRef]
  12. Wu, M.W.; Wu, J.Q.; Zang, C.F. A comprehensive evaluation of the eco-carrying capacity and green economy in the Guangdong-Hong Kong-Macao Greater Bay Area, China. J. Clean. Prod. 2021, 281, 16. [Google Scholar] [CrossRef]
  13. Tang, B.; Hu, Y.; Li, H.; Yang, D.; Liu, J.J.N.H. Research on comprehensive carrying capacity of Beijing–Tianjin–Hebei region based on state-space method. Nat. Hazards 2016, 84, 113–128. [Google Scholar] [CrossRef]
  14. Fatai Adedoyin, F.; Agboola, P.O.; Ozturk, I.; Bekun, F.V.; Agboola, M.O. Environmental consequences of economic complexities in the EU amidst a booming tourism industry: Accounting for the role of brexit and other crisis events. J. Clean. Prod. 2021, 305, 127117. [Google Scholar] [CrossRef]
  15. Zhou, W.; Elshkaki, A.; Zhong, S.; Shen, L. Study on Relative Carrying Capacity of Land Resources and Its Zoning in 31 Provinces of China. Sustainability 2021, 13, 1459. [Google Scholar] [CrossRef]
  16. Ren, Y.; Shen, L.; Wei, X.; Wang, J.; Cheng, G. A guiding index framework for examining urban carrying capacity. Ecol. Indic. 2021, 133, 108347. [Google Scholar] [CrossRef]
  17. Zhang, M.; Liu, Y.; Wu, J.; Wang, T. Index system of urban resource and environment carrying capacity based on ecological civilization. Environ. Impact Assess. Rev. 2018, 68, 90–97. [Google Scholar] [CrossRef]
  18. Zhang, J.; Zhang, C.; Shi, W.; Fu, Y. Quantitative evaluation and optimized utilization of water resources-water environment carrying capacity based on nature-based solutions. J. Hydrol. 2019, 568, 96–107. [Google Scholar] [CrossRef]
  19. Wang, D.; Shi, Y.; Wan, K. Integrated evaluation of the carrying capacities of mineral resource-based cities considering synergy between subsystems. Ecol. Indic. 2020, 108, 105701. [Google Scholar] [CrossRef]
  20. Wang, J.; Wei, X.; Guo, Q. A three-dimensional evaluation model for regional carrying capacity of ecological environment to social economic development: Model development and a case study in China. Ecol. Ind. 2018, 89, 348–355. [Google Scholar] [CrossRef]
  21. Lane, M.; Dawes, L.; Grace, P. Scalar considerations in carrying capacity assessment: An Australian example. Popul. Env. 2015, 36, 356–371. [Google Scholar] [CrossRef] [Green Version]
  22. Dan-lin, Y.; Han-ying, M. Regional carrying capacity: Case studies of Bohai Rim area. J. Geogr. Sci. 2002, 12, 177–185. [Google Scholar] [CrossRef]
  23. Wang, L.; Liu, H. Comprehensive evaluation of regional resources and environmental carrying capacity using a PS-DR-DP theoretical model. J. Geogr. Sci. 2019, 29, 363–376. [Google Scholar] [CrossRef] [Green Version]
  24. Lane, M. The carrying capacity imperative: Assessing regional carrying capacity methodologies for sustainable land-use planning. Land Use Policy 2010, 27, 1038–1045. [Google Scholar] [CrossRef] [Green Version]
  25. Peng, T.; Deng, H. Comprehensive evaluation for sustainable development based on relative resource carrying capacity—A case study of Guiyang, Southwest China. Environ. Sci. Pollut. Res. 2020, 27, 20090–20103. [Google Scholar] [CrossRef] [PubMed]
  26. Sun, M.; Wang, J.; He, K.J.A.G. Analysis on the urban land resources carrying capacity during urbanization—A case study of Chinese YRD. Appl. Geogr. 2020, 116, 102170. [Google Scholar] [CrossRef]
  27. Cheng, J.Y.; Zhou, K.; Chen, D.; Fan, J. Evaluation and analysis of provincial differences in resources and environment carrying capacity in China. Chin. Geogr. Sci. 2016, 26, 539–549. [Google Scholar] [CrossRef]
  28. Gao, Q.; Fang, C.; Liu, H.; Zhang, L. Conjugate evaluation of sustainable carrying capacity of urban agglomeration and multi-scenario policy regulation. Sci. Total Environ. 2021, 785, 147373. [Google Scholar] [CrossRef]
  29. Cui, X.; Du, Q.; Zou, P.X.W.; Lu, C.; Li, Y. A method for incorporating heterogeneity in measuring the economic carrying capacity of urban infrastructures. J. Clean. Prod. 2022, 332, 130058. [Google Scholar] [CrossRef]
  30. Wei, X.X.; Shen, L.Y.; Liu, Z.; Luo, L.Y.; Wang, J.H.; Chen, Y. Comparative analysis on the evolution of ecological carrying capacity between provinces during urbanization process in China. Ecol. Indic. 2020, 112, 15. [Google Scholar] [CrossRef]
  31. Wang, J.; Ren, Y.; Shu, T.; Shen, L.; Liao, X.; Yang, N.; He, H. Economic perspective-based analysis on urban infrastructures carrying capacity—A China study. Environ. Impact Assess. Rev. 2020, 83, 106381. [Google Scholar] [CrossRef]
  32. Pu, L.J.; Huang, X.J. The interdisciplinary study and integration of disciplines for geography and resources science. J. Nat. Resour. 2020, 35, 1830–1838. [Google Scholar]
  33. Wang, F.; Wang, C.; Ye, Y.; Wen, B. An Improved Method for Evaluating Regional Resource Carrying Capacities: A Case Study of the Tarim River Basin in Arid China. Pol. J. Environ. Stud. 2019, 28, 2415–2428. [Google Scholar] [CrossRef]
  34. Guo, S.L.; Li, C.J.; Liu, S.Q.; Zhou, K. Land carrying capacity in rural settlements of three gorges reservoir based on the system dynamic model. Nat. Resour. Model. 2018, 31, 15. [Google Scholar] [CrossRef]
  35. Gallagher, R.; Appenzeller, T. Beyond reductionism—Introduction. Science 1999, 284, 79. [Google Scholar] [CrossRef]
  36. Li, S.C.; Wang, Y.; Cai, Y.L. The Paradigm Transformation of Geography from the Perspective of Complexity Sciences. Acta Geogr. Sin. 2010, 65, 1315–1324. [Google Scholar]
  37. Fu, J.Y.; Zang, C.F.; Zhang, J.M. Economic and resource and environmental carrying capacity trade-off analysis in the Haihe River basin in China. J. Clean. Prod. 2020, 270, 13. [Google Scholar] [CrossRef]
  38. Schneider, D.M.; Godschalk, D.R.; Axler, N. The Carrying Capacity Concept as a Planning Tool; American Society of Planning Officials: Chicago, IL, USA, 1978. [Google Scholar]
  39. Sheng, K.R.; Fan, J. The Formation Mechanism of Regional Function: An Analysis Based on the Theory of Man-Earth Areal System. Econ. Geogr. 2018, 38, 11–19. [Google Scholar]
  40. Zhang, Z.; Lu, W.X.; Zhao, Y.; Song, W.B. Development tendency analysis and evaluation of the water ecological carrying capacity in the Siping area of Jilin Province in China based on system dynamics and analytic hierarchy process. Ecol. Model. 2014, 275, 9–21. [Google Scholar] [CrossRef]
  41. Lu, D.D. Theoretical studies of man-land system as the core of geographical science. Geogr. Res. 2002, 21, 135–145. [Google Scholar]
  42. Wei, C.; Guo, Z.Y.; Wu, J.P.; Ye, S.F. Constructing an assessment indices system to analyze integrated regional carrying capacity in the coastal zones—A case in Nantong. Ocean. Coast. Manag. 2014, 93, 51–59. [Google Scholar] [CrossRef]
  43. Ren, W.H.; Zeng, Q. Is the green technological progress bias of mariculture suitable for its factor endowment?—Empirical results from 10 coastal provinces and cities in China. Mar. Pol. 2021, 124, 12. [Google Scholar] [CrossRef]
  44. Zhou, X.Y.; Zheng, B.H.; Khu, S.T. Validation of the hypothesis on carrying capacity limits using the water environment carrying capacity. Sci. Total Environ. 2019, 665, 774–784. [Google Scholar] [CrossRef] [PubMed]
  45. Narayanaswamy, V.; Scott, J.A.; Ness, J.N.; Lochhead, M. Resource flow and product chain analysis as practical tools to promote cleaner production initiatives. J. Clean. Prod. 2003, 11, 375–387. [Google Scholar] [CrossRef]
  46. Ruggiero, G.; Verdiani, G.; Dal Sasso, S. Evaluation of carrying capacity and territorial environmental sustainability. J. Agric. Eng. 2012, 43, e10. [Google Scholar] [CrossRef]
  47. Giljum, S. Trade, materials flows, and economic development in the South: The example of Chile. J. Ind. Ecol. 2004, 8, 241–261. [Google Scholar] [CrossRef]
  48. Wang, R.; Cheng, J.H.; Zhu, Y.L.; Xiong, W.W. Research on diversity of mineral resources carrying capacity in Chinese mining cities. Resour. Policy 2016, 47, 108–114. [Google Scholar] [CrossRef]
  49. Oh, K.; Jeong, Y.; Lee, D.; Lee, W.; Choi, H. Determining development density using the Urban Carrying Capacity Assessment System. Landsc. Urban. Plan. 2005, 73, 1–15. [Google Scholar] [CrossRef]
  50. Yang, N.N.; Li, J.S.; Lu, B.B.; Luo, M.H.; Li, L.Z. Exploring the Spatial Pattern and Influencing Factors of Land Carrying Capacity in Wuhan. Sustainability 2019, 11, 16. [Google Scholar] [CrossRef] [Green Version]
  51. Wang, X.; Zhou, D.Q. Spatial agglomeration and driving factors of environmental pollution: A spatial analysis. J. Clean. Prod. 2021, 279, 10. [Google Scholar] [CrossRef]
  52. Liu, Z.D.; Yu, X.G. Carrying capacity of resources and problems of sustainable development in yangtze basin. Resour. Environ. Yangtze Val. 2002, 11, 10–15. [Google Scholar]
  53. Xu, S.R.; Wu, T.; Zhang, Y. The spatial-temporal variation and convergence of green innovation efficiency in the Yangtze River Economic Belt in China. Environ. Sci. Pollut. Res. 2020, 27, 26868–26881. [Google Scholar] [CrossRef] [PubMed]
  54. Huang, X.; Li, H. Resources, Environment and Green Development of the Yangtze River Economic Belt; Nanjing University Press: Nanjing, China, 2020. [Google Scholar]
  55. Zheng, L.; Zhang, Q.W.; Zhang, A.P.; Hussain, H.A.; Liu, X.R.; Yang, Z.L. Spatiotemporal characteristics of the bearing capacity of cropland based on manure nitrogen and phosphorus load in mainland China. J. Clean. Prod. 2019, 233, 601–610. [Google Scholar] [CrossRef]
  56. Huang, X.J.; Jin, Y.Z.; Guo-Liang, X.U.; Chang-Yan, W.U. Conception of Sub-Line of Hu Huangyong Population Line and Patterns of Future Population Carrying in the Yangtze River Economic Belt. Resour. Environ. Yangtze Basin 2017, 26, 1937–1944. [Google Scholar]
  57. Liu, Y.H.; Huang, X.J.; Chen, W.L. Threshold Effect of High-Tech Industrial Scale on Green Development-Evidence from Yangtze River Economic Belt. Sustainability 2019, 11, 21. [Google Scholar] [CrossRef] [Green Version]
  58. Wang, Y.Y.; Peng, B.H.; Wei, G.; Elahi, E. Comprehensive Evaluation and Spatial Difference Analysis of Regional Ecological Carrying Capacity: A Case Study of the Yangtze River Urban Agglomeration. Int. J. Environ. Res. Public Health 2019, 16, 16. [Google Scholar] [CrossRef] [Green Version]
  59. Tian, Y.; Sun, C. Comprehensive carrying capacity, economic growth and the sustainable development of urban areas: A case study of the Yangtze River Economic Belt. J. Clean. Prod. 2018, 195, 486–496. [Google Scholar] [CrossRef]
  60. Chai, N.; Zhou, W. The DPSIRM—Grey cloud clustering method for evaluating the water environment carrying capacity of Yangtze River economic Belt. Ecol. Indic. 2022, 136, 108722. [Google Scholar] [CrossRef]
  61. Shen, L.; Cheng, G.; Du, X.; Meng, C.; Ren, Y.; Wang, J. Can urban agglomeration bring “1 + 1 > 2Effect”? A perspective of land resource carrying capacity. Land Use Policy 2022, 117, 106094. [Google Scholar] [CrossRef]
  62. Tang, X.; Guan, X.; Lu, S.; Qin, F.; Liu, X.; Zhang, D. Examining the spatiotemporal change of forest resource carrying capacity of the Yangtze River Economic Belt in China. Environ. Sci. Pollut. Res. 2020, 27, 21213–21230. [Google Scholar] [CrossRef]
  63. Zou, H.; Ma, X. Identifying resource and environmental carrying capacity in the Yangtze River Economic Belt, China: The perspectives of spatial differences and sustainable development. Environ. Dev. Sustain. 2021, 23, 14775–14798. [Google Scholar] [CrossRef]
  64. Bao, H.; Wang, C.; Han, L.; Wu, S.; Lou, L.; Xu, B.; Liu, Y. Resources and Environmental Pressure, Carrying Capacity, And Governance: A Case Study of Yangtze River Economic Belt. Sustainability 2020, 12, 1576. [Google Scholar] [CrossRef] [Green Version]
  65. Liu, J.; Tian, Y.; Huang, K.; Yi, T. Spatial-temporal differentiation of the coupling coordinated development of regional energy-economy-ecology system: A case study of the Yangtze River Economic Belt. Ecol. Indic. 2021, 124, 107394. [Google Scholar] [CrossRef]
  66. Yang, Y.; Lu, H.; Liang, D.; Chen, Y.; Tian, P.; Xia, J.; Wang, H.; Lei, X. Ecological sustainability and its driving factor of urban agglomerations in the Yangtze River Economic Belt based on three-dimensional ecological footprint analysis. J. Clean. Prod. 2022, 330, 129802. [Google Scholar] [CrossRef]
  67. Zhang, Y.; Sun, M.; Yang, R.; Li, X.; Zhang, L.; Li, M. Decoupling water environment pressures from economic growth in the Yangtze River Economic Belt, China. Ecol. Indic. 2021, 122, 107314. [Google Scholar] [CrossRef]
Figure 1. Map of The Yangtze River Economic Belt.
Sustainability 14 07117 g001
Figure 2. The process of regional resource-environment-economic-social subsystems from the perspective of factors flow.
Sustainability 14 07117 g002
Figure 3. Regional carrying capacity framework of “three forces”.
Sustainability 14 07117 g003
Figure 4. Carrying capacity index of the Yangtze River Economic Belt from 2004 to 2019.
Sustainability 14 07117 g004
Figure 5. Distribution of regional carrying capacity in the Yangtze River Economic Belt.
Sustainability 14 07117 g005
Figure 6. Distribution of economic-social supplying force in the Yangtze River Economic Belt.
Sustainability 14 07117 g006
Figure 7. Distribution of resource supporting force in the Yangtze River Economic Belt.
Sustainability 14 07117 g007
Figure 8. Distribution of environmental constraint force in the Yangtze River Economic Belt.
Sustainability 14 07117 g008
Table 1. Regional carrying capacity evaluation index system.
Target LayerCriterion LayerFactor Layer Indicator Layer
Regional carrying subjectEconomic-social subsystemLaborIndex of number employed
CapitalFixed investments
TechnologyR&D spending; Full-time equivalent of R&D personnel
InfrastructureRailway, inner channel, and highway mileage; Urban green area
Resource subsystemMineralsSolid mineral production (coal, iron ore, etc.); Oil and gas mineral production (crude oil, natural gas)
LandUrban construction land area; Effective irrigated area of cultivated land;
WaterTotal water resources
Bioecological resourcesLive wood stock; Food production
Environmental subsystemWater environmentTotal chemical oxygen demand emission; Total ammonia nitrogen emissions
EdatopePesticide usage; Production of general industrial solid waste
AtmosphereTotal sulfur dioxide emission; Total nitrogen oxide emissions
EcotopeForest coverage
Regional carrying objectEconomic-social activitiesGreen GDPGDP; Loss of value of natural resources; Environmental pollution loss value; Positive returns on resources and environment
Table 2. The Yangtze River Economic Belt regional carrying capacity classification status.
Year2004200520062007200820092010201120122013201420152016201720182019
Regional Unit Carrying CapacityThe Yangtze River Economic Belt736.61778.73969.61304.341318.461537.31840.652225.712488.862751.52992.783207.73089.43927.574020.184432.64
The country813.54822.85965.741192.991365.9315331775.232118.842378.72583.392822.142975.22857.373499.653759.044112.71
The difference rate10.44%5.67%−0.40%−8.54%3.60%−0.28%−3.55%−4.80%−4.43%−6.11%−5.70%−7.25%−7.51%−10.90%−6.50%−7.22%
Carrying statusDeficitDeficitBalance SurplusDeficitBalance SurplusSurplusSurplusSurplusSurplusSurplusSurplusSurplusSurplusSurplus
Unit Carrying Capacity of Economic-social SubsystemThe Yangtze River Economic Belt776.3761.14970.881268.4913061522.691843.362212.072507.062779.133051.493301.243652.24096.474317.654818.39
The country831.68809.16956.221165.231347.91524.361769.222109.262391.962609.212845.073020.73280.853692.744157.274601.49
The difference rate7.13%6.31%−1.51%−8.14%3.21%0.11%−4.02%−4.65%−4.59%−6.11%−6.76%−8.50%−10.17%−9.86%−3.71%−4.50%
Carrying statusDeficitDeficitSurplusSurplusSurplusBalance SurplusSurplusSurplusSurplusSurplusSurplusSurplusSurplusSurplusSurplus
Unit Carrying Capacity of Resource SubsystemThe Yangtze River Economic Belt651.72777.95988.571299.161326.91533.341842.442226.682489.92756.133002.963235.913524.894024.524230.334713.56
The country708.42817.28966.921182.841360.511528.21763.872109.832366.842579.742820.533009.53268.753735.994094.544562.51
The difference rate8.70%5.06%−2.19%−8.95%2.53%−0.33%−4.26%−5.25%−4.94%−6.40%−6.07%−7.00%−7.27%−7.17%−3.21%−3.20%
Carrying statusDeficitDeficitSurplusSurplusDeficitBalance SurplusSurplusSurplusSurplusSurplusSurplusSurplusSurplusSurplusSurplus
Unit Carrying Capacity of Environmental SubsystemThe Yangtze River Economic Belt636.16764.27966.811257.391297.311512.671832.812215.552521.972805.213093.113352.473205.784127.484425.595046.89
The country693.04809951.381151.821334.061506.991760.682125.132427.712661.112941.213129.243006.593732.434220.764785.72
The difference rate8.94%5.85%−1.60%−8.40%2.83%−0.38%−3.94%−4.08%−3.74%−5.14%−4.91%−6.66%−6.21%−9.57%−4.63%−5.17%
Carrying statusDeficitDeficitSurplusSurplusDeficitBalance SurplusSurplusSurplusSurplusSurplusSurplusSurplusSurplusSurplusSurplus
Publisher’s Note: MDPI stays neutral with regard to jurisdictional claims in published maps and institutional affiliations.

