
The Informal City: Exploring the Variety of the Street Vending Economy


Abstract
:1. Introduction
2. General Background
2.1. The Study of the Informal Economy
2.2. Spatial Segmentation and Financial Inclusion
2.3. Research on the Informal Economy and Street Vending
3. City Context
Informality in Cali
4. Data and Methods
5. Results
5.1. Segmentation
5.2. Indebtedness of Street Vendors
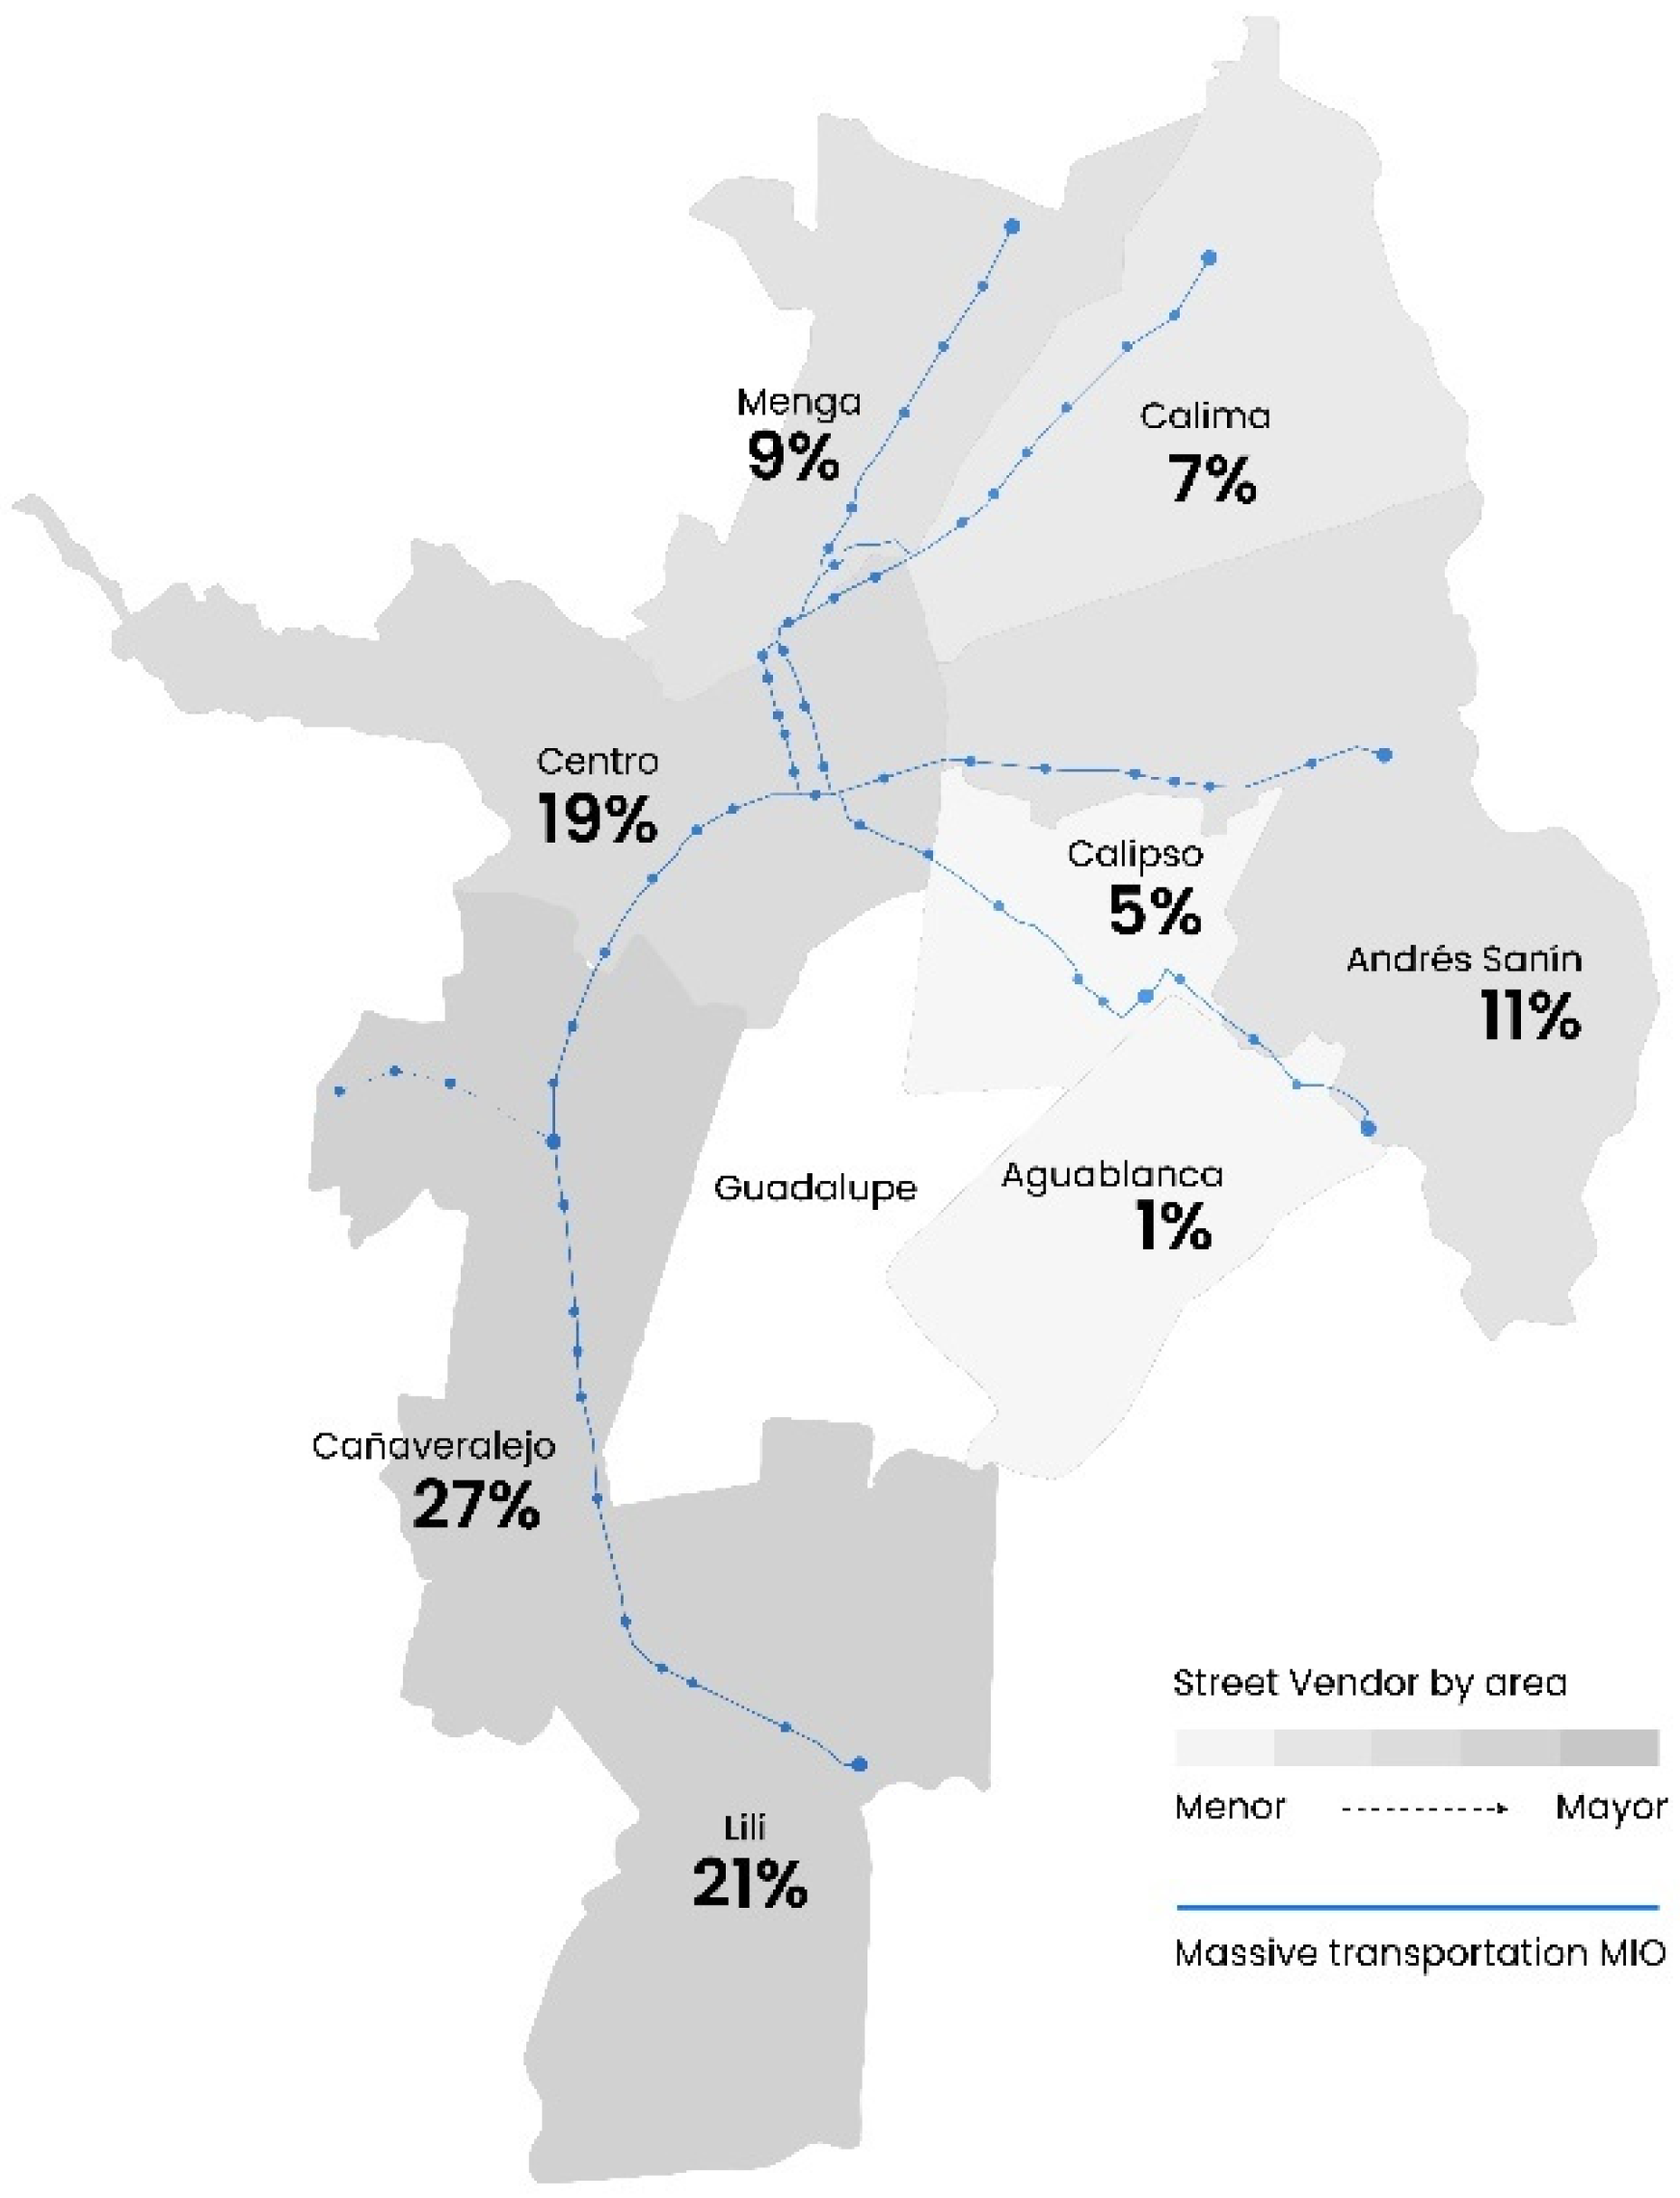
5.3. Workers at MIO
6. Discussion and Policy Implications
- The well-established: stable, relatively affluent, and regularized (Downtown)
- Gateway Type 1: for rural displaced and indigenous (Santa Helena)
- Gateway Type 2: for minorities, very recently arrived and low-income (MIO)
7. Conclusions
Author Contributions
Funding
Data Availability Statement
Acknowledgments
Conflicts of Interest
References
- ILO. Women and Men in the Informal Economy. A Statistical Picture. 2018. Available online: https://www.ilo.org/wcmsp5/groups/public/---dgreports/---dcomm/documents/publication/wcms_626831.pdf (accessed on 25 March 2022).
- Thulare, M.H.; Moyo, I.; Xulu, S. Systematic Review of Informal Urban Economies. Sustainability 2021, 13, 11414. [Google Scholar] [CrossRef]
- Chen, M.A. The Informal Economy: Definitions, Theories and Policies; WIEGO Working Paper; WIEGO: Manchester, UK, 2012; Volume 1, No. 26, pp. 90141–90144. [Google Scholar]
- Banks, N.; Lombard, M.; Mitlin, D. Urban Informality as a Site of Critical Analysis. J. Dev. Stud. 2019, 56, 223–238. [Google Scholar] [CrossRef] [Green Version]
- Recchi, S. Informal street vending: A comparative literature review. Int. J. Sociol. Soc. Policy 2020, 41, 805–825. [Google Scholar] [CrossRef]
- Adama, O. Abuja is not for the poor: Street vending and the politics of public space. Geoforum 2020, 109, 14–23. [Google Scholar] [CrossRef]
- Young, G. De-democratisation and the rights of street vendors in Kampala, Uganda. Int. J. Hum. Rights 2018, 22, 1007–1029. [Google Scholar] [CrossRef]
- Cuvi, J. The politics of field destruction and the survival of São Paulo’s street vendors. Soc. Probl. 2016, 63, 395–412. [Google Scholar] [CrossRef] [Green Version]
- Martínez, L.; Short, J.R.; Estrada, D. The diversity of the street vending: A case study of street vending in Cali. Cities 2018, 79, 18–25. [Google Scholar] [CrossRef]
- CEPAL. Perspectivas Económicas de América Latina 2019: Desarrollo en Transición; CEPAL: Santiago, Chile, 2019. [Google Scholar]
- ILO. COVID-19 Crisis and the Informal Economy Immediate Responses and Policy Challenges. ILO Brief, May 2020. Available online: https://www.ilo.org/wcmsp5/groups/public/---ed_protect/---protrav/---travail/documents/briefingnote/wcms_743623.pdf (accessed on 30 November 2020).
- Clement, C. The Formal-Informal Economy Dualism in a Retrospective of Economic Thought Since the 1940s (No. 43/2015); Schriftenreihe des Promotionsschwerpunkts Globalisierung und Beschäftigung; University of Hohenheim: Stuttgart, Germany, 2015. [Google Scholar]
- Potts, D. The state and the informal in sub-Saharan African urban economies: Revisiting debates on dualism. Crisis States Work. Pap. Ser. 2007, 2, 1749–1800. [Google Scholar]
- Roberts, A. Peripheral accumulation in the world economy: A cross-national analysis of the informal economy. Int. J. Comp. Sociol. 2013, 54, 420–444. [Google Scholar] [CrossRef] [Green Version]
- Godfrey, P.C. Toward a theory of the informal economy. Acad. Manag. Ann. 2011, 5, 231–277. [Google Scholar] [CrossRef]
- De Soto, H. The Mystery of Capital: Why Capitalism Triumphs in the West and Fails Everywhere Else; Basic Books: New York, NY, USA, 2000. [Google Scholar]
- Hammer, A. Comparative capitalism and emerging economies: Formal-informal economy interlockages and implications for institutional analysis. Rev. Int. Political Econ. 2019, 26, 337–360. [Google Scholar] [CrossRef]
- DNP (Departamento Nacional de Planeación) Política de formalización empresarial—CONPES 3956. Departamento Nacional de Planeación. 2019. Available online: https://colaboracion.dnp.gov.co/CDT/Conpes/Econ%C3%B3micos/3956.pdf (accessed on 19 March 2022).
- Vanek, J.; Chen, M.A.; Carré, F.; Heintz, J.; Hussmanns, R. Statistics on the informal economy: Definitions, regional estimates and challenges. In Women in Informal Employment: Globalizing and Organizing (WIEGO) Working Paper (Statistics); Globalizing and Organizing (WIEGO): Manchester, UK, 2014; Volume 2, pp. 47–59. [Google Scholar]
- Joshi, A.; Prichard, W.; Heady, C. Taxing the Informal Economy: The Current State of Knowledge and Agendas for Future Research. J. Dev. Stud. 2014, 50, 1325–1347. [Google Scholar] [CrossRef] [Green Version]
- Chen, M.A. The informal economy: Recent trends, future directions. New Solut. A J. Environ. Occup. Health Policy 2016, 26, 155–172. [Google Scholar] [CrossRef]
- Brown, A. (Ed.) Rebel Streets and the Informal Economy: Street Trade and the Law; Taylor & Francis: Oxfordshire, UK, 2017. [Google Scholar]
- Bonnet, F.; Vanek, J.; Chen, M. Women and Men in the Informal Economy: A Statistical Brief; International Labour Office: Geneva, Switzerland, 2019; Available online: https://www.google.com.hk/url?sa=t&rct=j&q=&esrc=s&source=web&cd=&cad=rja&uact=8&ved=2ahUKEwiXjJbwsKn4AhUoqlYBHVqJCCsQFnoECAcQAQ&url=https%3A%2F%2Fwww.ilo.org%2Fwcmsp5%2Fgroups%2Fpublic%2F---ed_protect%2F---protrav%2F---travail%2Fdocuments%2Fpublication%2Fwcms_711798.pdf&usg=AOvVaw3j65OhgjxrTSswaWc4i6as (accessed on 1 May 2022).
- UNHCR. The Un Refugee Agency. Refugee Data Finder. 2021. Available online: https://www.unhcr.org/refugee-statistics/ (accessed on 1 May 2022).
- Betts, A.; Bloom, L.; Kaplan, J.D.; Omata, N. Refugee Economies: Forced Displacement and Development; Oxford University Press: Oxford, UK, 2017. [Google Scholar]
- Arango, J.; Baldwin-Edwards, M. Immigrants and the Informal Economy in Southern Europe; Routledge: Oxfordshire, UK, 2014. [Google Scholar]
- Williams, C.C. Spatial variations in the hidden enterprise culture: Some lessons from England. Entrep. Reg. Dev. 2010, 22, 403–423. [Google Scholar] [CrossRef]
- Williams, C.; Round, J. Spatial variations in the character of off-the-books entrepreneurship: Lessons from a study of contrasting districts in Moscow. Int. J. Entrep. Small Bus. 2010, 10, 287. [Google Scholar] [CrossRef]
- Sharma, S.; Bose, A.; Shekhar, H.; Pathania, R. Strategy for Financial Inclusion of Informal Economy Workers (No. 374); Working Paper; Indian Council for Research on International Economic Relations (ICRIER): New Delhi, India, 2019. [Google Scholar]
- Sil, N. Research Perspectives on Financial Inclusion for Inclusive Growth in India. Asian J. Econ. Financ. Manag. 2020, 2, 140–161. [Google Scholar]
- Koku, P.S. Financial exclusion of the poor: A literature review. Int. J. Bank Mark. 2015, 33, 654–668. [Google Scholar] [CrossRef]
- Chen, M.; Beard, V.A. Including the Excluded: Supporting Informal Workers for More Equal and Productive Cities in the Global South, 2018. Available online: https://files.wri.org/d8/s3fs-public/towards-more-equal-city-including-the-excluded_2.pdf (accessed on 1 May 2022).
- Chirisa, I. The geography of informal sector operations (ISOs): A perspective of urban Zimbabwe. J. Geogr. Reg. Plan. Lagos Niger. 2009, 2, 066–079. [Google Scholar]
- Claessens, S. Access to Financial Services: A Review of the Issues and Public Policy Objectives. World Bank Res. Obs. 2006, 21, 207–240. [Google Scholar] [CrossRef] [Green Version]
- Kim, J.-H. A Study on the Effect of Financial Inclusion on the Relationship Between Income Inequality and Economic Growth. Emerg. Mark. Financ. Trade 2015, 52, 498–512. [Google Scholar] [CrossRef]
- Han, R.; Melecky, M. Financial Inclusion for Financial Stability: Access to Bank Deposits and the Growth of Deposits in the Global Financial Crisis. World bank policy research working paper; 2013; Policy Research Working Paper 6577. Available online: https://www.google.com.hk/url?sa=t&rct=j&q=&esrc=s&source=web&cd=&cad=rja&uact=8&ved=2ahUKEwi5sdWwsqn4AhUPxZQKHcV-Ba0QFnoECAsQAQ&url=https%3A%2F%2Fdocuments1.worldbank.org%2Fcurated%2Fen%2F850681468325448388%2Fpdf%2FWPS6577.pdf&usg=AOvVaw0Vv2Oxt5JL9WbmHjljNQLz (accessed on 1 May 2022).
- Achugamonu, U.B.; Adetiloye, K.A.; Adegbite, E.O.; Babajide, A.A.; Akintola, F.A. Financial exclusion of bankable adults: Implication on financial inclusive growth among twenty-seven SSA countries. Cogent Soc. Sci. 2020, 6, 1730046. [Google Scholar] [CrossRef]
- Olloqui, F.; Andrade, G.; Herrera, D. Inclusión Financiare en América Latina y el Caribe: Coyuntura Actual y Desafíos para lo Próximos Años; Documento de Discusión N. IDB-DP-385; Banco Interamericano de Desarrollo: Washington, DC, USA, 2015. [Google Scholar]
- Miled, K.B.H.; Rejeb, J.E.B. Microfinance and poverty reduction: A review and synthesis of empirical evidence. Procedia-Soc. Behav. Sci. 2015, 195, 705–712. [Google Scholar] [CrossRef] [Green Version]
- Banerjee, A.; Duflo, E.; Glennerster, R.; Kinnan, C. The Miracle of Microfinance? Evidence from a Randomized Evaluation. Am. Econ. J. Appl. Econ. 2015, 7, 22–53. [Google Scholar] [CrossRef] [Green Version]
- Swain, R.B. The Microfinance Impact; Routledge: London, UK, 2013. [Google Scholar] [CrossRef]
- Kar, A.K.; Swain, R.B. Interest Rates and Financial Performance of Microfinance Institutions: Recent Global Evidence. Eur. J. Dev. Res. 2013, 26, 87–106. [Google Scholar] [CrossRef]
- Guha, B.; Chowdhury, P.R. Micro-finance competition: Motivated micro-lenders, double-dipping and default. J. Dev. Econ. 2013, 105, 86–102. [Google Scholar] [CrossRef] [Green Version]
- Mallick, D. Microfinance and Moneylender Interest Rate: Evidence from Bangladesh. World Dev. 2012, 40, 1181–1189. [Google Scholar] [CrossRef] [Green Version]
- Martinez, L.B.; Scherger, V.; Guercio, M.B.; Orazi, S. Evolution of Financial Inclusion in Latin America: Management Area: Business Economics. Acad. Rev. Latinoam. Adm. 2020, 33. [Google Scholar] [CrossRef]
- World Bank Universal Financial Access 2020. The World Bank. 2021. Available online: https://ufa.worldbank.org/en/ufa (accessed on 1 May 2022).
- Serrano-Cinca, C.; Gutiérrez-Nieto, B. Microfinance, the long tail and mission drift. Int. Bus. Rev. 2014, 23, 181–194. [Google Scholar] [CrossRef] [Green Version]
- Francis, K.E. Rollover, rollover: A behavioral law and economics analysis of the payday-loan industry. Tex. Law Rev. 2009, 88, 611. [Google Scholar]
- Acevedo, J.D.R.; Martínez, L. A Proposed Credit Risk Assessment for People at the Bottom of the Social Pyramid in Cali, Colombia. Rev. Eur. Stud. 2018, 10, 41. [Google Scholar] [CrossRef]
- Roever, S.; Skinner, C. Street vendors and cities. Environ. Urban. 2016, 28, 1–16. Available online: https://www.wiego.org/sites/default/files/publications/files/Roever-Skinner-streetvendors-cities-2016.pdf (accessed on 21 April 2022). [CrossRef] [Green Version]
- Anyidoho, N.A. Informal Economy Monitoring Study: Street Vendors in Accra, Ghana. 2013. Available online: http://ugspace.ug.edu.gh/handle/123456789/8579 (accessed on 13 March 2022).
- Batréau, Q.; Bonnet, F. Managed informality: Regulating street vendors in Bangkok. City Community 2016, 15, 29–43. Available online: https://journals.sagepub.com/doi/pdf/10.1111/cico.12150?casa_token (accessed on 1 May 2022). [CrossRef] [Green Version]
- Hermawati, R.; Paskarina, C. Arranging Street Vendors: A Study on Policy Management of Street Vendors in Bandung. In International Conference on Administrative Science (ICAS 2017); Atlantis Press: Paris, France, 2017; pp. 251–254. Available online: https://www.atlantis-press.com/proceedings/icas-17/25886494 (accessed on 7 March 2022).
- Husain, S.; Yasmin, S.; Islam, M.S. Assessment of the socioeconomic aspects of street vendors in dhaka city: Evidence from Bangladesh. Asian Soc. Sci. 2015, 11, 1. Available online: https://www.researchgate.net/profile/Shaiara-Husain/publication/282461932_Assessment_of_the_Socioeconomic_Aspects_of_Street_Vendors_in_Dhaka_City_Evidence_from_Bangladesh/links/56a71bfc08aeded22e363cba/Assessment-of-the-Socioeconomic-Aspects-of-Street-Vendors-in-Dhaka-City-Evidence-from-Bangladesh.pdf (accessed on 13 March 2022). [CrossRef]
- Crossa, V. Play for protest, protest for play: Artisan and vendors’ resistance to displacement in Mexico City. Antipode 2013, 45, 826–843. Available online: https://onlinelibrary.wiley.com/doi/pdf/10.1111/j.1467-8330.2012.01043.x?casa_token (accessed on 10 March 2022). [CrossRef]
- Xue, D.; Huang, G. Informality and the state’s ambivalence in the regulation of street vending in transforming Guangzhou, China. Geoforum 2015, 62, 156–165. Available online: https://www.sciencedirect.com/science/article/pii/S0016718515001074?casa_token (accessed on 1 May 2022). [CrossRef]
- Recio, R.B.; Gomez, J.E.A., Jr. Street vendors, their contested spaces, and the policy environment: A view from Caloocan, Metro Manila. Environ. Urban Asia 2013, 4, 173–190. Available online: https://journals.sagepub.com/doi/pdf/10.1177/0975425313477760?casa_token (accessed on 10 March 2022). [CrossRef]
- Steel, W.F.; Ujoranyi, T.D.; Owusu, G. Why evictions do not deter street traders: Case study in Accra, Ghana. Ghana Soc. Sci. J. 2014, 11, 52–76. [Google Scholar]
- Lyons, M.; Snoxell, S. Creating Urban Social Capital: Some Evidence from Informal Traders in Nairobi. Urban Stud. 2005, 42, 1077–1097. [Google Scholar] [CrossRef]
- Etzold, B. Selling in insecurity–living with violence: Eviction drives against street food vendors in Dhaka and the informal politics of exploitation. In Street Vending in the Neoliberal City: A Global Perspective on the Practices and Policies of a Marginalized Economy; Berghahn Books: New York, NY, USA, 2015; pp. 164–190. [Google Scholar]
- Williams, C.C.; Gurtoo, A. Evaluating competing theories of street entrepreneurship: Some lessons from a study of street vendors in Bangalore, India. Int. Entrep. Manag. J. 2012, 8, 391–409. [Google Scholar] [CrossRef]
- Donovan, M.G. Informal cities and the contestation of public space: The case of Bogotá’s street vendors, 1988—2003. Urban Stud. 2008, 45, 29–51. [Google Scholar] [CrossRef]
- DANE (National Administrative Department of Statistics). Estadísticas. Demografía y Población. 2018. Available online: https://www.dane.gov.co/index.php/estadisticas-por-tema/demografia-y-poblacion (accessed on 15 March 2022).
- Benítez, M. Propuestas de Política Pública para el Rescate Social y la Creación de Empleo en Cali; Working Paper; Fedesarrollo: Bogotá, Colombia, 2021. [Google Scholar]
- Cali Como Vamos. Informe Annual de Calidad de Vida; Cali Como Vamos: Cali, Colombia, 2020. [Google Scholar]
- Vilalta, C.J.; Castillo, J.G.; Torres, J.A. Violent Crime in Latin American Cities; Inter-American Development Bank: Washington, DC, USA, 2016. [Google Scholar]
- DANE (National Administrative Department of Statistics). Medición del Empleo Informal y Seguridad Social. 2015. Available online: http://www.dane.gov.co/files/investigaciones/boletines/ech/ech/bol_eje_informalidad_may_jul_15.pdf (accessed on 14 March 2022).
- Cámara de Comercio de Cali. Ritmo laboral. Reporte #62. 2020. Available online: https://www.ccc.org.co/wp-content/uploads/2020/06/Ritmo-Laboral-N62.pdf (accessed on 2 May 2022).
- El País La Fragilidad de una Ciudad Donde la Mitad de sus Trabajadores Son Informales. 2021. Available online: https://www.elpais.com.co/contenido-premium/la-mitad-de-los-calenos-que-trabajan-lo-hacen-en-la-informalidad.html (accessed on 2 May 2022).
- Martínez, L.; Short, J. The Informal Economy of Cities in the South. Int. J. Sustain. Dev. Plan. 2017, 12, 4. [Google Scholar]
- Alcaldía de Cali Informe General del Trabajo Georreferenciación de Vendedores Informales de Santiago de Cali; Radicado No.: 201941610600048024; Internal Report; Alcaldía de Cali: Cali, Colombia, 2019.
- Martinez, L.; Short, J.R.; Estrada, D. The urban informal economy: Street vendors in Cali, Colombia. Cities 2017, 66, 34–43. [Google Scholar] [CrossRef]
- Martinez, L.M.; Estrada, D. Street vending and informal economy: Survey data from Cali, Colombia. Data Brief. 2017, 14, 132–137. [Google Scholar] [CrossRef] [PubMed]
- Martinez, L.; Rivera-Acevedo, J.D. Debt portfolios of the poor: The case of street vendors in Cali, Colombia. Sustain. Cities Soc. 2018, 41, 120–125. [Google Scholar] [CrossRef]
- Martinez, L.M.; Rivera-Acevedo, J.D. Debt portfolios of street vendors: Survey data from Colombia. Data Brief. 2019, 24, 103714. [Google Scholar] [CrossRef]
- MIO & POLIS. Evaluation MIO Program Conditions of Informal Economy workers in Cali, Colombia. 2019; unpublished report. [Google Scholar]


| Study | Sample Size | Year | Research Methodology |
|---|---|---|---|
| Socioeconomic conditions of Downtown street vendors | 527 | 2014 | Quantitative—Detailed socioeconomic structured survey collected by trained pollsters. Informants where randomly selected and participation was voluntary. |
| Socioeconomic conditions of Santa Helena Market street vendors | 112 | 2016 | Quantitative—Detailed socioeconomic structured survey collected by trained pollsters. Informants where randomly selected and participation was voluntary. Qualitative—In depth interviews with street vendors in the area |
| Financial inclusion of street vendors from Downtown and Santa Helena Market | 300 | 2016 | Quantitative—Detailed socioeconomic structured survey collected by trained pollsters. Informants where randomly selected and participation was voluntary. |
| Socioeconomic profile of informal workers in the Mass Transit System (MIO) in Cali | 589 | 2017 | Quantitative—Detailed socioeconomic structured survey collected by trained pollsters. Informal workers in the MIO system were asked to register and provide the information. |
| Variable | Downtown (%) | Santa Helena (%) | MIO (%) | Chi-Square | Significance |
|---|---|---|---|---|---|
| Women (%) | 47 | 52 | 43 | 3.2 | |
| High school or higher educational attainment (%) | 28 | 10 | 30 | 28.8 | *** |
| Civil status: marriage and cohabitation % | 54 | 47 | 48 | 4.5 | |
| Race: Black (%) | 23 | 32 | 26 | 15.8 | *** |
| Race: Indigenous (%) | 12 | 18 | 5 | 15.8 | *** |
| Street vendors with disability (%) | 6 | 8 | - | 0.4 | |
| Victim of armed conflict (%) | 14 | 23 | - | 5.5 | ** |
| Currently paying a loan (%) | 37 | 44 | 58 | 31.1 | *** |
| Household head (%) | 67 | 77 | 81 | 26.5 | *** |
| House ownership or paying mortgage (%) | 31 | 20 | 19 | 23.6 | *** |
| Informal sales provides enough resources needed to live (%) | 66 | 63 | 46 | 49.4 | *** |
| Comparison 1 | Comparison 2 | Comparison 3 | |||||
|---|---|---|---|---|---|---|---|
| Variable | Statistics | Downtown | Santa Helena | MIO | Santa Helena | MIO | Downtown |
| Average age (years) | Mean | 41 | 50 | 43 | 50 | 43 | 41 |
| SD | 15.9 | 15.3 | 15.7 | ||||
| CI | [41.3, 43.8] | [43.1, 45.3] | [41.1, 43.0] | ||||
| Significance | *** | *** | ** | ||||
| Average number of children | Mean | 3 | 3 | 2 | 3 | 2 | 3 |
| SD | 1.9 | 1.6 | 1.7 | ||||
| CI | [2.7, 3.1] | [2.5, 2.7] | [2.6, 2.8] | ||||
| Significance | * | *** | |||||
| Average monthly sales ($USD) * | Mean | 1041 | 1851 | 442 | 1851 | 442 | 1041 |
| SD | 1344 | 1078 | 882 | ||||
| CI | [1067, 1278] | [543, 714] | [663, 771] | ||||
| Significance | *** | *** | *** | ||||
| Average monthly profit ($USD) * | Mean | 297 | 382 | 198 | 382 | 198 | 297 |
| SD | 429 | 845 | 681 | ||||
| CI | [313, 381] | [193, 326] | [230, 313] | ||||
| Significance | *** | *** | ** | ||||
| Daily hours of work (hours) | Mean | 10, 7 | 10, 0 | 7, 5 | 10, 0 | 8, 9 | 9, 3 |
| SD | 2.4 | 2.9 | 2.9 | ||||
| CI | [10.5, 10.8] | [7.8, 8.2] | [7.8, 8.2] | ||||
| Significance | ** | *** | *** | ||||
| Days worked by week (days) | Mean | 7 | 6 | - | 6 | - | 7 |
| SD | 1 | - | - | ||||
| CI | [6.5, 6.6] | - | - | ||||
| Significance | *** | - | - | ||||
| Age of first child | Mean | 21 | 22 | 22 | 22 | 22 | 21 |
| SD | 5.3 | 6.1 | 5.8 | ||||
| CI | [20.7, 21.7] | [21.3, 22.4] | [21.1, 21.9] | ||||
| Significance | ** | ||||||
| Lender | Downtown | Santa Helena | MIO | |
|---|---|---|---|---|
| Currently paying a loan (%) | 37 | 44 | 58 | |
| Interest rate, lenders, and re-payment time | ||||
| Average monthly interest rate (%) | Family | 0 | - | 2 |
| Friend | 10 | 10 | 0 | |
| Bank | 3.8 | 2.3 | 3 | |
| Micro-finance institution | 2.7 | 2.3 | 2 | |
| Payday lenders | 19.9 | 20.5 | 23 | |
| Indebtedness by lender type (%) | Family | 5 | 0 | 6 |
| Friend | 4 | 4 | 8 | |
| Bank | 30 | 13 | 28 | |
| Micro-finance institution | 25 | 22 | 9 | |
| Payday lenders | 44 | 61 | 47 | |
| Average time for credit re-payment (months) | / | 13.9 | 9.7 | 4.3 |
| Centro | Lili | Menga | Calima | Andres Sanin | Aguablanca | Cañaveralejo | Calipso | |
|---|---|---|---|---|---|---|---|---|
| Number of bus stations by zone | 14 | 4 | 6 | 7 | 8 | 1 | 10 | 4 |
| Informal workers by zones (%) | 19 | 21 | 8.9 | 7 | 11.3 | 0.7 | 27.1 | 4.6 |
| Women (%) | 46.6 | 43.1 | 47.9 | 47.3 | 45.1 | 25 | 39.1 | 44 |
| Average age (years) | 44.5 | 43.5 | 44.5 | 43.3 | 41.7 | 51.2 | 41.4 | 44.3 |
| Average years of schooling | 7.1 | 7 | 7.1 | 6.9 | 6.8 | 4.6 | 6.8 | 7.3 |
| Ethnic minority (%) | 33 | 35 | 26 | 17.9 | 34.9 | 25 | 31.3 | 26.9 |
| Average years of schooling—father | 4.8 | 4.7 | 3.8 | 5 | 4.3 | 3.5 | 4.5 | 6.7 |
| Average years of schooling—mother | 4.9 | 4.5 | 3.8 | 5.2 | 4.2 | 4 | 4.1 | 4.3 |
| Handicap or illness (%) | 34.2 | 41.3 | 42.8 | 39.4 | 41.2 | 75 | 34.4 | 42.3 |
| Other family member working on informal sales (%) | 30.6 | 34.2 | 23.9 | 37.1 | 22.9 | 50 | 40.4 | 38.4 |
| Beneficiary of government welfare programs (%) | 23.4 | 18.7 | 26 | 29.4 | 25.9 | 25 | 14.7 | 18.1 |
| Centro | Lili | Menga | Calima | Andres Sanin | Aguablanca | Cañaveralejo | Calipso | |
|---|---|---|---|---|---|---|---|---|
| Average monthly sales ($USD) | 418 | 332 | 297 | 301 | 334 | 269 | 379 | 438 |
| Average monthly profit ($USD) | 149 | 147 | 145 | 158 | 131 | 134 | 145 | 172 |
| Informal sales provides enough resources needed to live (%) | 50.5 | 43.6 | 37.7 | 60 | 49.1 | 25 | 44.7 | 52.1 |
| Currently paying a debt (%) | 64.4 | 55 | 52.9 | 52.6 | 54.2 | - | 60 | 38.4 |
| Debt with payday lender (%) | 38.3 | 42.8 | 61.1 | 47.3 | 40 | - | 53.2 | 53.8 |
| Difficulty re-paying debts (%) | 51.8 | 46.9 | 36 | 24.3 | 35 | 75 | 36.3 | 26.9 |
| Percentage of the last debt instalment over profit (%) | 27.2 | 16 | 18 | 21.3 | 17.6 | - | 154 | 17.6 |
Publisher’s Note: MDPI stays neutral with regard to jurisdictional claims in published maps and institutional affiliations. |
© 2022 by the authors. Licensee MDPI, Basel, Switzerland. This article is an open access article distributed under the terms and conditions of the Creative Commons Attribution (CC BY) license (https://creativecommons.org/licenses/by/4.0/).
Share and Cite
Martínez, L.; Short, J.R. The Informal City: Exploring the Variety of the Street Vending Economy. Sustainability 2022, 14, 7213. https://doi.org/10.3390/su14127213
Martínez L, Short JR. The Informal City: Exploring the Variety of the Street Vending Economy. Sustainability. 2022; 14(12):7213. https://doi.org/10.3390/su14127213
Chicago/Turabian StyleMartínez, Lina, and John Rennie Short. 2022. "The Informal City: Exploring the Variety of the Street Vending Economy" Sustainability 14, no. 12: 7213. https://doi.org/10.3390/su14127213
APA StyleMartínez, L., & Short, J. R. (2022). The Informal City: Exploring the Variety of the Street Vending Economy. Sustainability, 14(12), 7213. https://doi.org/10.3390/su14127213