1. Introduction
The informal economy is a ubiquitous characteristic of the global south. The International Labor Organization (ILO) estimates that over two billion people work in the informal economy, around 60% of the world’s total employed population [
1]. The sector provides employment and livelihoods for many of the world’s workers. In many countries in the global south (broadly refers to the regions of Latin America, Asia, Africa, and Oceania), at least one out of every two jobs in cities are in the informal sector [
1]. The urban informal economy is a broad concept that refers to economic practices excluded from formal structures or regulations [
2]. Despite the wide range of concepts that
informally may refer to, there is a distinction between the informal sector, formal employment, and the formal economy. The informal sector covers the activity of unregistered enterprises, informal employment refers to employment that is not legally protected or socially regulated, and the informal economy refers to the activities and outputs of all the activities and workers in the sector [
3]. In this analysis, we focus on the informal economy.
The informal economy is predominantly characteristic of urban settlements [
4], particularly in Latin America, where the massive rural–urban migration has resulted in the inability of the formal sector to absorb the newcomers in expanding cities [
2]. The urban informal economy takes various forms, including employment arrangements, types, activities, and outcomes. Amongst the informal activities, street vending is one of the most visible manifestations, and it has significant importance in urban planning and the use of public space.
Generally speaking, we know little about street vending dynamics and workers’ characteristics in the global south. Most of the information comes from qualitative studies focusing on segmented areas in one city [
5]. There are few quantitative studies about the dynamics and socioeconomic conditions of street vendors. There is a lack of official statistics, and for researchers, it is difficult to generate large sample sizes for a highly mobile population. Most previous studies are one-off individual case studies. Because of individual case studies’ restrictions, the informal sector and street vending dynamics are too often described as a singular category with invariable characteristics within the urban realm [
5,
6,
7,
8]. These research limitations hide the different types of multiple informal clusters than can be formed across the geography of one city.
This analysis seeks to bridge the information gap in the study of street vending by providing a quantitative analysis of three street vending sectors in one city in the global south. We use the information from five quantitative studies from 2014 to 2019 that collected information from over 11,000 street vendors in Cali, the third-largest city in Colombia. The data harmonization of the separate studies allows us to provide a detailed description of the dynamics and socioeconomic conditions of street vendors in the city.
Our research pursues two aims. The first is to detail the variety and segmentation of street vending in one city. Street vending is highly segmented, with different interactions with the formal economy, diverse types of sales and activities, uneven profits, and diverse socioeconomic composition of the workers. In a previous study in Cali, we showed the fragmentation of this sector [
9], comparing two sectors within the city with distinctive geographic and social characteristics: Downtown and Santa Helena Market. In this paper, we extend the analysis by looking at the socioeconomic conditions of informal workers in the city’s mass transit system (MIO). This new survey material allows us to compare three distinctive sectors and understand their differences, nuances, and interconnections with the formal sector. Our guiding research question is: how different are street vendors within one city? We use sociodemographic information, income, sales, and household ownership to answer this question.
Our second aim is to present in detail the financial resources of those in the informal sector who are, by and large, denied access to banks and formal lending institutions. We analyze informal workers’ indebtedness and the financial exclusion in the three clusters to discover which workers have the largest share of indebtedness, less access to the formal banking system, and greater reliance on illegal payday lenders.
We contribute to the literature by providing evidence of two aspects less studied within the area of the informal economy: the segmentation and the financial exclusion of informal workers in one city. Descriptively, this analysis provides evidence to analyze the segmentation of the informal sector across urban settings and explores the economic exclusion of informal workers. Analytically, this research contributes to studying the socioeconomic conditions of workers in the informal economy.
This paper is organized into seven sections. After this introduction, we present the background of this study, survey the overarching themes in which the informal economy is studied, and focus on spatial segmentation and financial exclusion. The third section presents the city context, followed by a detailed presentation of data and methods. Section five presents the results. The final section discusses the results and presents its policy implications. Lastly, we conclude with the study’s main findings.
2. General Background
2.1. The Study of the Informal Economy
The traditional economic textbooks of the 1950s and 1960s predicted that when low-income economies achieved economic take-off, they would be transformed into modern and dynamic economies, absorbing small-scale production and unregulated jobs [
3]. Since the 1950s, the world has experienced unprecedented growth. During the 1990s and the first decades of the 2000s, Latin America reduced poverty rates by half and increased GDP in the region’s largest share [
10]. However, the informal economy neither shrunk nor disappeared in the low-income countries nor even in higher-income economies; the informal sector employed 90% of the total workforce in low-income countries, 67% in middle-income, and 18% in high-income countries [
11]. Indeed, the informalization of employment relations often grew as new pathways emerged for the expansion of the informal economy across the world [
3].
As the informal economy grows and its complexities expand, researchers have increasingly studied the sector framing the research from two perspectives: theoretical and empirical studies. From the theoretical standpoint, there are four angles to approach the study of the informal economy: dualism, structuralism, legalism, and post-colonialism.
The dualist posits the distinction between the formal/informal economy. The roots of dualism are studies in 1940–1950 in which informality is intertwined with economic exclusion. This exclusion is a by-product of the institutional dualism frameworks that render marginalized social groups excluded from formal economic activities [
12]. Under this perspective, the informal economy is perceived as a peripheral sector, using traditional modes of production with low productivity [
13].
Structuralism argues for the strong links between the formal and informal sectors but relegates the informal sector to a marginal position in the world’s economy. The structuralism perspective focuses on the marginal role that plays the informal sector due to economic globalization and the unequal distribution of international trade [
14].
The legalist perspective builds its framework by discussing exclusionary institutional frameworks set by governments. Under this framework, the strong division between formal and informal sectors that characterize most of the institutional economic regulations in developing countries is considered to a great extent to explain the growing size of the informal sector in emerging economies. Legalists argue that legal frameworks create significant barriers to entering the formal economy, and all excluded from formality become a banned, peripheral, and often illegal sphere [
15,
16]
The post-colonialism posits greater emphasis on the geopolitical contexts in which informality plays a pivotal role in providing a livelihood to the excluded and vulnerable. Under this perspective, the different characteristics of informality, including the social and political context, legal attributes, and the region’s differences, are under consideration to study the informal sector and its connections. Another dimension associated with the post-colonialism framework emphasizes the social relations and social networks formed within the informal sector [
2]. The wide range of angles unveils the complexity of studying this sector, the overlapping definitions and concepts, and the lack of agreement on a unique construct.
This analysis uses the structuralist perspective to study the informal economy dynamics in Cali, Colombia. Many policy studies assume that formal and informal economies are two distinctive spheres, often with the corresponding perspective that the informal sector should be reduced and controlled [
17]. However, in many developing countries, the formal and informal sectors are treated differently in regulatory frameworks. Take as an example the case of Colombia, in which formal and informal are considered separate entities, and government efforts are concentrated on stimulating the formal sector [
18]. However, in reality, the informal sector is not a separate entity, the borderline with the formal sector is liminal, and there are clear links between the informal and formal economy. The informal economy contributes to the overall economy by employing those excluded from formal employment who pay indirect taxes through consumption. The relations between the formal and informal sectors provide mutual benefits; sometimes, informal workers buy their goods from the formal sector. Informal sellers can provide pedestrian traffic and safety, benefiting formal commerce [
19,
20].
The other strand of research on the informal economy comes from empirical studies primarily focused on the dynamics and composition of the informal economy and its contribution to the overall economy and the livelihood of the most vulnerable. Empirical studies contribute to a wide range of aspects, from social policy and poverty [
21] to the political aspects of public space occupation [
22].
One of the most studied empirical dimensions of the informal economy is related to gender differences and the informal economy as a resort for the poorest. In terms of gender, the research points to the inequalities in the labor force and the high prevalence of women in the informal economy [
23]. Women in some regions represent the largest share of informal employment, especially in south Asia, Africa, and Latin America, where women are primarily employed in the informal sector of services and commerce [
19]. In developed economies, women tend to be overrepresented in the informal sector in occupations falling under the non-standard employment label, such as caregivers, services, cleaning, or self-employment [
23].
Another strand of empirical research on the informal economy refers to the informal sector as the resort for the poorest, the most vulnerable, and the newcomers. Recently displaced and newcomers to the urban economy often figure largely in the informal sector. According to the UN Refugee Agency, in 2021, there were 82.4 million displaced people worldwide [
24]. An increasing number of refugees are forced to move to urban areas to find the means to make a livelihood in the absence of government resources to accommodate refugees and provide social assistance [
25]. The urban informal economy can provide economic opportunities to the poor, the displaced, and those excluded from formal economic structures [
26].
2.2. Spatial Segmentation and Financial Inclusion
There are two additional empirical research fronts on the informal economy study: the informal sector’s spatial segmentation and the indebtedness and financial exclusion of informal workers. The spatial segmentation perspective is rarely studied [
27,
28], or at least is less common than the research on the sociodemographic characteristics of informal workers. The financial exclusion perspective has a larger body of research [
29,
30,
31], mostly centered on the mechanisms to help the poor move out of poverty or government interventions since financial inclusion is a crucial enabler for economic growth [
29].
In terms of spatial segmentation, there are some studies that focus on the spatial variation in the type of trading within the informal sectors, comparing, for instance, affluent and deprived neighborhoods. Findings from Moscow show that, in general, business in affluent districts is conducted partially off-the-books, a form of informality designed to avoid taxation and regulation, while in deprived areas, the informal economy is a survival tactic and a last resort for income generation [
28]. In the UK, researchers report that while informal trade is prevalent in deprived and rural areas, early-stage entrepreneurs and established self-employed in more affluent areas also trade off the books frequently [
27]. Home-based workers also produce a range of goods (textiles, garments, food) and then sell those goods across convenient locations in the city and on the internet. Urban space is bound together by informal–formal linkages. Waste pickers, for example, who live in the most deprived areas do most of their informal work in affluent districts where most people earn their income in the formal sector [
32]. The informal sector also varies in the way it operates. The location, the operator composition, the type of internal organization, services, and values change geographically [
33]. The fragmentation of the informal sector is highly visible in the study of street vending. Informal sellers undertake activities moving across the city, changing locations throughout the working day [
5], making this informal sector highly variable and segmented.
The evidence regarding financial inclusion shows proven links between economic development and access to financial services [
34]. Financial inclusion refers to working-age individuals’ opportunity to access credit, savings, payments, and insurance from regulated financial providers [
35]. Financial exclusion, in contrast, occurs when workers are denied the opportunity to participate in regulated schemes or face insurmountable barriers to accessing financial services. The financial exclusion exacerbates inequalities and makes it costlier for those outside regulated financial markets to access credit and durable goods [
36]. The largest share of the population excluded or with large barriers to access to regulated financial markets are mostly living in poor and developing countries [
37]. In Latin America, for example, half of the adult population is excluded from the financial system. One of the significant challenges to increasing the financial inclusion, in particular, for the population excluded from the formal employment, is the high operational costs to provide financial services to a population excluded from official records, the low financial capacities of the informal workers, and the absence of financial products that fit the financial needs and education of a population with low educational attainment [
38].
Universal access to financial services is not a public policy goal in many developing countries [
34]. In the absence of policy, interventions to provide alternatives for the financially excluded, and the need of many to access credit, microfinance institutions (MFIs) have grown significantly over the past decades [
39]. MFIs not only provide access to credit to a large excluded population but have the potential to help eradicate poverty, improve education and increase women’s empowerment [
40]. The literature offers mixed results regarding the benefits of MFIs. Some researchers find positive associations between MFI access and poverty reduction and quality of life [
39,
41]. Others argue that MFIs charge high-interest rates, generating a poverty trap since borrowers tend to take multiple loans to cover an increasing indebtedness [
42,
43,
44].
Despite the expansion of MFIs across the global south and the important growth in the use of financial instruments in Latin America [
45], the financial exclusion of the poor continues to be a significant problem [
31]. By 2017 there were 1.7 billion unbanked adults worldwide, representing 31% of the adult population. Two-thirds of unbanked adults cite lack of money as the main reason to access financial services, implying that financial services are not affordable for the poor [
46]. Traditional financial institutions opt to grant loans to borrowers with a low-risk profile and lower transaction costs. Informal workers still represent a higher risk, lower revenues, and higher costs of processing small loans that are not attractive to financial institutions [
47].
In the absence of accessible financial services, informal workers, the poor, and all excluded from the banking system need to use the payday loan industry to access credit and cash to support external shocks of income reduction. Payday loans are generally short-term credit of small amounts at extremely high interest rates [
48]. Despite the predatory rates charged by money lenders, they are more convenient than MFIs regarding accessibility and cash flow and do not ask for paperwork and evidence of employment [
49]. The convenience, accessibility, and inability to access regulated financial services make the payday loans often the only resort for informal workers to access credit, creating another type of vulnerability.
In this paper, we contribute to the literature by analyzing the financial inclusion of three different groups of informal workers within one city.
2.3. Research on the Informal Economy and Street Vending
Street vending is one of the more significant manifestations of the informal economy. Roever and Skinner [
50] suggest that street vendors as a percentage of total non-agricultural informal employment ranges from as low as 26% in Hanoi, Vietnam, to 44% in Lomé, Togo. Most of the studies of street vending are conducted in cities, focusing on neighborhoods or informal clusters across the city. There is a large number of case studies of street vending in cities across the world, including Abuja [
6], Accra [
51], Bangkok [
52], Bandung [
53], Dhaka [
54], Mexico City [
55], Guangzhou [
56], Kampala [
7], Manila [
57] and Sao Paulo [
8]. These individual surveys are important since we often lack good quality statistical information from official sources. Because of its informality, the informal sector is invisible to official data collection. However, these individual case studies too often take the form of one-off surveys in one particular area. Most of the studies are qualitative, using direct observations, interviews, or focus groups. To a lesser extent, researchers use a quantitative approach and surveys to collect information [
5]. Studies using surveys amongst street vendors in cities include Ghana [
58], Nairobi [
59], Dhaka [
60], Bangalore [
61], and Bogotá [
62].
3. City Context
Cali is one of the main cities in Colombia, third in the population with 2.4 million inhabitants [
63]. It has three distinctive characteristics: poverty, violence, and a high degree of informality.
By 2019, 26.6% of the urban population was classified as poor. By 2020, the number almost doubled, reaching 49.6% [
64]. The COVID-19 pandemic had significant consequences in Colombia. In 2020, overall households’ income was reduced by 11.8%. Amongst the most affluent households, income reduction was 9%, but in the most vulnerable households, income reduction was 34%. Cali experienced the more significant income contraction in the country. The average income reduction in the city was 24.4%, and amongst the poorest, incomes dipped by 61%. The significant income reduction in the city increased poverty rates. Cali now hosts displaced Venezuelans. The number of newcomers in the city is unknown, but it is estimated that by 2021 Colombia will host 1.7 million Venezuelans. Most of them are attracted to larger cities, such as Cali, because of the employment opportunities [
24].
Cali is also one of the most violent cities in the world. During the 1990s, as a legacy of drug trafficking, homicidal rates in the city were 100 homicides per 100,000 habitants. In the past five years until 2020, the indicator was relatively stable at about 50 homicides per 100,000 habitants [
65]. Despite the important reduction, Cali has twice the average homicide rates in Latin American cities (20 per 100,000 habitants) and is one of the largest in the world [
66].
4. Data and Methods
We present detailed information on street vendors in the three areas: Downtown, Santa Helena, and bus stations (MIO). The information for this analysis comes from detailed structured surveys conducted by POLIS, the Observatory of Public Policies of Universidad Icesi in Downtown, Santa Helena, and the mass transit system (MIO), hereafter referred to as MIO. We adopted survey methodology following previous studies in the informal economy sector [
58,
59,
60,
61,
62].
Data on street vendors in Downtown was collected in 2014 by trained pollsters. A structured survey was used to gather information about socioeconomic status, family composition, income, education, access to welfare, and reasons for becoming a street vendor. In total, 527 vendors were randomly selected from the 13 blocks covering the informal sales in the area. Vendors participated voluntarily, no personal information was collected, and pollsters explained the academic purpose of the study. More information about this study is presented in [
9,
72,
73].
Data for Santa Helena Market comes from a survey undertaken in 2016 using the same questionnaire used in the Downtown survey. Santa Helena is the largest open food market in the city, and 112 street vendors participated through face-to-face interviews with trained pollsters. They were assured confidentiality. Study details, methods, questionaries’ and data availability are presented in [
9,
73].
In 2016, an additional survey was collected in Downtown and Santa Helena. This survey was designed to collect information about indebtedness and financial inclusion. The data collected previously in Downtown and Santa Helena suggested a high rate of indebtedness and penetration of illegal payday lenders as the only resort to access credit and cash flow to operate a business based on cash and daily investments. Thus, we decided to undertake follow-up surveys to explore this theme. A total of 300 vendors participated voluntarily, 250 in Downton and 50 in Santa Helena in surveys conducted by trained pollsters. Confidentiality was assured, and no personal information was requested. Details of this study are presented in [
74,
75].
In 2017 Metro Cali, the operator of the mass transit system (MIO), launched a program for organizing and controlling the increasing informal sales in the buses and stations of the mass transit system. The survey was designed by POLIS using the same survey format as in 2014 and 2016. Using the same methodology as previous years, 589 informal vendors were interviewed using a structured survey inquiring about socioeconomic conditions, family composition, income, health, access to welfare programs, indebtedness, and financial inclusion. Interviews were conducted by trained pollsters from Metro Cali.
Table 1 presents general characteristics of the surveys, sample size, and methodology.
We harmonized the available data (presented in
Table 1). We used descriptive statistics using Stata 14 to answer the guiding questions: (i) how different are street vendors within one city? and (ii) which workers present the largest share of indebtedness and access to illegal payday lenders to access credit in the three clusters analyzed? For categorical variables, a chi-square test of independence is presented for continuous variables. We create three groups to compare mean differences: comparison 1: Downtown workers vs. Santa Helena workers; comparison 2: MIO workers vs. Santa Helena workers; comparison 3: MIO workers vs. Downtown workers. This exercise shows statistical differences between the groups analyzed. We limit our analysis to a descriptive one, provided the nature of the research questions and their feasibility for discussion in policymaking. In the context cities in the global south, we are only scratching the surface of the dimension and dynamics of the informal economy. However, since there is so little descriptive information for fully understanding the informal economy’s dynamics in many cases, we present information about sociodemographic data, household composition, indebtedness, and credit access. We also present detailed information about income and profits reported by street vendors. Money values are standardized to 2017 values to make them comparable. We use average currency in 2021 (USD 1 = COP 3400) to present information about income and profits. Our analysis uses the same questions and data collection methods at each point of data collection to avoid errors in measurement. Our analysis follows the workflow presented in
Figure 3.
5. Results
5.1. Segmentation
Downtown, Santa Helena, and MIO are venues with different characteristics, and vendors in those sites also display marked differences (see
Table 2 and
Table 3).
Santa Helena is a food market that is crowded on market days and located close to an area with one of the highest crime rates in the city. Santa Helena has the largest share of women (52%) compared to MIO and Downtown workers. All workers are over 40-years-old, which represents a challenge for employment re-training and finding a job in the formal sector. A distinctive characteristic of Santa Helena workers is the high proportion of victims of the armed conflict. Many of them have migrated to the city as a consequence of internal displacement. As residents from rural areas, they have lower educational attainment. Workers in Santa Helena report the highest indebtedness rate (58%) and a lower proportion of homeownership or having a mortgage (19%). Santa Helena is the area with the largest minority population, with at least 50% self-identifying as indigenous or black.
Downtown is located in the middle of the largest formal economic hub of the city. Large firms, banks, and municipal offices have their headquarters located in Downtown. Street vendors sell their goods alongside banks and municipal offices, clothes, food, shoes, fresh fruits, cellphone minutes, candies, etc.
Informal workers at MIO come in two varieties: (i) those who work in the bus stations (outside and inside) and (ii) vendors on the buses. Those who work in the stations sell fruits, edibles, candies, and coloring books. The workers inside the buses also sell candies, and some of them are artists selling pieces of art. The most educated are working at MIO, with 30% having at least a high school experience. During the fieldwork, researchers identified a number of immigrants from Venezuela in the MIO system. They were newcomers to the city with relatively higher educational attainment (some of them were professionals) but unable to find employment in the formal sector. A large majority were married or living in co-habitation, with an average of two children. MIO has the lowest proportion of racial-minority workers (31%).
Larger sales and profits are reported in Santa Helena, followed by Downtown and lastly, and by a substantial difference, MIO. Few workers in the mass transit system have profits equivalent to a monthly minimum salary (about US294 by 2021), although they work on average fewer hours a day as compared to Downtown and Santa Helena workers. A lower percentage of MIO workers state that informal sales provide enough resources to live on.
A snapshot picture shows that Santa Helena is an established gateway for minorities, rural migrants displaced by conflict, and those with low educational qualifications. Downtown is a long-established sector for the longer-term residents with better qualifications and higher incomes. MIO workers have lower incomes than those in Santa Helena and Downtown. Informal workers in MIO work fewer hours as a function of the time-restricted nature of mass transit peak travel and also perhaps indicative of a part-time gig, just part of an ensemble of income generation schemes employed by the recently arrived. Translating the three sectors into standard categories used for the formal sector suggests higher income (Downtown), middle income (St Helena), and lower income (MIO)
5.2. Indebtedness of Street Vendors
Santa Helena and Downtown workers earn, on average, the same or higher salary than the average citizen in the city (minimum salary) despite their lower educational attainment [
72]. However, informal workers are unable to capitalize on their relatively high incomes and escape a poverty trap because of a lack of low-interest loans. One of the main reasons explaining their inability to escape poverty and low accumulation of durable goods (i.e., a house) is the exclusion from borrowing opportunities from regulated financial markets [
74].
Informal workers are unable to use regulated financial markets. In Colombia, to open a savings account or access credit services, users have to show proof of employment or provide support for a steady income. Moreover, to open a bank account, borrowers need to provide an initial deposit, which then is used to cover monthly fees for the maintenance of a saving account in case users do not make transactions during the month [
49,
74].
The information on street vendors in Cali provides a picture of the exclusion of the most marginal and vulnerable. MIO workers report having a higher rate of indebtedness; 58% were paying a loan at the moment of the survey, followed by Santa Helena workers (44%) and Downtown (37%). Microfinance institutions are used by the more “established” workers at Downtown, with 25% of workers with access to this credit source. Only 9% of MIO workers have access to micro-finance credit. Payday lenders (locally known as gota-gota) are the most used mechanism for access to credit. Santa Helena uses payday lenders the most, with 61% of street vendors using gota-gota, 47% of MIO workers, and 44% of Downtown workers, interest rates of these payday lenders are predatory, charging approximately 20% per month.
Table 4 presents the information about indebtedness, lenders, and interest rates. No statistical test was performed, provided the reduction in the sample.
Informal networks such as family and friends are a source of resources and cash but this source is limited. Less than 6% of informal workers report having a loan with a family member and less than 8% with a friend. Monthly interest rates amongst family or friends range from 2 to 10%.
The more established Downtown workers have higher use of microfinance credit and a longer time to re-pay credits. On average, Downtown street vendors have 13.9 months to re-pay credits, whereas MIO workers only have about 4.3 months.
5.3. Workers at MIO
Informal workers at MIO, their socioeconomic characteristics, and the changing dynamic of selling in the buses make them a separate type of workers that deserve further exploration.
Informal workers in MIO are the most vulnerable. They also have to deal with more police harassment. There are many control points at the entry to stations and buses where police and drivers can impede vendors’ ability to sell. Each day represents a struggle to earn their income.
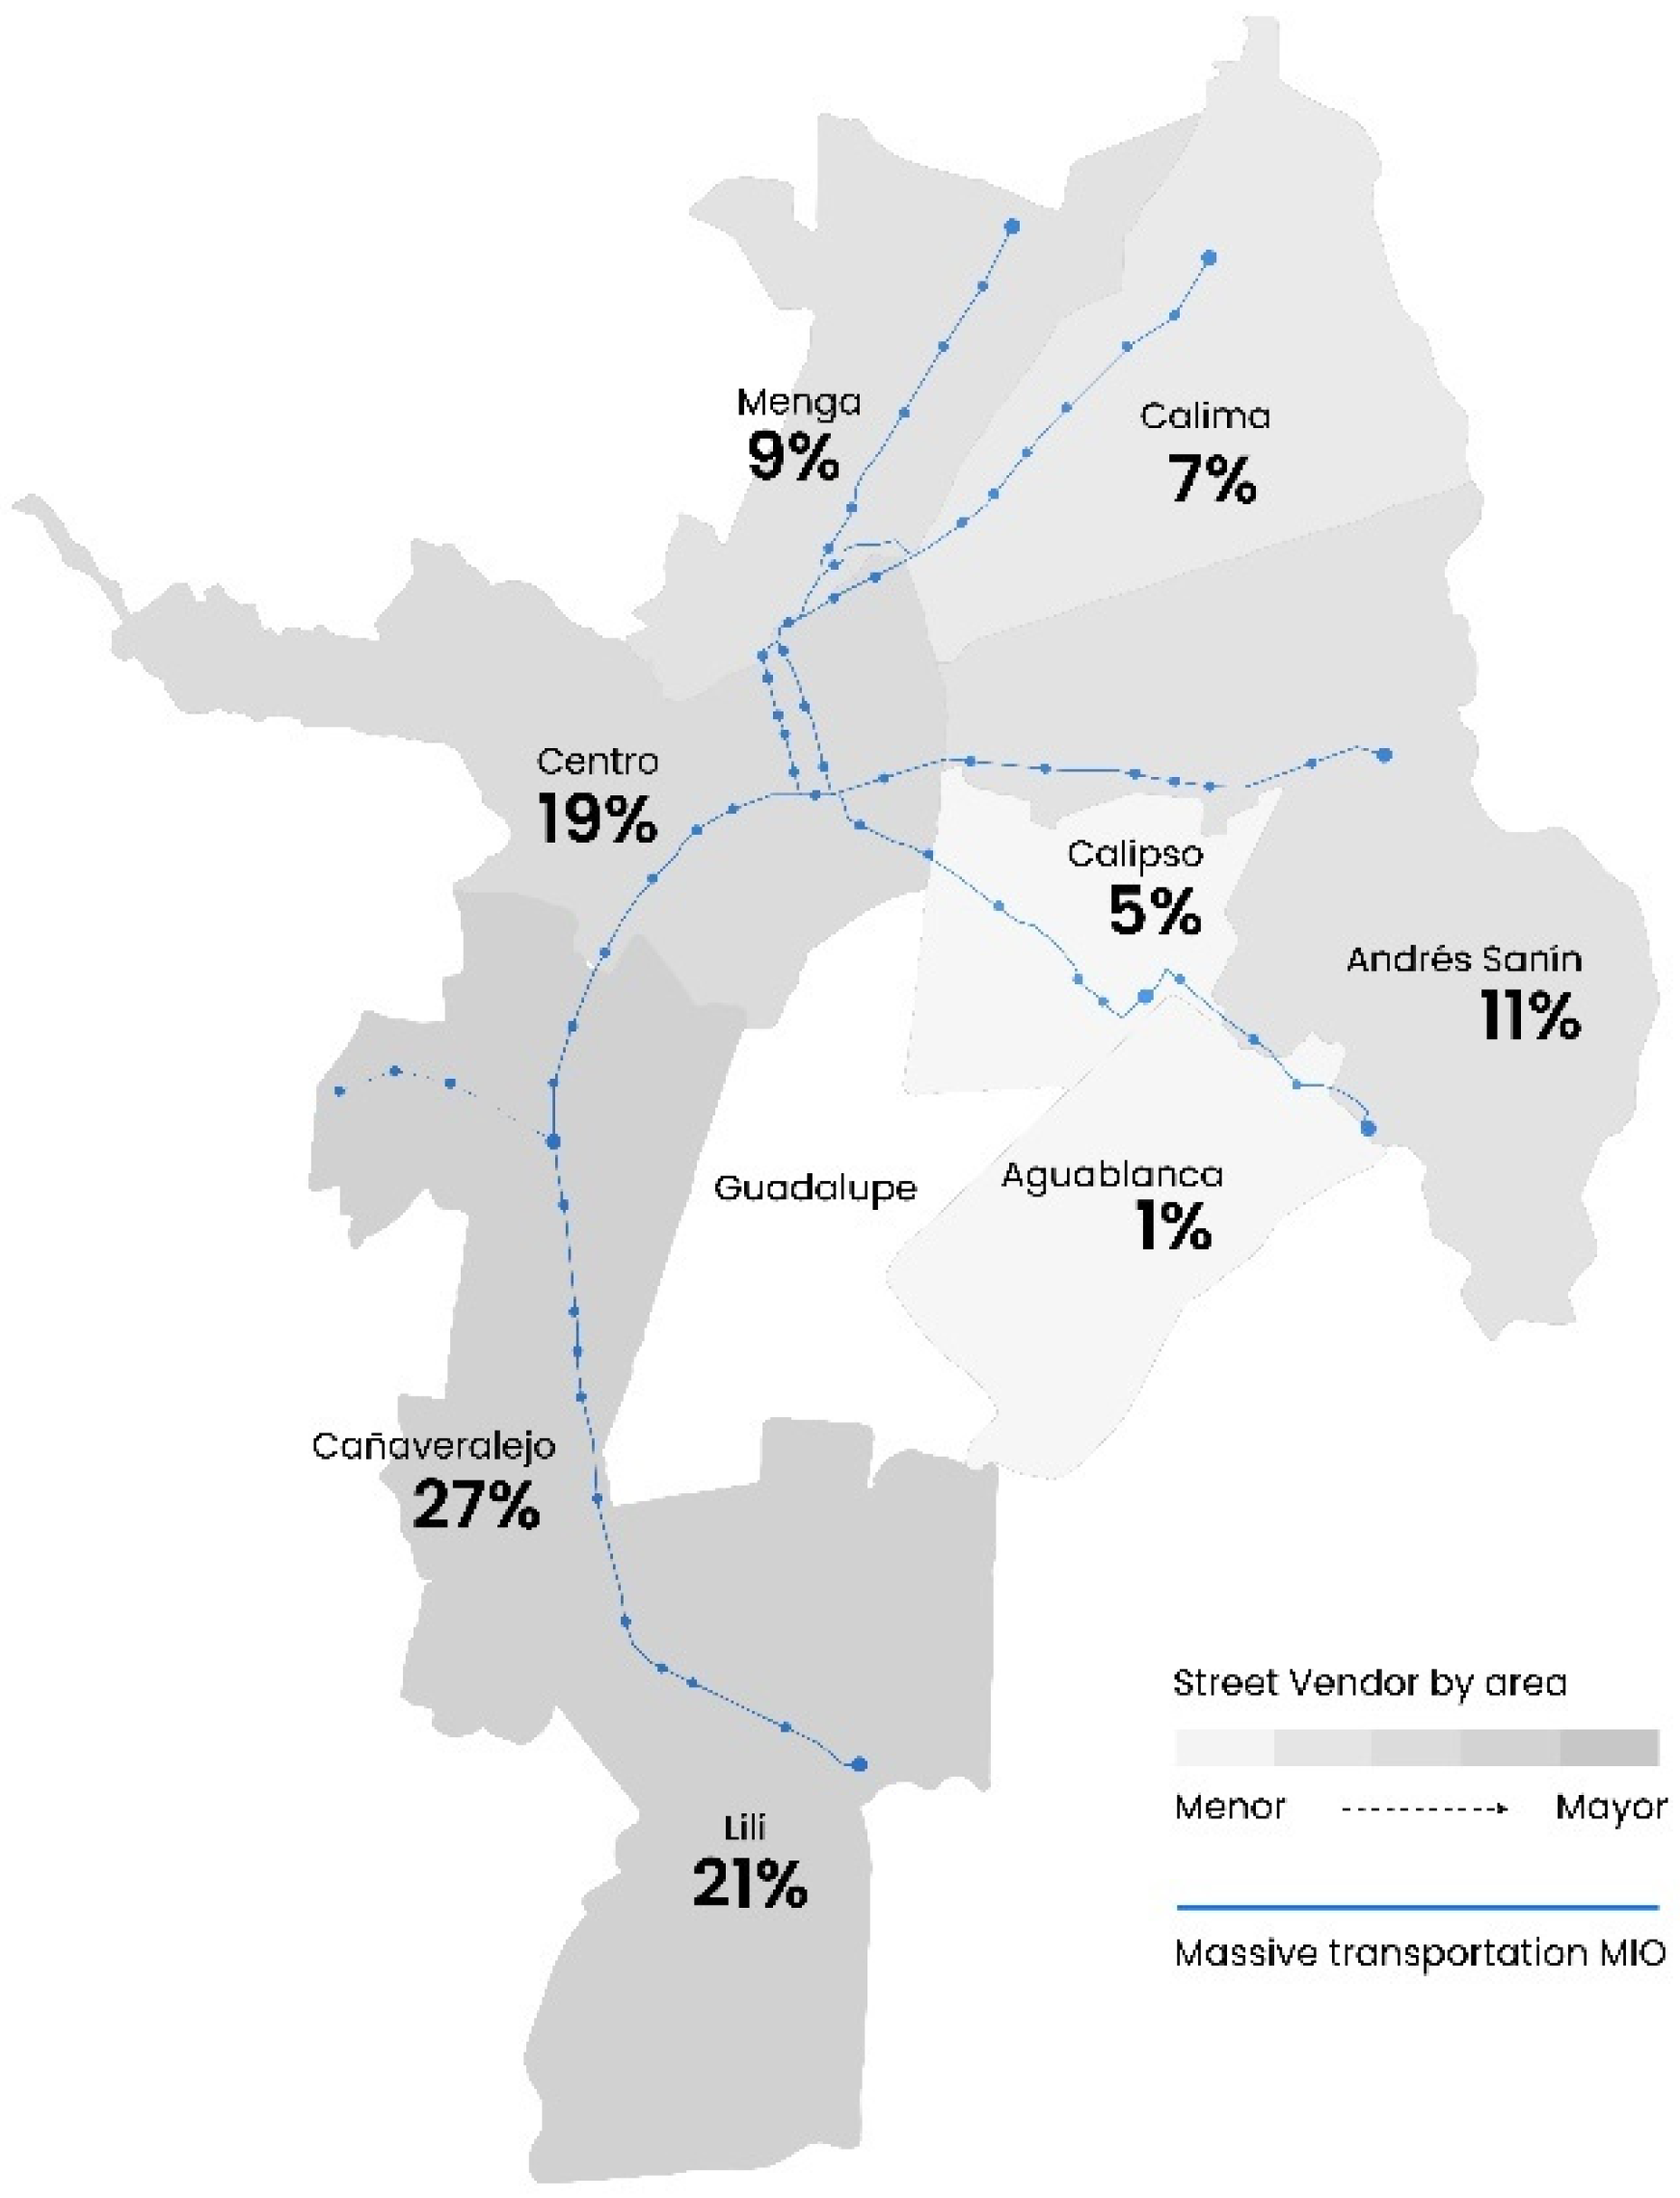
The mass transit bus system started its operation in the city in 2009. The system is currently divided into nine zones: Centro, Lili, Menga, Calima, Andrés Sanín, Aguablanca, Guadalupe, Cañaveralejo, and Calipso. In total, there are 54 bus stations. In 2017, 729 informal vendors were identified in the system through a headcount in the buses and bus stations by local authorities [
76].
Figure 4 presents the distribution of informal workers across the system. There is a larger concentration of informal workers in Cañaveralejo and Lili, where the larger stations are located. Centro is third, and Andrés Sanín reaches one of the areas of lower socioeconomic strata. Cañaveralejo and Lili are located in medium–high socioeconomic areas.
Table 5 presents information about the socioeconomic conditions of informal workers at MIO by bus zones. The participation of women across the bus station is about 45%. On average, informal workers are over 40 years old, with the average educational attainment as less than 7 years of schooling. Informal workers’ parents also had very low educational attainment, often only elementary school for both mother and father. Over 34% of informal workers report that other family member also works in street vending. This is a proxy for the low social mobility across generations in the city and the low probability that future generations of informal workers could escape from a poverty trap. About 25% belong to a minority (black or indigenous) population group. Over 30% declared to be handicapped or having a chronic illness. Despite their multiple vulnerabilities, less than 30% report being a beneficiary of a welfare program.
As presented in
Table 6, MIO workers report the lower sales and profit among all informal workers analyzed. The average monthly profit (USD 140) is less than half of the minimum wage, while a vendor in Santa Helena report about 20% above the minimum monthly wage. They barely make a living and have the largest proportion of household heads amongst informal workers. Their indebtedness rate is also the highest, with a higher penetration of payday lenders and many declaring having difficulties re-paying debts. On average, an MIO informal worker has to use 19% of their monthly profits to make the monthly re-payment installments.
Table 5 presents the results.
6. Discussion and Policy Implications
Our study contributes to the literature on two themes. First, our surveys over several years and conducted in different parts of the city show the granularity of street vending. This evidence adds to the literature on urban studies of the informal economy based on singular cities such as Accra [
51], Bandung [
53], Mexico City [
55], Guangzhou [
56], Kampala [
7], Manila [
57] and Sao Paulo [
8]. We also provide new elements to studying variation across the informal sector based on location and services [
33].
A second theme is the importance of access to credit. Similar to most of the literature available on the financial exclusion of informal workers [
31,
36,
46], we report the significant implications of financial exclusion to move out of poverty. When denied access to formal financial channels, street vendors are often faced with crushing interest payments that provide little ability to expand their business or generate extra income.
There is a general policy takeaway from our study. Because of the variegated nature of the street vending that we have uncovered, it is important to generate policy suggestions that reflect this diversity. A one size policy will not fit all situations, as our case studies reveal. While specific to the city, the three sectors can also be characterized in more general terms as:
The well-established: stable, relatively affluent, and regularized (Downtown)
Gateway Type 1: for rural displaced and indigenous (Santa Helena)
Gateway Type 2: for minorities, very recently arrived and low-income (MIO)
Polices and program implementation focused on improving their quality of life should take into account this variation. In the case of Cali, focusing on police harassment is an issue for MIO vendors more than those in Downtown. Focusing on vulnerability to crime and extortion is more important for those in Santa Helena than those in the more established Downtown. Only a full understanding of the complexity of street vending will ensure the proper mix of targeted public policies. There is, however, one issue that transcends all the sectors, and that is access to credit. One overriding conclusion of this study is that to encourage street vending to be a more efficient form of poverty reduction, economic growth promotion, street safety enhancement, and women’s participation in the labor force, we need to improve vendors’ access to easy, quick, reliable and cheap credit.
This characterization emerges from only one city. Different categorizations with different combinations of gender, age, race and ethnicity, educational attainment, and date of arrival in the city may produce different types of segmentation. The point is that informal street vending is a complex, varied economy with different sectors and subsectors.
7. Conclusions
In this study, we use detailed quantitative information from street vendors in Cali, Colombia, to answer two questions: (i) how different are street vendors within one city? and (ii) which workers present the largest share of indebtedness and access to illegal payday lenders to access credit in the three clusters analyzed?
To study the variety and segmentation of the informal economy in the city, we use the information of informal workers at three different locations: Downtown, Santa Helena, and workers in the mass transit system (MIO). We analyzed the variations in the socioeconomic conditions and earning/profits to inform about the important distinctions of street vending dynamics. Our analysis is descriptive and provides evidence to show the differences between workers in three areas in the city.
The results reveal differences in the informal sector of street vending. Downtown is an established informal settlement, which opens every day on a regular schedule and alongside formal trade. Workers have higher educational attainment and relatively higher incomes, and the area provides better working conditions with less crime [
9]. The street market of Santa Helena is a gateway or entry sector for the recently arrived and less educated, especially for those displaced by decades of civil unrest in rural Colombia. Their agricultural skills often mesh well with the job requirements of the food market. Workers in street food markets work a few days a week on designated market days. Because of the high levels of poverty and violence in the surrounding area, vendors are particularly vulnerable to criminal gangs. The MIO system is also a gateway for the recent migrants from Venezuela and lower-skilled workers and minorities. Workers in the mass transit system earn, on average, a lower salary, despite their higher educational attainment.
We have provided data that reinforce the idea that there is a wide variation in conditions, characteristics, stability, and incomes of street vendors that range from the relatively affluent through to the lower income and more marginal, and from the long-established to the recently arrived. Future policy suggestions for this informal sector thus need to take into account the wide variety of experiences if we are to provide targeted and effective policies. Furthermore, future studies of the informal economy of street vending should be aware of its multi-faced nature so that future studies at only one site will situate their work in a broader context.
Our results also highlight the high indebtedness and financial exclusion amongst street vendors. About half of street vendors were indebted at the moment of the survey, with the highest rates for MIO workers, who earn the lowest wages among informal workers in the city. Few informal workers can access micro-finance credits (9%). The main resort for credit amongst this population is illegal payday lenders (known as gota-gota), who charge interest rates of 20% monthly. Downtown and Santa Helena workers make, on average, a higher wage than the minimum wage but are unable to escape poverty provided their high rates of indebtedness with payday lenders. Our results suggest that if the informal sector in general and street vending, in particular, is used as a way of life for people out of poverty, then serious attention must be paid to overcoming financial exclusion. Improving access to the cheaper and more reliable formal financial sector is a key element in poverty reduction. In order to lift more people out of poverty, our data show, we need to provide easier access to formal financing.


