Abstract
This paper analyzes how imitation and innovation strategies of high-tech small and medium-sized enterprises (SMEs) impact their sustainable performances and also the whole business ecosystem with the NK-model that mimics the fitness landscape and simulates enterprises’ choice of technological strategy in response to causal ambiguity and environmental complexity. Our study yielded three findings: (1) When the imitation barriers are low, the imitation strategy of high-tech SMEs has a better effect on the performance improvement in the early stage of the operation than the innovation strategy. In the long run, high-tech SMEs exhibit innovation, which plays a greater and more lasting role in enhancing sustainable performance. On the contrary, it is always difficult for imitators to realize significant performance improvement, (2) In a simple environment, imitation strategy plays a more effective role in improving high-tech SMEs’ performance, whereas in a complex environment, innovation strategy is more conducive to discovering opportunities, and it issues from high levels of competition, and (3) more importantly, the simulation finds that the innovation of high-tech SMEs contributes more to the performance of the business ecosystem as a whole. The introduction of the NK-model simulation method in the research of technological strategies and the new scope of looking at the strategies in the business ecosystem provide new research venues for the literature.
1. Introduction
Imitation and innovation are two different but common business strategies for technological upgrade. Imitation is a form of organization gleaning information from the first mover’s experience and research outcome for better outcomes among second-mover firms; in other words, it seeks to understand the reality and learn [1]. It helps avoid repeating steps and saves time and money, creating the so-called second-mover advantage [2]. Innovation, as the core driving force of high-quality development, is defined as the recombination of unused resources reintroduced into production; the discovery of new resources; or the development of new products, process, or organization. Innovation brings more efficient technology [3], helps accumulate unique core competency, occupies an advantageous position in the business ecosystem, and creates long-term competitive advantages [2,4,5].
However, both strategies have their weaknesses. For imitators, imitation barriers are the significant challenge. Causal ambiguity as a crucial barrier makes it difficult for laggard firms to pinpoint the relationship between leading firms’ competitive advantage, resource allocation, and ability to cultivate itself [6]. Thus, they may lose focus in imitation, and the result becomes highly uncertain. Environmental complexity also affects the judgment of firms and its allocation of existing resources and strategic choices [7]. For innovators, it usually requires substantially more upfront investment to innovate. Because innovation is the long cycle with high complexity, high cost, high risk [8,9], innovators have to tolerate the delayed effect of innovations on performance improvement and face higher probability of innovation failures [10].
Therefore, it is important to choose and carefully calculate the best path of performance improvement between two business strategies based on the firms’ relative positions and phases [11,12]. Meanwhile, small and medium-sized enterprises (SMEs) are agile and the drivers of innovation [13]; they compete for market share with large enterprises. With flexible and organic structures, they react fast to changing market demands; they are more result-oriented and, therefore, exhibit better firm performance [14,15]. Yet, we know that firms are increasingly dependent on ecosystems. When making strategic decisions, they will consider not only internal constraints and potential benefits but also the external impacts of the decision on related competitors in the ecosystem. In particular, high-tech SMEs are the driving force of economic growth; they are recognized as a core resource to enhance innovation [16]. They always need to consider strategies between innovation and imitation. Faced with various competitors, high-tech SMEs need to effectively and rationally exploit technologies and agile strategy management practices to keep their competitive advantages [17]. If barriers and competitors are removed, then innovation is the key to the success of high-tech SMEs [18], which consists of two factors: process and performance [19]. Different levels of flexibility on strategic decisions result in variety of innovation and firms’ overall performance in high-tech SMEs.
However, the existing literature on technological upgrades mostly puts the focus of decision making on a single firm [20,21]. Firms are relying increasingly on stakeholders in the business ecosystem to jointly capture and create values [22]. Furthermore, the majority of studies studying strategies and technologies management focus on large firms [23]. They ignore the practical values of SMEs, especially the high-tech SMEs. Meanwhile, few scholars have considered that imitation and innovation can be analyzed on the same context in three levels of individual decision making, firm relations, and the business ecosystem. Moreover, due to the fact that imitation is difficult to measure, most studies employ case study and theoretical analysis, while innovation is usually measured by secondary data such as patents. They seldom used uniformed research methods to study them.
Beyond outlined research gaps, there is a new trend of applying organizational ecology in business research. It focuses on discovering the conditions that generate important features in the population dynamics [24], such as the relationship between the diversity of resource and organizational evolution [25]. Currently, it has evolved into three aspects. First, scholars focus on the evolutionary process of an organizational individual from creation, growth, and development to decline or secondary evolution. Second, they concern the impact of organizational niche on competition intensity and strategic choice among enterprises. The degree of ecological overlap between enterprises is, to some extent, a reflection of the intensity of competition in a business ecosystem and with niche width has an important influence on enterprises’ formulation and selection of development strategies [26,27]. Third, most scholars pay attention to the relationship between individual enterprise behavior and the overall development of the business ecosystem. It is emphasized that organizations are not isolated entities. Their behavior will affect others and even the whole business ecosystem. Leaders always play a main role in resource allocation and overall planning, while no-leaders in the business ecosystem need to use resources wisely and find the right place for contributing to the healthy development of their firm [28]. Existing research shows that enterprises should not only focus on improving their performance but also think about how to create greater value for the business ecosystem when making strategic choices.
Furthermore, the process of innovation usually has the characteristics of bounded, iterative, trial-and-error search in a complex landscape [29]. The NK model is regarded as a canonical method to study the relationship between complexity and innovation and performance outcomes through searching the mutation and recombination in biology [29]. In prior research, it has been used in many fields, ranging from imitation [30,31] to decision-making [32] and competition [33,34]. N and K describe the complexity of a business ecosystem. As K increases, the business ecosystem becomes more complex. There will be more peaks in the fitness landscape, which represent many payoffs. The payoff is represented as the “global peak” or “average peak height”, which mean the best performance of enterprises. Therefore, the NK model has emerged as a useful representation of innovation and imitation strategies among decision-making enterprises.
In light of the research gaps and the advantages of the NK model, this paper explores how firms, in particular high-tech SMEs, make strategic trade-offs and choices under a set of impacting factors including imitative barriers and the complexity of the business ecosystem. Through simulations of the NK model, it attempts to simulate the firm-level performance comparisons of the imitation and innovation paths in different obstacles and environments and then identify the best strategy for high-tech SMEs and the overall business ecosystem.
This paper creatively adopts the NK simulation method to identify the strategic choices from imitation and innovation for high-tech SMEs. Because there is a high similarity between the foundation of NK model and the theory of organizational ecosystem, we believe that our introduction of this method into the research of organizational ecosystems is a breakthrough in this field, which opens up a new venue supplementing the current research in strategic imitation, which is still inadequate. The experimental design of this paper has improved the previous NK simulations on strategic imitation in ways that (i) the leader in the ecosystem can make dynamic decisions as conditions change, (ii) the inclusion of causality fuzziness makes the model more consistent with the definition of imitation, and (iii) the follower can strategically make selective imitation, which is more consistent with business behaviors in reality.
2. Theoretical Analysis and Research Propositions
2.1. Organizational Ecology
The theory of organizational ecology tries to the answer the questions of “why organizations are so diverse” [35] and “which organizations will be selected by the environment” [24] based on a species selection mechanism [35]. It frequently focuses on the dynamics, variation, and stabilizing forces among populations [36]. Organizational development is similar to biological evolutions [37], which consist of different factors such as competitive intensity, and the number of enterprises construct various species environments. The inter-firm relationship and the degree of environmental dependence will influence behavior and the structure of organizations in a species group. The boundaries of industries are increasingly blurred [38], which augurs a high rate of unexpected and novel changes in the industry [39]. Enterprises are not entirely independent entities; producers, suppliers, competitors, and other stakeholders form the whole ecosystem. They compete over scarce resources in the ecosystem, and competition will lead to the selection of a competitive approach [40] that relies on either innovation or imitation strategies.
2.1.1. Ecological Niche and Organizational Competition
Most peripheral firms are typically considered as niche players within the ecosystem [41]. It refers to the position and function of a biological unit under a given range [42], along with access resources, alliance partners, and important information about market conditions for creating value through interactions [43] according to different firms’ behavior and systemic environment [37]. The stability of the ecosystem is tightly linked with normal interactions between species [44], such as many related elements and subjects. External environment and enterprise strategic decisions will directly determine the ecological niche that also affects enterprises’ ability to use limited resources and a strategic-choice range, as well as affecting their existence and growth [45]. Consequently, firms need to develop or choose the right strategies, as well as take different competitive actions [46].
Niche overlap depicts the ecosystem in which co-occurring species share parts of their niche space with each other [47]. High niche overlap that may reflect some species’ conflictual interactions, such as competitive intensity [26,48], occurs when two species occupy the same resources and environmental elements. When a few firms take imitative actions, the short-term action may help improve the performance. Otherwise, it will lead to additional ecological niche overlapping as more firms join the ecosystem. The increase in the phenomenon may lead to vicious competition that will do harm to the development of the whole market [49]. In contrast, the phenomenon of niche separation often occurs when firms pursue differentiation. What prompts this move is the urge to separate one’s own ecological niche from others or create a new ecological niche through obtaining differentiated resources or differentiating the allocation of resources so that the firm has a stronger ability to adapt or even shape the environment. Such a firm shows low niche overlap, which allows sustainable co-existence of species [50,51]. Innovation is an effective differentiation strategy to form a unique competitive advantage [52].
2.1.2. Environments in the Business Ecosystem
The essence of a firm’s evolution is a process of interacting with their surroundings to survive and to realize development [53]. It will produce unstable motion when changes happen in a firm’s environment [54]. Then firms constantly adapt or change the environment to restore the balance of the seesaw through a new shift. The whole evolution forms. Therefore, we construct the following framework (see Figure 1).
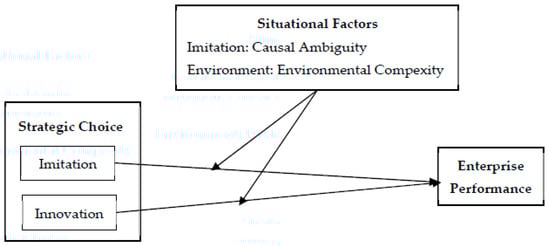
Figure 1.
Conceptual model.
2.2. Imitation and Innovation
Imitation dilutes value. Having valuable resources that are hard to imitate is the origin of firms’ sustainable competitive advantage for leaders in the ecosystem [55]. To followers, imitation is one of the easiest ways to perceive the reality, and it not only saves costs of R&D trials and educating consumers, but it is also a way of learning from leaders’ experience to gain advantages of backwardness [56].
However, all imitations come with costs and risks. The existence of imitative barriers increases the difficulty of imitation strategies [46], inhibiting the competitor’s imitation before and after the product being introduced to the market. The level of imitation difficulty influences the sustainability of leader’s competitive advantage. The number of strategic decisions and the degree of correlation will raise the difficulty of imitation, which hinders performance of imitators [57]. The causal ambiguity of resources is one of the important origins of imitative barriers. Causal ambiguity means inability or incomplete understanding of the relationship between firms’ resources and their sustainable competitive advantage [44], and this ambiguity will increase imitative uncertainty and other difficulties. This is because casual ambiguity limits a firm to replicating, leveraging, and scaling resources of advantage while preventing any competing firms from imitating the above resources [58]. So in the short run, the imitator falls behind the leader in performance. And too many aimless imitations lead to the waste of resources. Therefore, we propose the following:
P1a:
Causal ambiguity is negatively related to imitation performance. The higher the causal ambiguity is, the lower the imitation performance will be.
In the related studies about the impact of innovation on firms’ performance, most scholars find that innovation helps sustain competitive advantage. Innovation is beneficial to develop new value by reallocating available resources to achieve differentiation, and it reinforces a firm’s core competencies and prolongs their competitive advantage [59]. Some others from the perspective of lifecycle find that innovation has a lagging impact on performance. Start-up firms always own limited resources and are limited in their ability to innovate [60]. However, developing the ability of innovation is a long process [10], and the cycle from investing in R&D to commercialization will shorten as experience and capacity accumulate.
In general, the initial investment in R&D usually does not improve short-term performance. As the continued investment builds up its innovation ability, they start to produce related results and yield economic benefits, laying the foundation for future development and expansion. These actions help acquire more benefits with continuous innovative ability. Therefore, a firm’s sustained innovative investment will be constantly manifested in improving the effect of sustainable performance in the early growth and development phases. Hence, we propose the following:
P1b:
Innovation strategies have a lower effect on performance in the short term, and have a greater effect on performance in the long term.
In summary, the imitation strategy is more effective in improving performance in the short run when the firm faces low imitation barriers, because in the short term imitation is easy, cost-effective, and efficient under low barriers. On the contrary, imitation is more difficult and the effectiveness of performance improvement is weakened. For the innovation strategy, its effect on the improvement of performance indicates high consumption cost, risk of failure, and low efficiency in short-term. But in the long run, it is more helpful to accumulate core competencies and maintain competitive advantages. Therefore, we propose the following:
P1c:
In the short term, imitation strategy has a stronger effect on performance than the innovation strategy when there are low imitative barriers within the ecosystem. In contrast, innovation strategy has a stronger effect on performance than imitation strategy. In the long term, innovation strategy plays a stronger role in improving performance compared to imitation strategy.
2.3. Environmental Complexity
Environmental complexity as the synthesis of different factors such as the number of stakeholders, the degree of differentiation, and diversified demands [61] is one of the important environmental characteristics. Its sources include the number of decisions and their correlations [62]. When a decision affects the performance independently, the firm is in a simple environment. If it is made under the condition of other decisions, then the firm operates in a complex environment.
It will affect the judgment and its allocation of existing resources and strategic choices. For the imitative strategy, the key to success is to be able to identify critical elements of leading firms and inter-relationships between combinations of elements. It is difficult to predict changes of environment and identify the cause of changes if firms encounter the complex environment [63]. Environmental complexity determines the scope of managers in perceiving the environment [64]. A high degree of environmental complexity makes it impossible for managers to adequately identify external information, such as risk taking and R&D investment [65]. The more complex the external environment, the blurrier the external information. As the accuracy of identifying key elements of imitation decreases, it is more difficult to realize the useful imitation and convert it to the better performance. Complex environment means that there are many competitors in industry, [63] which may exacerbate the imitation among firms under complex environment [66]. Therefore, imitation strategies may hinder firm performance in a complex environment. We propose the following:
P2a:
Environmental complexity is negatively related to imitative performance. The more complex the environment is, the lower the performance imitation strategy will achieve.
On the other hand, market opportunities in the business ecosystem increase as environmental complexity increases. Firms can acquire substantial market opportunities through deep or wide search and configuration of resources [67], even create opportunities through strategic combination. The diversity of actions for a firm’s competition, such as innovation actions, can leverage strategic resources and create higher performance in complex environments [68,69]. Firms will easily gain resources and save time when the external environment is relatively simple. They can find a path to improve sustainable performance fast and accurately learn from, and imitate, existing firms. In this case, the impact of large investments into innovation is not as distinguishable as in a complex environment where imitation is harder and innovation is more helpful to wisely use these opportunities. Therefore, we propose the following:
P2b:
Environmental complexity is positively related to innovation performance. The higher the environmental complexity is, the better innovation performance will achieve.
In summary, under a simple environment, imitative firms can more accurately identify the strategic combination of leading firms and are easier to acquire necessary recourses to replicate the process with higher efficiency. For the innovation strategy, it requires more and longer investment and taking risks of innovation failure. For imitators, they are unable to accurately identify key elements and combinations of resources to successfully upgrade their technology or products. Imitation is only possible when a target on key resources is identified [70]. For innovators, their effort in trial and error and continuous investment in R&D can help them discover new market opportunities, dilute the intensity of competition, and find the strategic combinations of elements that match their resources and capabilities and even promote the healthy development of the whole business ecosystem. Therefore, we propose the following proposition:
P2c:
Imitation strategy has a stronger effect on performance than innovation strategy when firms are located at a low degree of environmental complexity in the ecosystem; innovation strategy has a stronger effect on performance than imitation strategy when firms are located at a high degree of environmental complexity in the ecosystem.
3. Materials and Methods
3.1. NK Model Simulation
The NK model was first introduced by Kauffman (1989) [71], which is a structured simulation method for studying complex systems in the fields of evolutionary biology and the management [72]. It can well simulate the organizational decision-making, interorganizational relationships, the interaction with their environment, and even control hidden elements such as interaction intensity [73]. It mainly includes two parameters, N and K.
N is the number of elements in high-tech SMEs or the environmental system. The NK model uses alleles to represent multiple different traits of a single element. For example, an element can be large or small and long or short. Among N elements, the alleles of a different state (0 or 1) correspond to different fitness values. The spatial size of a group of gene combinations has 2N possible organization forms. The system fitness value is a weighted average of the fitness value of N elements.
K (0 ≤ K ≤ N − 1) represents the degree of interaction among N elements in high-tech industries, and when the allele of a certain element in the system changes, the fitness value of the element itself changes, and it will cause the fitness value of other K elements to change. Therefore, parameter K reflects the complexity of the relationship between system elements. They constitute the fitness value of the genome and the landscape [74], which determines the complexity of the system environment faced by the high-tech SMEs.
Therefore, each N element changes to the optimal trait at the maximum value, and this leads to the optimal overall fitness value. When K > 1, especially close to N − 1, the relationship between elements becomes more complicated, a change in the characteristics of a certain element will produce a chain reaction with multiple peaks and vertices in the fitness landscape, most of which are local best, and only the highest peaks will be the global best. However, firms such as high-tech SMEs are likely to fall into a growth bottleneck called the “local trap”, and the fitness value may no longer rise at this time. In the NK model, the process of biological gene mutation and natural selection can be regarded as the continuous “climbing” in a fitness landscape (Figure 2). Individuals tend to constantly change and adjust their gene combination to optimize through adaptation and search of their surrounding, eventually climbing to a relatively optimal position [74].
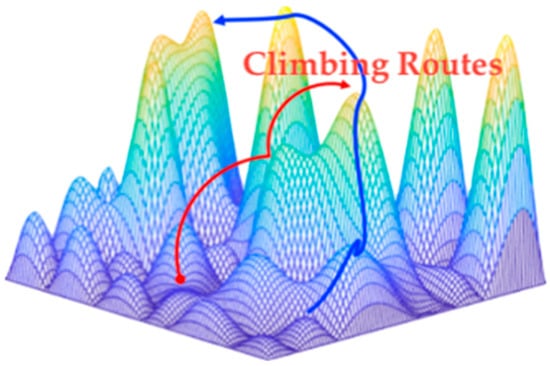
Figure 2.
Searching and climbing process in the fitness landscape.
When the allele of a certain element changes, its contribution value Fi and other K elements with an upper relationship to the overall fitness will obtain a new set of random numbers in the interval (0, 1) uniformly distributed random number set [51], and then calculate the mean value as the overall fitness value:
F—The overall fitness value of an organism;
N—The number of elements that make up an organism;
Fi—The contribution value of element i to the overall fitness.
3.2. Simulation Experiments
In this part, we conduct two groups of experiments based on above research propositions, and involve in six parameters (Table 1), which are mainly used to change the shape of the fitness landscape (crags) and the experimental period; All experiments are simulated by MATLAB R2019b. To eliminate the randomness, experiments randomly simulated 100 fitness landscapes and searching and climbing behaviors of 100 enterprises in each landscape, so 100 × 100 = 10,000 experiments will be run for each parameter (see Appendix A for more details on the NK model process).

Table 1.
Description of experimental parameters.
3.2.1. Experiment 1: Exploring Performance Differences of Imitation and Innovation Strategies under Different Imitation Barriers
The fitness landscape set K = 6. Because complexity of the environment is in an intermediate state, excluding the possible error effects on the experimental results under extreme environmental conditions. The parameter θ is the degree of causal ambiguity of the leader’s strategy that represents the imitation barriers in the ecosystem.
For the imitation strategy, companies will be based on the top performer (leading companies) in the entire ecosystem of the previous period as their imitation objects. Non-leading companies can imitate by randomly copying two elements in the leading company’s element combination (M). The new combination is M’. The actual performance value is V. As θ causes errors in judgment, companies will estimate the new element combination V’ as the predicted value. It is set in [(1 − θ)V, (1 + θ)V] randomly generated. Therefore, companies will decide changes by comparing the V and V’. The lower the θ, the more helpful to make more accurate change decisions. As the leading company has already achieved the highest performance in the current period, it is assumed that the leader will not set imitation objects in the next period and affected by the fuzzy. It will independently decide changes between two elements. However, they will change as performances of all companies in the ecosystem change, as no single company can always maintain leadership. In the experiment of imitation strategy, θ takes four values: θ = 20%, 40%, 60%, 80%. The lower the θ value, the lower the imitation barrier.
For innovation strategy, they will randomly change two elements by their judgment. In terms of the decision-making methods, enterprises will not be affected by θ. Thus, θ = 0, V’ = V, indicating that firms can accurately judge the performance value of the new element combination. However, they cannot achieve optimal performance after choosing the right combination of factors. Different innovation capabilities lead to varying degrees of improvement to innovation performance. Therefore, we set β as the probability of innovation success, which means the actual performance improvement after making the change decision. The actual value of carrying out the element reform is p’ = p + β(V − p). In all experiments, β is set to 50%, indicating that the innovation success probability is medium on the choice of performance improvement path for general enterprises.
3.2.2. Experiment 2: Explore the Performance Differences between Imitation and Innovation Strategies under Different Environmental Complexity
In this experiment, N = 12 is also set, and the environmental complexity of the ecosystem is changed by the size of K, which is set at 1, 6, or 11. K = 1 represents a simple environment; K = 6 is a medium complex environment; K = 11 is a complex environment. In the experiment of imitation strategy, θ is set to a medium level of 0.5 to eliminate the influence of high or low imitation barriers on imitation performance. As for the innovative strategy, θ is still set to 0%, and β is still 50% to explore the performance differences.
4. Simulation Results
4.1. Performance Results and Analysis of Imitation and Innovation under Different Fuzzy Parameters
As shown in Figure 3, the smaller the fuzzy parameters, the better the performance acquired by the imitation strategy, which confirms P1a. Compared with the imitation strategy, the innovation performance in the early stage rises more slowly. The advantage of the innovation strategy on performance improvement is more productive in the later stage, which confirms P1b. Overall, in the short term, the imitation strategy with low imitation barriers can quickly improve enterprise performance. In the long term, innovation strategies have a latecomer advantage and a stronger effect on performance improvement, which confirms P1c.
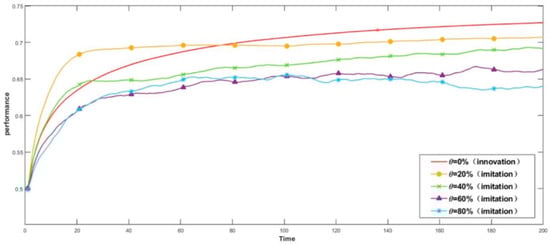
Figure 3.
Under different fuzzy parameters, performance difference of imitation, and innovation strategy.
From the perspective of the operation cycle, in the context of low fuzzy parameters at the initial stage, the performance of four groups of the imitation strategy has been rapidly improved in a short time. When θ = 20%, enterprises face the lowest imitation barriers, and they are more attracted to choose the imitation path. Therefore, most enterprises achieve 0.696 at the 71st period (T = 71) at the local optimal performance. However, in the middle and late stages, the performance of the imitation strategy begins to stagnate. When the fuzzy parameter is high (θ = 80%), the performance reaches the optimal value of 0.646 in the 101st period, and then declines and fluctuates. In contrast, companies that adopt independent innovation strategies go to the top, achieving higher performance than those adopting imitation strategy, and gradually expand their advantages. In summary, in the early stage with low imitation barriers, imitation strategy can effectively save costs and improve efficiency. To a certain extent, it can catch up with leading companies for a short period. But in the long run, imitation will not yield sustainable competitive advantages. Independent innovation after imitation will be more conducive to the improvement of performance and to developing and maintaining competitive advantages.
From the perspective of volatility, the overall curve of the innovation strategy is smoother, and the imitation becomes more tortuous as θ increases along with more volatility of performance. When the fuzzy parameter is high (θ = 60%, θ = 80%), imitating strategic performance is more volatile. The reason may be that in the same ecosystem, companies with stronger innovation capabilities can create greater value, which will gradually promote the improvement of innovation ability of other firms. Eventually, the overall performance of the ecosystem rises steadily, mutually benefiting all firms. Long-term imitation reduces the ability of enterprises to cope with changes independently. When facing high imitation barriers or unexpected changes from leaders, companies that had been relying on imitation are prone to misjudgment, causing large fluctuations in performance.
From the perspective of performance improvement, in the early stage, the curve of the four groups of imitation strategies has a larger slope. While the innovation strategy curve is smoother, the slope is smaller, and the performance improvement rate is relatively slow. However, in the long run, the four curves of imitation strategy gradually reach the bottleneck, while the performance curve of innovation strategy shows a steady rise. Table 2 summarizes the initial and final mean values of the five groups of experimental performance growth. The innovation strategy has the highest performance increase by 45.45% while the initial performance levels are approximately the same as θ grows. In the long run, it is more conducive to performance improvement, while imitation strategy will gradually fall into the bottleneck over time.
Table 2.
Performance growth rate under imitation & innovation strategy.
4.1.1. Comparison of Competition Intensity between Imitation and Innovation Strategies
As shown in Table 3, the number of leaders in each ecosystem of the five groups is 1 in the initial period. As the operation continues, when adopting innovation strategy, it is always 1; as for imitation strategies, the number decreases with the growth of θ. When T = 200, θ = 20%, the imitation barrier is small, and the number of leaders is the highest, reaching 48.5. To a certain extent, it indicates that niche separation and differentiated competition are realized in the ecosystem of continuous innovation, which is helpful to create a relatively healthy ecological environment with stable performance improvement. Niche overlap is more likely to result in more and more enterprises participating in the market to grab and carve up. Vicious competition leads to the stagnation or even decline of the overall performance, which goes against the healthy development of the whole ecosystem.
Table 3.
Changes in the number of leaders under imitation & innovation strategies.
4.1.2. Ecosystem Analysis
From the whole ecosystem, we calculate the average value of overall fitness value of the ecosystem under each strategy (Figure 4). Among the five groups, the average performance of the innovation strategy is the highest at 0.6914. However, the four groups of imitation strategies decrease when θ increases. However, an innovation strategy brings about a higher and better overall performance of the business ecosystem.
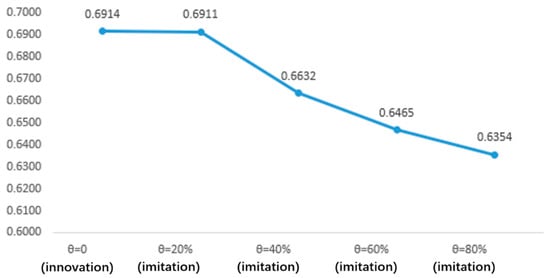
Figure 4.
200-period (all samples) changes in average performance.
Overall, innovation is a process of making a bigger pie, although employing it may catch up leaders more slowly and difficult. If companies can continue to innovate, they will discover new business opportunities constantly, form a win-win relationship among companies and the whole ecosystem. In contrast, performance of imitation strategies in an ecosystem is rapidly improved in the early stage, which can improve the operational efficiency, save costs, and catch up with leaders. But it creates a long-term dependence on imitation leading to intensified competition and ultimately a zero-sum game, which is not beneficial to the overall health of the ecosystem.
4.2. Performance Results and Analysis of Imitation and Innovation under Different Environment Complexity
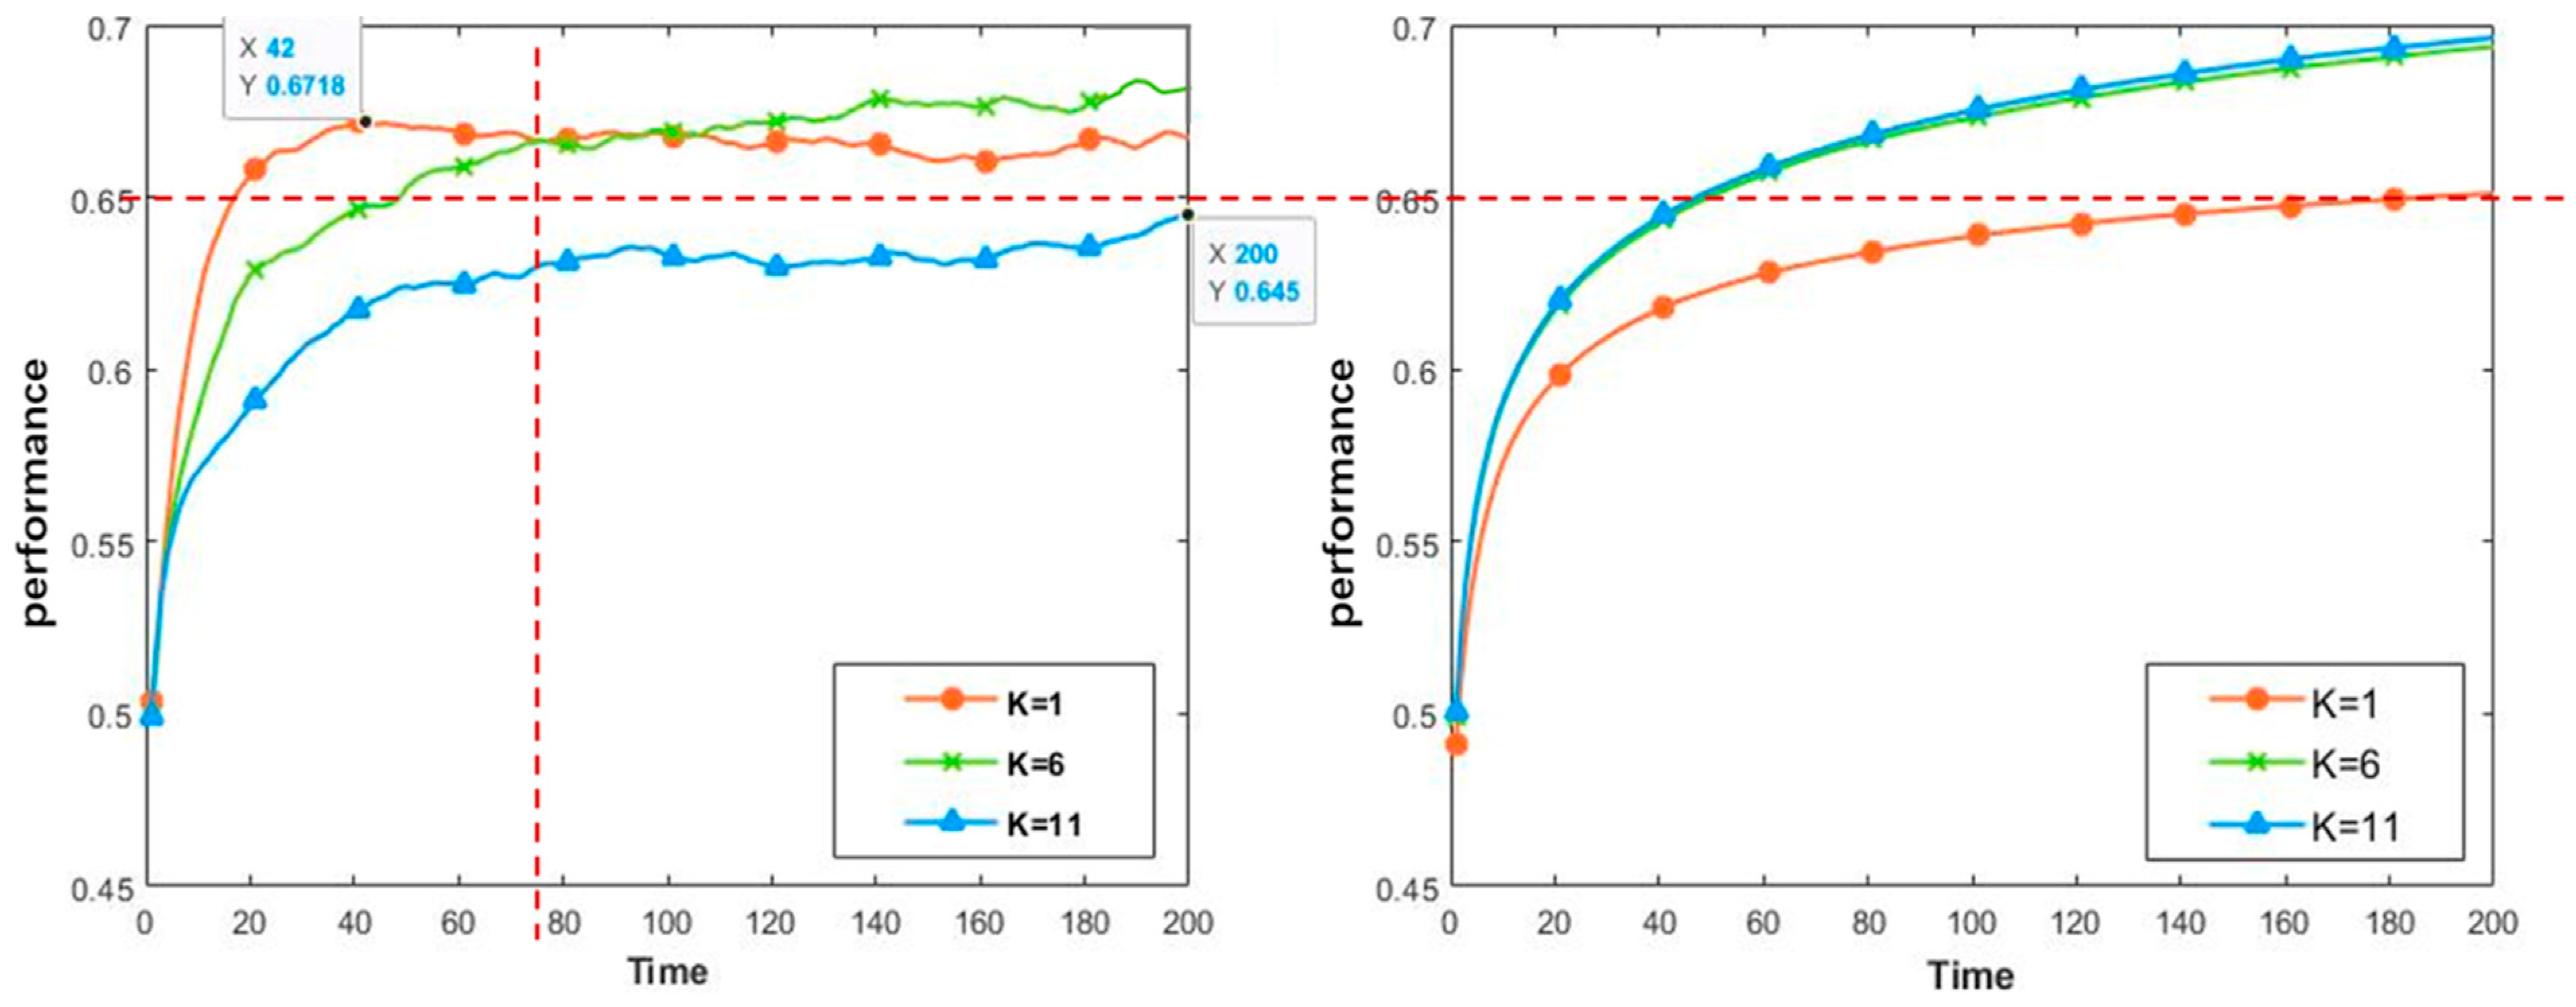
In Figure 5 (left), lower environmental complexity increases the effectiveness of imitation strategy at the beginning of the experiment when T < 75 (X = 75, Y = 0.666). However, when T > 75, the performance increase from the imitation strategy in the simple environment (K = 1) gradually stagnates, and even fluctuates and declines after stage 42 (X = 42, Y = 0.672). The performance of imitation in the medium complex environment (K = 6) is higher than that in the simple environment. In a complex environment (K = 11), the performance of imitation strategy is always the lowest. Overall, the final performance value of the imitation strategy in the medium-complex environment is the highest, which partially verifies P2a. On the other hand, Figure 5 (right) shows that the higher environment complexity always increases the effectiveness of the innovation strategy on performance, confirming P2b.
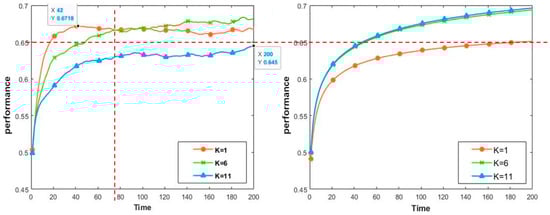
Figure 5.
Performance of imitation and innovation strategies under different environment complexity.
When the environment enterprises faced is relatively simple (K = 1), the overall performance of imitation strategy is higher than that of innovation strategy, although the performance of imitation (the left) fluctuates to a certain extent or even declined slightly in the middle and late stages. When located in the relatively complex environment (K = 6, K = 11), the performance of innovation strategy is higher than that of imitation strategy. It shows a steady upward trend throughout the 200-period operating cycle, and the higher the complexity, the better the performance of the innovation strategy gains. Hence, P2c is verified. The reason may be that companies can relatively easily achieve optimal performance on par with others under lower environmental complexity. However, due to the higher cost, lower efficiency of innovation and higher risk of imitation, innovation plays a weaker role in performance improvement; in a highly complex environment, opportunities and challenges coexist. When companies follow and imitate, there may be situations where leaders fall into local traps, and the following companies also do, which eventually leads to stagnation of total performance. Companies engaged in independent innovation are more likely to find other opportunities for their own local optimal or global optimal, and finally improve the overall performance of the ecosystem.
In Table 4, we find that, when in a relatively simple environment (K = 1) of imitation strategy, the total performance increased by 34.43%, which is higher than that of innovation performance (32.55%). When in a more complex (K = 6, K = 11) environment, the innovation strategy has a greater effect on performance improvement, especially reaching the maximum (K = 11) with the increase of 39.14%, while the imitation strategy has only 29.12%. P2b and P2c are confirmed.
Table 4.
Performance growth rate under imitation & innovation strategy.
4.2.1. Comparison of Competition Intensity between Imitation and Innovation Strategies
In Table 5, the statistical method of the number of leaders is the same as in experiment 1. Leader performance measures by the average of leaders’ final performance in 100 ecosystems. Global optimal performance is the optimal value of 100 ecosystems in different environments.
Table 5.
Number of Leaders & Global Optimal Performance under imitation & innovation strategies.
As shown in Table 5, the number of leaders increases in environmental complexity under imitation strategies. It is always about 1 under innovation strategies. It shows that imitation strategy leads to strategic convergence and increased competition, while innovative strategy promotes diverse competition as well as new and unique opportunities.
On the other hand, under the imitation strategy, as environmental complexity increases, the gap between the leader’s final performance and the global optimal becomes larger and larger. When K = 1, the leader’s final performance (0.012) is closer to the global optimal. When K = 11, the difference is the largest (0.06). Under the innovation strategy, the final performance of leaders in the three environmental complexities can reach the global optimal. In this case, the leader is more likely to fall into the “local trap”. Subsequently, more and more companies are likely to follow by leaders, causing the entire ecosystem to a bottleneck, stagnate, or even decline (the left of Figure 6). However, emphasizing and investing in innovation alongside the increase of environment complexity are conducive to growing market opportunities, more likely to occupy multiple local optimal points in the fitness landscape, and ultimately improve the overall performance of the ecosystem (the right of Figure 6).
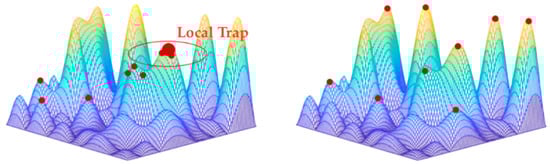
Figure 6.
Strategic convergence under imitation strategy and decentralized competition under innovative strategy (K = 11). Notes: the red point means “peak”.
4.2.2. Ecosystem Analysis
We calculated the average value of the overall fitness value of the ecosystem under each strategy in Figure 7. With the increase of K, the average performance of the imitation strategy declines, while innovation strategies increase. When K = 1, the performance of the imitation strategy (0.660) is at maximum and higher than the innovation strategy. When K = 11, the performance of the innovation strategy is maximum and higher than the imitation strategy, reaching 0.664.
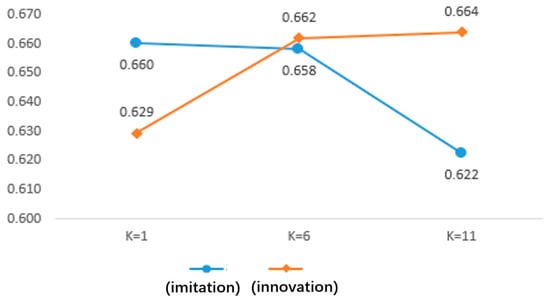
Figure 7.
200-period (all samples) changes in average performance.
The comparison shows that with lower environmental complexity in the business ecosystem, imitation strategy is more effective on performance improvement than innovation strategy. With higher environmental complexity, it turns out just the opposite. The reason may be the difference in the costs associated with innovation and imitation. Therefore, the excessive innovation costs become unnecessary losses for late movers, reducing their efficiency of resources and profitability. The reliance on imitation reduces the performance of entire ecosystem. In complex environments, the local optimal points are higher, causing imitation firms to be more easily caught in a “local trap”. It is likely to increase strategic convergence, and intensify competition among peers. Once falling into the trap, most imitation firms cannot escape. Eventually, the performance improvement of the entire ecosystem gets into a bottleneck or even a decline.
5. Discussion and Conclusions
This paper uses the NK model simulation method to construct the fitness landscape of the business ecosystem in high-tech SMES. We simulated the business sustainable performance of high-tech SEMs choosing imitation and innovation strategies under different imitation barriers and environmental complexity, and we found that both strategies are beneficial to their performance improvement, although neither guarantees superior performance.
The simulation results show that causal ambiguity is negatively correlated with imitation performance. When high-tech SEMs face low causal ambiguity, the effect of imitation strategy on performance improvement is stronger. When it is high, improvement of imitation strategy becomes weak. With backward advantage, high-tech SEMs imitate their leading firm quickly and improve performance in the short run, but the benefit also fades fast and contains volatility. Through comparison of imitation and innovation performances, our simulation specifically finds that when imitation barriers are low, imitation strategy has a more significant effect on their performance improvement in the early stage, and innovation strategy has a stronger effect in the middle and late stage. When they are high, innovation strategy is superior to imitation in advancing enterprise performance. Additionally, we also find that contribution of innovation on performance improvement is stabler and smoother while imitation has a higher degree of uncertainty and more dependence on circumstances.
For instance, the development of an online ride-hailing service company Didi, called “Chinese Uber”, confirms our discovery. Ride-hailing, as a popular shared-transportation method, has low imitation barriers in its fledgeless stage. It becomes easy to imitate in the ride-hailing mobility service industry. So Didi introduced the leading company Uber’s C2C sharing economy platform model and Uber’s ride-hailing process and webpages to urban China immediately through simple imitation in initial stages. Thus, it opened up the Chinese markets, quickly a reaching 59.4% market share in 2013 by taking the first advantage in the industry. It triggered more than 40 followers to imitate, and led to a vicious price war. Eventually, smaller ride-hailing apps were purchased or eliminated, which was detrimental to the development of the overall business ecosystem.
Imitation barriers were growing higher and higher. Didi started with minor innovations and carried out 11 product trials and errors, iterations, from user experience and business model innovation to complete the product innovation. When located in the middle and late stages of ride-hailing markets, Didi and Kuaidi ride-hailing companies merged and brought 99.8% market share for Didi. Didi and Uber were the two major ride-hailing companies in the market. The competition tended to be stable and smoother. Android downloads of Didi apps have grown from less than 100 million in 2014 to more than 500 million in 2015.
Our simulation results confirm that environmental complexity concerning uncertainty and dynamism [75] as an important exogenous environmental factor positively facilitates the effect of imitation on performance in the early stage of a technological upgrade. In the long run, high-tech SEMs performance is the highest when the environmental complexity is moderate. This can be attributed to the fact that imitation can quickly lead to strategic convergence of technology, process, and products in simple environments, which in turn generates intensified competition and ultimately the decline of the overall performance. However, complex environments decrease the accuracy of resource searching and increase the difficulty of resource acquisition. Therefore, it is difficult for imitators to obtain similar resources. Meanwhile, performance of leaders among high-tech industries can easily fall into “local traps” (lock-in of a less-than-optimal peak), resulting in core rigidity and reducing the overall performance. For high-tech SEMs with high innovation characteristics, it is easier to obtain environmental resources in a simple environment, as innovation tends to high relative cost and low relative. While in complex environments, market opportunities spread out in different clusters, and competition is decentralized. They can fully utilize their competitive advantages to divert competition and discover more opportunities, thus increasing the overall performance of the business ecosystem.
In the early stage of the industry, high-tech SMES faced the simple environment. Whoever captures the first advantage gets the rapid performance improvement. Didi acquired a large number of first users and huge investment by imitation under simple competitive environment. When the environmental complexity is moderate, Didi’s 21 million drivers ordered more than 30 million rides every day among more than 400 Chinese cities [76], monopolizing 94.6% of China’s ride-hailing market [77]. Didi had been the leading ride-hailing company. With the development of various kinds of cars, such as express, private, and hitch cars, state supervision and innovation requirements had been strengthened, which lead to the complexity of the environment increasing further. Didi’s development faced great challenges and exposed security problems hidden by its rapid expansion. An increase in distrust of users reduced the performance of the Didi. Consequently, the above also confirms our results.
This paper is also a significant breakthrough in research methods and broadens the research scope of technological upgrades in the literature. By introducing the NK model simulation method in high-tech SEMs, we can obtain uniformed and comparable data to analyze the strategic choice between imitation and innovation, which was not possible in prior studies due to different types of data. This method also allows us to treat the choice of imitation or innovation strategy as a single strategic decision in the business ecosystem, which better reflects the business practice in reality. Imitating enterprises need to carefully choose the imitation strategy even if it can help them achieve improved performance. When the imitation barrier reaches higher, imitation behaviors will waste many unnecessary human resources, and time as the accuracy of strategic identification of leading companies is greatly reduced; leading enterprises, like species climbing to the “peak” of biological fitness, may encounter the danger of “local trap” when facing a very complex environment. Therefore, the imitation investment needs to be more cautious. Furthermore, particular emphasis should be paid to innovation investment and the whole business ecosystem for all high-tech SMEs. Long-term innovation will get more performance improvement compared to imitation. Moreover, their development increasingly depends on the competitive strength of the business ecosystem. Firms can collaborate with each other more effectively [78] to enhance the judgement of the whole ecosystem. We believe both the research method and the new research angle are of importance to the literature and future research.
There are limitations in terms of the research content and experimental process. First, firm related capabilities such as dynamic capability are not considered in our simulation. Dynamic capability plays a significant role in a firms’ business ecosystem and innovation [79]. Future research can refine and enrich data on the variable. Second, two experiments assumed that the market capacity could be expanded indefinitely, failing to achieve the survival of the fittest among high-tech SEMs. The competition and survival can be realized by setting the market capacity of the overall commercial ecosystem. Meanwhile, it is assumed that companies have to choose one performance improvement strategy in the same period, but that is opposite in reality. It would also be interesting to consider combining both strategies as a third option.
Author Contributions
Conceptualization, X.L., H.Y., G.L. and S.W.; methodology, X.L., H.Y. and S.W.; software, S.W.; validation, X.L. and G.L.; formal analysis, H.Y.; investigation, S.W.; resources, G.L.; data curation, X.L.; writing—original draft preparation, H.Y. and S.W.; writing—review and editing, X.L., H.Y. and Y.X.; visualization, H.Y. and G.L. All authors have read and agreed to the published version of the manuscript.
Funding
This research received no external funding.
Institutional Review Board Statement
Not applicable.
Informed Consent Statement
Not applicable.
Conflicts of Interest
The authors declare no conflict of interest.
Appendix A
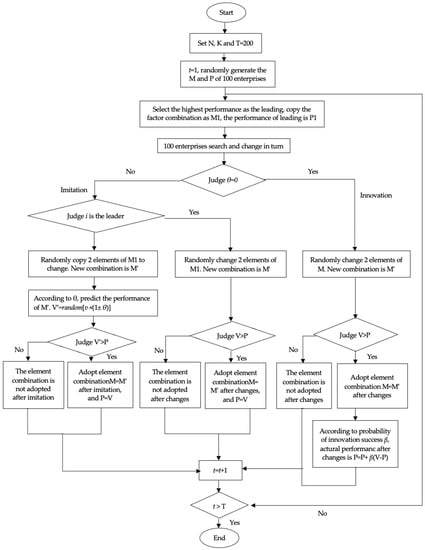
Figure A1.
Simulation experiment process of the NK model.
Figure A1.
Simulation experiment process of the NK model.

References
- Levitt, B.; March, J.G. Organizational learning. Annu. Rev. Sociol. 1988, 14, 319–340. [Google Scholar] [CrossRef]
- Lieberman, M.B.; Montgomery, D.B. First-mover advantages. Strateg. Manag. J. 1988, 9, 41–58. [Google Scholar] [CrossRef]
- Hailin, Y.; Wei, H. Effects of R&D subsidies on external collaborative networks and the sustainable innovation performance of strategic emerging enterprises: Evidence from China. Sustainability 2022, 14, 4722. [Google Scholar]
- Robinson, W.T.; Fornell, C. Sources of market pioneer advantages in consumer goods industries. J. Mark. Res. 1985, 22, 305–317. [Google Scholar] [CrossRef]
- Wu, W.; Liang, Z.; Zhang, Q.; Zhang, H. Coupling relationships and synergistic mechanisms between technology management capability and technological capability in product innovation: A simulation study. Technol. Anal. Strateg. Manag. 2020, 3, 1–15. [Google Scholar] [CrossRef]
- Grant, R.M. The resource-based theory of competitive advantage: Implications for strategy formulation. Calif. Manag. Rev. 1991, 33, 114–135. [Google Scholar] [CrossRef] [Green Version]
- Mckelvey, B. Avoiding complexity catastrophe in coevolutionary pockets: Strategies for rugged landscapes. Organ. Sci. 1999, 10, 294–321. [Google Scholar] [CrossRef] [Green Version]
- Rodríguez, R.; Molina-Castillo, F.J.; Svensson, G. The mediating role of organizational complexity between enterprise resource planning and business model innovation. Ind. Mark. Manag. 2020, 84, 328–341. [Google Scholar] [CrossRef]
- Hou, N.; Zhu, Q.; Yang, J.; Zhang, D.; Liu, W.; Chang, H. The Impact of Environmental Governance on the Development of Fishery Economy—The Intermediary Role of Technological Innovation. Sustainability 2021, 13, 11378. [Google Scholar] [CrossRef]
- Zhang, H. The Influence of Technological Innovation and Non-Technological Innovation on Enterprise Performance; Xiangtan University: Xiangtan, China, 2019. [Google Scholar]
- Zhang, M.; Sun, Y.; Zhu, M. Toward the strategic modeling and economic growth of technology imitation and innovation. Mod. Econ. Sci. 2006, 5, 86–90. [Google Scholar]
- Li, Y. Strategy choice of industry cluster between creation and imitation. China Ind. Econ. 2004, 12, 46–54. [Google Scholar]
- Naser, V.; Sajad, R.; Ismail, W.K.W. Examining learning strategies, creativity, and innovation at SMEs using fuzzy set qualitative comparative analysis and PLS path modeling. J. Bus. Res. 2017, 70, 224–233. [Google Scholar]
- Bigliardi, B.; Galati, F. An Open Innovation Model for SMEs (No. 71-113); World Scientific Book Chapters; World Scientific Publishing Co. Pte. Ltd.: Singapore, 2018. [Google Scholar]
- Dufor, J.; Son, P.E. Open innovation in SMEs-towards formalization of openness. J. Innov. Manag. 2015, 3, 90–117. [Google Scholar] [CrossRef]
- Chung, D.; Jung, H.; Lee, Y. Investigating the relationship of high-tech entrepreneurship and innovation efficacy: The moderating role of absorptive capacity. Technovation 2022, 111, 102393. [Google Scholar] [CrossRef]
- Ladeira, M.; Ferreira, F.; Ferreira, J.; Fang, W.; Falcao, P.; Rosa, A. Exploring the determinants of digital entrepreneurship using fuzzy cognitive maps. Int. Entrep. Manag. J. 2019, 15, 1077–1101. [Google Scholar] [CrossRef]
- Farzad, N.; Amir Rahimipour, A.; Seyedeh Safiyeh, T.; Behzad, G. The relationship among knowledge-based dynamic process capabilities, innovation processes and innovation performance: An empirical study of knowledge-based high-tech companies in Iran. Kybernetes 2021, 50, 1379–1404. [Google Scholar]
- Dekoulou, P.; Trivellas, P. Organizational structure, innovation performance and customer relationship value in the Greek advertising and media industry. J. Bus. Ind. Mark. 2017, 32, 385–397. [Google Scholar] [CrossRef]
- Hobday, M.; Rush, H.; Bessant, J. Approaching the innovation frontier in Korea: The transition phase to leadership. Res. Policy 2004, 33, 1433–1457. [Google Scholar] [CrossRef]
- Wu, Y.; Mi, Z. Innovation, imitation and technical efficiency in Chinese non-state-owned manufacturing enterprises. Soc. Sci. China 2011, 4, 79–96. [Google Scholar]
- Amit, R.; Zott, C. Crafting business architecture: The antecedents of business model design. Strateg. Entrep. J. 2015, 9, 331–350. [Google Scholar] [CrossRef]
- Hartmann, M.; Oriani, R.; Bateman, H. The performance effect of business model innovation: An empirical analysis of pension funds. In Proceedings of the 35th DRUID Celebration Conference, Barcelona, Spain, 17–19 June 2013. [Google Scholar]
- Arthur, R.; Nicholson, A.E.; Sibani, P.; Christensen, M. The tangled nature model for organizational ecology. Comput. Math. Organ. Theory 2017, 23, 1–31. [Google Scholar] [CrossRef]
- Hannan, M.; Freeman, J. Organizational Ecology; Harvard University Press: Cambridge, UK, 1989. [Google Scholar]
- Singer, F.J.; Norland, J.E. Niche relationships within a guild of ungulate species in Yellowstone National Park, Wyoming, following release from artificial controls. Can. J. Zool. 1994, 72, 1383–1394. [Google Scholar] [CrossRef]
- Dobrev, S.; Kim, T.Y.; Hannan, M. Dynamics of niche width and resource partitioning 1. Am. J. Sociol. 2001, 106, 1299–1337. [Google Scholar] [CrossRef] [Green Version]
- Peng, B.; Xia, S. Research on organization failure from the view of ecology. Mod. Econ. Sci. 2005, 8, 11–15. [Google Scholar]
- Ganco, M. NK model as a representation of innovative search. Res. Policy 2017, 46, 1783–1800. [Google Scholar] [CrossRef]
- Posen, H.; Lee, J.; Yi, S. The power of imperfect imitation. Strateg. Manag. J. 2013, 34, 149–164. [Google Scholar] [CrossRef]
- Posen, H.E.; Martignoni, D.; Lang, M. Revisiting the Imitation Assumption: Why Imitation May Increase, Rather than Decrease, Performance Heterogeneity; Working Paper; University of Wisconsin-Madison: Madison, WI, USA, 2017. [Google Scholar]
- Knudsen, T.; Levinthal, D.A. Two faces of search: Alternative generation and alternative evaluation. Organ. Sci. 2007, 18, 39–54. [Google Scholar] [CrossRef] [Green Version]
- Lenox, M.; Rockart, S.; Lewin, A. Interdependency, competition, and industry dynamics. Manag. Sci. 2007, 53, 599–615. [Google Scholar] [CrossRef]
- Lenox, M.; Rockart, S.; Lewin, A. Does interdependency affect industry profitability? An empirical investigation. Strateg. Manag. J. 2010, 31, 121–139. [Google Scholar]
- Carroll, G.R. Organizational ecology. Annu. Rev. Sociol. 1984, 10, 71–93. [Google Scholar] [CrossRef]
- Fredrik, O.A.; Michael, R.F. Social entrepreneurship through an organizational ecology lens: Examining the emergence and evolution of the voucher school population in Milwaukee. Int. Soc. Third-Sect. Res. 2016, 27, 1760–1780. [Google Scholar]
- Hannan, M.T.; Freeman, J.H. Organizational ecology. Int. Encycl. Soc. Behav. Sci. 1990, 10, 71–93. [Google Scholar]
- Moore, J.; Curry, S.R. The Death of Competition: Leadership and Strategy in the Age of Business Ecosystems; HarperCollins Publishers, United Nations: New York, NY, USA, 1996. [Google Scholar]
- Sarah, C.; Yuen-Ping, H.; Shiyu, L. Business model innovation for sustainable performance in retail and hospitality industries. Sustainability 2018, 10, 3952. [Google Scholar]
- Downie, C. Competition, cooperation, and adaptation: The organizational ecology of international organizations in global energy governance. Rev. Int. Stud. 2022, 48, 364–384. [Google Scholar] [CrossRef]
- Cui, Z.; Ouyang, T.; Chen, J.; Li, C. From peripheral to core: A case study of a 3D printing firm on business ecosystems reconstruction. Technol. Anal. Strateg. Manag. 2019, 31, 1381–1394. [Google Scholar] [CrossRef]
- Grinnell, J. The niche-relationships of the California thrasher. Auk 1917, 34, 427–433. [Google Scholar] [CrossRef]
- Salampasis, D.; Mention, A. From a-value to value-multiplication: Leveraging outbound open innovation practices for unrelated diversification in the sensor industry. Technol. Anal. Strateg. Manag. 2019, 31, 1327–1340. [Google Scholar] [CrossRef]
- Xiaohua, Y.; Yuan, Q.; Longzhen, Y.; Yuanyuan, H. Temporal and spatial evolution of coupling coordination degree of industrial innovation ecosystem-from the perspective of green transformation. Sustainability 2022, 14, 4111. [Google Scholar]
- Qiang, L.; Likai, Z.; Lihong, S.; Xinchun, L.; Bo, W. Organization mark, niche and the growth of new ventures. Manag. World 2017, 6, 141–154. [Google Scholar]
- Yin, L.; Wang, Z.; Zeng, C. The relationship between internal strategy and external competition and its realistic choice-based on the perspective of ecological niche. Sci. Technol. Dev. Enterp. 2018, 4, 15–18. [Google Scholar]
- Noelline, T.; Xinpu, W.; Yingzhong, X.; Simone, F. Niche overlap and species co-occurrence patterns in carabid communities of the northern Chinese steppes. Zookey 2021, 1044, 929–949. [Google Scholar]
- Pascual-Rico, R.; Sanchez-Zapata, J.A.; Navarro, J.; Egua, S.; Anadon, J.D.; Botella, F. Ecological niche overlap between co-occurring native and exotic ungulates: Insights for a conservation conflict. Biol. Invasions 2020, 22, 2497–2508. [Google Scholar] [CrossRef]
- Xu, K.; Cheng, D. The construction and management of enterprise imitation barriers. Econ. Manag. 2005, 19, 49–50. [Google Scholar]
- Koutsidi, M.; Moukas, C.; Tzanatos, E. Trait-based life strategies, ecological niches, and niche overlap in the nekton of the data-poor Mediterranean Sea. Ecol. Evol. 2020, 10, 7129–7144. [Google Scholar] [CrossRef]
- Yang, Y.; Hui, C. How competitive intransitivity and niche overlap affect spatial coexistence. Oikos 2020, 130, 260–273. [Google Scholar] [CrossRef]
- Porter, M.E. What is strategy? Harv. Bus. Rev. 1996, 74, 61–78. [Google Scholar]
- Barnett, W.P.; Burgelman, R.A. Evolutionary perspectives on strategy. Strateg. Manag. J. 1996, 17, 5–19. [Google Scholar] [CrossRef]
- Qian, Y. Research of Enterprise Relationship Optimization Based on Niche Theory; Tongji University: Shanghai, China, 2007. [Google Scholar]
- Barney, J. Firm Resources and Sustained Competitive Advantage. J. Manag. 1991, 17, 99–120. [Google Scholar] [CrossRef]
- Lieberman, M.B.; Montgomery, D.B. First-mover advantages: Retrospective and link with the resource-based view. Strateg. Manag. J. 1998, 19, 1111–1125. [Google Scholar] [CrossRef]
- Rivkin, J. Imitation of complex strategies. Manag. Sci. 2000, 46, 824–844. [Google Scholar] [CrossRef]
- Derrick, M.; Lengnick-Hall, C. The causal ambiguity paradox: Deliberate actions under causal ambiguity. Strateg. Organ. 2018, 16, 304–322. [Google Scholar]
- Xiang, B.; Ye, Q. The evolution of competitive advantage theory and the construction of integration and expansion based on the perspective of innovation. Foreign Econ. Manag. 2005, 3, 19–26. [Google Scholar]
- Ma, N.; Wang, L. Enterprise life cycle, competitive strategy and risk taking. Contemp. Financ. Econ. 2018, 5, 70–80. [Google Scholar]
- Yang, W.; Sun, H. Research on the relationship between strategic flexibility and internationalization performance from the perspective of environmental dynamics and complexity. Xinjiang State Farms Econ. 2018, 9, 47–56. [Google Scholar]
- Siggelkow, N.; Rivkin, J.W. Speed and search: Designing organizations for turbulence and complexity. Organ. Sci. 2005, 16, 101–122. [Google Scholar] [CrossRef] [Green Version]
- Azadegan, A.; Patel, P.C.; Zangoueinezhad, A.; Linderman, K. The effect of environmental complexity and environmental dynamism on lean practices. J. Oper. Manag. 2013, 31, 193–212. [Google Scholar] [CrossRef]
- Gassmann, O.; Zeschky, M. Opening up the solution space: The role of analogical thinking for breakthrough product innovation. Creat. Innov. Manag. 2010, 17, 97–106. [Google Scholar] [CrossRef]
- Xuechang, Z.; Qigang, Y.; Wei, Z. Inventory leanness, risk taking, environmental complexity, and productivity. J. Manuf. Technol. Manag. 2018, 29, 1211–1232. [Google Scholar]
- Caballero, R.J.; Jaffe, A.B. How high are the giants’ shoulders: An empirical assessment of knowledge spillovers and creative destruction in a model of economic growth. Macroecon. Annu. 1993, 8, 15–74. [Google Scholar] [CrossRef]
- Liu, Y.; Ying, Y.; Wei, J. Organizational heuristics and R&D boundary spanning strategy choices in a transitional economy. Sci. Sci. Manag. 2016, 9, 78–89. [Google Scholar]
- Ndofor, H.A.; Sirmon, D.G.; He, X. Firm resources, competitive actions and performance: Investigating a mediated model with evidence from the in-vitro diagnostics industry. Strateg. Manag. J. 2011, 32, 640–657. [Google Scholar] [CrossRef]
- Connelly, B.L.; Tihanyi, L.; Ketchen, D.J.; Carnes, C.M.; Ferrier, W.J. Competitive repertoire complexity: Governance antecedents and performance outcomes. Strateg. Manag. J. 2017, 38, 1151–1173. [Google Scholar] [CrossRef] [Green Version]
- Ching, T.L. Laggards imitate, leaders innovate: The heterogeneous productivity effect of imitation versus innovation. Ind. Corp. Chang. 2020, 29, 375–394. [Google Scholar]
- Kauffman, S.A.; Weinberger, E.D. The NK model of rugged fitness landscapes and its application to maturation of the immune response. J. Theor. Biol. 1989, 141, 211–245. [Google Scholar] [CrossRef]
- Kaufman, S.A. The Origins of Order: Self-Organization and Selection in Evolution; Oxford University Press: New York, NY, USA, 1993. [Google Scholar]
- Zhang, G.; Bo, Q. The Modular Theory of organizational Structure Based on NK Model. Soft Sci. 2009, 6, 24–27. [Google Scholar]
- Aita, T. Hierarchical distribution of ascending slopes, nearly neutral networks, highlands, and local optima at the order in an NK fitness landscape. J. Theor. Biol. 2009, 254, 252–263. [Google Scholar] [CrossRef]
- Aragon-Correa, J.A.; Cordon-Pozo, E. The influence of strategic dimensions and the environment on the introduction of Internet as innovation into small and medium-sized enterprises. Technol. Anal. Strateg. Manag. 2005, 17, 205–218. [Google Scholar] [CrossRef]
- Didi. Didi Brain. Available online: https://www.DiDiglobal.com/science/brain (accessed on 8 March 2018). (In Chinese).
- Xiao, E. Didi’s Quest for China’s Transportation Data. Available online: https://bit.ly/2pNeSHM (accessed on 29 April 2017).
- Liu, H.; Ke, W.; Wei, K.K.; Hua, Z. The impact of IT capabilities on firm performance: The mediating roles of absorptive capacity and supply chain agility. Decis. Support Syst. 2013, 54, 1452–1462. [Google Scholar] [CrossRef]
- Teece, D.J. Business models and dynamic capabilities. Long Range Plan. 2018, 51, 40–49. [Google Scholar] [CrossRef]


Publisher’s Note: MDPI stays neutral with regard to jurisdictional claims in published maps and institutional affiliations. |
© 2022 by the authors. Licensee MDPI, Basel, Switzerland. This article is an open access article distributed under the terms and conditions of the Creative Commons Attribution (CC BY) license (https://creativecommons.org/licenses/by/4.0/).