Article

Circular Economy of Construction and Demolition Waste: A Case Study of Colombia

by
Henry A. Colorado
1,*,
Andrea Muñoz
1 and
Sergio Neves Monteiro
2
1
CCComposites Laboratory, Universidad de Antioquia UdeA, Calle 70 N°. 52–21, Medellín 050010, Colombia
2
Departamento de Ciência dos Materiais, Instituto Militar de Engenharia, Rio de Janeiro 22290-270, Brazil
*
Author to whom correspondence should be addressed.
Sustainability 2022, 14(12), 7225; https://doi.org/10.3390/su14127225
Submission received: 23 April 2022 / Revised: 26 May 2022 / Accepted: 30 May 2022 / Published: 13 June 2022

Abstract

:
This paper presents the results of research into construction and demolition (C&D) waste in Colombia. The data and analyses are shown in a local and Latin American context. As the situation in Colombia is quite similar to that in many developing countries worldwide, this research and its findings are potentially applicable to similar economies. Several factors were calculated and compared in order to evaluate which best fit the data from Colombia. We also included an experimental characterization and analysis of several key types of C&D waste from important infrastructure projects in Colombia, specifically by using the X-ray diffraction and scanning electron microscopy techniques. For the quantification of CDW, a calculation was performed based on the area and four factors of volume and density, followed by an econometric analysis of the detailed information using the Hodrick–Prescott filter, which revealed the CDW trends. Our results revealed that there are limitations regarding the availability of information and effective treatments for this waste, as well as shortcomings in education and other issues, not only for Colombia but also for other countries in Latin America.

1. Introduction

Global warming is a very serious threat that could cause a devastating worldwide disaster if actions are not taken by all countries to reduce the excessive consumption of materials [1], develop sustainable agriculture [2], and, most importantly, apply politics to find real solutions [3]. Due to the urgency of this situation, it is necessary to increase corrective measures in all areas of solid waste management and recycle as much as possible, particularly in sectors that produce large amounts of waste that consists of metallurgical slags [4,5], rubber tires [6,7,8], organics [9], and construction and demolition waste (CDW) [10]. Moreover, preventive strategies such as improved economic models must be developed. The popular circular economy model [11,12] has been implemented in many sectors, e.g., by modifying manufacturing and design processes so that products last longer and can be used in other applications after their lifecycles (upcycling). For this reason, many sectors that involve materials and electronic devices are now experiencing a revolution, with processes being redesigned to fit the circular economy model [13], for example, in additive manufacturing [14], construction and building materials [15], smart materials [16], thermoelectric modules [17], and the transportation industry [18]. Furthermore, models have been developed for the sustainable design of solid-waste management on a city [19] and country scale [20].
Construction, demolition, and renovation activities generate a large amount of waste which harms the environment and can have a significant impact on global warming if it is not managed properly [21]. It is estimated that around 35% of construction and demolition waste (CDW) ends up in landfills without any type of treatment [22]. Therefore, new solutions, technology, and approaches are required for the management of CDW. The European Commission proposed that by 2020, a minimum of 70% of construction and demolition waste should be recycled. However, there were some member states of the European Union in which recycling rates already exceeded 70% [23]. This has been achieved through good waste management practices that essentially implement circular economy principles in the construction and demolition sector and beyond. The most effective practices are aimed at maximizing the reuse of items by facilitating recycling, material recovery, and the secondary use of materials through quality assurance schemes for waste-derived materials. This involves considering the entire value chain of the construction sector and implementing these principles throughout [24].
To establish a construction and demolition waste management system, an appropriate CDW quantification must be determined that can help the government make realistic decisions and policies and determine the places wherein disposal can be granted (e.g., end of waste disposal [25]). The globally adopted methodologies for quantifying CDW can be summarized into six categories: the method of visiting the site, the method of calculating the generation rate, the method of life analysis, the method of classifying the accumulation system, the method of modeling variables, and other assorted methods [26]. The site visit method (SV) requires that investigators go to the construction or demolition site. The generation rate calculation method (GRC) seeks to obtain the waste generation rate and estimate certain alternative parameters such as the financial value based on the area. The life analysis method is mainly used to quantify demolition waste based on mass balance, assuming that every building will at some point be demolished and therefore the amount of demolition residue must be equal to the mass of the built structure. The accumulation system classification method (CSA) is based on the generation rate calculation method but involves a quantification system for different special materials. The variable modeling method uses the modeling of variables to simulate the generation of waste, taking into account five factors (specific activity, type of work and equipment, type of material and storage, site and weather conditions, and company policy). The other methods include estimating waste production as a percentage of the purchase of materials and calculating the amount of residue for some materials based on their chemical characteristics.
In this article, the amount of construction and demolition waste generated in Colombia was quantified using innovative methods involving the area of construction and the volume and density factors of the materials. Additionally, a case study from Colombia was considered and the composition of the waste was characterized. Subsequently, an econometric study was carried out to better understand the behavior and factors that influence the generation of CDW in Colombia. Finally, the CDW situation in Colombia and other countries was evaluated and compared.

2. Materials and Methods

In this work, a review was carried out to quantify construction and demolition waste in Colombia. The aim was to obtain the first quantified values of this kind in the country and generate relationships and useful data for future applications and regulations, all with an eye on implementing a circular-economy strategy.
First, an information search was conducted within the National Administrative Department of Statistics (DANE, according to its Spanish acronym), which is the entity responsible for the planning, collection, processing, analysis, and dissemination of official statistics in Colombia [27]. DANE produces a census of buildings in urban and metropolitan areas, reporting the licensed sites, completed projects, projects in progress, and discontinued projects. In this article, all of these areas were considered since it is certain that they all generate waste.
Due to the information available in Colombia, the best strategy for quantifying CDW is to calculate the rate of waste generation based on the area. After obtaining the area of completed construction projects, a volume factor is obtained for transforming units from m2 to m3. A density factor is then obtained to transform m3 into tons. In this work, several factors from different sources were used in order to obtain the one that best adapts to the available information. The factors that were used to obtain the amount of waste generated were:
  • Factor 1: based on the quantitative data of the rubble generated by the private sector which has been obtained from the building censuses available in DANE and in the Colombian Chamber of Construction (CAMACOL) [28].
  • Factor 2: obtained from an article published by the University of Eafit [29].
  • Factor 3: based on the Fatta model, in which the amount of CDW is calculated from the density and the factor presented by the author [30].
  • Factor 4: based on the law of mixtures according to the composition of waste in Bogotá.
  • The value of the factors used in the quantification of CDW in Colombia used in this research is summarized in Table 1.
For the experimental phase, sampling was carried out at the construction and demolition landfill facility “La Escombrera” in Medellín, Colombia. The X-ray diffraction (XRD) experiments were conducted using a PANanalytical X’Pert PRO diffractometer (Cu Kα radiation of 1.5406 Å) run at 45 kV, with scanning between 8° and 55°. Thirty subsamples from different parts of the demolition landfill facility were collected in order to obtain a composite sample of 10 Kg, which was representative of all building debris.

Econometric Analysis

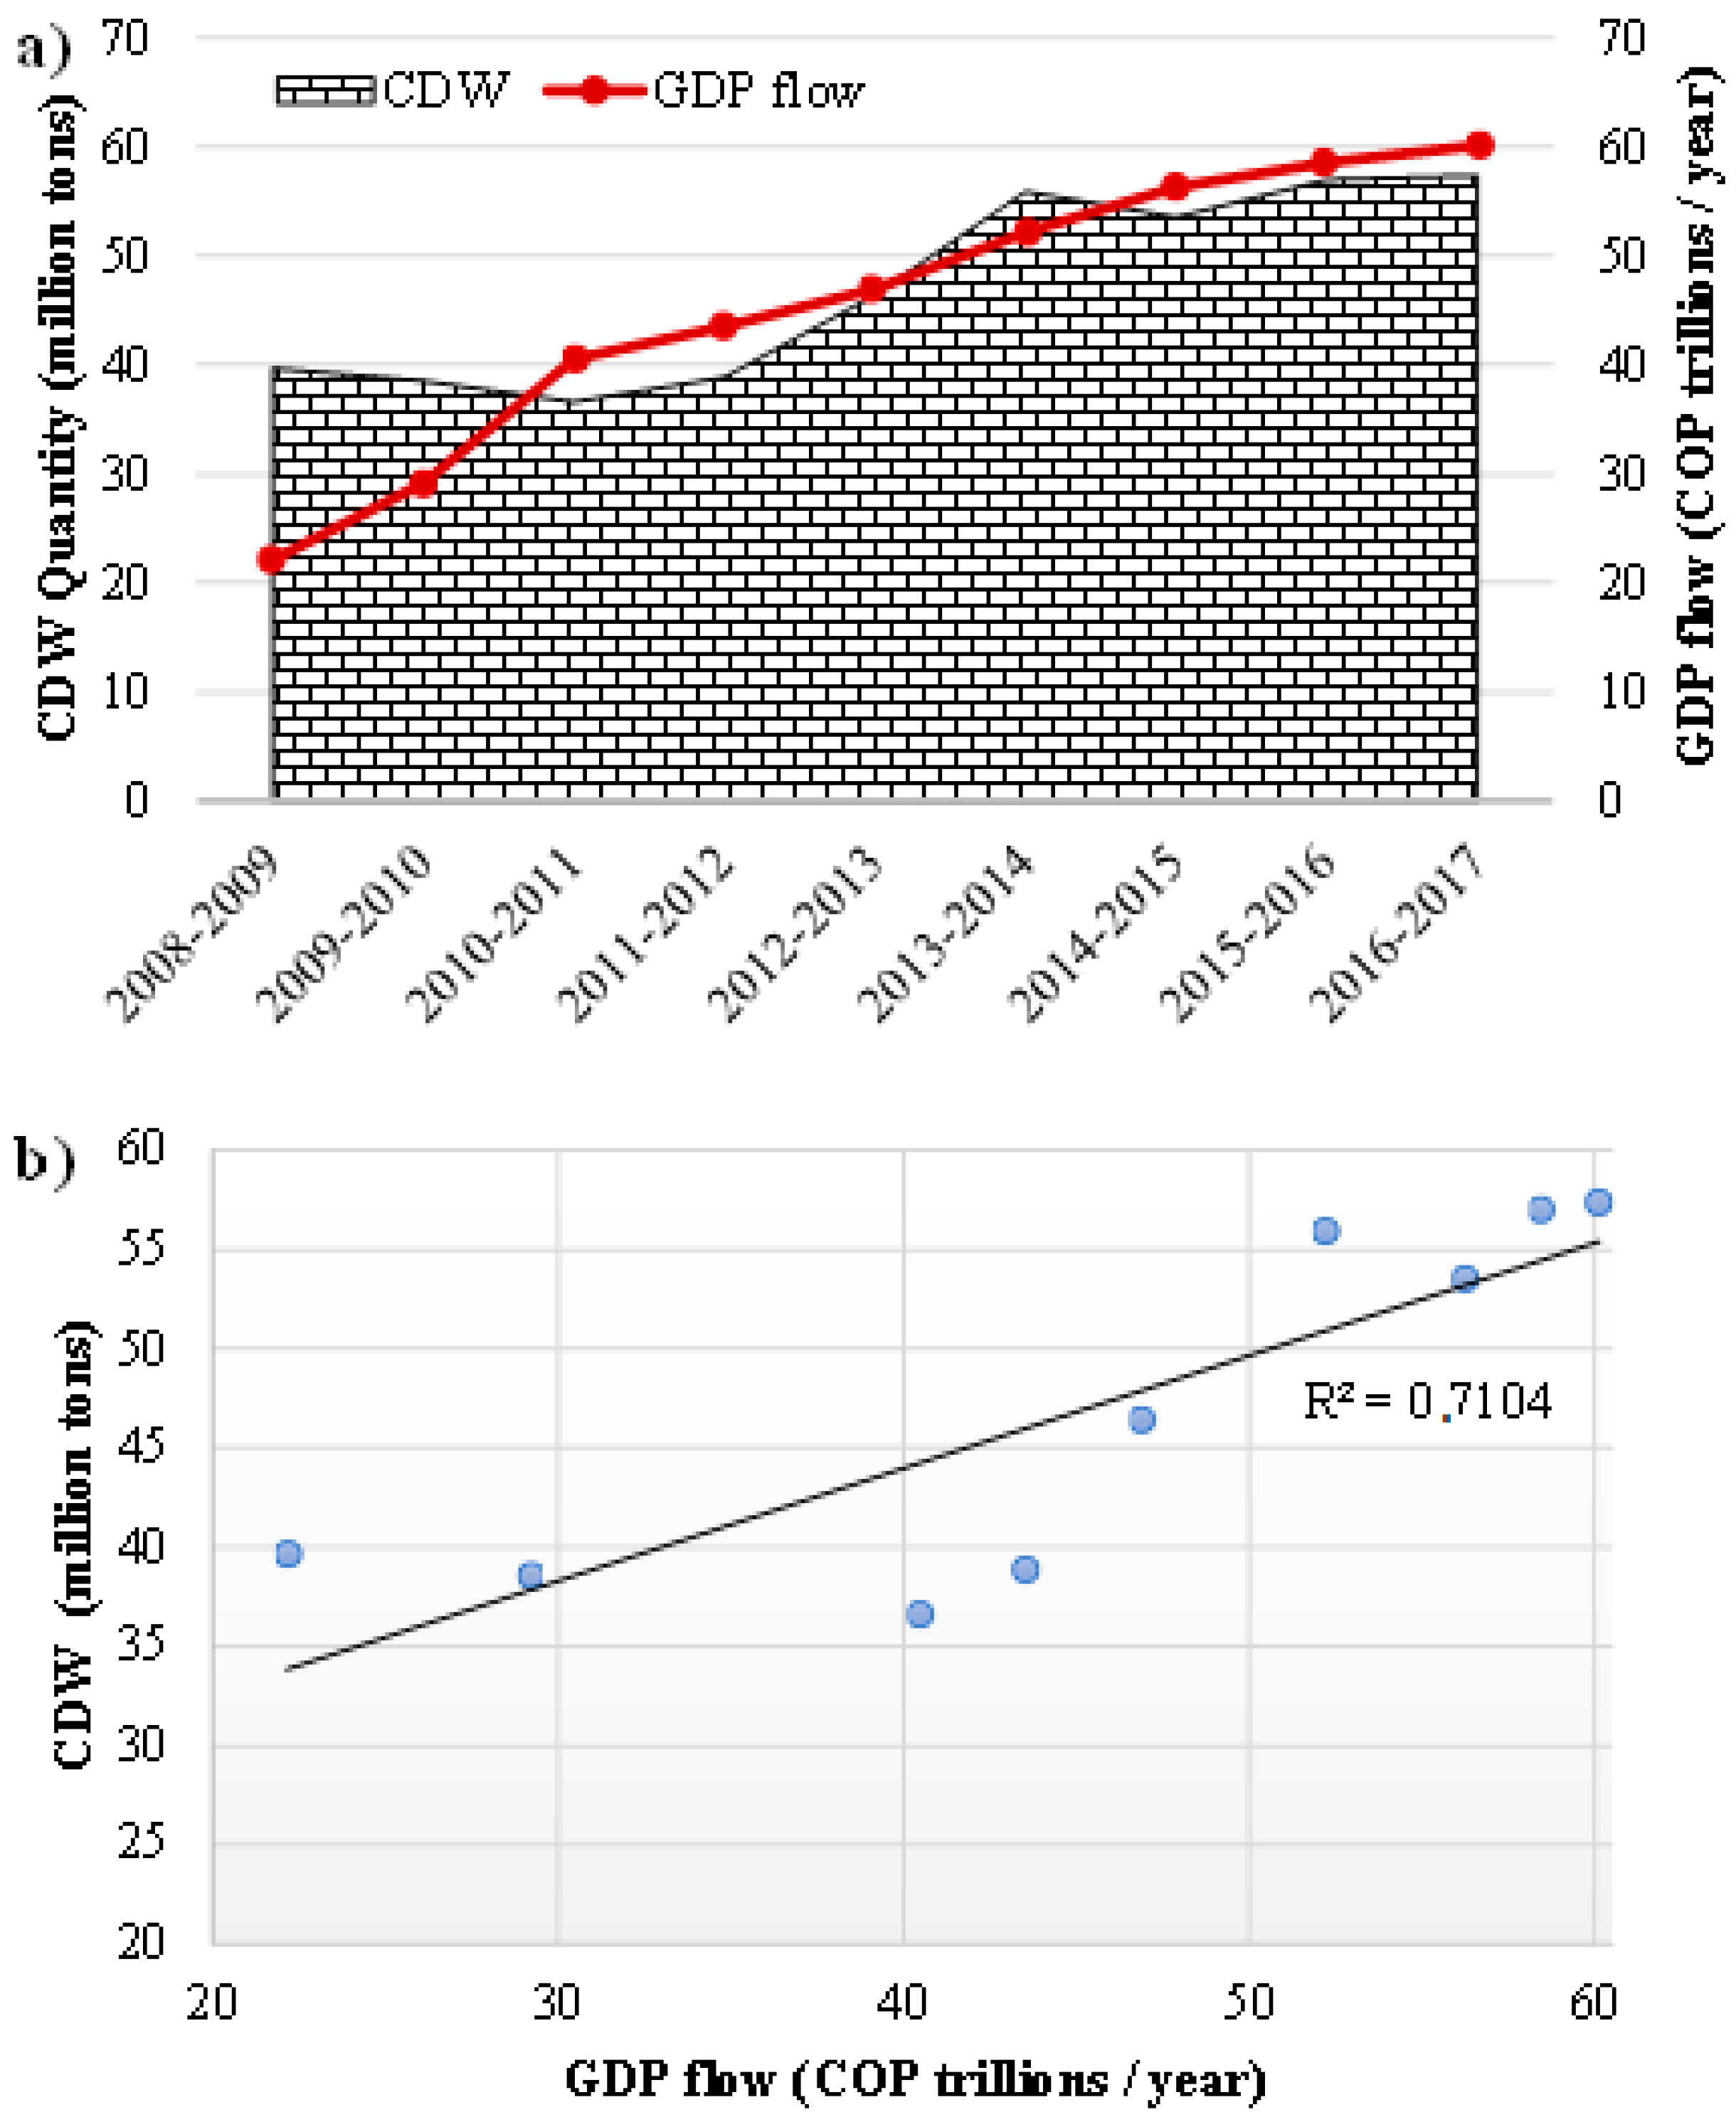
The area below the curve gave the amount of CDW produced over time. The CDW flow per year was obtained as well. The gross domestic product from construction gave the cash flow per year. The statgraphics software was used to find the correlation between the flow of CDW and the flow of GDP from construction.
The Hodrick–Prescott and Baxter–King filters were used to compare the statistical cyclical component properties of the time series for both GDP and CDW generated from construction, showing how the properties of the cyclical component vary depending on the filter used in a cycle-trend decomposition. After quantifying CDW in Colombia, the data were compared with respect to information available in Latin America and the rest of the world.

3. Results and Analysis

3.1. Construction Waste Management in Colombia

The management of waste generated by construction activity in Colombia is shown in Figure 1 (solid lines). Note that this type of waste does not undergo any type of treatment and is typically sent to a final disposal site. This has created environmental and logistical problems due to the large volume of waste, which reduces the lifespan of landfills.
Some of the main problems in the management of CDW in Colombia [31] are: construction starting without having prepared the integral management of the CDW, no waste separation at the source, few real waste treatment technologies available, low demand for CDW processed materials, poor logistics in CDW management, and a lack of education and awareness around the proper management of CDW. Because of this, in 2017, the standards for the management of CDW and public clearance services in Colombia were updated (resolution 472) to regulate CDW use and recovery. Since CDW is classified as special, waste disposal companies do not collect it, which means that it is often disposed of in a non-proper way [32]. The law also establishes that the public administration is responsible for generating the required mechanisms and having spaces for their execution. Each city must therefore carry out studies and plans to educate the community and manage CDW (PGIRS). Such plans are expected to control and monitor CDW, generate strategies, and implement actions that lead to good waste management. Unfortunately, so far, the reality is quite far from the plans of PGIRS. The evolution of CDW management is shown in Figure 1 (dashed line). In Colombia, the comprehensive management of construction and demolition waste is governed by several standards [31]: Resolution 541 of 1994 “By means of which the loading, unloading, transport, storage and final disposal of rubble, materials, elements, concrete and loose aggregates of construction, demolition, organic layer, soil and excavation subsoil is regulated” [33]; Decree 948 of 1995 “Regulations in relation to the prevention and control of atmospheric pollution and protection of air quality” [34]; National Decree 1713 of 2002 Article 44 “Collection of rubble. It is the responsibility of the producers of rubble to arrange its collection, transport, and disposal in authorized dumps. The Municipality or District and the company that provides the cleaning service are responsible for coordinating these activities within the framework of the programs established in the PGIRS plans [35], which is also regulated by Law 1259 of 2008 by means of which the application of the environmental directive is established in the national territory against the violators of the rules of cleanliness, cleaning and collection of rubble” [36]; Decree 2981 of 2013 “By which the provision of the public cleaning service is regulated” [37]; and Resolution 472 of 2017 “By which the comprehensive management of waste generated in construction and demolition (CDW) activities is regulated and other provisions are issued” [38].

3.2. CDW Quantification

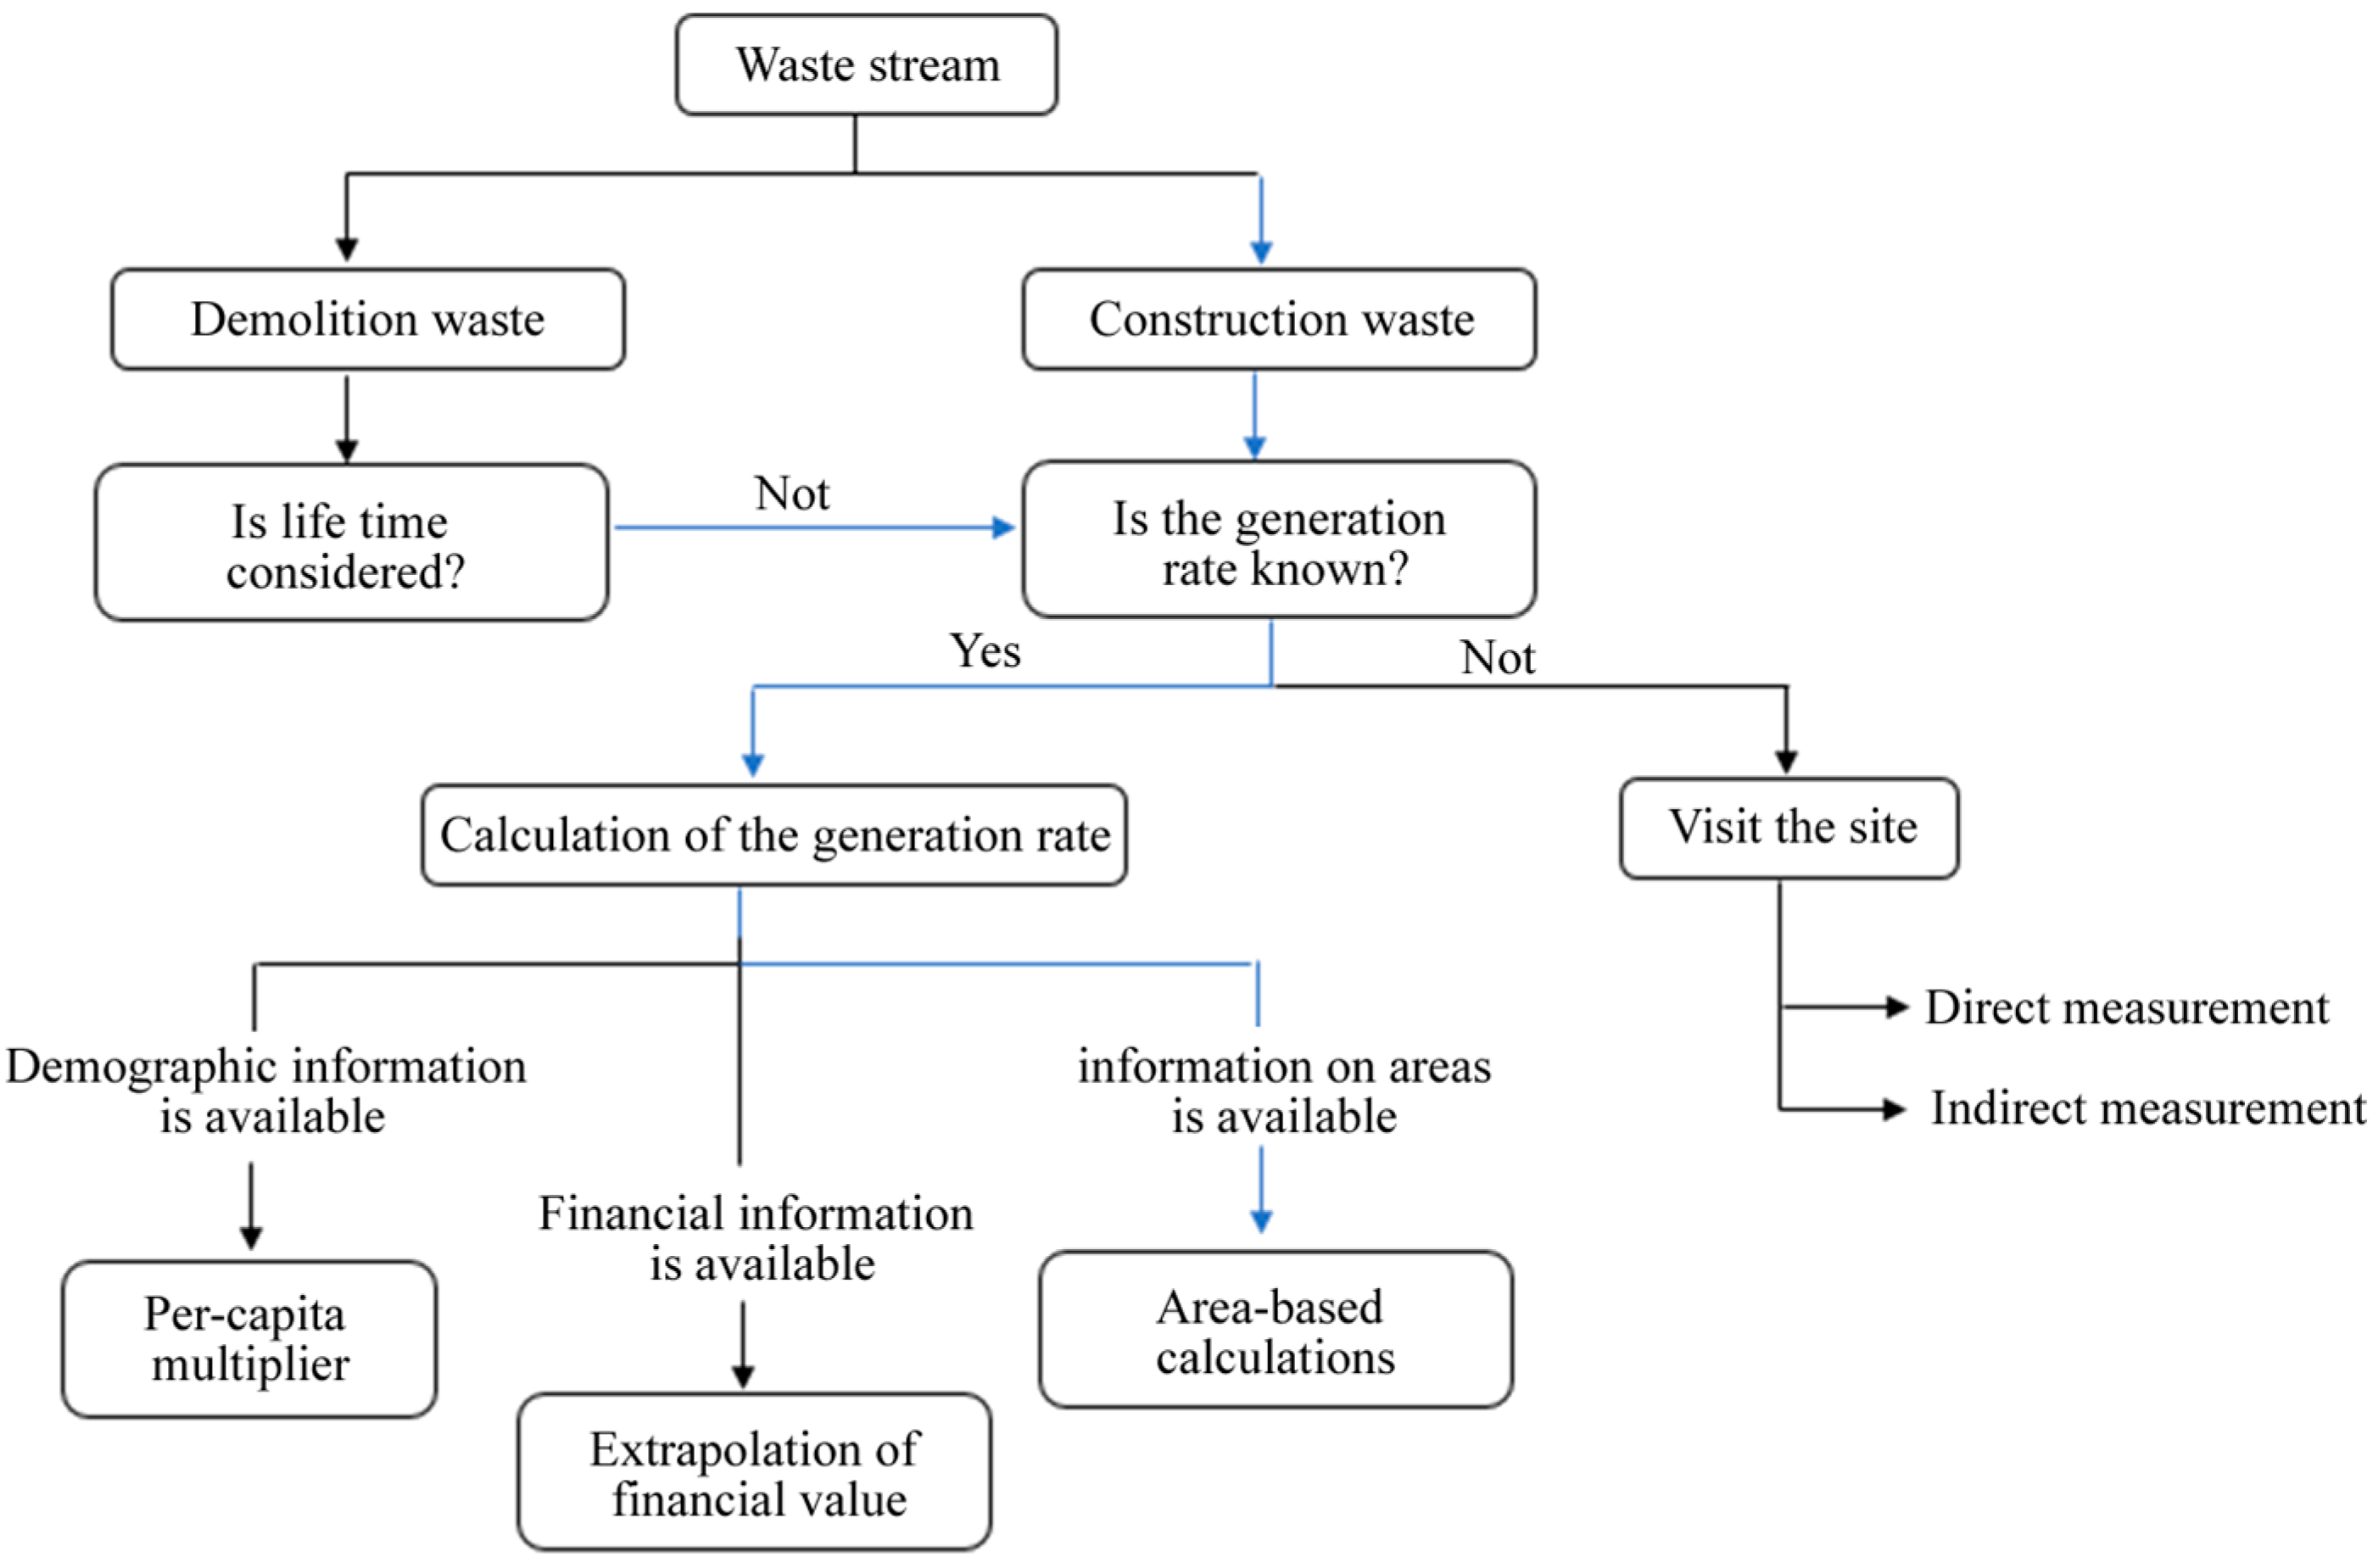
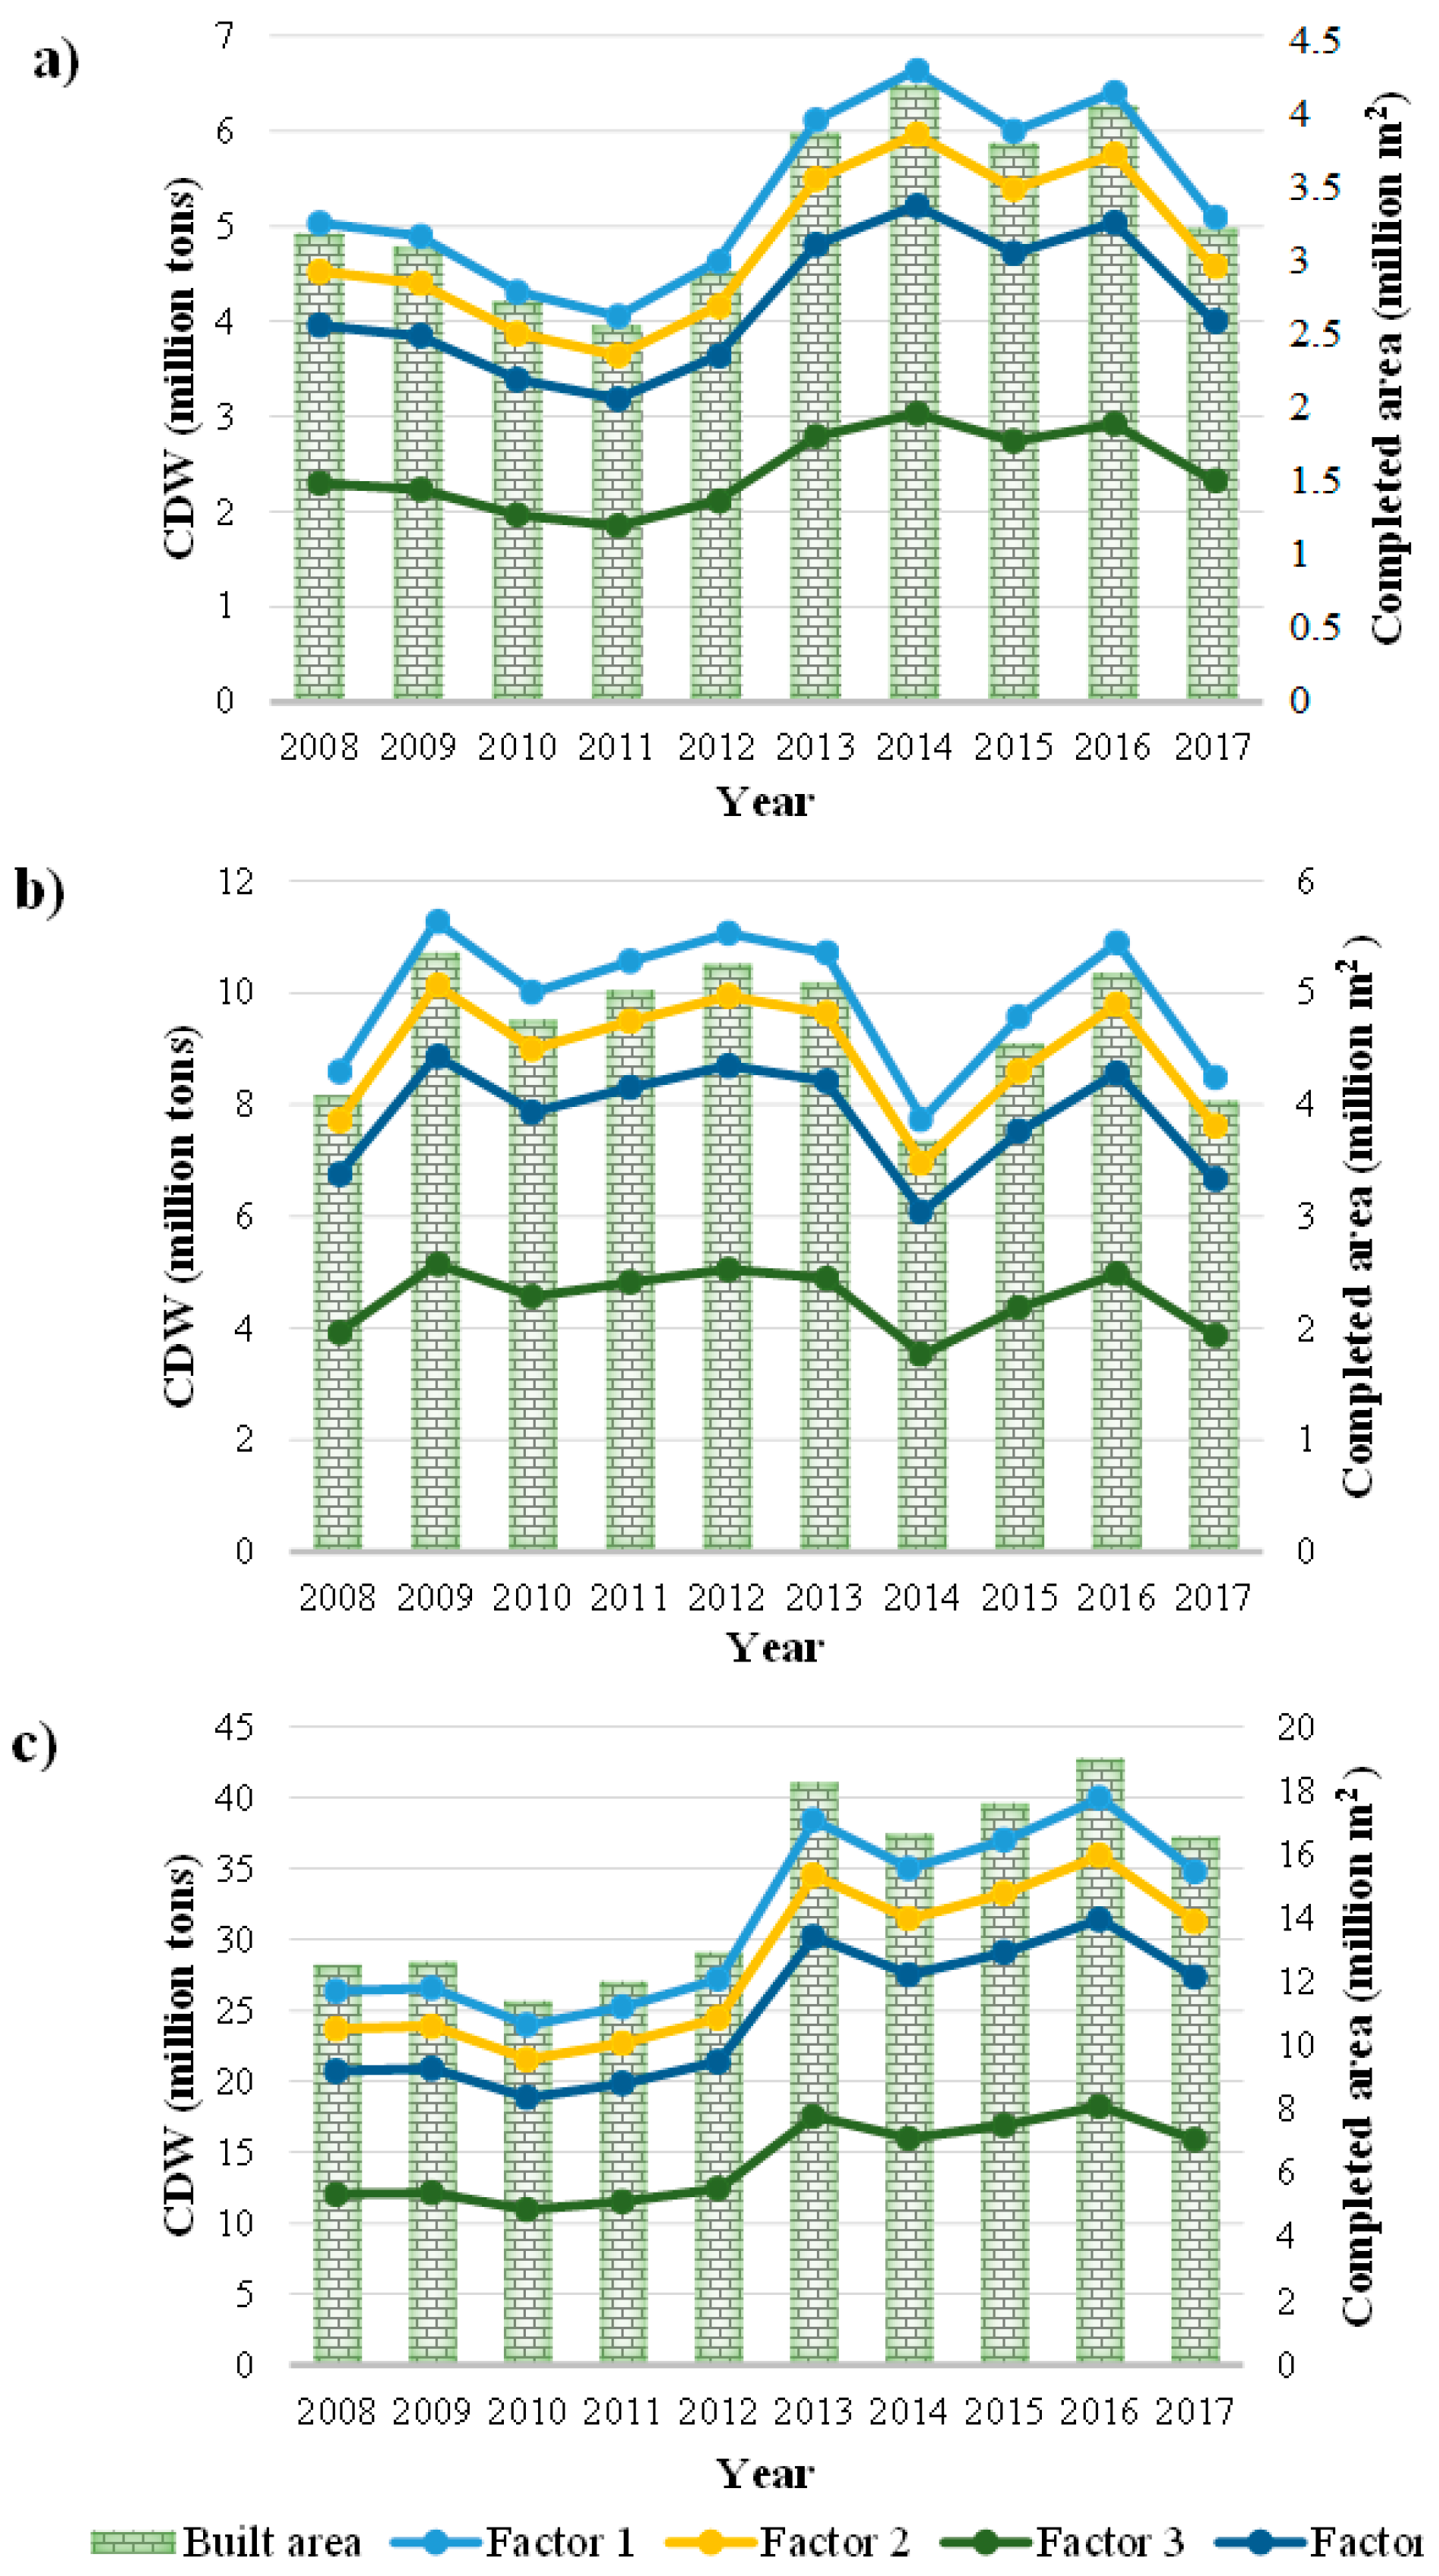
The process to select the appropriate methodology is shown in Figure 2. Figure 3 shows results from the quantification method used to calculate the waste generation rate based on the construction area and the aforementioned factors. The amount of construction and demolition waste generated was recorded from 2008 to 2017 for the cities of Bogotá and Medellín in Colombia, as well as Colombia as a whole.
Considering the information available from the Ministry of Environment and Sustainable Development and the Institute of Environmental Studies, it was found that by 2011, the main cities in the country (12 of Colombia’s 32 cities) had generated 22 million tons of CDW. In the year 2015, the city of Bogota generated approximately 8 million tons and the city of Medellin generated approximately 2.2 million tons [31]. These data serve as a reference value to compare against the new data obtained in this investigation.
Figure 3a shows the amount of CDW generated in the city of Medellín. It can be seen that when using Factors 1, 2, and 4, it is above the reference value, which is 2.2 million tons for the year 2015. In contrast, when using Factor 3, the CDW generated is close to the reference value.
The CDW generated in the city of Bogota is shown in Figure 3b. It can be observed that when using Factor 4, the value of CDW generated is the closest to the reference value, which is 8 million tons for the year 2015. When using Factors 1 and 2, the CDW generated is above the reference value, and when using Factor 3, it is below the reference value.
This behavior also happens for the CDW generated in Colombia, which can be evidenced in Figure 3c. It is clear that when using Factor 4, the CDW is the closest to the reference value, which is 22 million tons for the year 2015. When using Factors 1 and 2, the CDW generated is above the reference value, and when using Factor 3, it is below the reference value.
In general, it should be noted that the reference values were only obtained from legally reported CDW, which is certainly below the real data as illegal CDW disposal is not registered. In addition, the reference value does not include all 32 Colombian cities due to the lack of information in some parts of the country. Furthermore, Factor 3, which is based on the Fatta model, assumes that for every 1000 m2 of construction, 50 m3 of CDW is generated; in reality, more m3 of CDW is generated, meaning that the results obtained are below the reference values. As a result of the aforementioned issues, this research focuses on Factor 1.

3.3. CDW Characterization in Colombia

3.3.1. X-ray Diffraction (XRD)

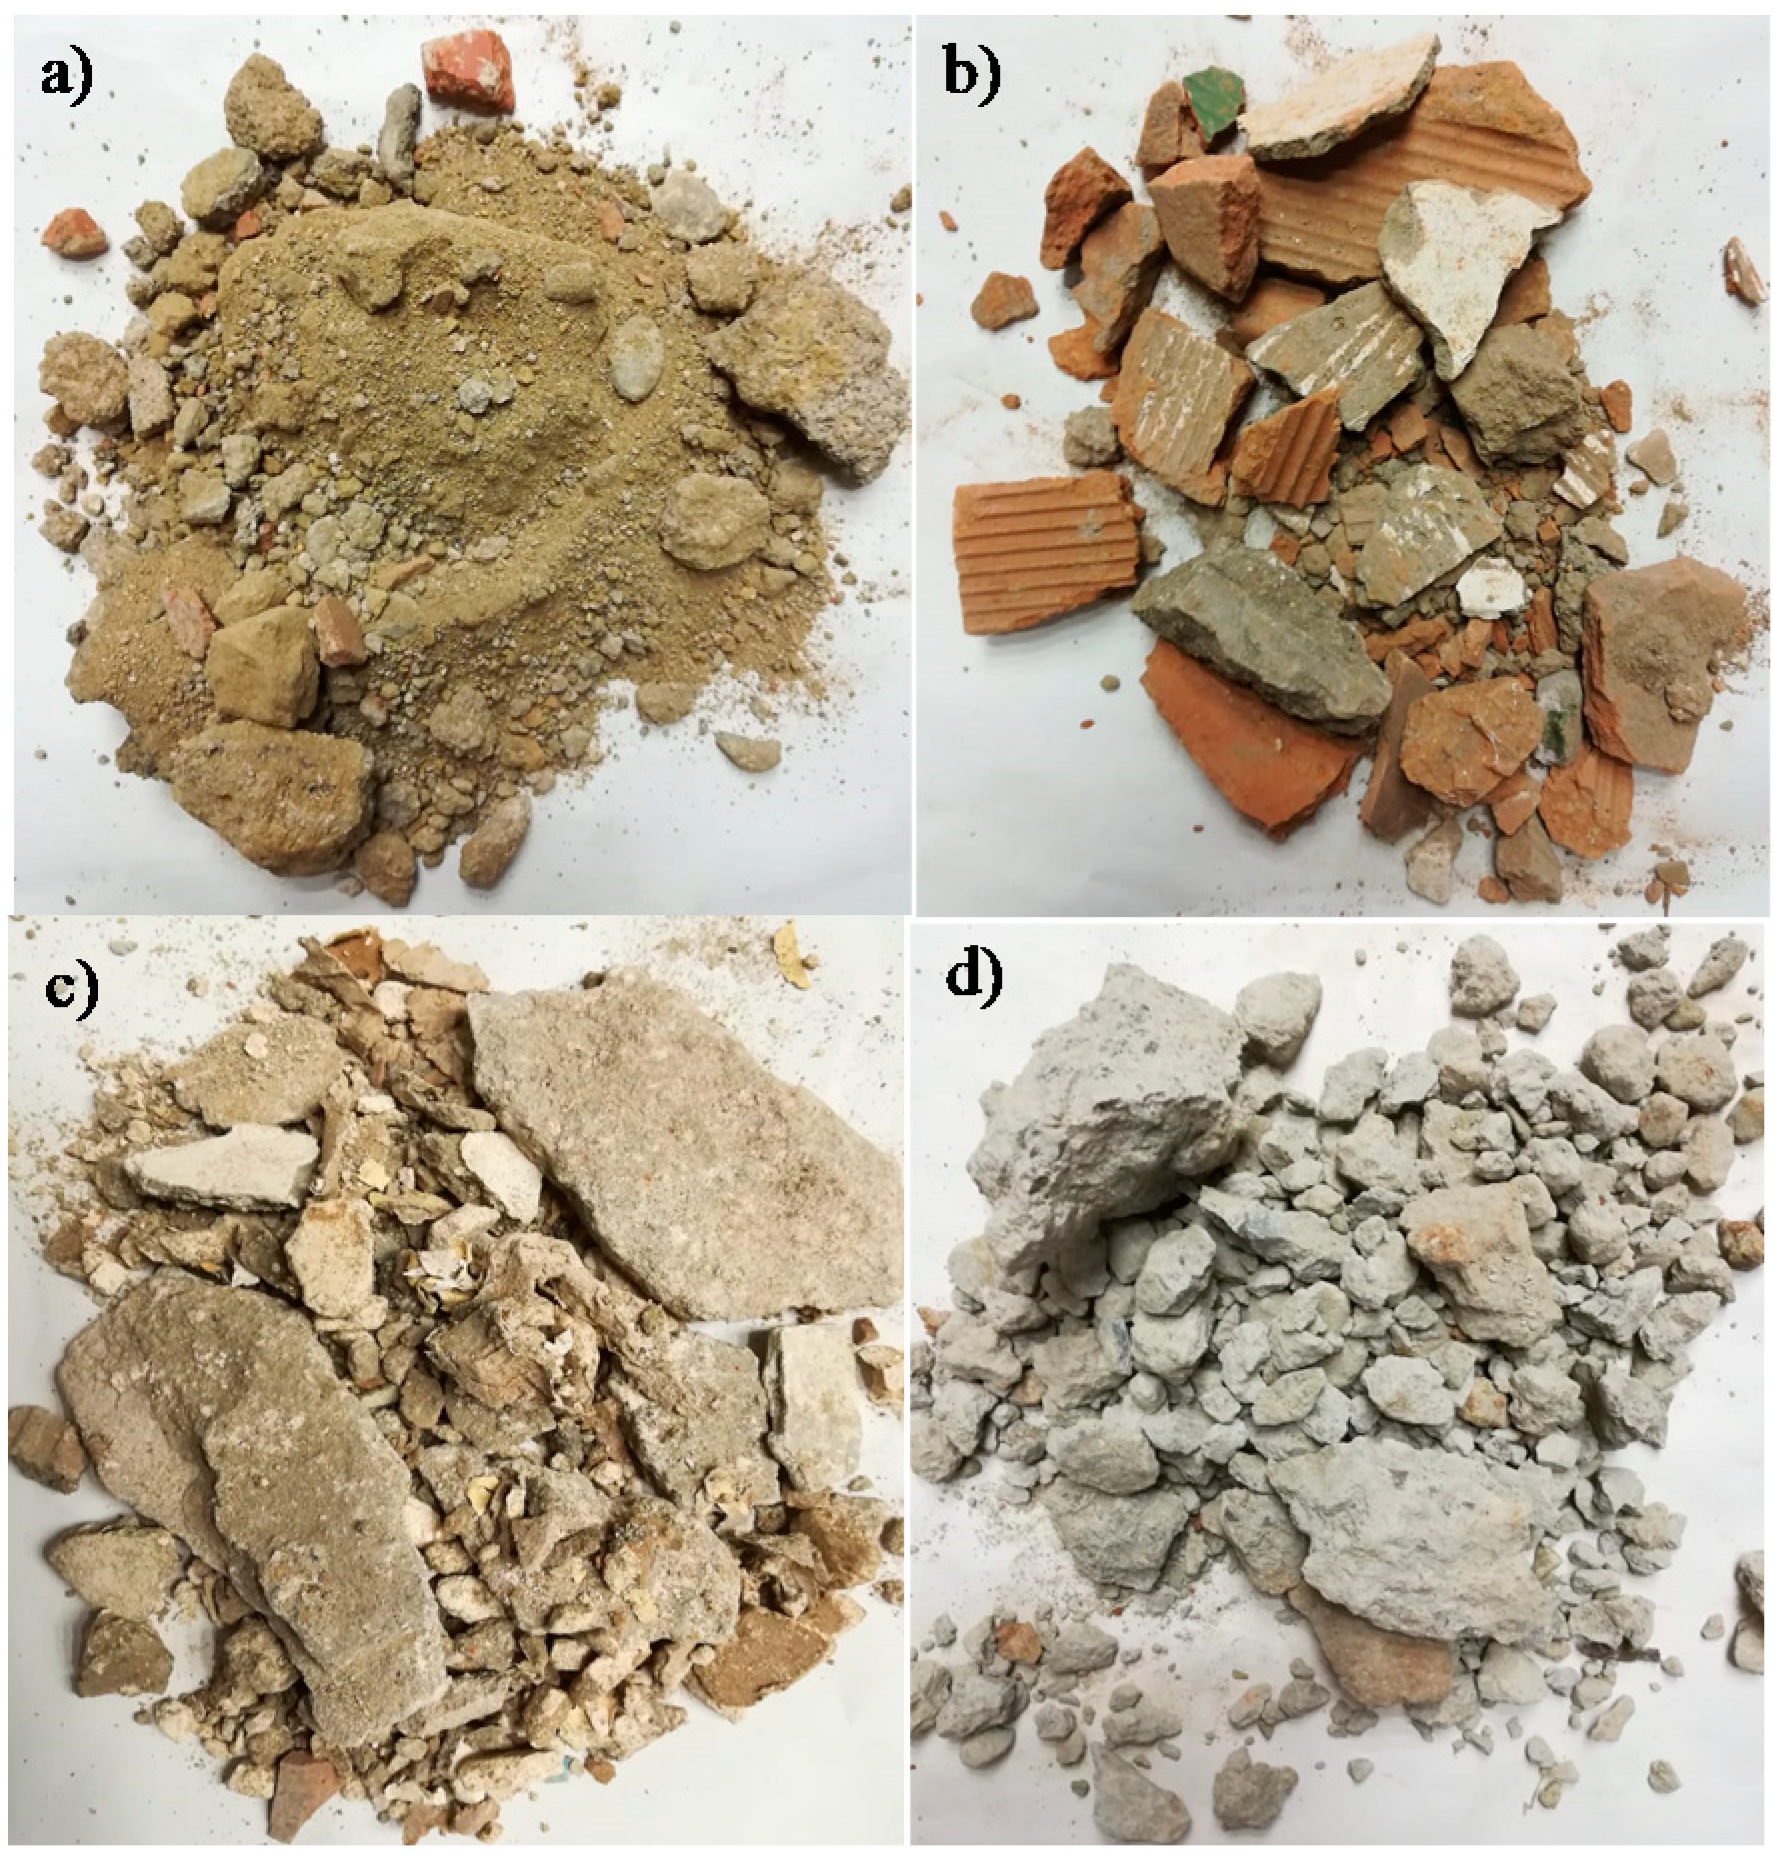
Figure 4 shows the morphologies of some CDW samples obtained from La Pradera landfill without any type of treatment. Figure 4a shows CDW with combined powders of concrete and red clay products, Figure 4b shows mostly bricks, Figure 4c shows CDW mainly composed of concrete but with some red clay products, and Figure 4d shows mostly clean concrete waste.
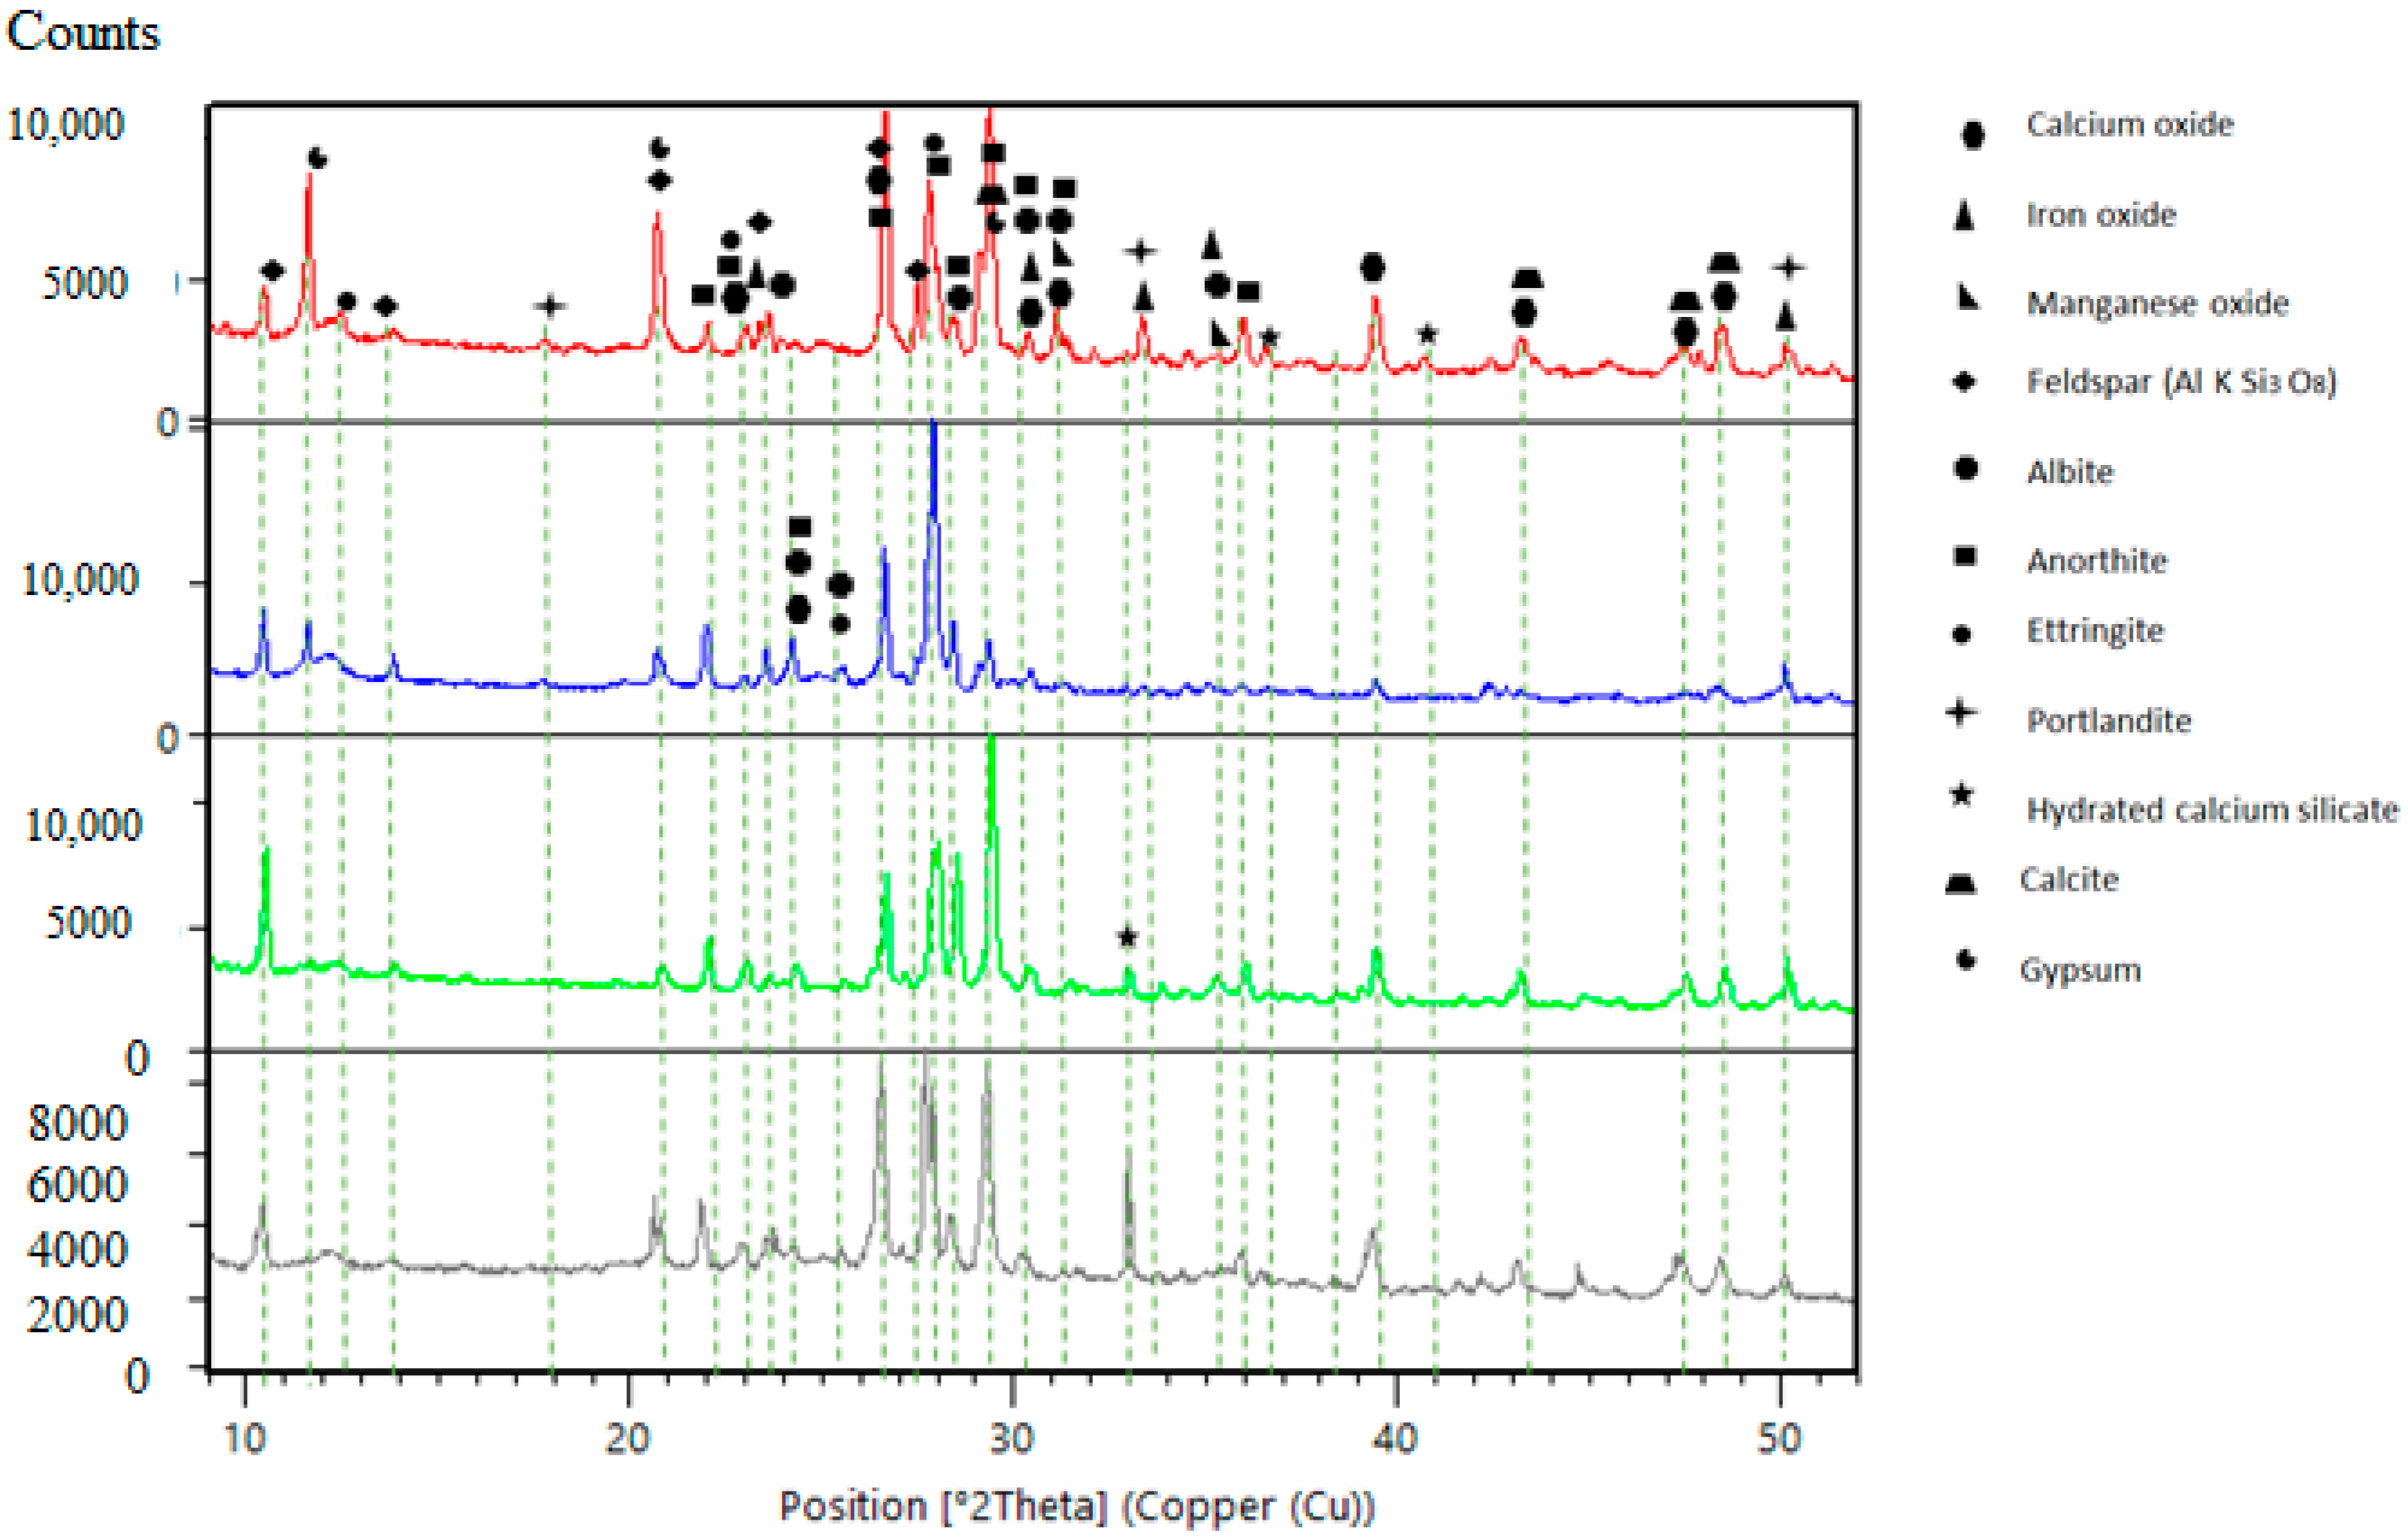
The results of the XRD analysis obtained from the construction and demolition waste samples are shown in Figure 5. The main phases found are calcium oxide, iron oxide, magnesium oxide, feldspar (AlKSi3O8), Albite, anorthite, ettringite, portlandite, silicate and hydrated calcium calcite and gypsum. These phases are consistent with those found in bricks, tiles, ceramics, and concrete. It can also be seen that the same phases are found in the four diffractograms. Only the intensity of the peaks changes.

3.3.2. Comparison of CDW Composition

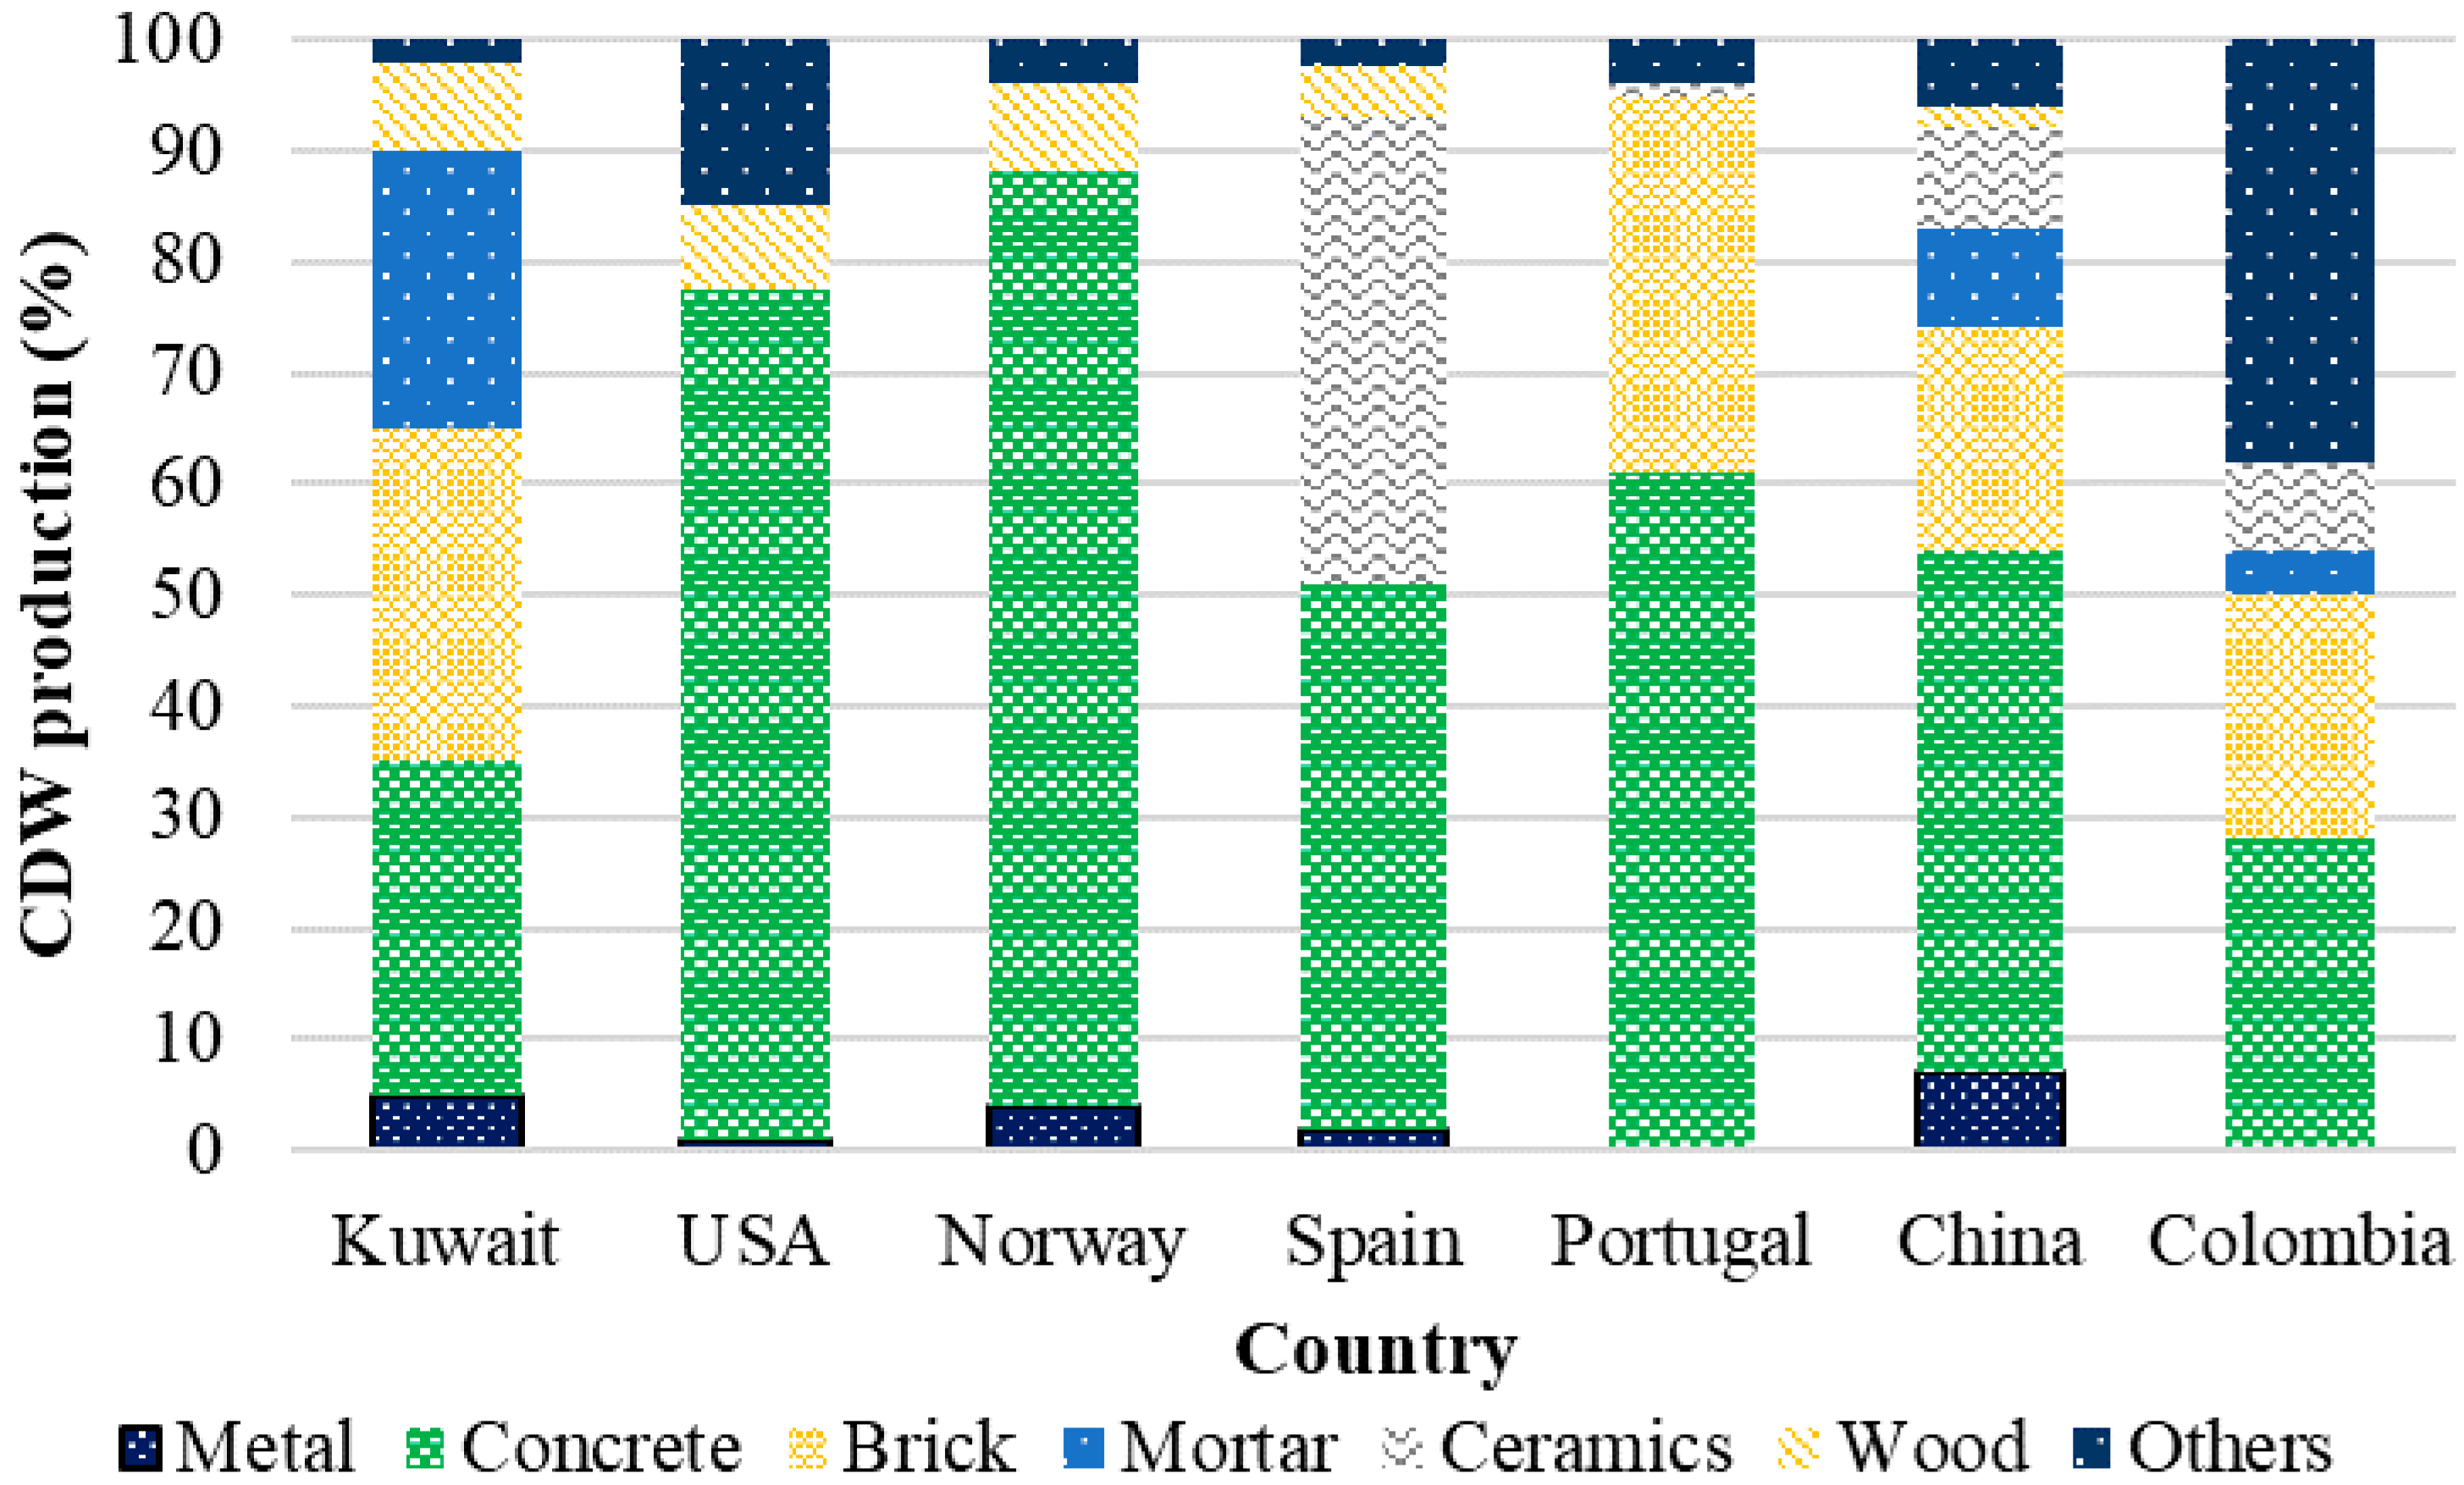
Considering the results of X-ray diffraction data and the information available in the literature, the composition of the CDW generated in Colombia was compared with that generated in other countries. Figure 6 shows the composition of the CDW generated in Colombia. Waste classified as others contributes 38%, concrete contributes 28%, brick 22%, ceramic 8%, and mortar 4% [39]. In addition, it can be seen that China has the highest percentage of metallic materials, which are insignificant in the United States, Norway, and Colombia. In all countries, inert waste, which includes concrete, mortar, brick, and ceramics, makes the following contributions: 85% in Kuwait, 84% in Norway, 77% in the United States, 91% in Spain, 96% in Portugal, 87% in China [40], and 60% in Colombia. The difference in these values is due to the variety of construction structures and materials used in the different countries, mainly due to the difference in climates, cultures, and types of construction.

3.4. Econometric Analysis

3.4.1. Correlation Analysis

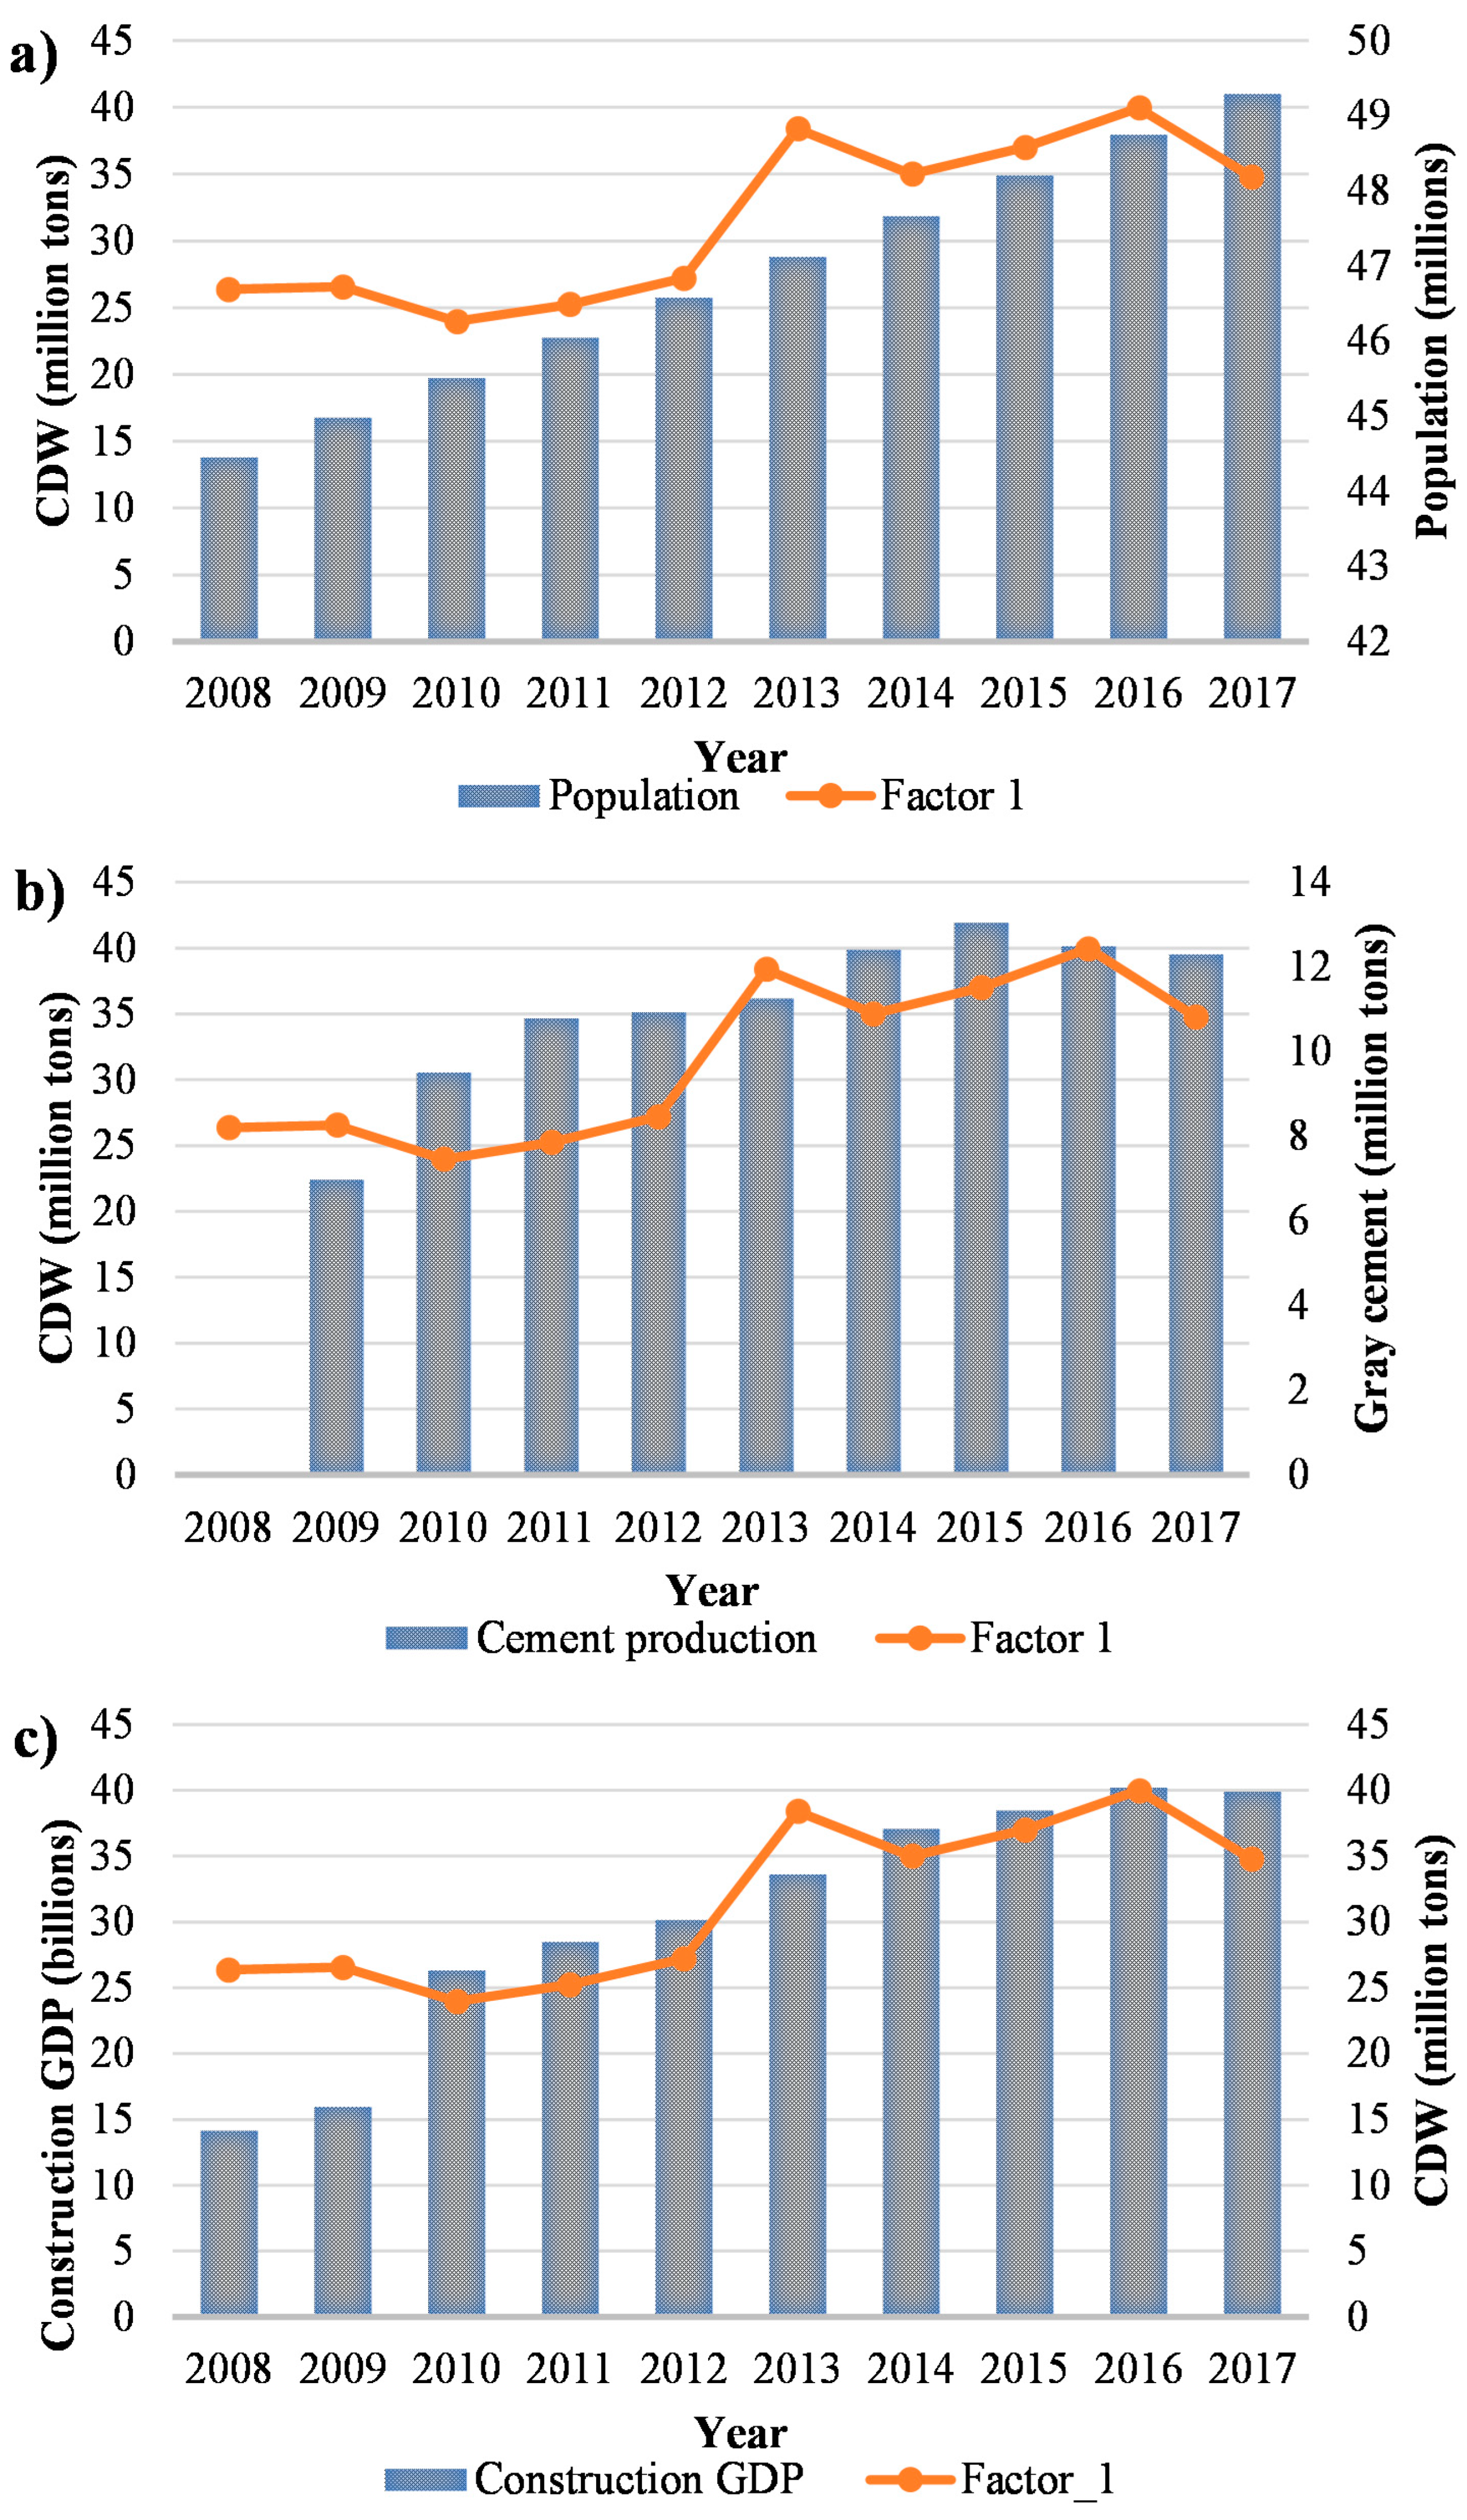
In order to carry out this study, it had to be discovered which factors were related and which were the most appropriate to estimate the generation of CDW in Colombia. Figure 7 compares the construction and demolition waste with the population, gray cement production, and gross domestic product (GDP) from construction in Colombia. In Figure 7a, it can be seen that the population has an increasing linear growth through the years, while the amount of CDW increases or decreases. This shows that, in general, the population growth does not significantly affect the amount of CDW generated annually. Figure 7b shows that cement production varies over the years, but this variation does not have the same trend as the CDW generation. Figure 7c reveals the GDP from construction, which shows that GDP decreases or increases with a similar trend to the generation of CDW. The flow of CDW and GDP from construction was determined through time and is presented in Figure 8a. The flow of GDP from construction can be seen to increase with time, while the flow of CDW (waste generated) decreases in the periods 2008–2009, 2009–2010, and 2013–2014, which is due to a decrease in areas being built on during this time. Figure 8b shows the correlation between the flow of CDW and the flow of GDP from construction, giving a value of 0.7104, indicating that the model estimates fit quite well.

3.4.2. Filters for Cyclic Components

The Hodrick–Prescott filter was originally designed to decompose the series of GDP values into long-term growth and a cyclical component. In the context of CDWs, the soft part can be interpreted as the long-term seasonal component or trend and the volatile part as the stochastic component [41]. The Baxter–King filter consists of a linear filter that eliminates very slow or low frequency movements (trend) and high frequency components (irregular), while retaining the intermediate components (cycle) [42].
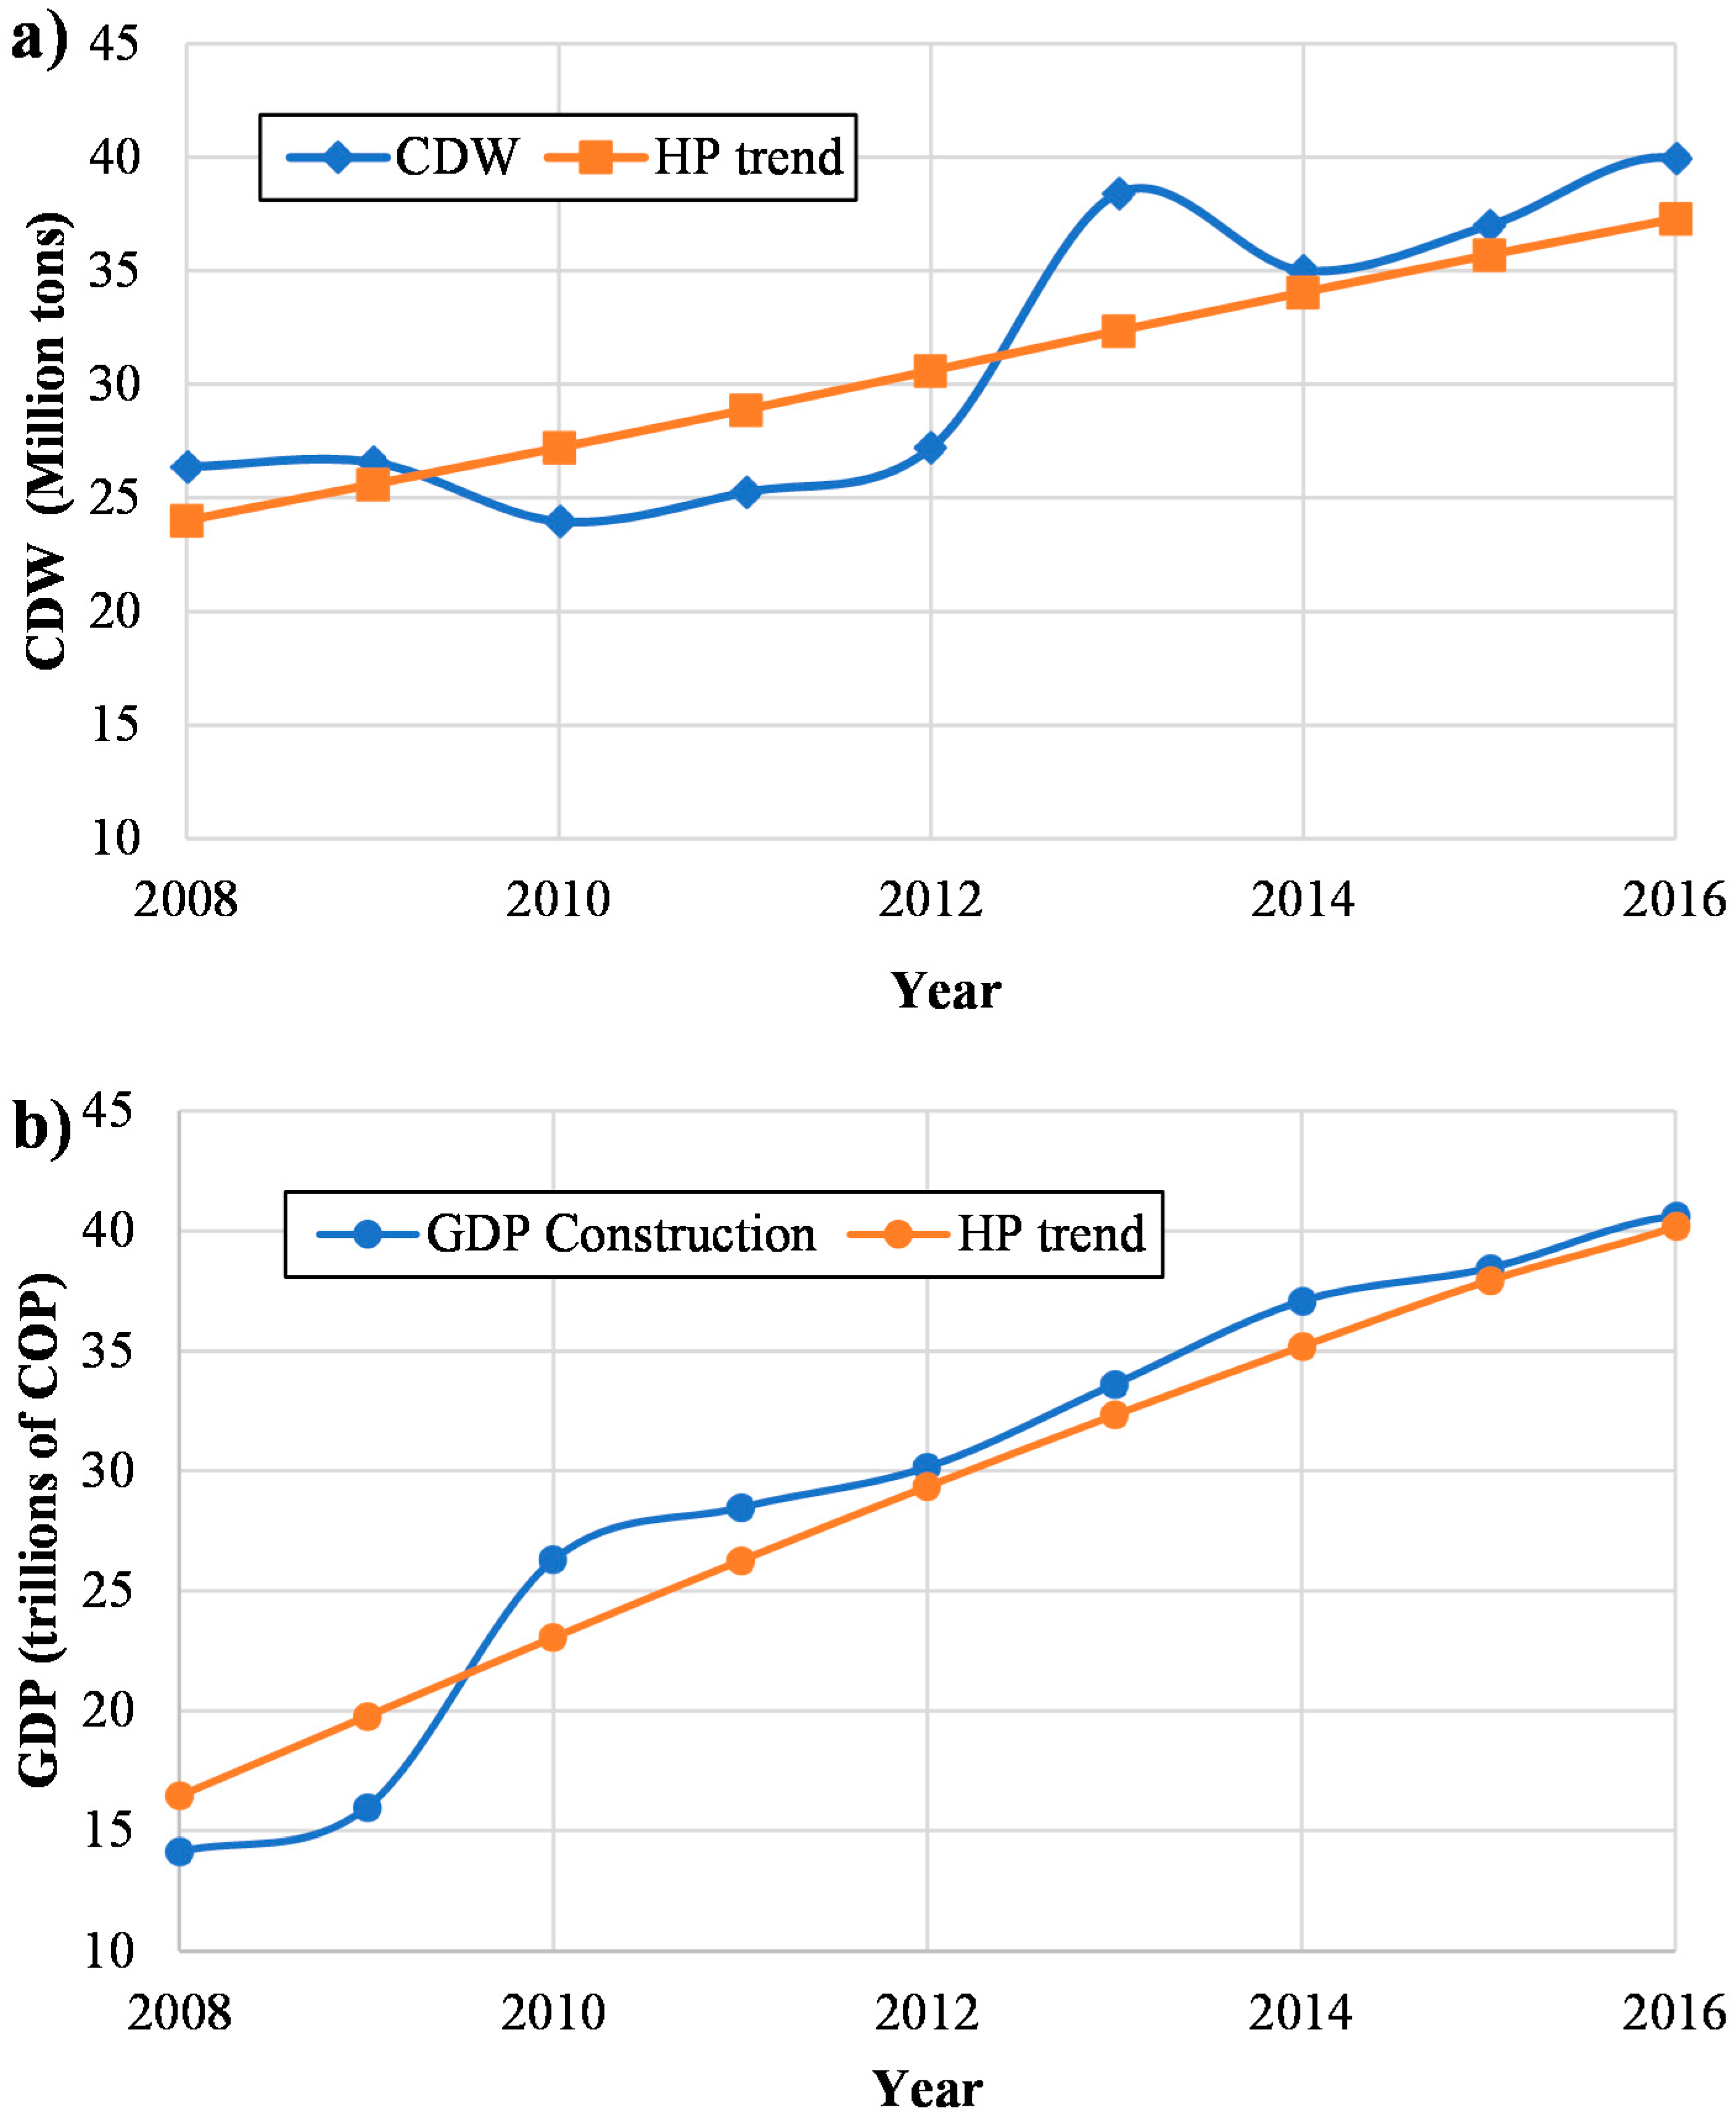
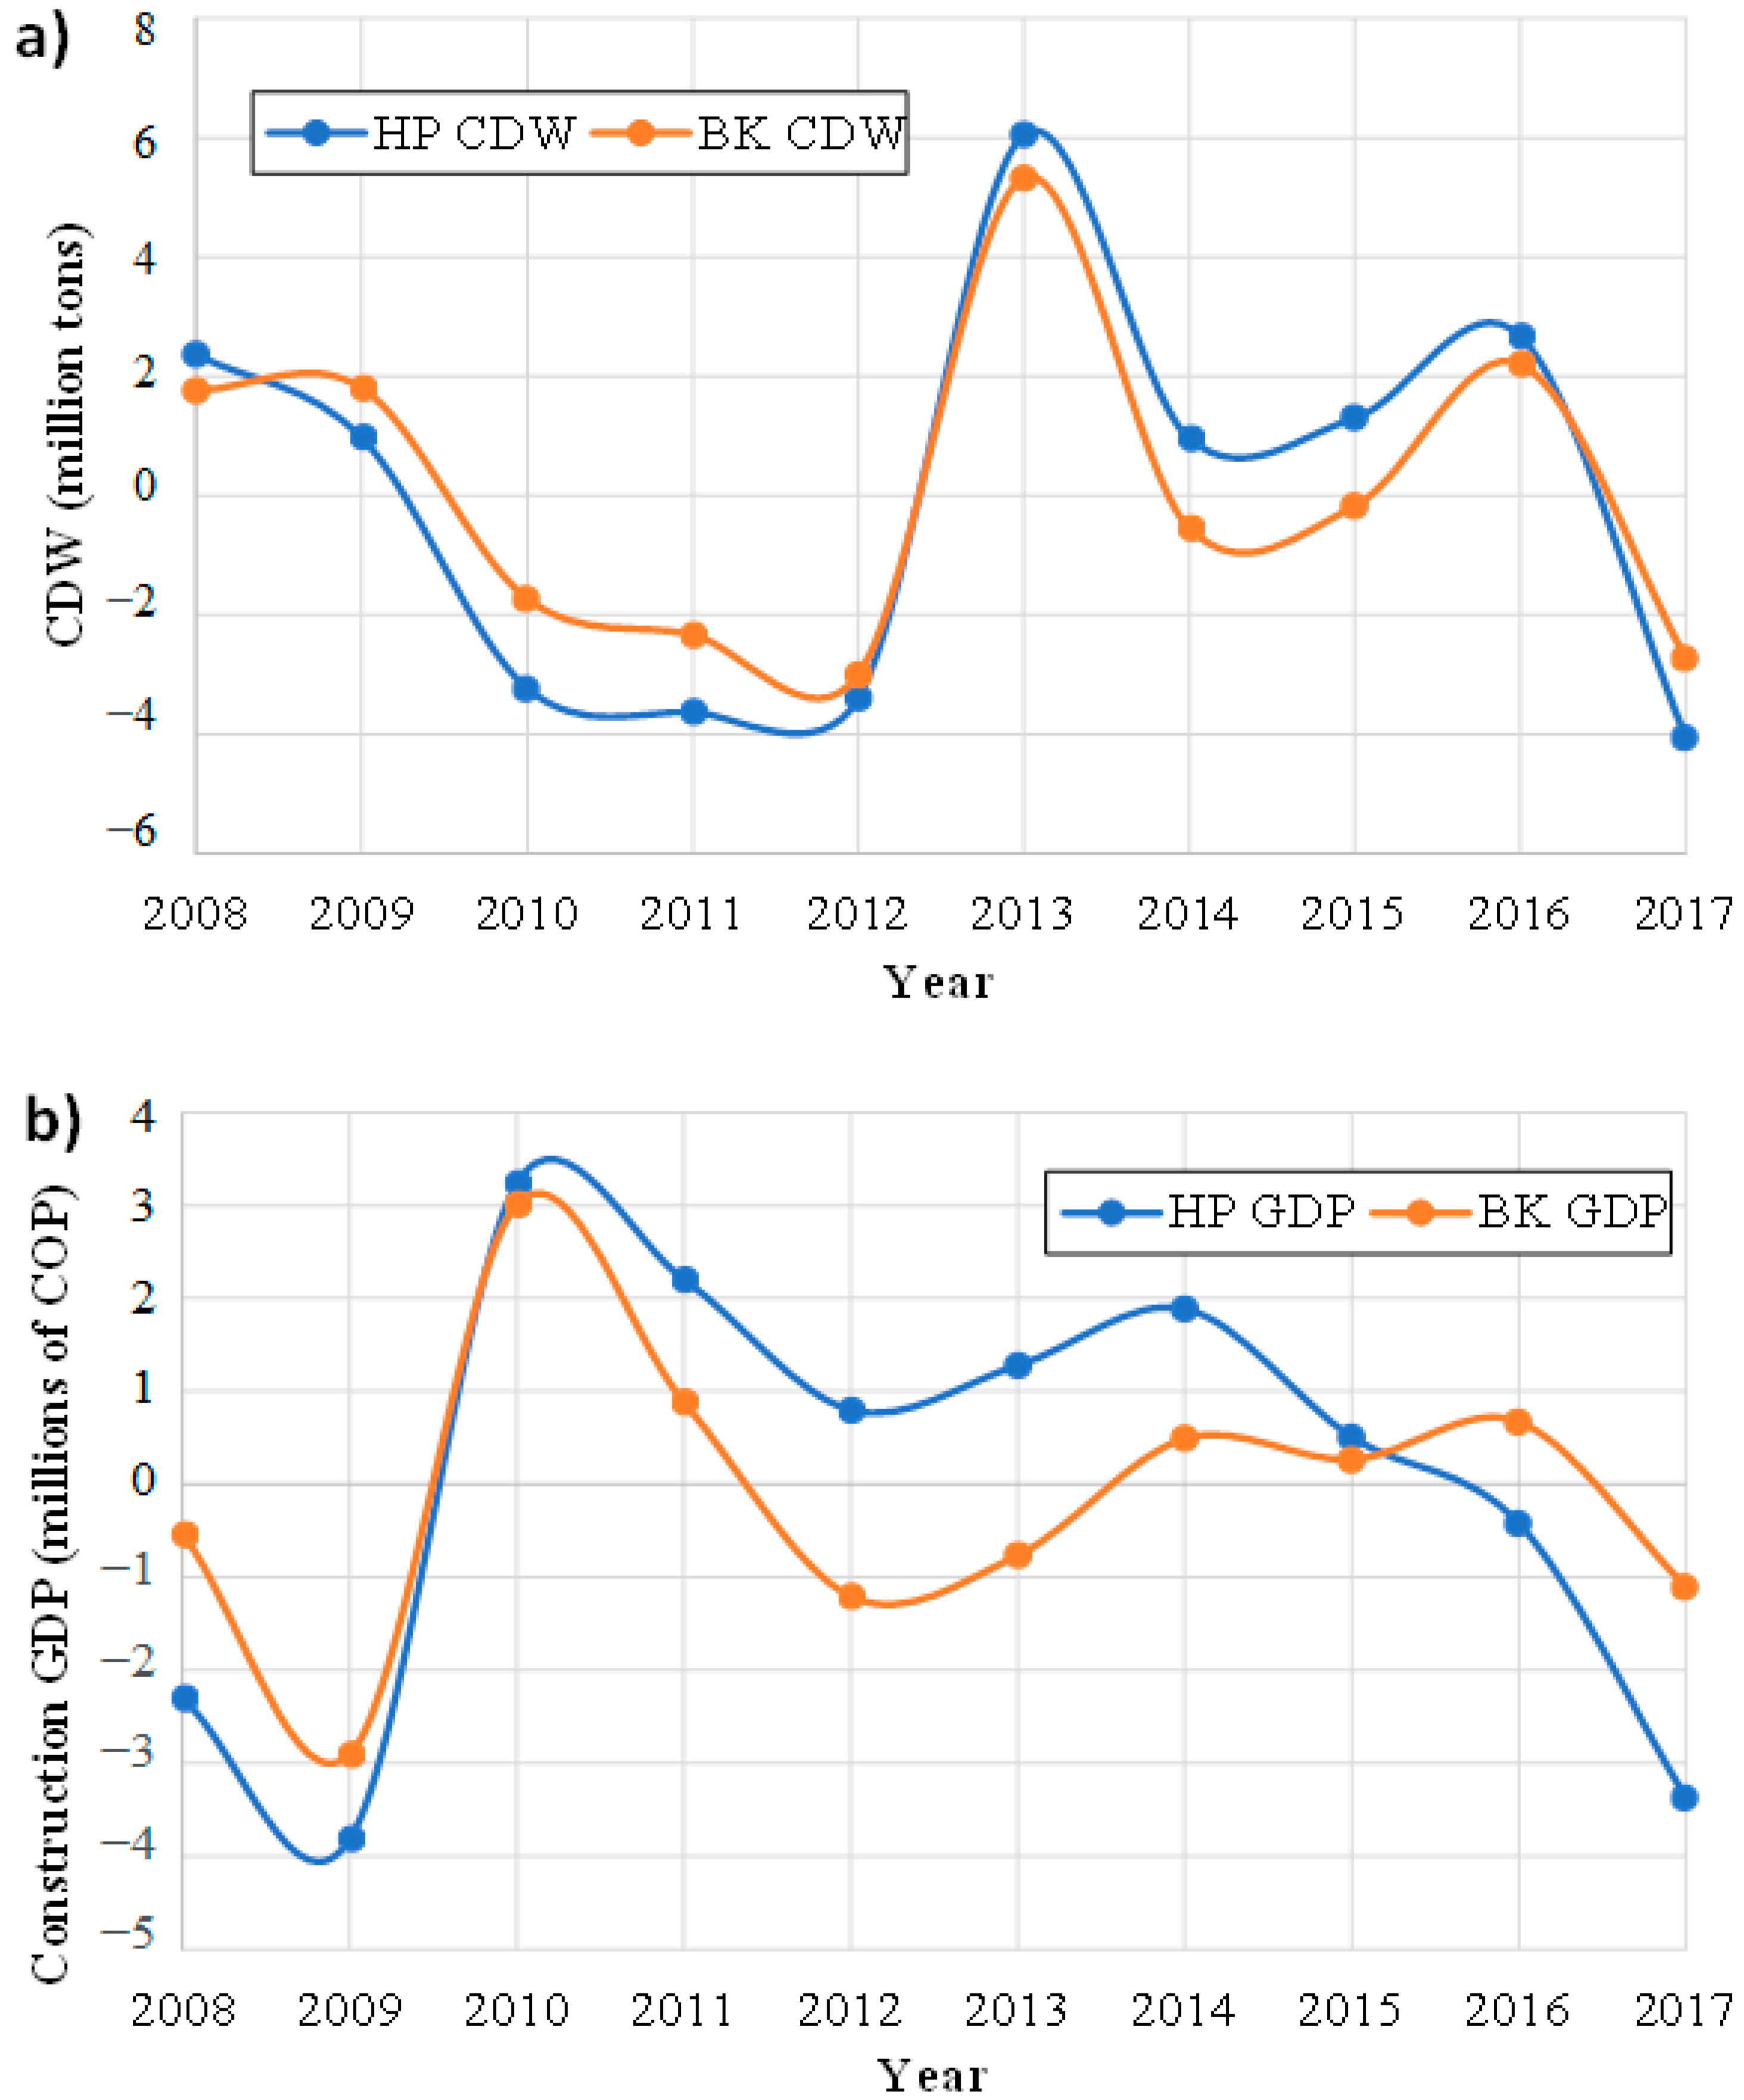
The linear component of the Hodrick–Prescott filter for the CDWs generated in Colombia and the GDP from construction are shown in Figure 9a,b, respectively, while the cyclical component obtained by the Hodrick–Prescott and Baxter–King filter is shown in Figure 10a,b, respectively, for both the CDW generated and the GDP from construction.
In both Figure 10a,b, it can be observed that the CDW cycle has three changes over time. The first corresponds to the period from 2008 to 2012. The reason this period is below the CWD trend is due to a decrease in planning permission granted for construction, in addition to the implementation of laws 1295 and 1333 that refer to environmental penalty fees (comparendos) and environmental sanctioning, respectively. The second change corresponds to the 2012–2016 period. This is above the trend due to the increase in the number of areas granted planning permission for housing construction. The decrease in 2013 was mainly due to the number of areas granted permission for buildings and housing of social interest. The third change corresponds to the 2016–2017 period. The CDW is below the trend line due to the implementation of Decree 1077, which regulates the housing, city, and land sectors with respect to special waste, and due to resolution 472, that requires the comprehensive management of waste generated by construction and demolition activities.
The cycle of GDP from construction shows three changes over time. The first corresponds to the period from 2008 to 2009, which is below the trend. Here, the decrease is due to the financial crisis that caused a collapse in the United States economy. The resulting increase in inflation and rise in interest rates reduced the purchasing power and decelerated loans in the construction sector. Planning approval for construction therefore decreased. It can also be seen that in 2009, there is growth, which is due to the increase in public works and a reduced inflation rate. The second change corresponds to the period from 2009 to 2015. Although the CDW is above the trendline, a decrease is observed due to the delay in the approval times of environmental licenses, which were required before any building work could begin. In 2014, another decrease is seen due to the fall in housing construction. The third change comprises the period from 2016 to 2017, which is below the trendline.

3.5. Information Available in other Countries

3.5.1. CDW in the Latin American framework

The information available on the management and generation of CDW in some Latin American countries is summarized below:
  • Argentina
In general, there are problems with waste management. The Secretariat of Environment and Sustainable Development (SA and DS), dependent on the Ministry of Health and Environment, has designed the National Strategy for Urban Solid Waste (ENGIRSU). The mission of this strategy is to comprehensively manage waste, reduce the disposal of waste in open dumps, and increase its disposal in landfills designed, built, and operated in an appropriate way in a program that transfers, recovers, recycles, and finally disposes of urban solid waste and CDW [43]. To promote better management of CDW in Argentina, incentives are granted to companies who recover or reuse materials in order to mitigate the impact on the environment [44].
  • Bolivia
The 2011 Solid Waste Management Diagnosis established that at a national level, there is no adequate management of this type of waste. CDW is deposited in public areas, rivers, streams, vacant lots or along the entrance roads to dumps. Despite the existence of local ordinances and regulations, the corresponding actions are not carried out correctly. Recently, in the main cities of the country, service companies, through municipal ordinances, have been regulating the collection and final disposal of construction waste [45].
  • Brazil
The Brazilian model establishes in its Resolution CONAMA No. 307/2002 [46] all actions that must be carried out to minimize the generation of waste, and the technical aspects of its treatment, transport, and final disposal. Waste material is classified to obtain the maximum possible separation, in order to minimize transportation costs and to contribute to recycling and reuse of materials, thus reducing the burden on the environment.
Due to this resolution, Brazil became the first country in Latin America to have a recycling plant for CDW, through Resolution 307 created by CONAMA in 2002, which specifically establishes the guidelines for the management of construction waste; from there, municipalities such as Sao Pablo, Salvador, and others have taken better actions to maximize the recycling of CDW.
  • Chile
The Environment Committee of the Chilean Chamber of Construction, the company signatories of the APL (Clean Production Agreement), together with the support of a Development Project (PROFO) of the Production Development Corporation (CORFO) [47], created the company Regeneradora de Materiales de la Construcción S.A (REGEMAC) [48] in the year 2000, which developed a monitoring system for 100% of waste collected. This describes the life cycle of the waste, from its origin to its final disposal. In the metropolitan region, there are places designated by SEREMI for the disposal of rubble and inert materials to ensure this waste is properly disposed of.
  • Costa Rica
Costa Rica is developing a comprehensive solution for the management of CDWs, guiding the government and private sectors to promote the reduction of waste, the recovery of materials, the use of energy, and the treatment of waste, as well as promoting competitiveness and environmentally friendly behavior in the private sector [49].
  • Ecuador
In Ecuador, it has been established that the Municipal Decentralized Autonomous Governments are directly responsible for the management of their solid waste. However, very little management actually takes place since most municipalities have created units to provide the service under the hierarchical dependency of the hygiene directorates, while other municipalities manage waste through the municipal police stations, which have a weak institutional image and do not have administrative or financial autonomy [50].
  • Mexico
CDW management presents serious deficiencies because few entities have adequate infrastructure for waste management. Only in the Federal District were recycling plants identified as being in operation. Although most of the CDW generated in small construction projects is removed by private cargo vehicles, just over 5% is transported by municipal solid waste (MSW) collection vehicles, and it is estimated that about 10% of waste is disposed of on conservation land and public roads. In the case of public and private works, it is estimated that 67% of their waste is transported by private cargo vehicles. Only 20% is disposed of in authorized sites, and only 3% is recycled. The rest is used for land releveling and taken to landfills [51]. Most of the CDW is deposited in abandoned properties and public roads; another part is deposited in landfills, where, due to its characteristics and volume, its useful life is short. Only a small part of the waste is deposited in sites specifically designed for this purpose. Just four states in the republic have authorized final disposal sites, including Mexico City, the State of Mexico, Guanajuato, and Baja California [52].
  • Panama
There is no specific regulation for the management of CDW; therefore, its management is at the discretion of the project owner or contractor. The final disposal of CDW is carried out in public roads, public drainage systems (sewerage), vacant lots, and riverbanks and streams, and close to the limits of protected areas, natural parks, and mangroves. It is also disposed of in clandestine dumps and landfills for neighborhoods and road infrastructure projects. The National Council of Private Companies and the National Cleaner Production Center in Panama proposes regulations for the proper management and use of CDWs, promoting a culture wherein waste is separated from the source and classified as well as other important initiatives for the proper management of CDW [53].
  • Peru
It is the obligation and responsibility of the related institutions to coordinate ways to reduce CDW, and its reuse, storage, collection, commercialization, transport, treatment, transfer, and final disposal. The projects included in the National System for Environmental Impact Assessment (SEIA) must formulate a waste management plan including technical and administrative procedures [54]. Because in Peru there are few waste dumps for the final disposal of CDW, a large amount of construction waste is dumped into the sea and onto riverbanks without prior treatment [55].
  • Dominican Republic
The Dominican Republic does not have specific regulations for the treatment of CDW. This waste is generally managed irregularly and deposited in makeshift places, including sidewalks, wetlands, parks, and riverbanks, without permits. Since there is no coherent national policy for the management of CDW, companies who generate it are responsible for its disposal. The legislation issued by the Ministry of Environment and Natural Resources regulates the operation of landfills [56].

3.5.2. CDW in the World

Construction and Demolition Waste Management

Around the world, CDW policies and legislation adopt the 3R or 4R waste minimization system, i.e., reduce, reuse, recycle, and recover [57,58]. This system focuses on four categories: strategies for the management of construction and demolition waste, prevention techniques, and collection, reuse, and recovery practices [59]. The first category includes planning for the management of CDW, taking into account all the areas involved in the construction process. The CDW is identified and quantified in order to decide what treatments are necessary for its separation and recycling. Economic tools that encourage waste management systems and maximize the environmental performance of waste are also taken into account. For prevention and collection, a construction life-cycle study is carried out in the design phase, which demonstrates opportunities for the use of prefabricated and recycled materials and modern construction methods. In addition, success in managing CDW is achieved via adequate logistics and innovation in the practices of handling and storage of the materials. Recovery practices are used in both stationary and mobile plants to maximize the production of high-quality recycled material.

Legislative Framework for the Management of Construction and Demolition Waste

The European Union’s waste framework directive (2008/98/EC) proposed that by 2020 the recycling of non-hazardous CDW should be at least 70% of its weight [23,60]. In Taiwan, CDW must be transported to waste processing facilities [61], while in China and Hong Kong, regulations have been created to encourage the use of recycled construction materials in foundation works and roads, among other areas. In Australia, some policies promote the reuse of CDW at the construction site and the implementation of sustainable construction practices. In the United States, there are laws that specify the use of recycled materials in several infrastructure applications [62].

3.5.3. Comparison of CDW in Colombia and Other Countries

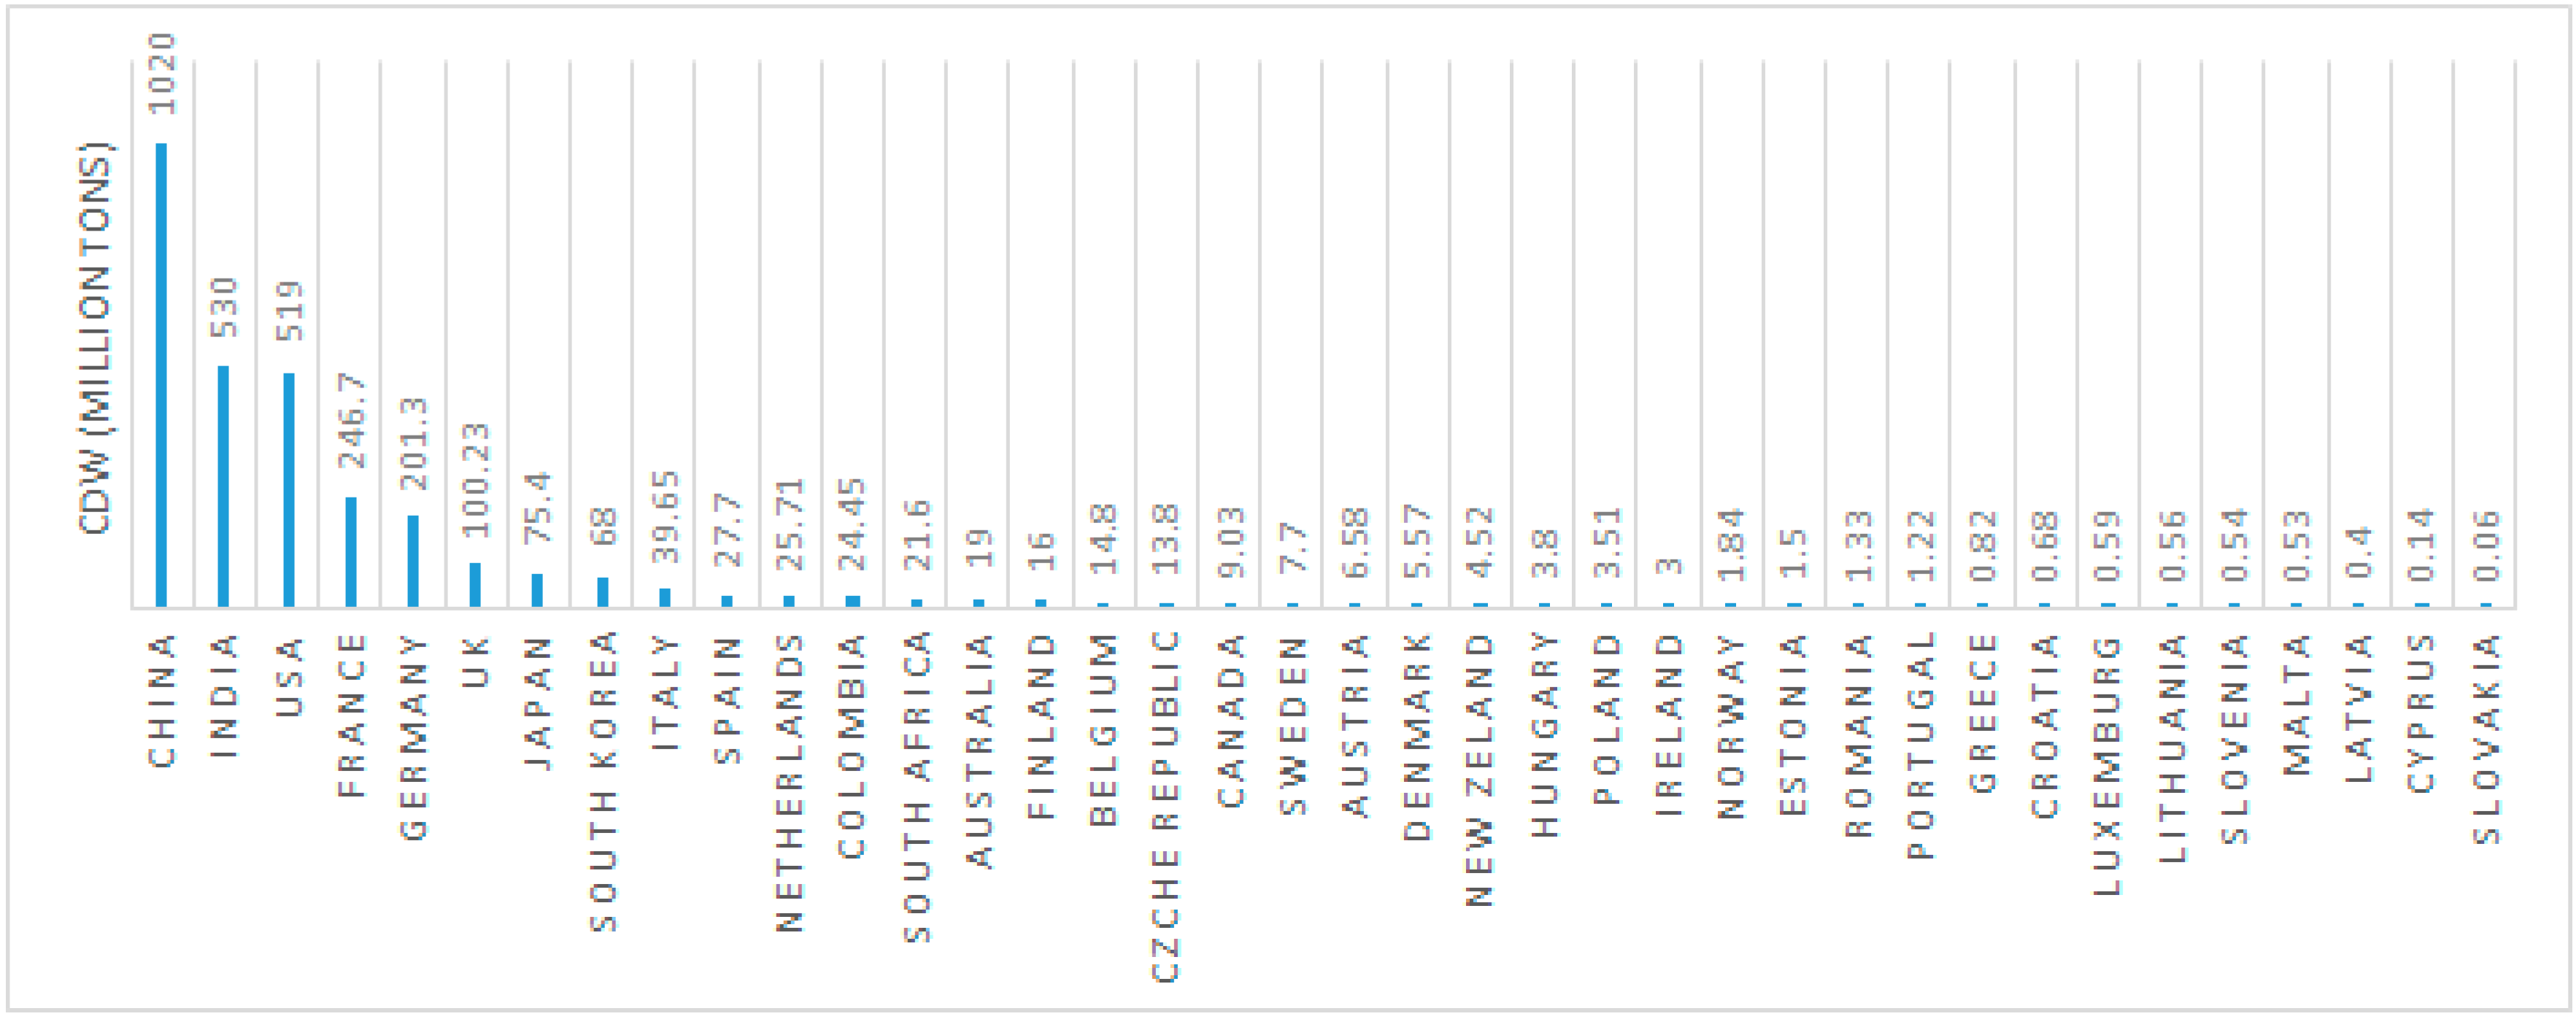
Figure 11 shows the amount of waste generated in 2012 in millions of tons for several countries, among which is Colombia. In this graph, the main generator of construction and demolition waste is China, with 1.02 billion tons, followed by India with 530 million, the United States with 519 million, France with 246.7 million, and Germany with 201.3 million [63]. Colombia ranks 12th with 24.45 million tons of CDW.
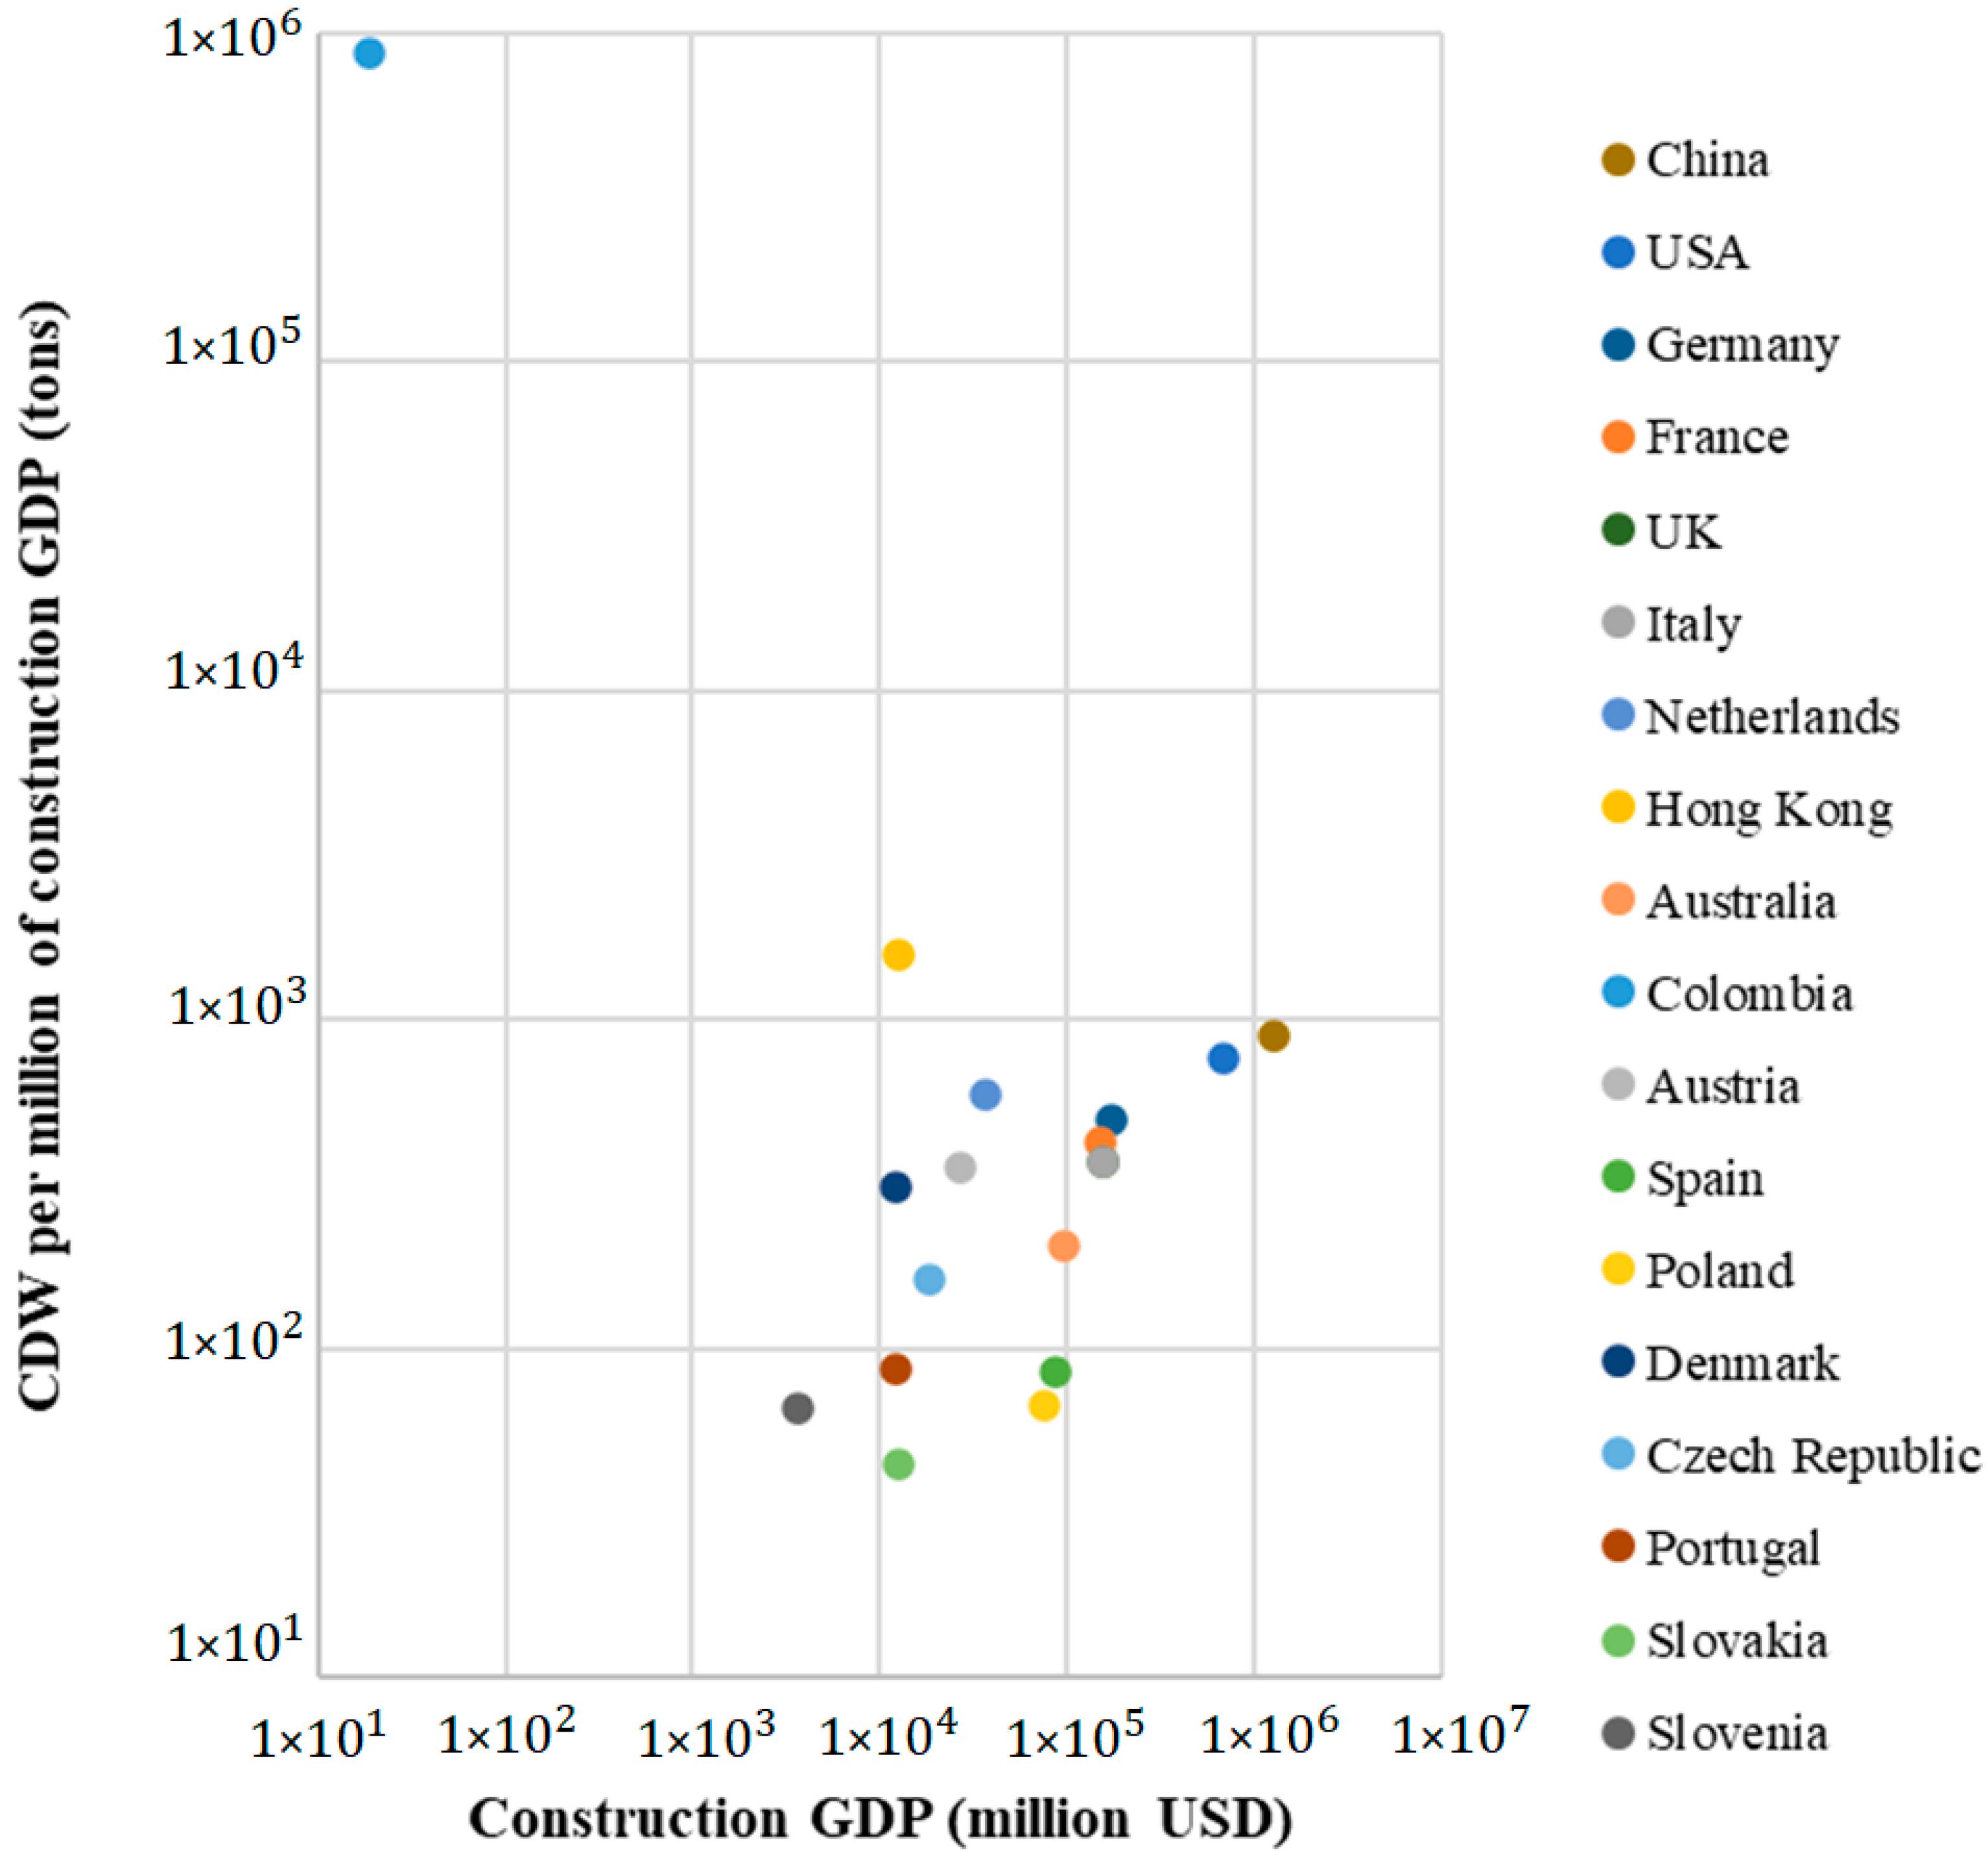
Figure 12 summarizes the CDW generated and the gross domestic product (GDP) from construction for several countries. On average, 400 tons of CDW are generated per 1 million USD of GDP from construction [22]. Taking this into account, countries such as Colombia, Hong Kong, the United States, and China generate more waste than the average, although Colombia is above these countries with 1,697,141 per 1 million USD of GDP from construction. This is because in Colombia, CDW management is inefficient. In contrast, countries like Slovenia, Slovakia, Spain, Poland, and Portugal are well below the average, generating less than 100 tons per million USD GDP.

4. Conclusions

  • The information available on the management of construction and demolition waste in Colombia is very scarce. There is no reliable data on the amount of CDW generated annually. However, taking into account the data that are available, it was concluded that the method used for the quantification of CDW was correct. In addition, when comparing the results of the different factors used for quantification, it was found that Factor 1 best fits with the government data.
  • From the case study, the X-ray diffraction results agree with the information found on the composition of CDW in Colombia, where 62% of the residue is made up of brick, concrete, and ceramic. Subsequently, comparing the composition of CDW in Colombia with that of other countries, little similarity was found in composition. This is because the structures and construction materials used in different countries vary from country to country due to the different construction materials, motivated by variations in climates, cultures, and types of construction.
  • The cycles obtained by the Hodrick–Prescott and Baxter–King filters show similar patterns when describing the movement of the GDP from construction and the CDW generated. However, the Hodrick–Prescott filter gives a smoother graph than the Baxter–King filter. In addition, this research showed several factors that affect both the GDP from construction and the CDW generated.
  • When searching for information on CDW in Latin America, it should be noted that most countries do not have solid data on its generation and quantification. However, with the little information found, it can be concluded that the situation in the region is similar to Colombia in terms of CDW management, which is very limited. It should also be noted that Brazil is the Latin American country that has the best management of this type of waste.
  • Education is one of the most important aspects for the implementation of a sustainable economy, but education is poorly funded in developing countries. Perhaps active learning methods [64] and technologies such as additive manufacturing [65] could contribute to the rapid implementation of circular economy models.
  • It was found that both the management and the legislation of CDW is much more advanced in countries such as the United States, Germany, Portugal, and Spain because they use the 4R system, which minimizes the generation of CDW and reuses the greatest amount of waste possible. In Latin America, CDW management is just starting; thus, there is a lack of any real plans in this area.
  • The differences among the different countries shown in this research revealed that many aspects have to be considered to effectively manage CDW. It is not only the economic aspects of different regions that have a profound impact on waste, but also climate and culture. Thus, the problem should not be left solely to experts and politicians; the real solution will require a multidisciplinary team.
  • The uniformity of materials found in CDW is certainly one of the biggest concerns for its use on a large scale, as the variability from building to building can be high. Using CDW directly from the construction site can optimize transportation but limits its application due to the high variability. Therefore, it is more strategic to process CDW in a large facility in which thousands of tons of materials are mixed and the uniformity can be improved. The experimental case study shown in this research confirms the particularly of the phases found, which may vary significantly not only from region to region but also from country to country.

Author Contributions

Conceptualization, H.A.C.; methodology, H.A.C.; software, A.M.; validation, H.A.C. and A.M.; formal analysis, H.A.C. and S.N.M.; investigation, H.A.C.; resources, H.A.C.; writing—original draft preparation, A.M.; writing—review and editing, H.A.C. and S.N.M.; project administration, H.A.C.; funding acquisition, H.A.C. and S.N.M. All authors have read and agreed to the published version of the manuscript.

Funding

This research received no external funding.

Institutional Review Board Statement

Not applicable.

Informed Consent Statement

Not applicable.

Data Availability Statement

Not applicable.

Conflicts of Interest

The authors declare no conflict of interest.

References

  1. Barbarossa, V.; Bosmans, J.; Wanders, N.; King, H.; Bierkens, M.F.P.; Huijbregts, M.A.J.; Schipper, A.M. Threats of Global Warming to the World’s Freshwater Fishes. Nat. Commun. 2021, 12, 1701. [Google Scholar] [CrossRef] [PubMed]
  2. Magomedov, I.A.; Dzhabrailov, Z.A.; Bagov, A.M. Subsistence Agriculture|and Global Warming. IOP Conf. Ser. Earth Environ. Sci. 2021, 677, 032109. [Google Scholar] [CrossRef]
  3. Nukusheva, A.; Ilyassova, G.; Rustembekova, D.; Zhamiyeva, R.; Arenova, L. Global Warming Problem Faced by the International Community: International Legal Aspect. Int. Environ. Agreem. Politics Law Econ. 2020, 21, 219–233. [Google Scholar] [CrossRef]
  4. Shang, W.; Peng, Z.; Huang, Y.; Gu, F.; Zhang, J.; Tang, H.; Yang, L.; Tian, W.; Rao, M.; Li, G.; et al. Production of Glass-Ceramics from Metallurgical Slags. J. Clean. Prod. 2021, 317, 128220. [Google Scholar] [CrossRef]
  5. Colorado, H.A.; Garcia, E.; Buchely, M.F. White Ordinary Portland Cement Blended with Superfine Steel Dust with High Zinc Oxide Contents. Constr. Build. Mater. 2016, 112, 816–824. [Google Scholar] [CrossRef]
  6. Hittini, W.; Mourad, A.H.I.; Abu-Jdayil, B. Utilization of Devulcanized Waste Rubber Tire in Development of Heat Insulation Composite. J. Clean. Prod. 2021, 280, 124492. [Google Scholar] [CrossRef]
  7. Revelo, C.F.; Colorado, H.A. A Green Composite Material of Calcium Phosphate Cement Matrix with Additions of Car Tire Waste Particles. Int. J. Appl. Ceram. Technol. 2021, 18, 182–191. [Google Scholar] [CrossRef]
  8. Agudelo, G.; Cifuentes, S.; Colorado, H.A. Ground Tire Rubber and Bitumen with Wax and Its Application in a Real Highway. J. Clean. Prod. 2019, 228, 1048–1061. [Google Scholar] [CrossRef]
  9. Dhanya, B.S.; Mishra, A.; Chandel, A.K.; Verma, M.L. Development of Sustainable Approaches for Converting the Organic Waste to Bioenergy. Sci. Total Environ. 2020, 723, 138109. [Google Scholar] [CrossRef]
  10. Aslam, M.S.; Huang, B.; Cui, L. Review of Construction and Demolition Waste Management in China and USA. J. Environ. Manag. 2020, 264, 110445. [Google Scholar] [CrossRef]
  11. Munir, M.T.; Mohaddespour, A.; Nasr, A.T.; Carter, S. Municipal Solid Waste-to-Energy Processing for a Circular Economy in New Zealand. Renew. Sustain. Energy Rev. 2021, 145, 111080. [Google Scholar] [CrossRef]
  12. Colorado-Lopera, H.A.; Echeverri-Lopera, G.I. The Solid Waste in Colombia Analyzed via Gross Domestic Product: Towards a Sustainable Economy. Rev. Fac. De Ing. Univ. De Antioq. 2020, 96, 51–63. [Google Scholar] [CrossRef]
  13. Sumter, D.; de Koning, J.; Bakker, C.; Balkenende, R. Circular Economy Competencies for Design. Sustainability 2020, 12, 1561. [Google Scholar] [CrossRef] [Green Version]
  14. Colorado, H.A.; Gutiérrez-Velásquez, E.I.; Monteiro, S.N. Sustainability of Additive Manufacturing: The Circular Economy of Materials and Environmental Perspectives. J. Mater. Res. Technol. 2020, 9, 8221–8234. [Google Scholar] [CrossRef]
  15. Zapata, J.F.; Azevedo, A.; Fontes, C.; Monteiro, S.N.; Colorado, H.A. Environmental Impact and Sustainability of Calcium Aluminate Cements. Sustainability 2022, 14, 2751. [Google Scholar] [CrossRef]
  16. Villegas, J.E.; Camilo, J.; Gutierrez, R.; Colorado, H.A. Active Materials for Adaptive Building Envelopes: A Review. J. Mater. Environ. Sci. 2020, 2020, 988–1009. [Google Scholar]
  17. Castañeda, M.; Gutiérrez-Velásquez, E.I.; Aguilar, C.E.; Monteiro, S.N.; Amell, A.A.; Colorado, H.A. Sustainability and Circular Economy Perspectives of Materials for Thermoelectric Modules. Sustainability 2022, 14, 5987. [Google Scholar] [CrossRef]
  18. Miller, P.; de Barros, A.G.; Kattan, L.; Wirasinghe, S.C. Public Transportation and Sustainability: A Review. KSCE J. Civ. Eng. 2016, 20, 1076–1083. [Google Scholar] [CrossRef]
  19. Heidari, R.; Yazdanparast, R.; Jabbarzadeh, A. Sustainable Design of a Municipal Solid Waste Management System Considering Waste Separators: A Real-World Application. Sustain. Cities Soc. 2019, 47, 101457. [Google Scholar] [CrossRef]
  20. Shekdar, A.V. Sustainable Solid Waste Management: An Integrated Approach for Asian Countries. Waste Manag. 2009, 29, 1438–1448. [Google Scholar] [CrossRef]
  21. Alsheyab, M.A.T. Recycling of Construction and Demolition Waste and Its Impact on Climate Change and Sustainable Development. Int. J. Environ. Sci. Technol. 2021, 19, 2129–2138. [Google Scholar] [CrossRef]
  22. Menegaki, M.; Damigos, D. A Review on Current Situation and Challenges of Construction and Demolition Waste Management. Curr. Opin. Green Sustain. Chem. 2018, 13, 8–15. [Google Scholar] [CrossRef]
  23. Dahlbo, H.; Bachér, J.; Lähtinen, K.; Jouttijärvi, T.; Suoheimo, P.; Mattila, T.; Sironen, S.; Myllymaa, T.; Saramäki, K. Construction and Demolition Waste Management—A Holistic Evaluation of Environmental Performance. J. Clean. Prod. 2015, 107, 333–341. [Google Scholar] [CrossRef]
  24. Galvez-Martos, J.L.; Styles, D.; Shoenberger, H. Best Environmental Management Practice in the Building and Construction Sector. Available online: https://susproc.jrc.ec.europa.eu/product-bureau/sites/default/files/inline-files/ConstructionSector.pdf (accessed on 22 April 2022).
  25. Bergsdal, H.; Bohne, R.A.; Brattebø, H. Projection of Construction and Demolition Waste in Norway. J. Ind. Ecol. 2007, 11, 27–39. [Google Scholar] [CrossRef]
  26. Wu, Z.; Yu, A.T.W.; Shen, L.; Liu, G. Quantifying Construction and Demolition Waste: An Analytical Review. Waste Manag. 2014, 34, 1683–1692. [Google Scholar] [CrossRef]
  27. DANE Departamento Administrativo Nacional de Estadística (National Administrative Department of Statistics). Available online: https://www.dane.gov.co/ (accessed on 25 March 2020).
  28. Cámara Colombiana de La Construcción-Camacol. Available online: https://camacol.co/ (accessed on 6 October 2021).
  29. Vásquez Hernández, A.; Botero Botero, L.F.; Carvajal Arango, D. Fabricación de Bloques de Tierra Comprimida Con Adición de Residuos de Construcción y Demolición Como Reemplazo Del Agregado Pétreo Convencional. Ing. Y. Cienc-Ing. Cienc. 2014, 11, 197–220. [Google Scholar] [CrossRef] [Green Version]
  30. Fatta, D.; Papadopoulos, A.; Avramikos, E.; Sgourou, E.; Moustakas, K.; Kourmoussis, F.; Mentzis, A.; Loizidou, M. Generation and Management of Construction and Demolition Waste in Greece—An Existing Challenge. Resour. Conserv. Recycl. 2003, 40, 81–91. [Google Scholar] [CrossRef]
  31. Minambiente Colombia Ministerio de Ambiente y Desarrollo Sostenible. Available online: https://www.minambiente.gov.co/ (accessed on 6 February 2020).
  32. Orozco Gutiérrez, C.J.; Gómez Rodríguez, F.S.; Severiche Ramírez, J.A.; Rico Gómez, K.J.; Pinto Fajardo, N.A.; Zambrano Echeverría, V.A.; Alarcón, W.A.; Elorza López, Y.A.; Figueroa García, Y.X. Guía Para la Elaboración del Plan de Gestión Integral de Residuos de Construcción y Demolición (RCD) en Obra; Secretaría Distrital de Ambiente: Bogota, Colombia, 2014. [Google Scholar]
  33. Ministerio del Medio Ambiente. Resolución 541; Ministerio del Medio Ambiente: Bogota, Colombia, 1994. [Google Scholar]
  34. Minambiente Colombia. Decreto 948 de 1995; Minambiente: Bogota, Colombia, 1995. [Google Scholar]
  35. Pastrana Arango, A.; Pizano de Narváez, E.; Mayr Maldonado, J. Decreto 1713 de 2002; El Ministro de Desarrollo Económico: Bogota, Colombia, 2002. [Google Scholar]
  36. Congreso de Colombia. Ley 1259 de 2008; Congreso de Colombia: Bogota, Colombia, 2008. [Google Scholar]
  37. Presidencia de la Republica de Colombia. Decreto 2981 de 2013; Presidencia de la Republica de Colombia: Bogota, Colombia, 2013. [Google Scholar]
  38. Minambiente Colombia. Resolución 472 de 2017–Manejo y Disposición de Residuos de Construcción–Solames; Minambiente: Bogota, Colombia, 2017. [Google Scholar]
  39. Porras, Á.C.; Cortes, N.L.G.; Duarte, M.C.C. Determinación de Propiedades Físico-Químicas de Los Materiales Agregados En Muestra de Escombros En La Ciudad de Bogotá D. C. Rev. Ing. 2013, 12, 45–58. [Google Scholar] [CrossRef] [Green Version]
  40. Zheng, L.; Wu, H.; Zhang, H.; Duan, H.; Wang, J.; Jiang, W.; Dong, B.; Liu, G.; Zuo, J.; Song, Q. Characterizing the Generation and Flows of Construction and Demolition Waste in China. Constr. Build. Mater. 2017, 136, 405–413. [Google Scholar] [CrossRef] [Green Version]
  41. Hodrick, R.J.; Prescott, E.C. Postwar U.S. Business Cycles: An Empirical Investigation. J. Money Credit Bank. 1997, 29, 1–16. [Google Scholar] [CrossRef]
  42. Baxter, M.; King, R.G. Measuring Business Cycles Approximate Band-Pass Filters for Economic Time Series; National Bureau of Economic Reserch: Cambridge, MA, USA, 1995. [Google Scholar] [CrossRef]
  43. Gisela, I.; González, L. Residuos Solidos Urbanos Argentina Tratamiento y Disposicion Final Situacion Actual y Alternativas Futuras; Camara Argentina de la Construcción: Buenos Aires, Argentina, 2010. [Google Scholar]
  44. Ferré Olive, E.H. Foro Virtual de Contabilidad Ambiental y Social; Facultad de Ciencias Económicas de la Universidad de Buenos Aires: Buenos Aires, Argentina, 2010. [Google Scholar]
  45. Vaca Zelaya, J.L.; Sánchez, M.J.C. Manual Educativo Manejo de Residuos Sólidos; Abbase Ltda: La Paz, Bolivia, 2007. [Google Scholar]
  46. Conselho Nacional do Meio Ambiente. Resolução Conama No 307 de 05/07/2002; Conselho Nacional do Meio Ambiente: Brasilia, Brazil, 2002. [Google Scholar]
  47. Gobierno de Chile. CORFO. Available online: https://www.corfo.cl/sites/cpp/quienessomos (accessed on 19 October 2021).
  48. REGEMAC Gestión Sustentable de Residuos Sólidos Inertes. Available online: https://regemac.cl/home/ (accessed on 19 October 2021).
  49. Morales Alpízar, M.; Flórez-Estrada, M.V. Guía de Manejo de Escombros y Otros Residuos de La Construcción; Oficina Regional para Mesoamérica y la Iniciativa Caribe, Unión Internacional para la Conservación de la Naturaleza UICN: San José, Costa Rica, 2011. [Google Scholar]
  50. Ministerio del Ambiente Gestión Integral de Desechos Sólidos (PNGIDS). Available online: http://inabio.biodiversidad.gob.ec/2019/01/30/26-gestion-integral-de-desechos-solidos-pngids/# (accessed on 28 July 2021).
  51. Cámara Mexicana de la Industria de la Construcción. Plan de Manejo de Residuos de La Construcción y La Demolición; Cámara Mexicana de la Industria de la Construcción: Mexico City, Mexico, 2014. [Google Scholar]
  52. Gobierno Del Estado De México. Infraestructura Para El Manejo de Residuos Peligrosos. In Bases Conceptuales y de Diagnóstico del Programa Para la Prevención y Manejo Integral de Residuos Peligrosos en la Zona Metropolitana del Valle de México; Gobierno del Estado de México: Toluca, Mexico, 2013. [Google Scholar]
  53. Consejo Municipal de Panama. Acuerdo N° 124; Consejo Municipal de Panama: Panama City, Panama, 2015. [Google Scholar]
  54. Ministerio de Vivienda, Construcción y Saneamiento VIVIENDA. Decreto Supremo N° 003-2013-VIVIENDA. Available online: http://sial.segat.gob.pe/normas/aprueba-reglamento-gestion-manejo-residuos-las-actividades-las (accessed on 28 July 2021).
  55. Organismo de Evaluación y Fiscalización Ambiental–OEFA. La Fiscalización Ambiental en Residuos Sólidos; Organismo de Evaluación y Fiscalización Ambiental–OEFA: Chachapoyas, Peru, 2014. [Google Scholar]
  56. Gobierno de la Republica Dominicana Ministerio de Medio Ambiente y Recursos Naturales. Available online: https://ambiente.gob.do/transparencia/ (accessed on 28 July 2021).
  57. Esa, M.R.; Halog, A.; Rigamonti, L. Strategies for Minimizing Construction and Demolition Wastes in Malaysia. Resour. Conserv. Recycl. 2017, 120, 219–229. [Google Scholar] [CrossRef]
  58. Yang, H.; Xia, J.; Thompson, J.R.; Flower, R.J. Urban Construction and Demolition Waste and Landfill Failure in Shenzhen, China. Waste Manag. 2017, 63, 393–396. [Google Scholar] [CrossRef] [PubMed]
  59. Gálvez-Martos, J.L.; Styles, D.; Schoenberger, H.; Zeschmar-Lahl, B. Construction and Demolition Waste Best Management Practice in Europe. Resour. Conserv. Recycl. 2018, 136, 166–178. [Google Scholar] [CrossRef] [Green Version]
  60. Alexandridou, C.; Angelopoulos, G.N.; Coutelieris, F.A. Mechanical and Durability Performance of Concrete Produced with Recycled Aggregates from Greek Construction and Demolition Waste Plants. J. Clean. Prod. 2018, 176, 745–757. [Google Scholar] [CrossRef]
  61. Lai, Y.-Y.; Yeh, L.-H.; Chen, P.-F.; Sung, P.-H.; Lee, Y.-M. Management and Recycling of Construction Waste in Taiwan. Proc. Environ. Sci. 2016, 35, 723–730. [Google Scholar] [CrossRef]
  62. U.S. Environmental Erotection Agency. Reduce, Reuse, Recycle. Available online: https://www.epa.gov/recycle (accessed on 19 October 2021).
  63. Akhtar, A.; Sarmah, A.K. Construction and Demolition Waste Generation and Properties of Recycled Aggregate Concrete: A Global Perspective. J. Clean. Prod. 2018, 186, 262–281. [Google Scholar] [CrossRef]
  64. Lopera, H.A.C.; Gutierrez-Velasquez, E.; Ballesteros, N. Bridging the Gap between Theory and Active Learning: A Case Study of Project-Based Learning in Introduction to Materials Science and Engineering. IEEE Rev. Iberoam. de Tecnol. del Aprendiz. 2022, 17, 160–169. [Google Scholar] [CrossRef]
  65. Colorado, H.A.; Mendoza, D.E.; Valencia, F.L. A Combined Strategy of Additive Manufacturing to Support Multidisciplinary Education in Arts, Biology, and Engineering. J. Sci. Educ. Technol. 2020, 30, 58–73. [Google Scholar] [CrossRef]
Figure 1. CDW cycle in Colombia.
Sustainability 14 07225 g001
Figure 2. Selection of the quantification methodology.
Sustainability 14 07225 g002
Figure 3. Amount of CDW generated in (a) Medellín, (b) Bogotá, and (c) Colombia as a whole.
Sustainability 14 07225 g003
Figure 4. Samples obtained from the La Pradera waste dump.
Sustainability 14 07225 g004
Figure 5. X-ray diffractogram of CDW in Colombia.
Sustainability 14 07225 g005
Figure 6. Composition of CDW production in different countries.
Sustainability 14 07225 g006
Figure 7. Comparison of the amount of CDW generated with (a) population, (b) gray cement production, and (c) GDP from construction in Colombia.
Sustainability 14 07225 g007
Figure 8. Flows of CDW and GDP from construction in Colombia: (a) evolution over time and (b) correlation between flows.
Sustainability 14 07225 g008
Figure 9. Hodrick–Prescott filter: (a) amount of CDW and (b) GDP from construction.
Sustainability 14 07225 g009
Figure 10. Cyclic components obtained by Hodrick–Prescott and Baxter–King filters from (a) CDW and (b) GDP from construction.
Sustainability 14 07225 g010
Figure 11. Amount (millions of tons) of CDW generated around the world in the year 2012.
Sustainability 14 07225 g011
Figure 12. Comparison of CDW and GDP of various countries in 2014.
Sustainability 14 07225 g012
Table 1. Volume and density factors.
NameVolume (m3/m2)Density (ton/m3)
Factor 11.421.48
Factor 21.351.40
Factor 30.61.6
Factor 41.121.48
Publisher’s Note: MDPI stays neutral with regard to jurisdictional claims in published maps and institutional affiliations.