Essay

Simulation and Analysis of Influencing Factors of Pavement Thermal Environments in Guangzhou

1
College of Architecture and Urban Planning, Guangzhou University, Guangzhou 510006, China
2
Building Energy Conservation Research Institute, Guangzhou University, Guangzhou 510006, China
3
Guangdong Architectural Design Institute Corporation, Guangzhou 510010, China
*
Author to whom correspondence should be addressed.
Sustainability 2022, 14(12), 7251; https://doi.org/10.3390/su14127251
Submission received: 9 April 2022 / Revised: 15 May 2022 / Accepted: 23 May 2022 / Published: 14 June 2022

Abstract

:
Pavements are closely related to the livelihoods of urban residents as an important part of the urban road system. Based on the early field measurements of our team, we found that plant spacing, pavement orientation, and pavement material influence the pavement thermal environment. Our objective was to quantitatively evaluate the influence of various factors on pavements in Guangzhou along West Zhonghuan Road, Guangzhou University. Based on our team’s previous research, environment-met (ENVI-MET) numerical simulation software was used to simulate pavements under different road orientations, underlying surface materials, and plant distances. Quantitative analysis of the effects of different factor combinations on the temperature, humidity, wind speed, physiological equivalent temperature (PET), and radiant temperature (Tmrt) was performed. The results show that among the various factors affecting the thermal environment of pavement, street tree spacing was found to have the greatest effect on the thermal environment of pavement. The effect of direction is negligible; however, it has a significant effect on the wind speed. There was no significant difference in the air temperature and relative humidity between concrete and asphalt. The average air temperature of red floor tile was slightly lower than that of asphalt and concrete. Reducing the spacing of street trees can effectively reduce the penetration of direct solar radiation, physiological equivalent temperature (PET), and temperature (Tmrt) and improve pedestrian walking comfort. The results can serve as a reference for pavement design in Guangzhou and improve the wellbeing of citizens and promote environmental sustainability.

1. Introduction

Owing to rapid urbanization, the underlying natural surfaces of cities have changed. Simultaneously, the substance and energy balance near ground surfaces in urban areas have been disrupted, negatively affecting the physical conditions and thermal comfort of urban residents. “Pavements” in cities may refer to all surfaces on the ground, such as roads, sidewalks, parking areas, squares, pedestrian streets, etc. The effect of pavements on the development of the urban heat island (UHI) phenomenon is significant. According to Asaeda et al. [1], pavements are the main factor for the development of the urban heat island (UHI) effect. Many recent studies have shown that pavements play an important role in the formation of the overall urban thermal balance [2,3,4]. As an important component of the urban road system, pavements are an outdoor public space with a high use frequency, fulfilling various human needs for work and transportation activities, and closely related to urban residential livelihood. Therefore, exploring pavement design from an outdoor thermal environment perspective is important to improve the urban environment worldwide.
Sreedhar and Biligiri stated that the thermal environment of pavements is largely dependent on the different but interactive thermal properties of pavement materials such as thermal conductivity, specific heat capacity, density, albedo, thermal emissivity, and not on one single property alone [5]. Kappou et al. (2022) presented an extensive analysis of the state of the art of cool pavements. Results showed that cool pavements have significant temperature reduction potential in the urban environment. [6]. Mascaró (2021) presented a study on the surface temperature of three types of pavements in urban environments with and without vegetation. He used numerical modeling, including verification measurements, as the research method. The shading influence of dense canopy trees on the surface temperature of the floor exposed to solar radiation in summer was significant. Its use is recommended in urban environments [7]. Li et al. (2016) selected physiological equivalent temperature (PET) to evaluate and compare the effects of different pavement strategies on the outdoor thermal environment for summer and winter in three climates (Sacramento and Los Angeles in California and Phoenix in Arizona). They recommended that some cool pavement strategies such as reflective pavement could improve human thermal comfort in cold winter periods while possibly reducing human thermal comfort in hot summer periods. Therefore, a strategy such as enhanced evaporation only in summer and tree shading only in summer, which can help reduce hot summer temperatures but not reduce cold winter temperatures, is desirable [8].
Bau-Show Lin et al. (2021) examined the pedestrian street valleys of Taiwan and reported that the street orientation, number of planting belts, and tree leaf area index (LAI) had specific effects on mean radiant temperature (Tmrt) and physiological equivalent temperature (PET). The thermal environment of a north–south (NS) street canyon was better than an east–west (EW) street canyon. Planting trees with a high leaf area index (LAI) could effectively improve the comfort of a street canyon [9]. Several studies (Liu et al., 2007; Shahidan et al., 2010; Yuhan and Liu, 2016) have shown that trees along streets can modify the pavement microclimate, improve the outdoor thermal environment, and optimize the comfort experience of pedestrian activities through various functions such as transpiration, evapotranspiration, occlusion, and reflection [10,11,12]. Takebayashi et al. (2014) reported that the pavement thermal environment is related to the layout of street trees and the underlying surface material. Based on actual measurements, the humidification and cooling effects of street trees depend on the area and location of the tree shadow [13]. Xiong (2018) showed that the cooling and humidification effects that street trees have on the surrounding environment are closely related to the sky view factor (SVF). The planting density or spacing of street trees can affect the sky view factor (SVF) of the pavement, resulting in different shading effects [14]. Zhou and Li (2020) found that the thermal environment of pavement is related to the trend of street trees and the sky view factor (SVF) in hot and humid areas [15]. Wang et al. (2015) showed that street trees could reduce solar radiation related to the direction of the street trees. Moreover, street trees have substantial cooling and humidifying effects on the surrounding environment, improving human comfort [16].
By investigating the meteorological parameters and leaf surface temperature of seven typical street trees under shade and sunlight conditions, Min et al. (2020) analyzed the effects of different types of street trees on the road thermal environment and improvements to pedestrian thermal comfort. Sky view factor (SVF) was the main factor affecting pedestrian thermal comfort along the road space [17]. Qiren et al. (2018) analyzed the effects of five tree species on the urban outdoor thermal environment and found that the cooling and humidification effects of different tree species are related to the tree canopy shade area [18]. Morakinyo et al. (2018) used environment-met (ENVI-met) to explore the effect of tree species on the surrounding environment. They found that a green coverage of 30% can effectively increase human comfort while reducing the physiological equivalent temperature (PET) by 3.3–5.0 °C [19]. Zhang et al. (2018) investigated the effects of eight tree species on the thermal environment in a hot summer zone and cold winter zone, suggesting that the tree arrangement, leaf area index (LAI), crown width, and tree height were the four main influencing factors. Additionally, different types of street trees also affect the sky view factor (SVF) value owing to differences in the leaf area and density, resulting in varying degrees of improvement to the thermal comfort of the surrounding environment [20].
The research method of this paper is a combination of a simulation method and a measurement method. Based on actual measurements (Zhou et al., 2020) [15], we selected typical pavements in Guangzhou as the research object, using the validated environment-met (ENVI-met) model to simulate and evaluate the effect of different tree spacings, road orientations, and underlying factors (such as surface materials) on the pavement thermal environment. The influencing factors of the pavement thermal environment are further discussed.

2. Materials and Methods

2.1. Field Measurements

Our research team conducted field measurements along Zhonghuan East Road, Guangzhou University, from 8:00 to 20:00 h on 21–22 October 2017; we recorded the air temperature and humidity at 1.5 m under full shade, half shade, and open space conditions, as well as the ball temperature, black ball temperature, and wind speed. We analyzed the effects of street tree orientation, SVF, and color of the underlying surface material, among others.

2.2. ENVI-Met Numerical Simulations

We used ENVI-met to establish a numerical model of some road sections to simulate the study area and analyze the effect of differences in the road orientation, underlying surface material, and plant spacing on the pavement thermal environment (Figure 1).
In this simulation, the road orientation, underlying surface material, and plant spacing were used as the simulation variables for the pavement. We designed 36 simulation programs in total (Table 1). In this simulation, the initial numerical conditions for all schemes were identical, and three assumptions were made. The first is that under certain meteorological conditions, the experiment does not consider climate change. The second is that the growth of trees is consistent; there is no different size and shape of trees. The third is that the surface of the paving material is uniform. The pavement was 30 m long and 6 m wide; street trees were planted on both roadsides. The street tree species was Dracontomelon duperreanum Pierre, with a tree height of 11 m, trunk height of 3 m, and crown diameter of 7 m. The tree parameters in the vegetation model were obtained based on a previous study (Xiong 2018) [14].
For convenient simulation, the overall simulation area was defined as 80 × 80 m square, the horizontal resolution of the model was 1 × 1 m, and four nested grids were set around the model. The vertical direction adopted an unequal-spaced grid: the initial value was set to 1 m, the space above 2 m adopted an elastic grid with a magnification factor of 10%, an open boundary condition was implemented, and the ground roughness was set to 0.1. The pavement was designed as a 30 m × 6 m rectangle in the middle of the square area and maintained at a distance from the edge of the model. Figure 1 shows the model diagrams.
The meteorological parameters for a typical summer day in Guangzhou were obtained from the appendix in the “Design standard for the thermal environment of urban residential areas” (JGJ286-2013) [21], including the 0–24 h hourly air temperature, relative humidity, and solar radiation, among others, with a wind direction of 135° southeast to imitate typical summer days in Guangzhou area. The simulation duration was 14 h, from 05:00 to 19:00 h. Meteorological parameters included temperature, air pressure, humidity, wind direction, and wind speed. Table 2 lists the main input parameters for the simulation; cloud cover was not considered a meteorological parameter in the experiment.

2.3. Thermal Comfort Assessment Method

The thermal comfort index (TCI), based on the energy balance, was used to explore the effects of pavement orientation, spacing, and underlying surface material on the comfort of the study area. The PET is an outdoor thermal comfort evaluation index based on the Munich human body heat balance model, which comprehensively considers the physiological factors of the human body and the effect of meteorological factors on thermal comfort. The PET has rarely been used as an outdoor thermal environment evaluation index. The PET is defined as the physiological equilibrium temperature in a given environment; its value is equal to the temperature corresponding to the same outdoor thermal state in a typical indoor environment (Morakinyo et al., 2018) [19].

3. Results

Thirty-six numerical simulations were conducted with four road orientations, three underlying surface materials, and three plant spacings as the simulation variables. The experimental data were averaged based on controlling a single variable.

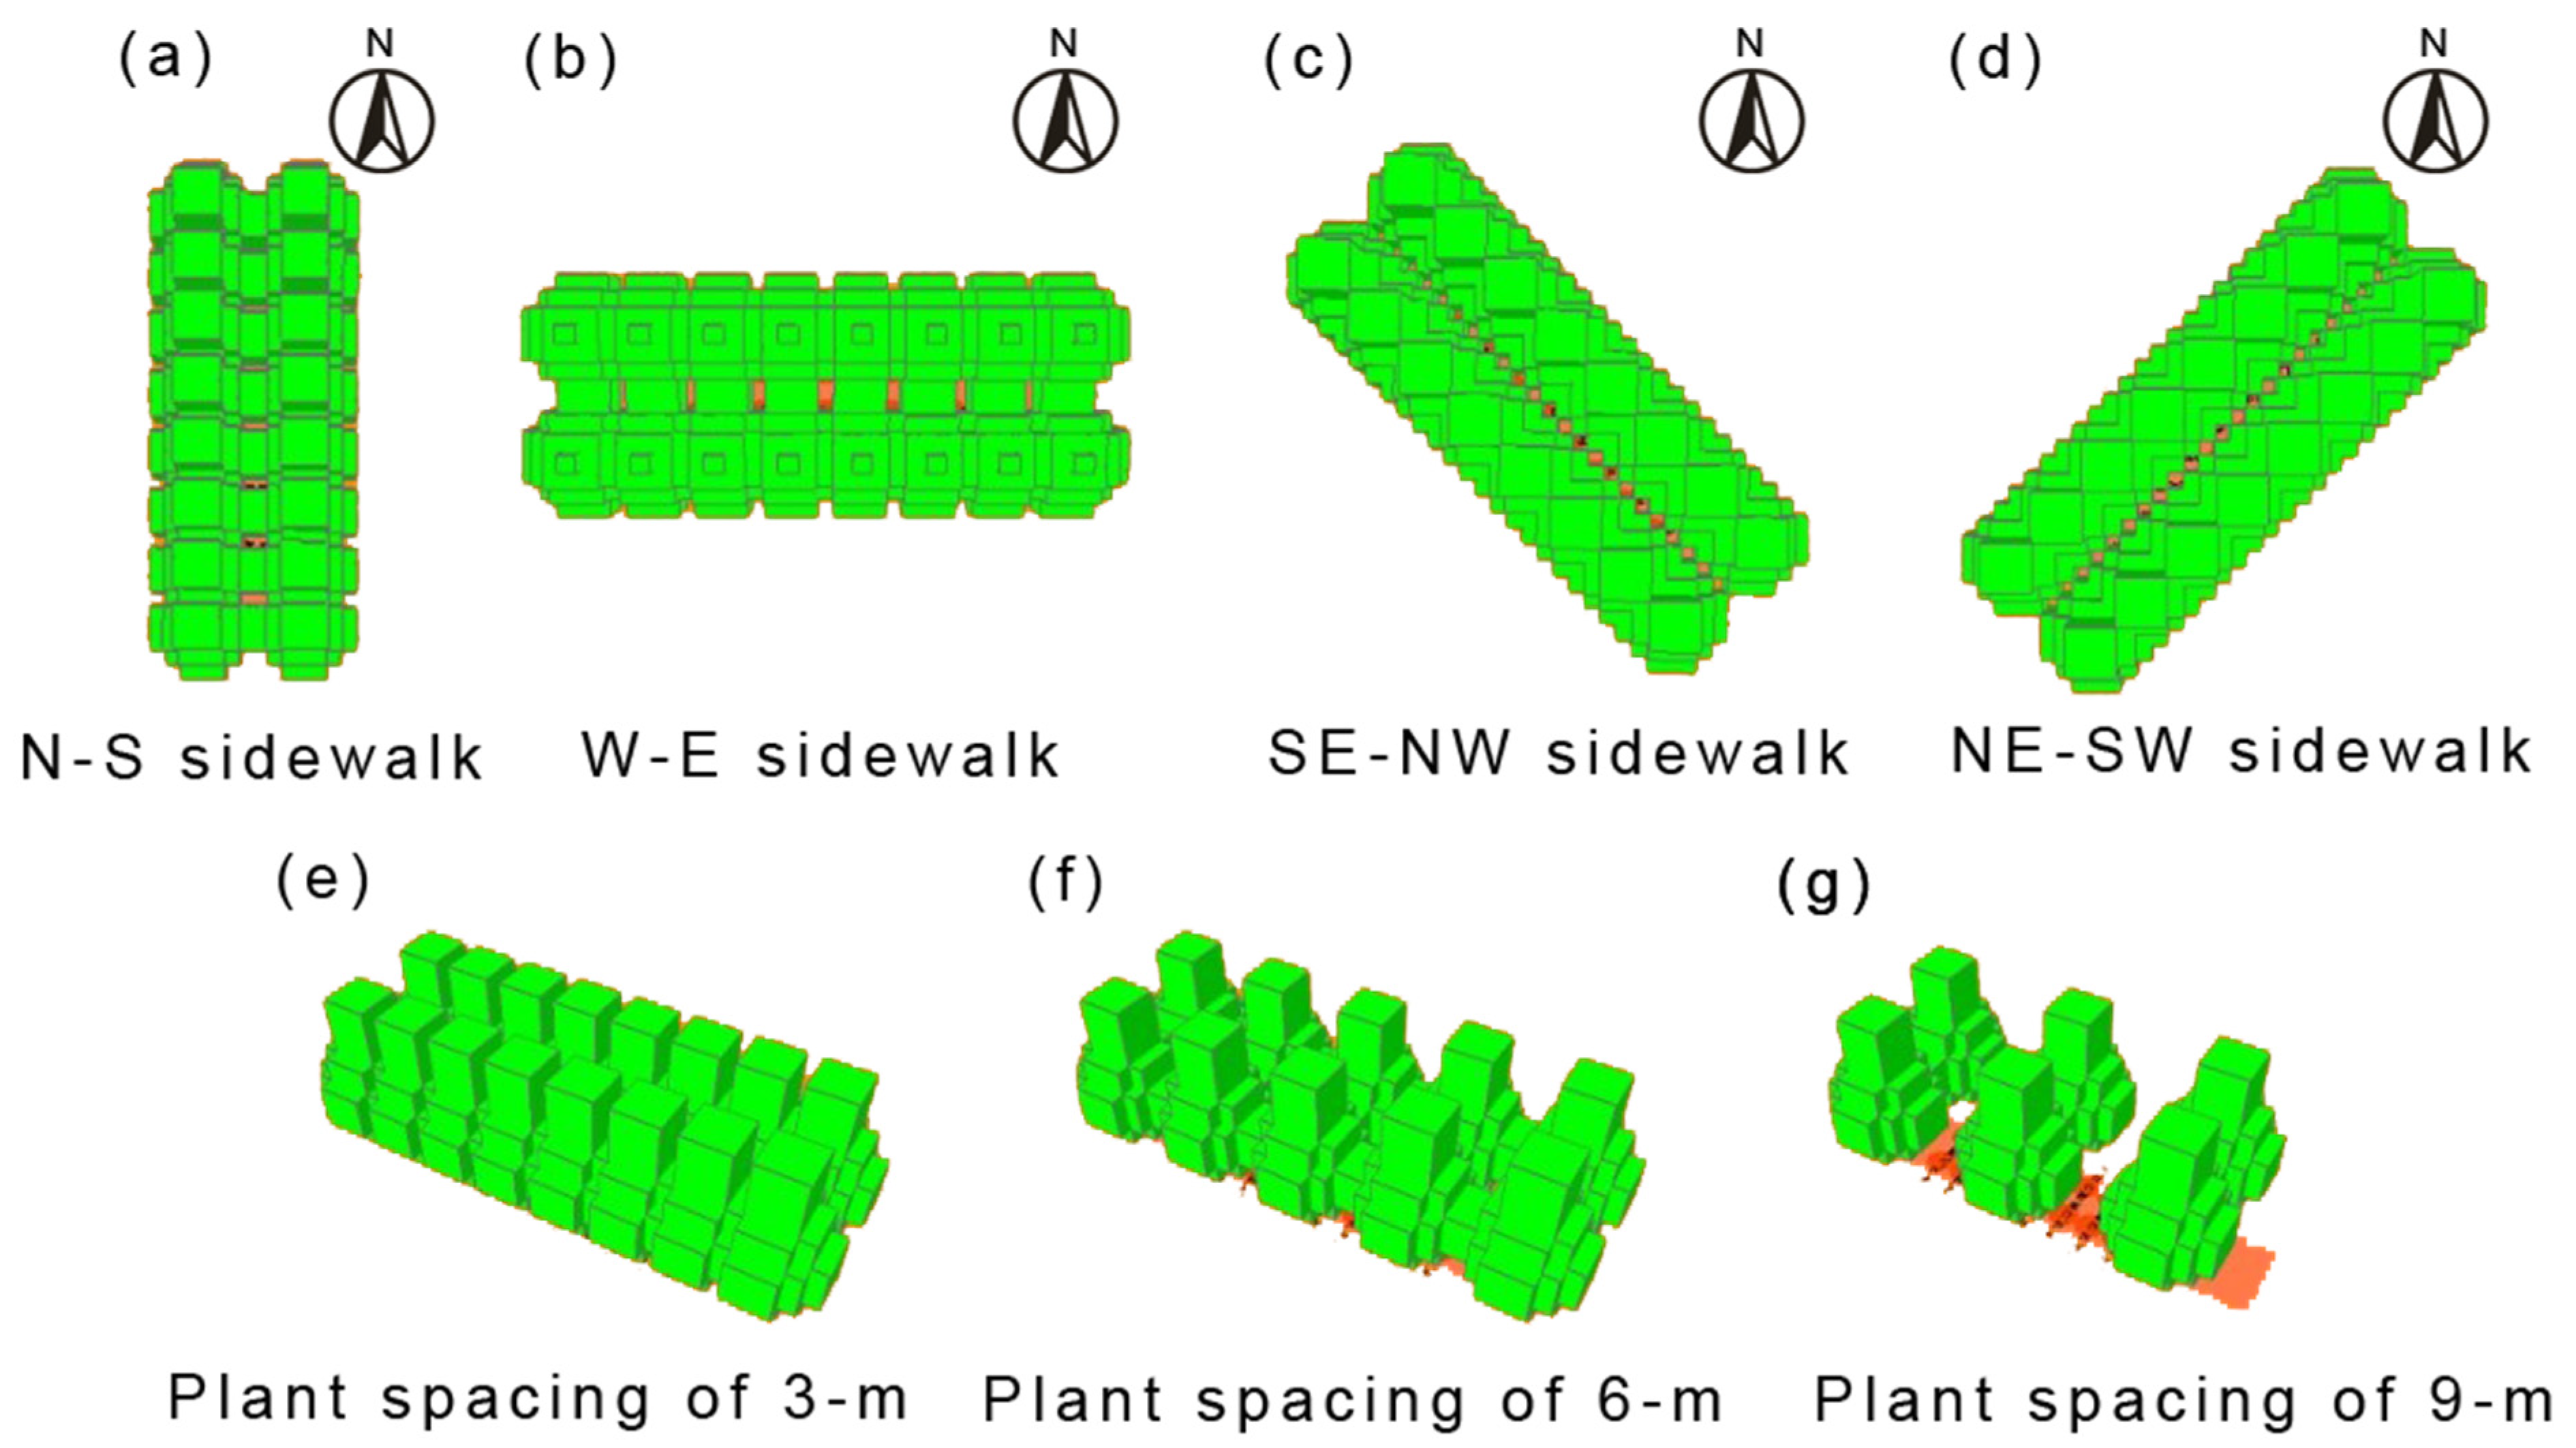
3.1. Effect of Plant Spacing on Pavement Thermal Environment

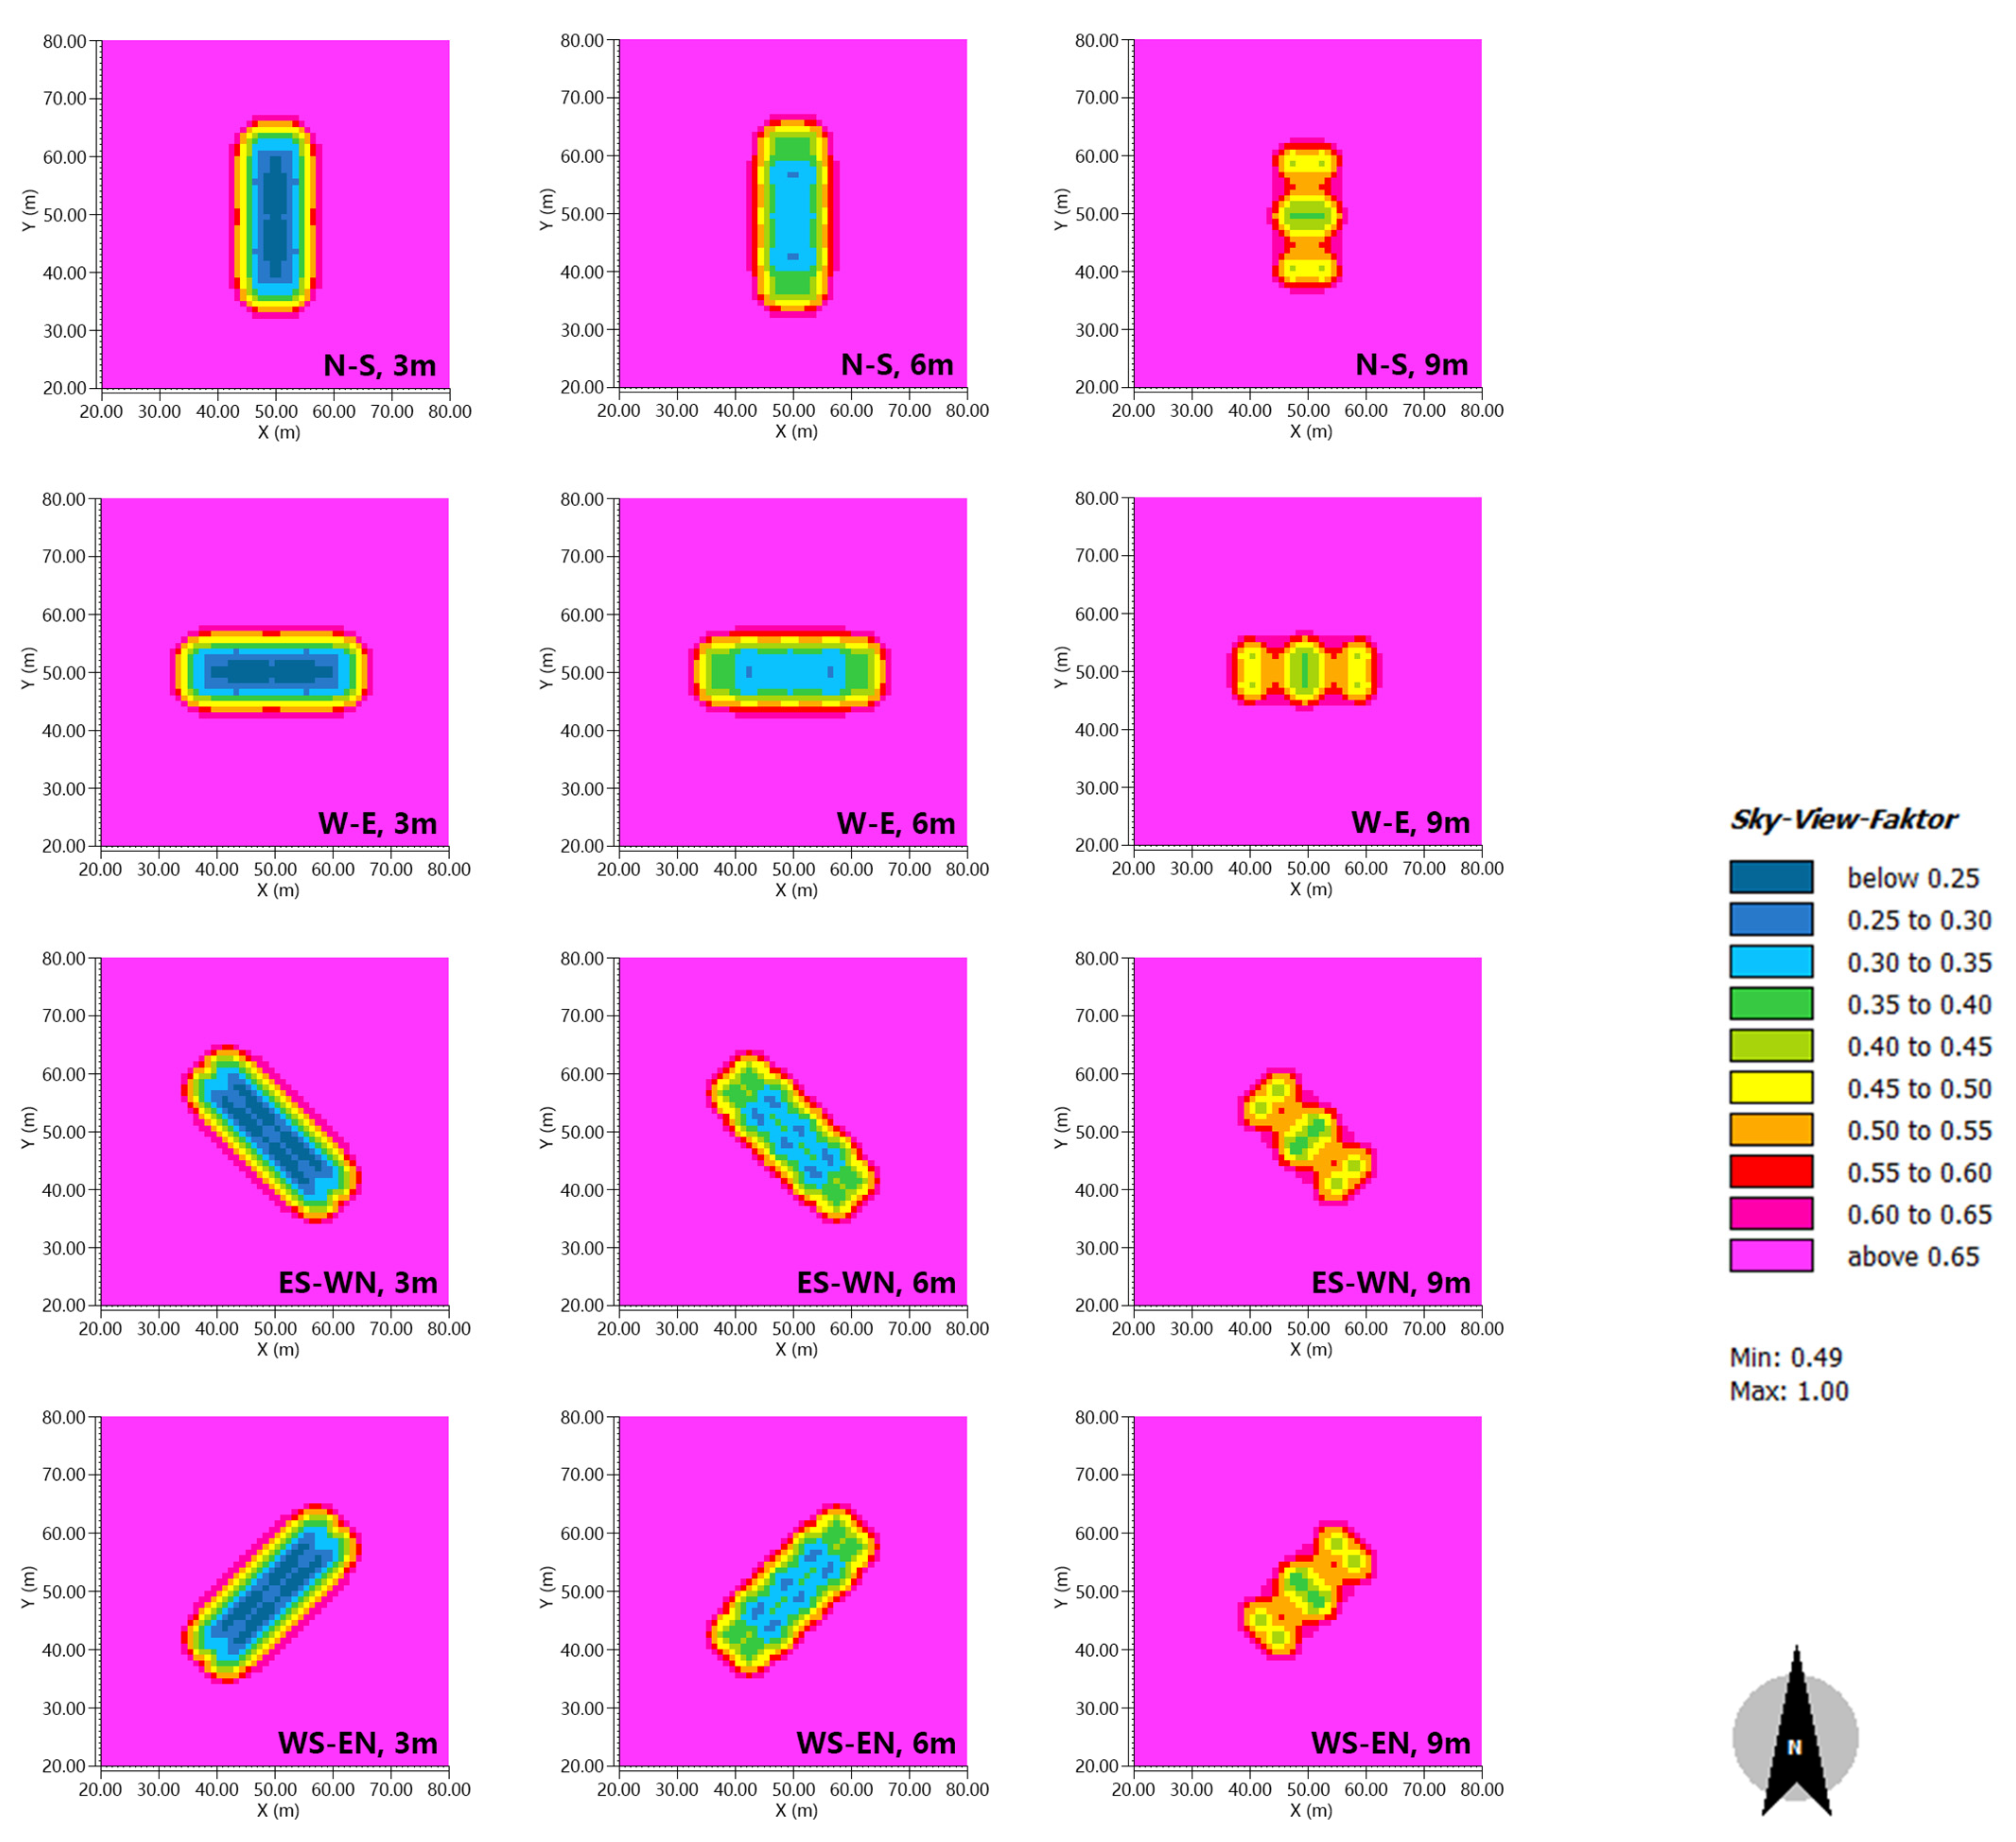
3.1.1. Effect of Tree Spacing and Road Direction on Pavement SVF

Figure 2 shows the SVF values for the pavement with different orientations and spacing at a height of 1.5 m from the ground. Table 3 presents the SVF distribution at the pavement level at 1.5 m below different plant spacings. Based on its size, the SVF was divided into highly shaded areas (SVF < 0.3), medium shaded areas (0.3 < SVF < 0.5), and slightly shaded areas (SVF > 0.5) (Morakinyo et al., 2018) [19] The SVF values of 3 m pavements in all directions were basically lower than 0.25, the SVF values of 6 m pavements in all directions were between 0.40 to 0.45, and the SVF values of 9 m pavements in all directions were mainly between 0.45 to 0.50 and 0.50 to 0.55. The average SVF of the pavement with a tree spacing of 3 m was 0.24; 62.90% of the area was highly shaded, and 33.88% of the area was moderately shaded, with optimal shading. The average SVF of the pavement, with a plant spacing of 6 m, was 0.32, and 94.09% of the area was moderately shaded, with good shading conditions. In contrast, the average SVF of the pavements with a plant spacing of 9 m was 0.48, and 58.07% of the area was slightly shaded, whereas only 41.91% of the area was moderately shaded. Some areas even had SVF values > 0.7, representing a sun-exposed open space with poor shading.
The results show that the SVF values of road surfaces under the same spacing and in different directions are basically the same. Under different plant spacings, the SVF value of pavement has an obvious difference. Therefore, the orientation had no significant effect on the SVF, whereas the plant distance was the main factor affecting the SVF. Plant distance positively correlated with the SVF. The smaller the plant distance, the larger the shaded and moderately shaded areas of the pavement height, and a more optimal shading effect.

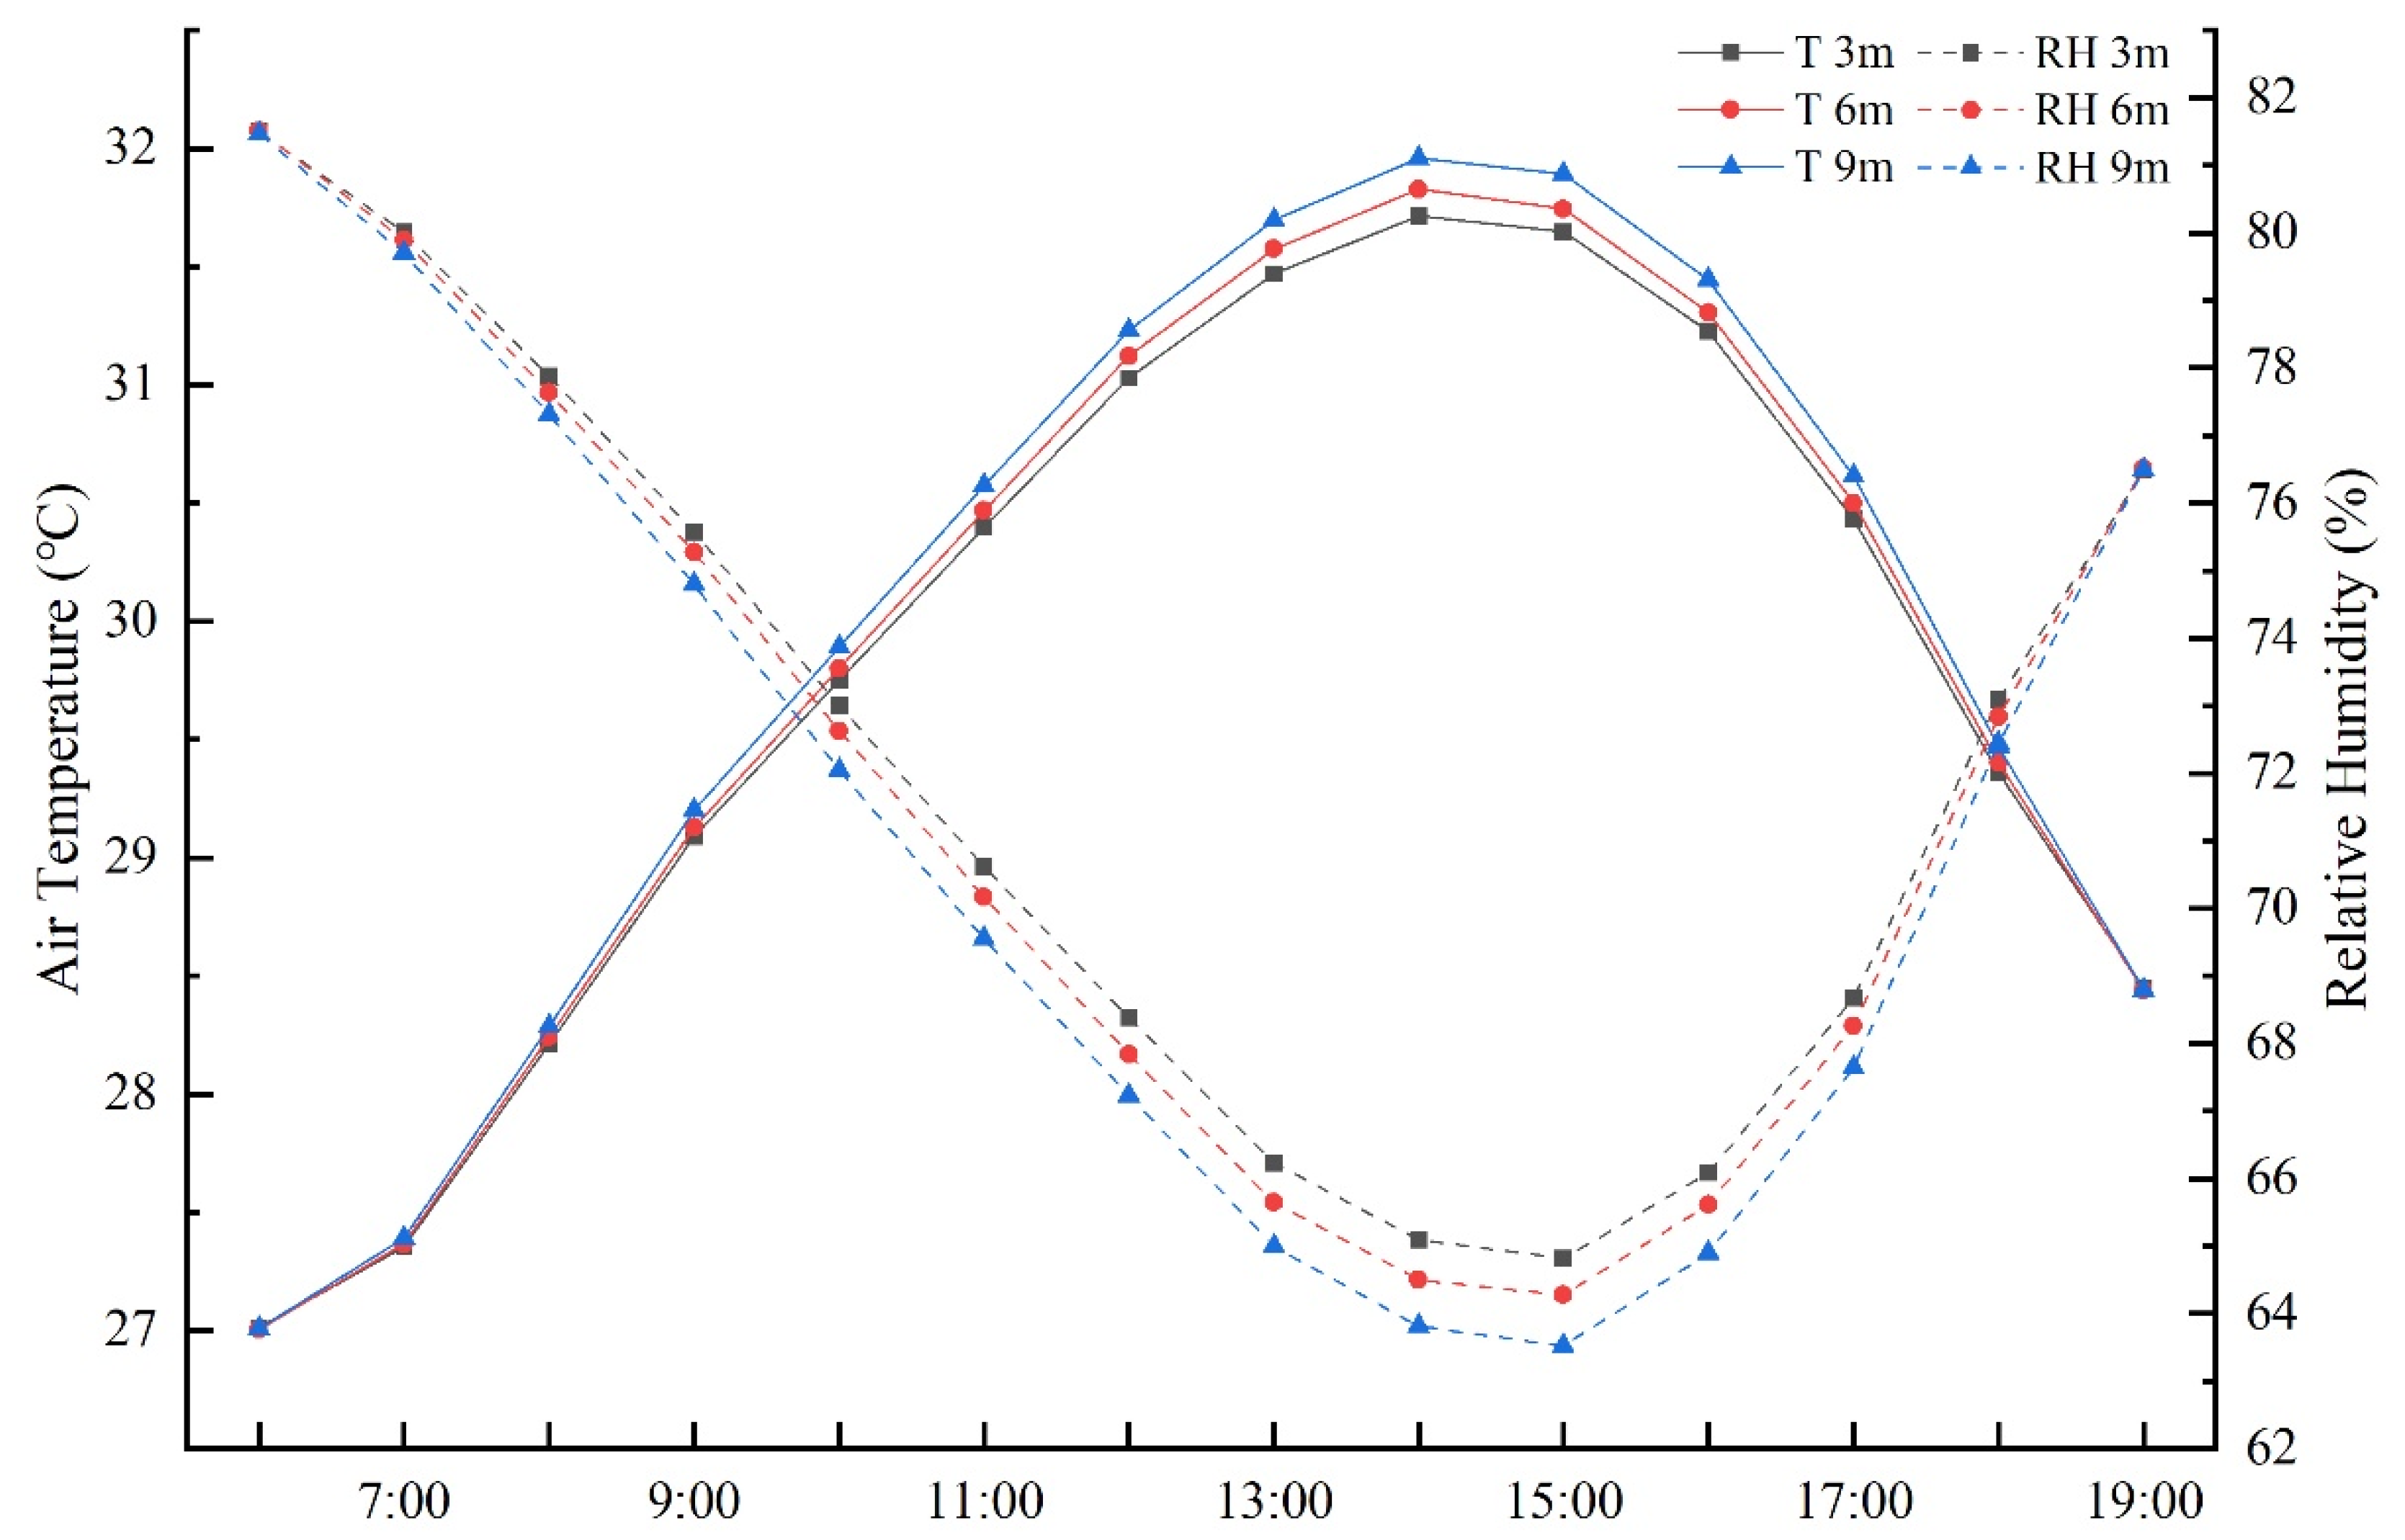
3.1.2. Effect of Plant Spacing on Pavement Temperature and Humidity

Figure 3 shows the time-by-time comparison of the average air temperature and relative humidity at a pavement height of 1.5 m with different plant spacings. During the simulation period, the air temperature increased until 14:00 h and then decreased. The air temperature of the pavement with a plant spacing of 9 m was higher than that of pavements with plant spacings of 3 and 6 m during the simulation period. The maximum temperature difference appeared at 15:00 h, and it was 0.25 °C and 0.1 °C. During the test period, the average temperature difference was 0.14 °C and 0.08 °C. The relative humidity trend was the opposite of the air temperature, which first decreased and then increased. The relative humidity of the pavement with a plant spacing of 9 m was lower than that of the other two pavements during the simulation period. Among them, the biggest difference was between 9 m and 3 m plant spacings. The maximum relative humidity difference appeared at 15 points, 1.29%; the average humidity difference during the simulation period was 0.82%. Figure 4 shows a cloud map of the air temperature at 15 points on the asphalt pavement with different plant spacings from north to south. The pavement with plant spacings of 3 and 6 m had a lower temperature, and the temperature distribution was relatively uniform, without overheated areas. In contrast, when the plant spacing was 9 m, the pavement temperature was generally higher, and there were areas with large temperature differences, characterized by the highest temperature difference of 0.25 °C.
Therefore, decreasing the spacing of street trees effectively reduced the pavement SVF, enhanced the shading effect, played a specific role during humidification and cooling, and also yielded a more uniform pavement temperature distribution, which reduced overheated local areas.

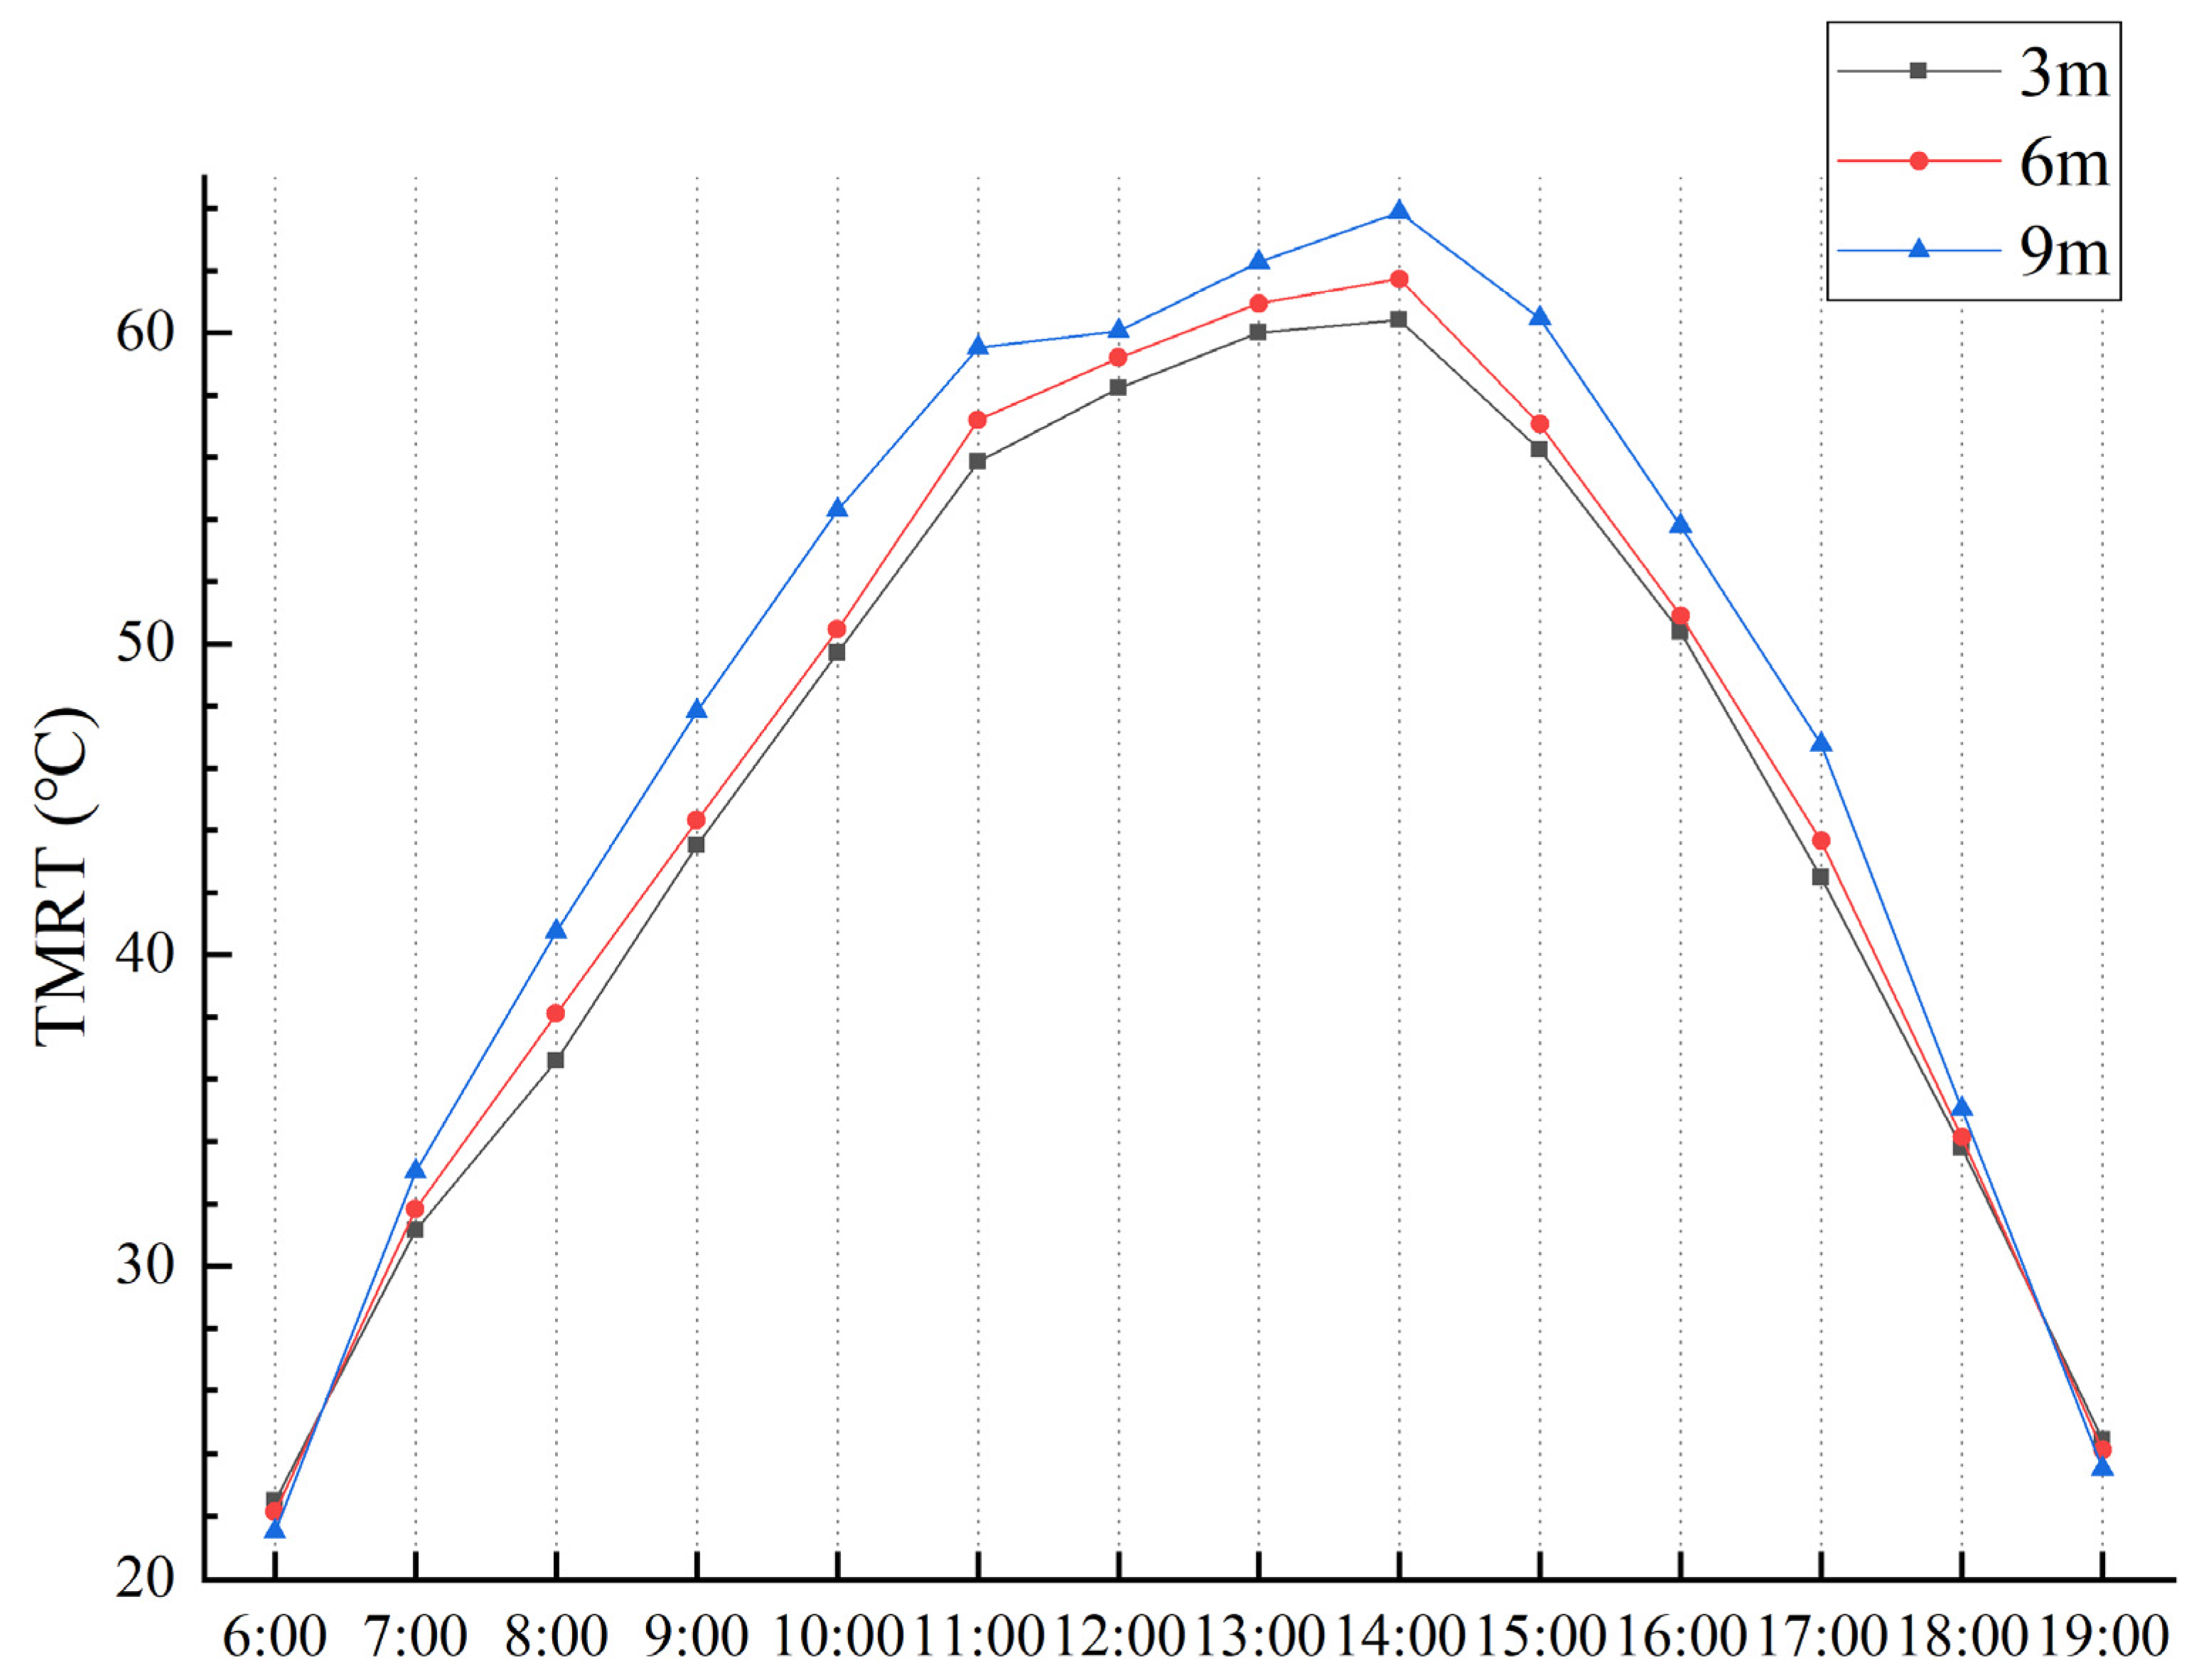
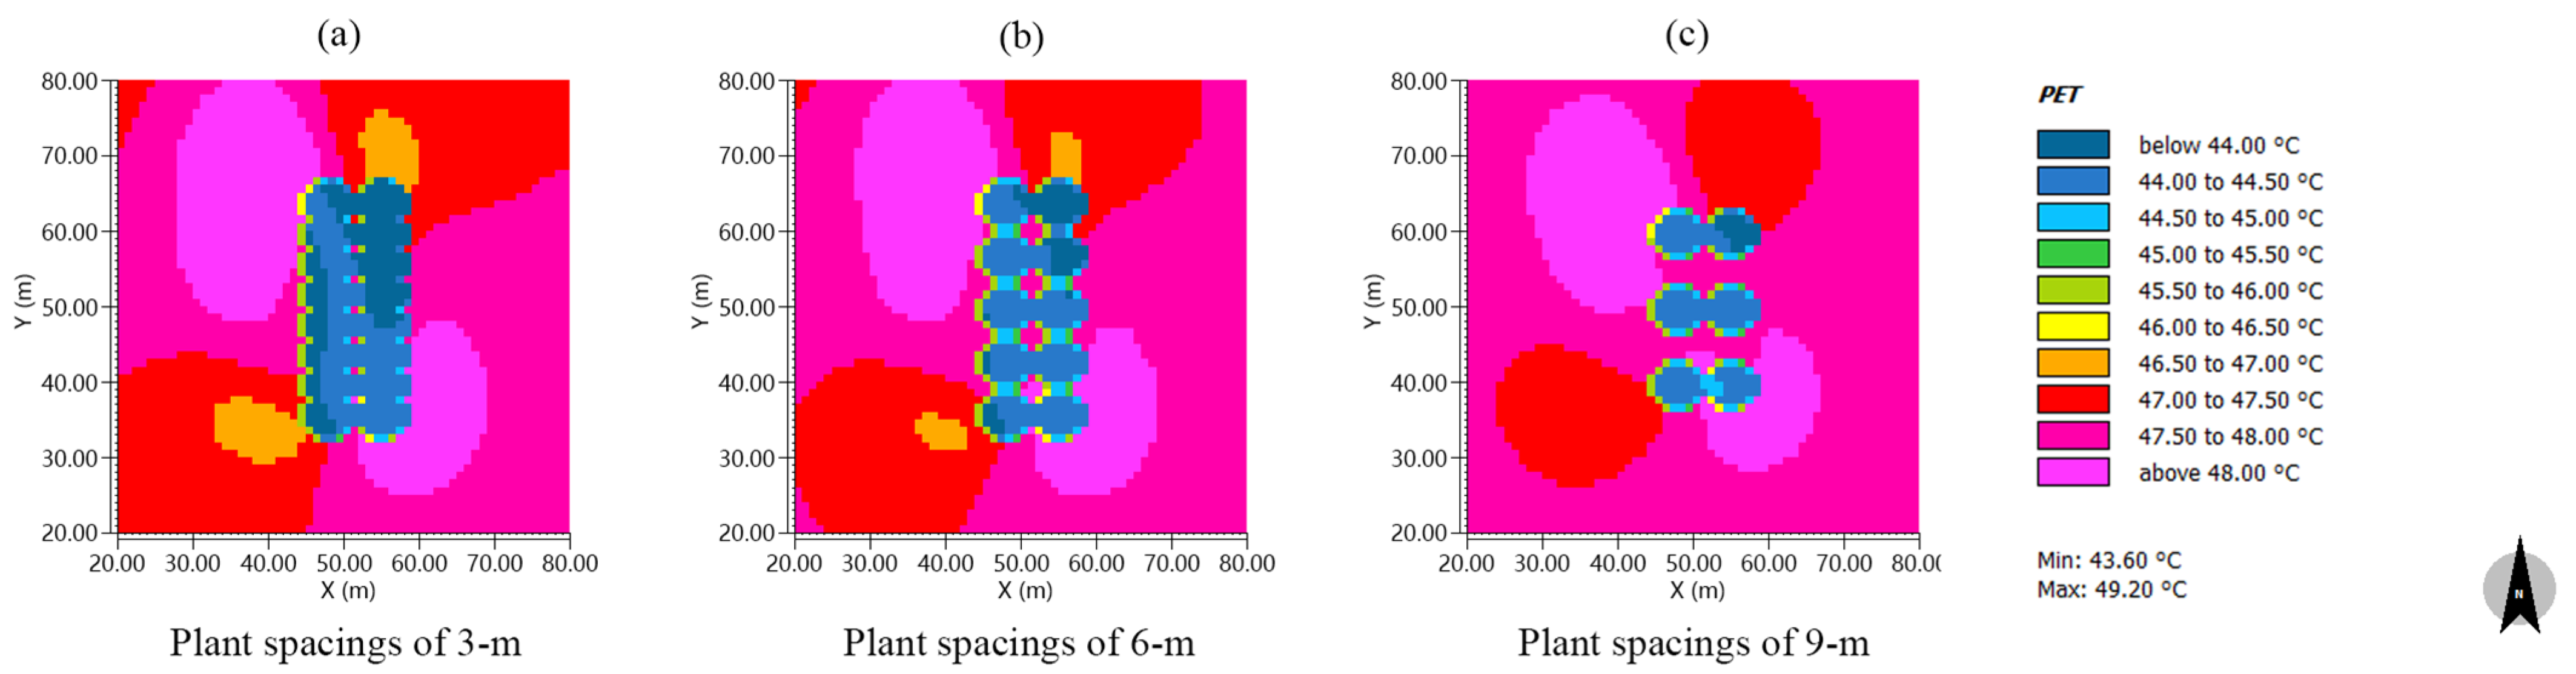
3.1.3. Effect of Plant Spacing on Pavement Tmrt and PET

Figure 5 shows the variation in Tmrt at a pavement height of 1.5 m with different spacings as a function of time. Tmrt increased until 14:00 h and then decreased; the average Tmrt values for the 3, 6, and 9 m pavements were 44.66 °C, 45.41 °C, and 47.34 °C, respectively. The Tmrt value of the pavement with 9 m spacing was significantly higher than that of pavements with other spacings. The maximum difference was 4.58 °C and 3.80 °C at 10:00 h, owing to the difference in the pavement heating rate caused by different plant spacings. Among them, the pavement with 9 m spacing had a significantly higher heating rate than the pavement with the other two spacings.
Figure 6 shows a PET cloud image of the N–S pavement at 14:00 h under different plant spacings. The statistical analysis of the grids from (48, 65) to (53, 35) yielded the following: (a) When the plant spacing was 3 m, the average PET along the pavement was 44.39 °C, and the distribution was relatively uniform, with 85.03% of the area having 44–45 °C. (b) When the plant spacing was 6 m, the average PET along the pavement was 45.08 °C, and some areas of the pavement had local high temperatures; 67.38% of the area had 44–45 °C, whereas areas >47 °C accounted for 17.65%. (c) When the plant spacing was 6 m, the average PET along the pavement was 46.05 °C, and some areas were overheated. Among them, the area with PET > 47 °C accounted for 44.92%, whereas the area with PET of 44–45 °C only accounted for 44.92%.
Therefore, reducing the plant spacing of street trees effectively reduced the pavement PET, decreased local overheating area, yielded a more uniform pavement PET distribution, and provided a more stable change in the PET. The smaller the distance between the street trees, the lower the PET value. On average, every 3 m reduction in the distance between trees could reduce the PET by approximately 1 °C.

3.1.4. Summary

We explored the effect of plant spacing on the pavement thermal environment. We found that plant spacing could affect the pavement SVF, whereby plant spacing and SVF have a positive correlation. The smaller the plant spacing, the better the shading effect, the better the humidification and cooling effect, the more even the pavement temperature distribution, and a larger reduction in local overheated areas. Additionally, reducing the plant spacing can also decrease the Tmrt and PET of the pavement, yielding more even distribution.

3.2. Effect of Road Orientation on Pavement Thermal Environment

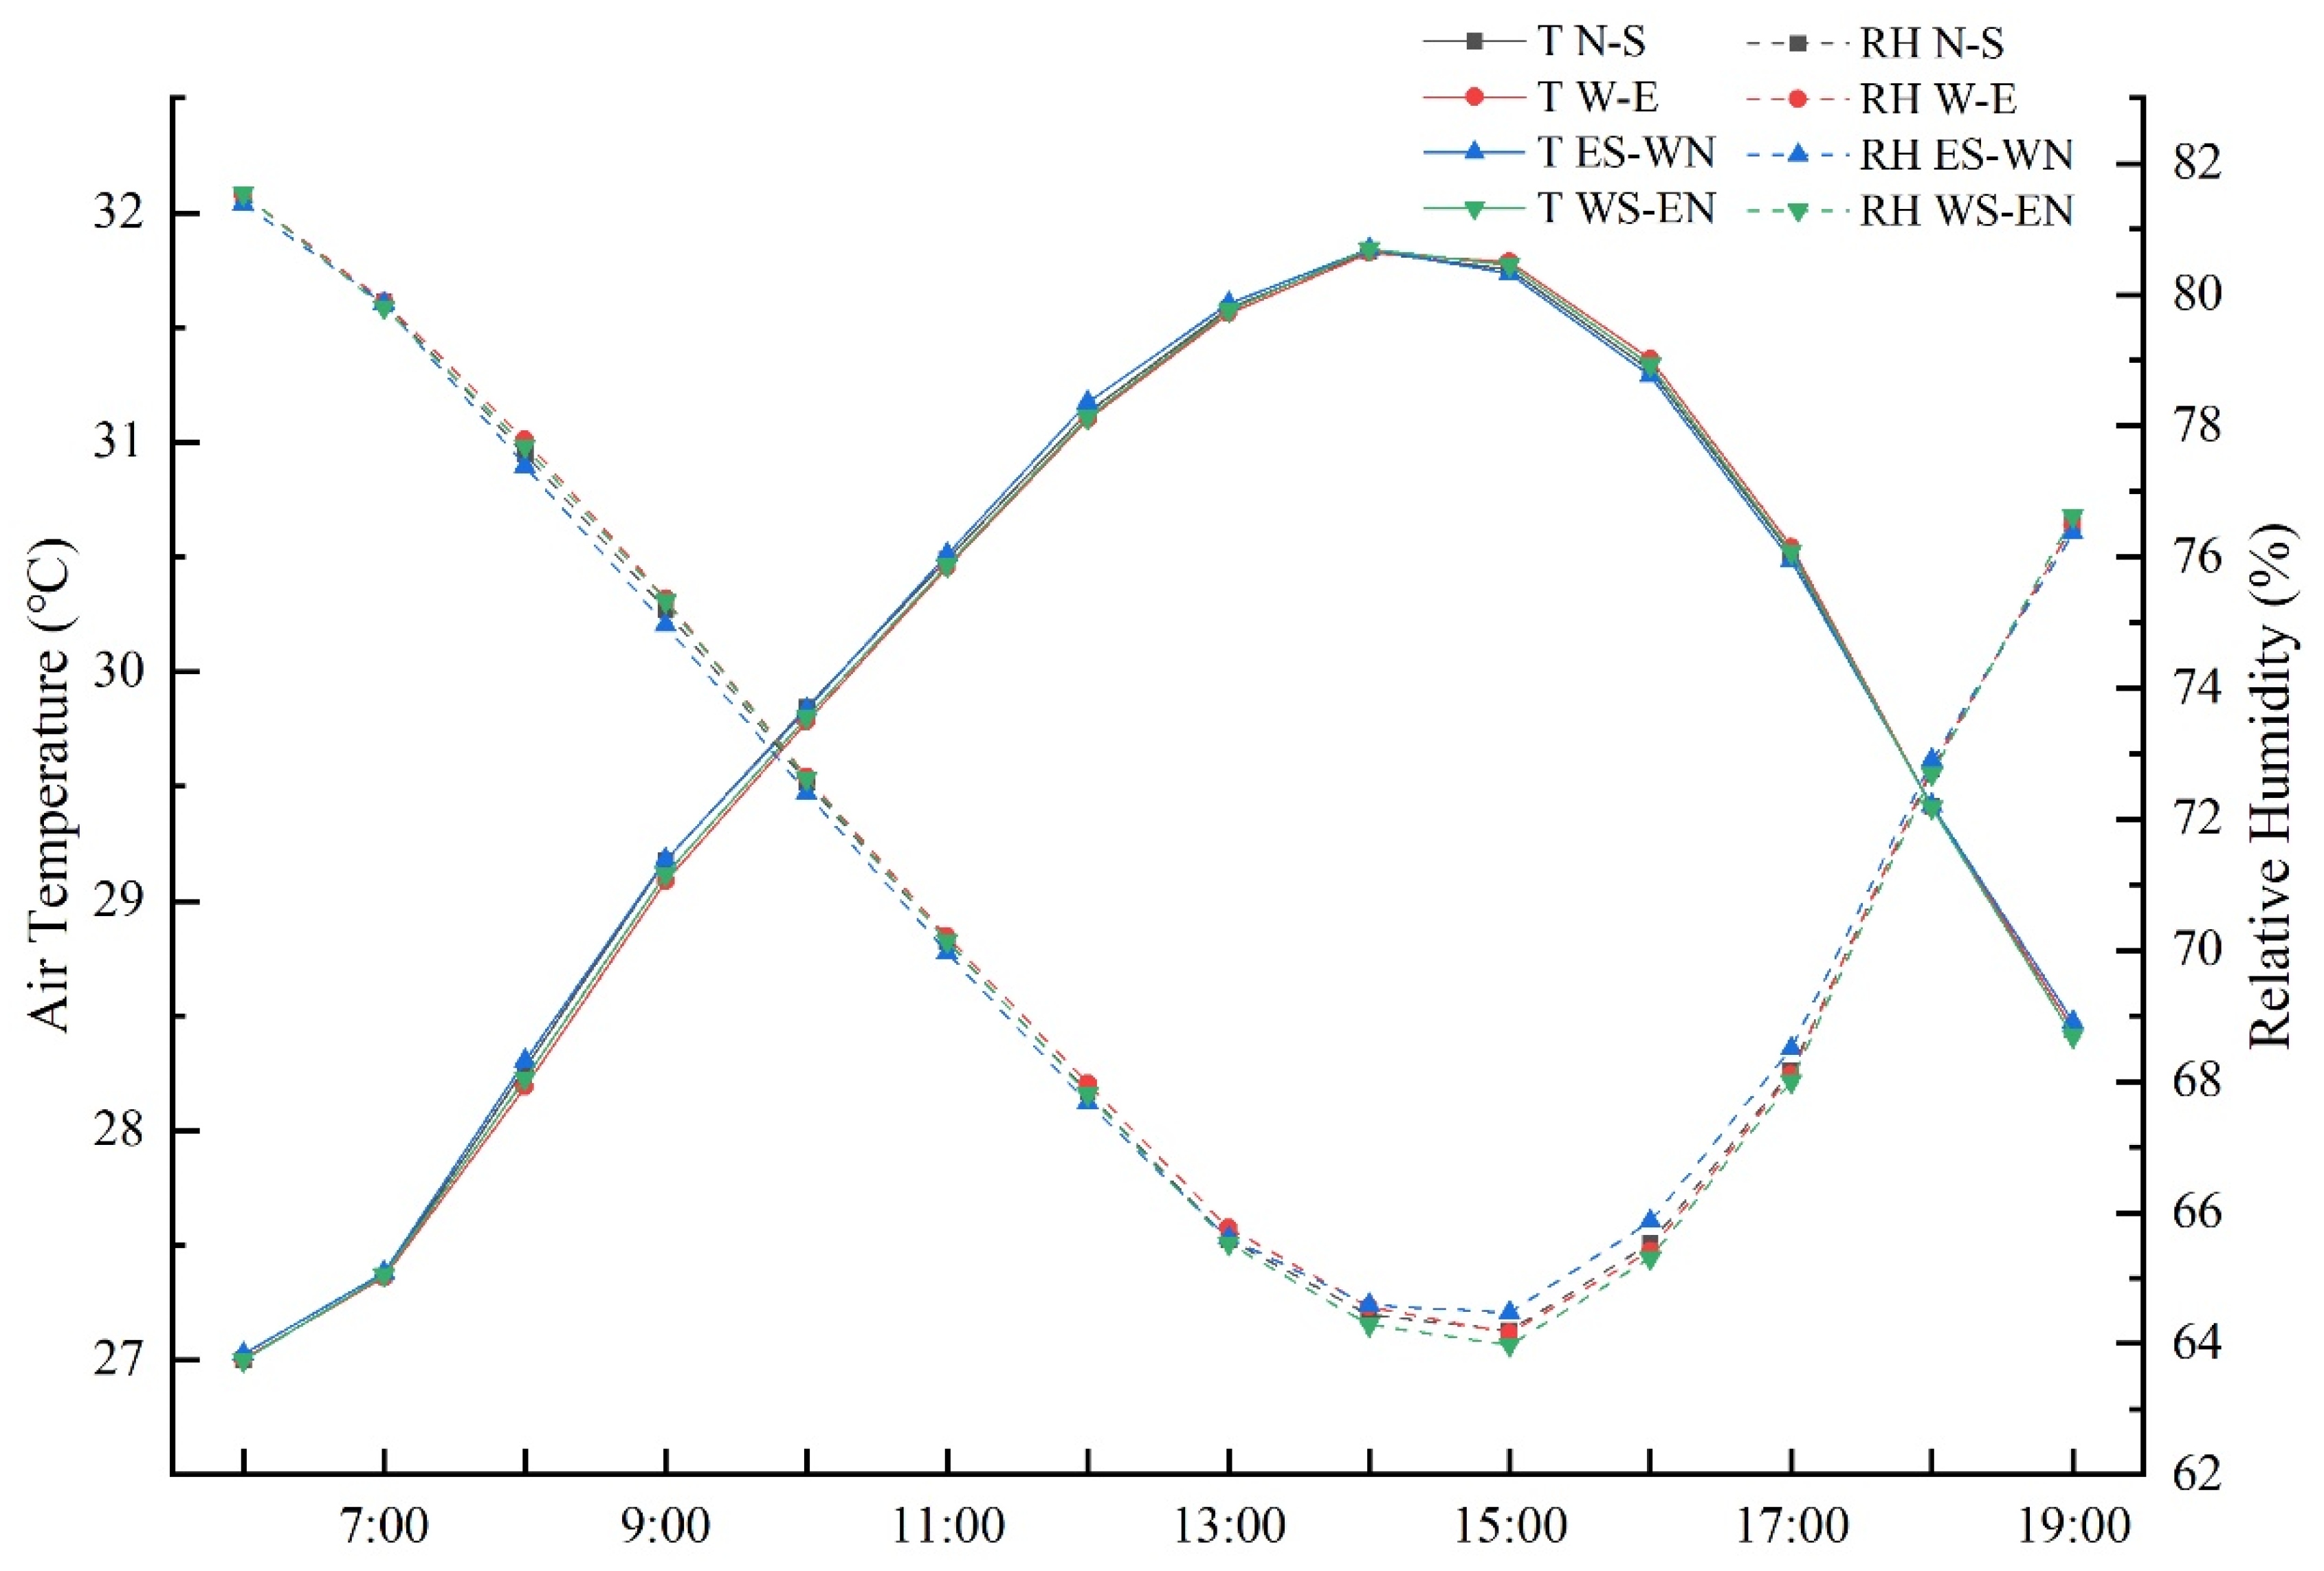
3.2.1. Comparative Analysis of Air Temperature and Relative Humidity

Table 4 lists the daily average temperature and humidity of pavements with different orientations. The difference between the average temperature and relative humidity during the simulation period was within 0.1 °C and 0.1%, respectively, indicating that the pavement orientation had a negligible effect on the pavement air temperature and humidity. Figure 7 shows the changes in the pavement temperature and humidity as a function of time in different directions. During the simulation period, the air temperature increased until 14:00 h and then decreased, whereas the relative humidity had an opposite trend. In the morning, the air temperature of the SE to NW facing pavements was slightly higher than that of the other pavements. After 14:00 h, the air temperature was slightly lower than that of the other pavements, where the difference was within 0.1 °C. The relative humidity change was opposite to air temperature change. This showed that the change in air temperature and relative humidity of the pavement facing SE–NW was slightly more stable than that of the other directions.

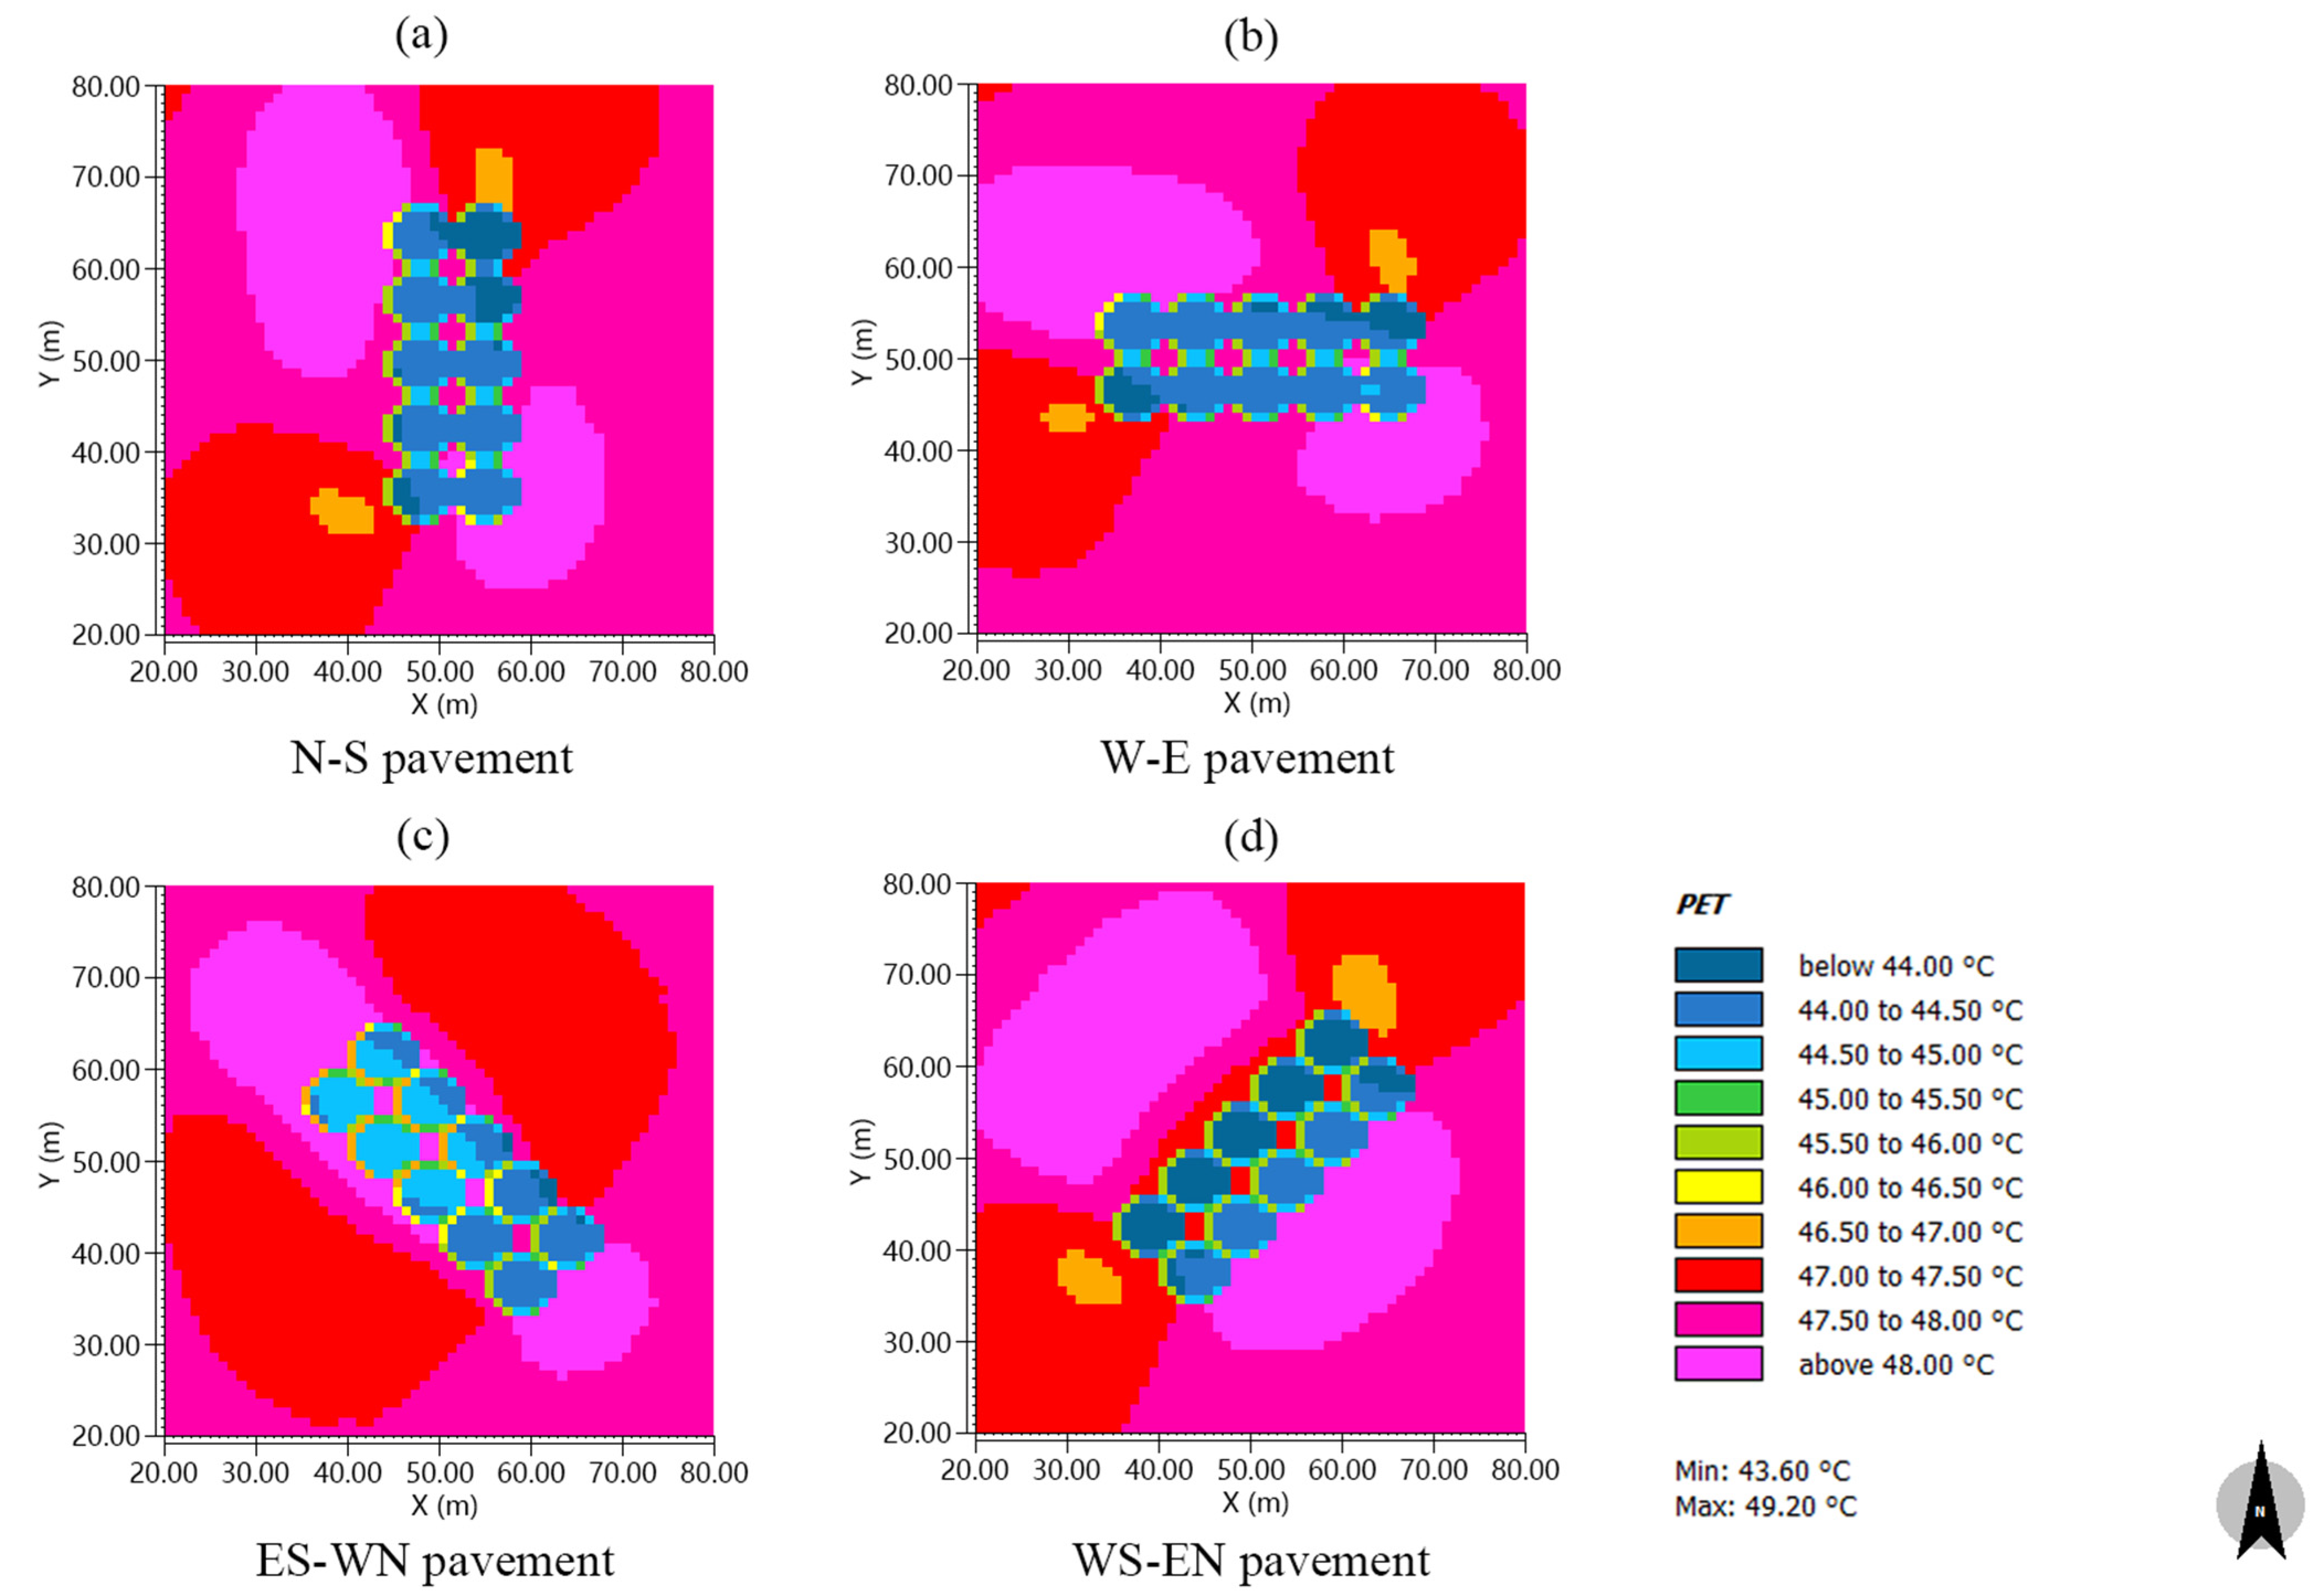
3.2.2. Comparative Analysis of Tmrt, Wind Speed, and PET

We compared the Tmrt of the pavements with different orientations (Figure 8). The south–north orientation of the pavement varied significantly; the Tmrt value was higher than that of pavements of other orientations. The Tmrt value changed steadily in the E–W direction; there was no notable sharp rise or decline. Figure 9 shows a comparison of the wind speed of the pavements in different directions. The changes in the wind speed in each direction were similar. The wind speed along the southwest (SW)–northeast (NE) pavement was significantly higher than in pavements of other orientations; the average wind speed was 1.17 m/s. The wind speed of the south–north and east–west pavements were relatively similar, that is, 1.1 and 1.08 m/s, respectively. The wind speed in the SE–NW direction was significantly lower than the other pavements, with an average wind speed of 0.95.
Figure 10 shows a comparison of the PET values of the pavements with different orientations. The average PET of pavements of SW–NE orientation was the lowest among the four orientations at 44.82 °C. The average PET in the SE–NW orientation was the highest at 45.50 °C. The average PET and regional PET distribution in the S–N and E–W orientations were similar.

3.2.3. Summary

This section explored the impact that road orientation has on the thermal environment of the pavement, revealing that the road orientation had a negligible impact on the average temperature and humidity during the pavement simulation, which were within 0.1 °C and 0.1%, respectively. However, road direction had a greater impact on wind speed. The wind speed was the largest in the SW–NE direction while it was the smallest in the SE–NW direction; the wind speeds in the S–N and E–W directions were between these extremes. Du et al. (2015) demonstrated that on-street canyons influence the street wind speed parallel to the dominant wind direction, which is higher than that of other streets and is different from the simulation results of the present study [22]. Besides trees on both sides of the pavement in the street valley, some buildings are impervious to wind. The street valley parallel to the prevailing wind direction facilitates the passage of the dominant wind. However, owing to blocking effects from buildings, the wind speed along pavements in the other street valleys was significantly lower than that of the street valleys that dominated the wind direction. In this study, the research object was the pavement, such that only pavement trees were considered on both sides, with no buildings. Although the street trees had a shielding effect, they could allow wind passage. Therefore, the distance that the wind passed through the SE–NW pavement parallel to the wind direction was significantly larger than that of the other directions; the sheltering effect of street trees on the wind was also the largest. Therefore, the wind speed of the pavement facing SE–NW was significantly lower than that of the other pavements.

3.3. Impact of Underlying Surface Material on the Thermal Environment of the Pavement

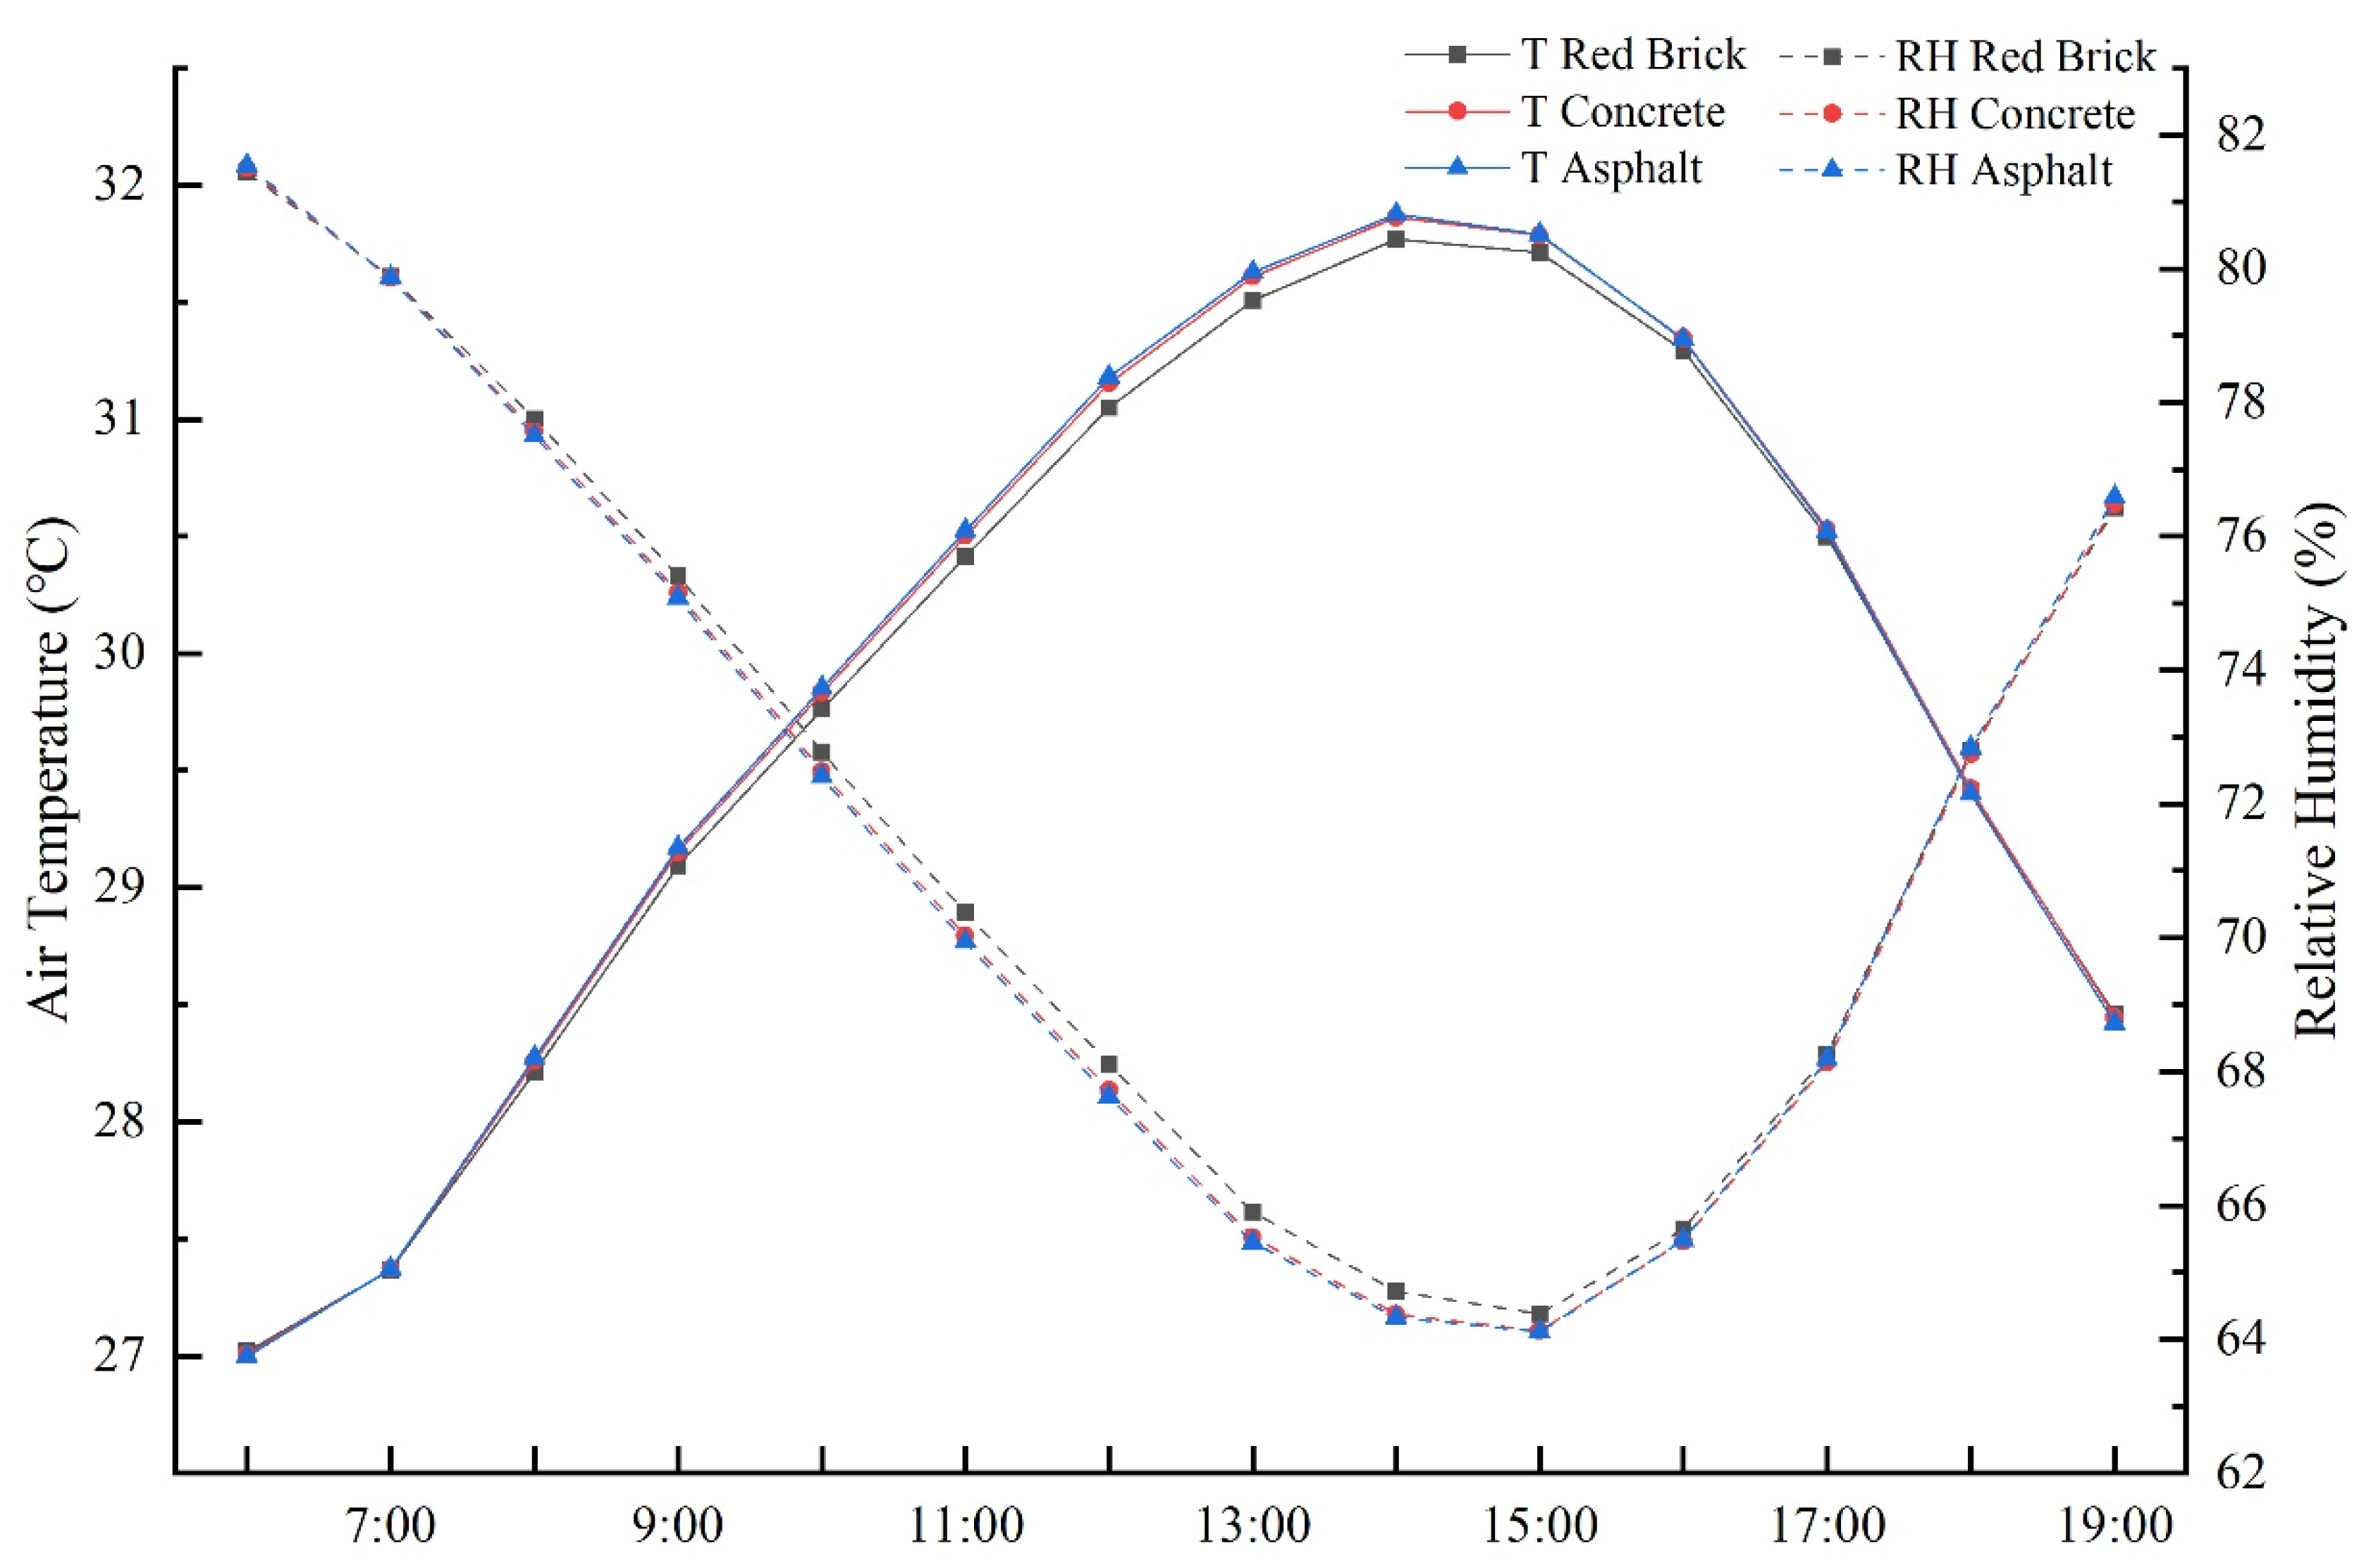
3.3.1. Comparative Analysis of Air Temperature and Relative Humidity

Figure 11 shows the chronological changes in the temperature and humidity of the underlying pavement composed of red brick, asphalt, and concrete. The air temperature first increased and then declined, while the trend in the relative humidity was the opposite. There was no significant difference in the air temperature and relative humidity between concrete and asphalt. The air temperature of red floor brick was slightly lower than that of asphalt and concrete during the simulation period; the average temperature was 0.05 °C lower than that of asphalt and concrete.

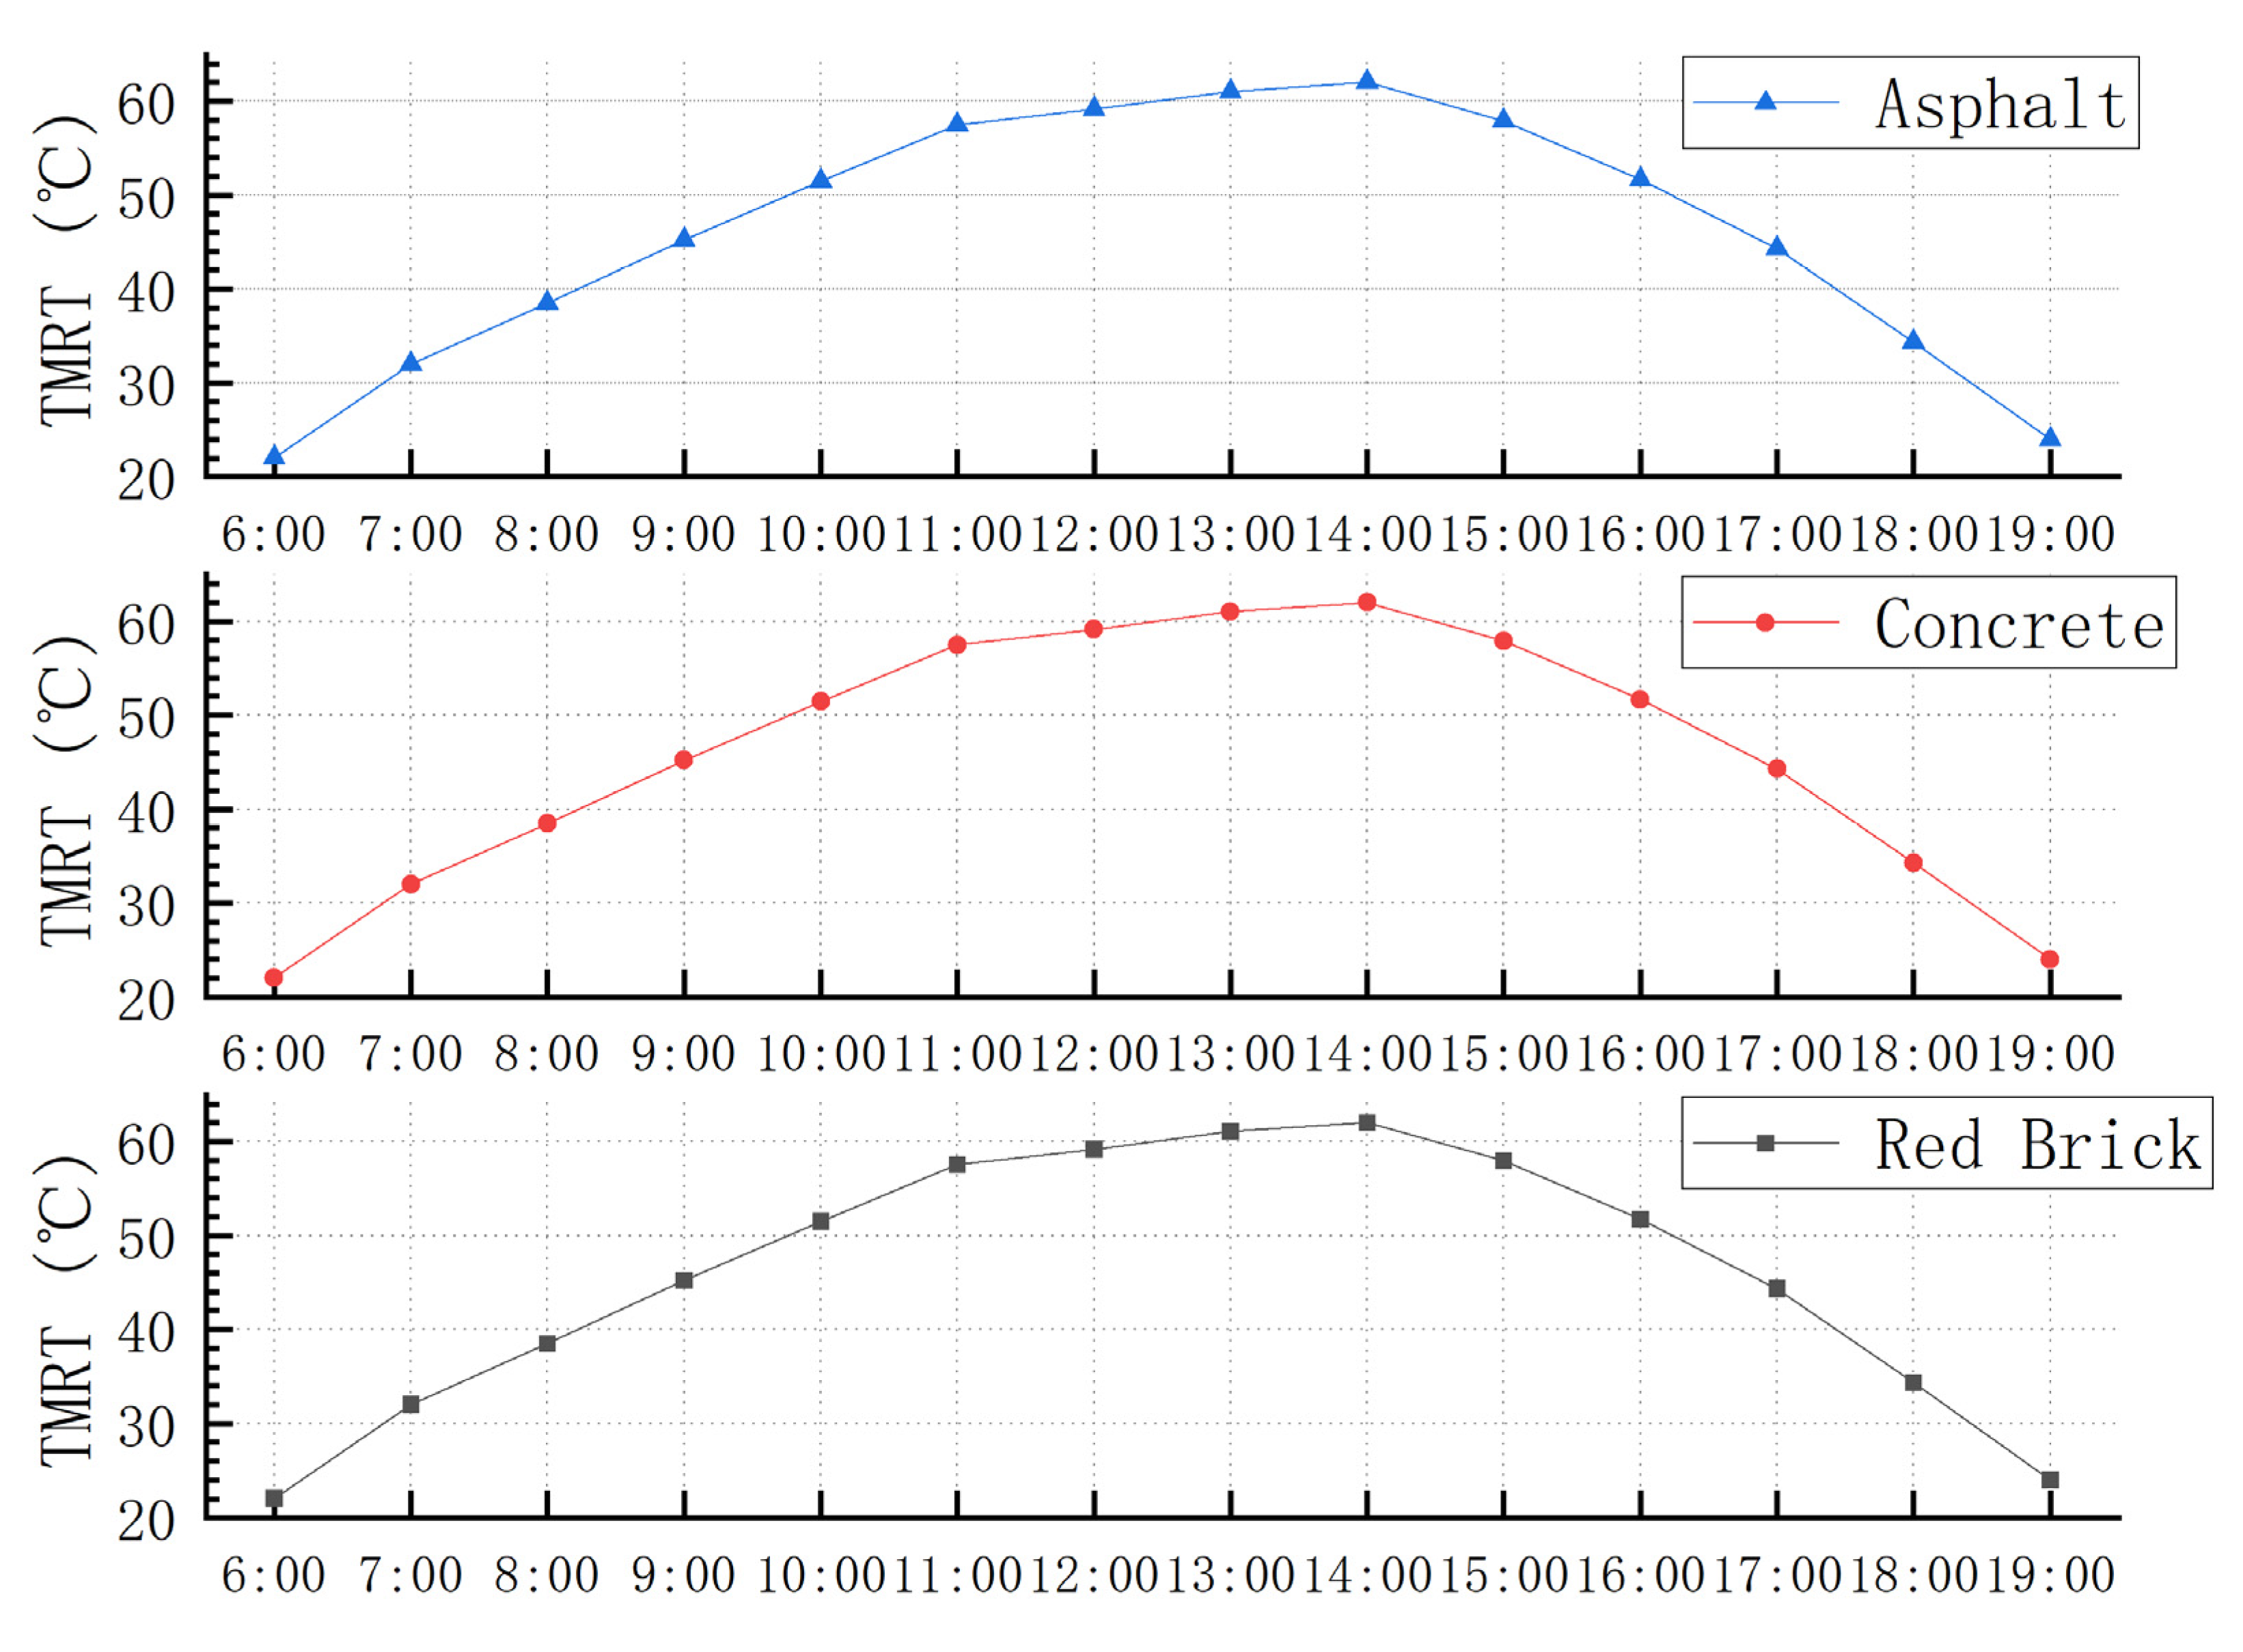
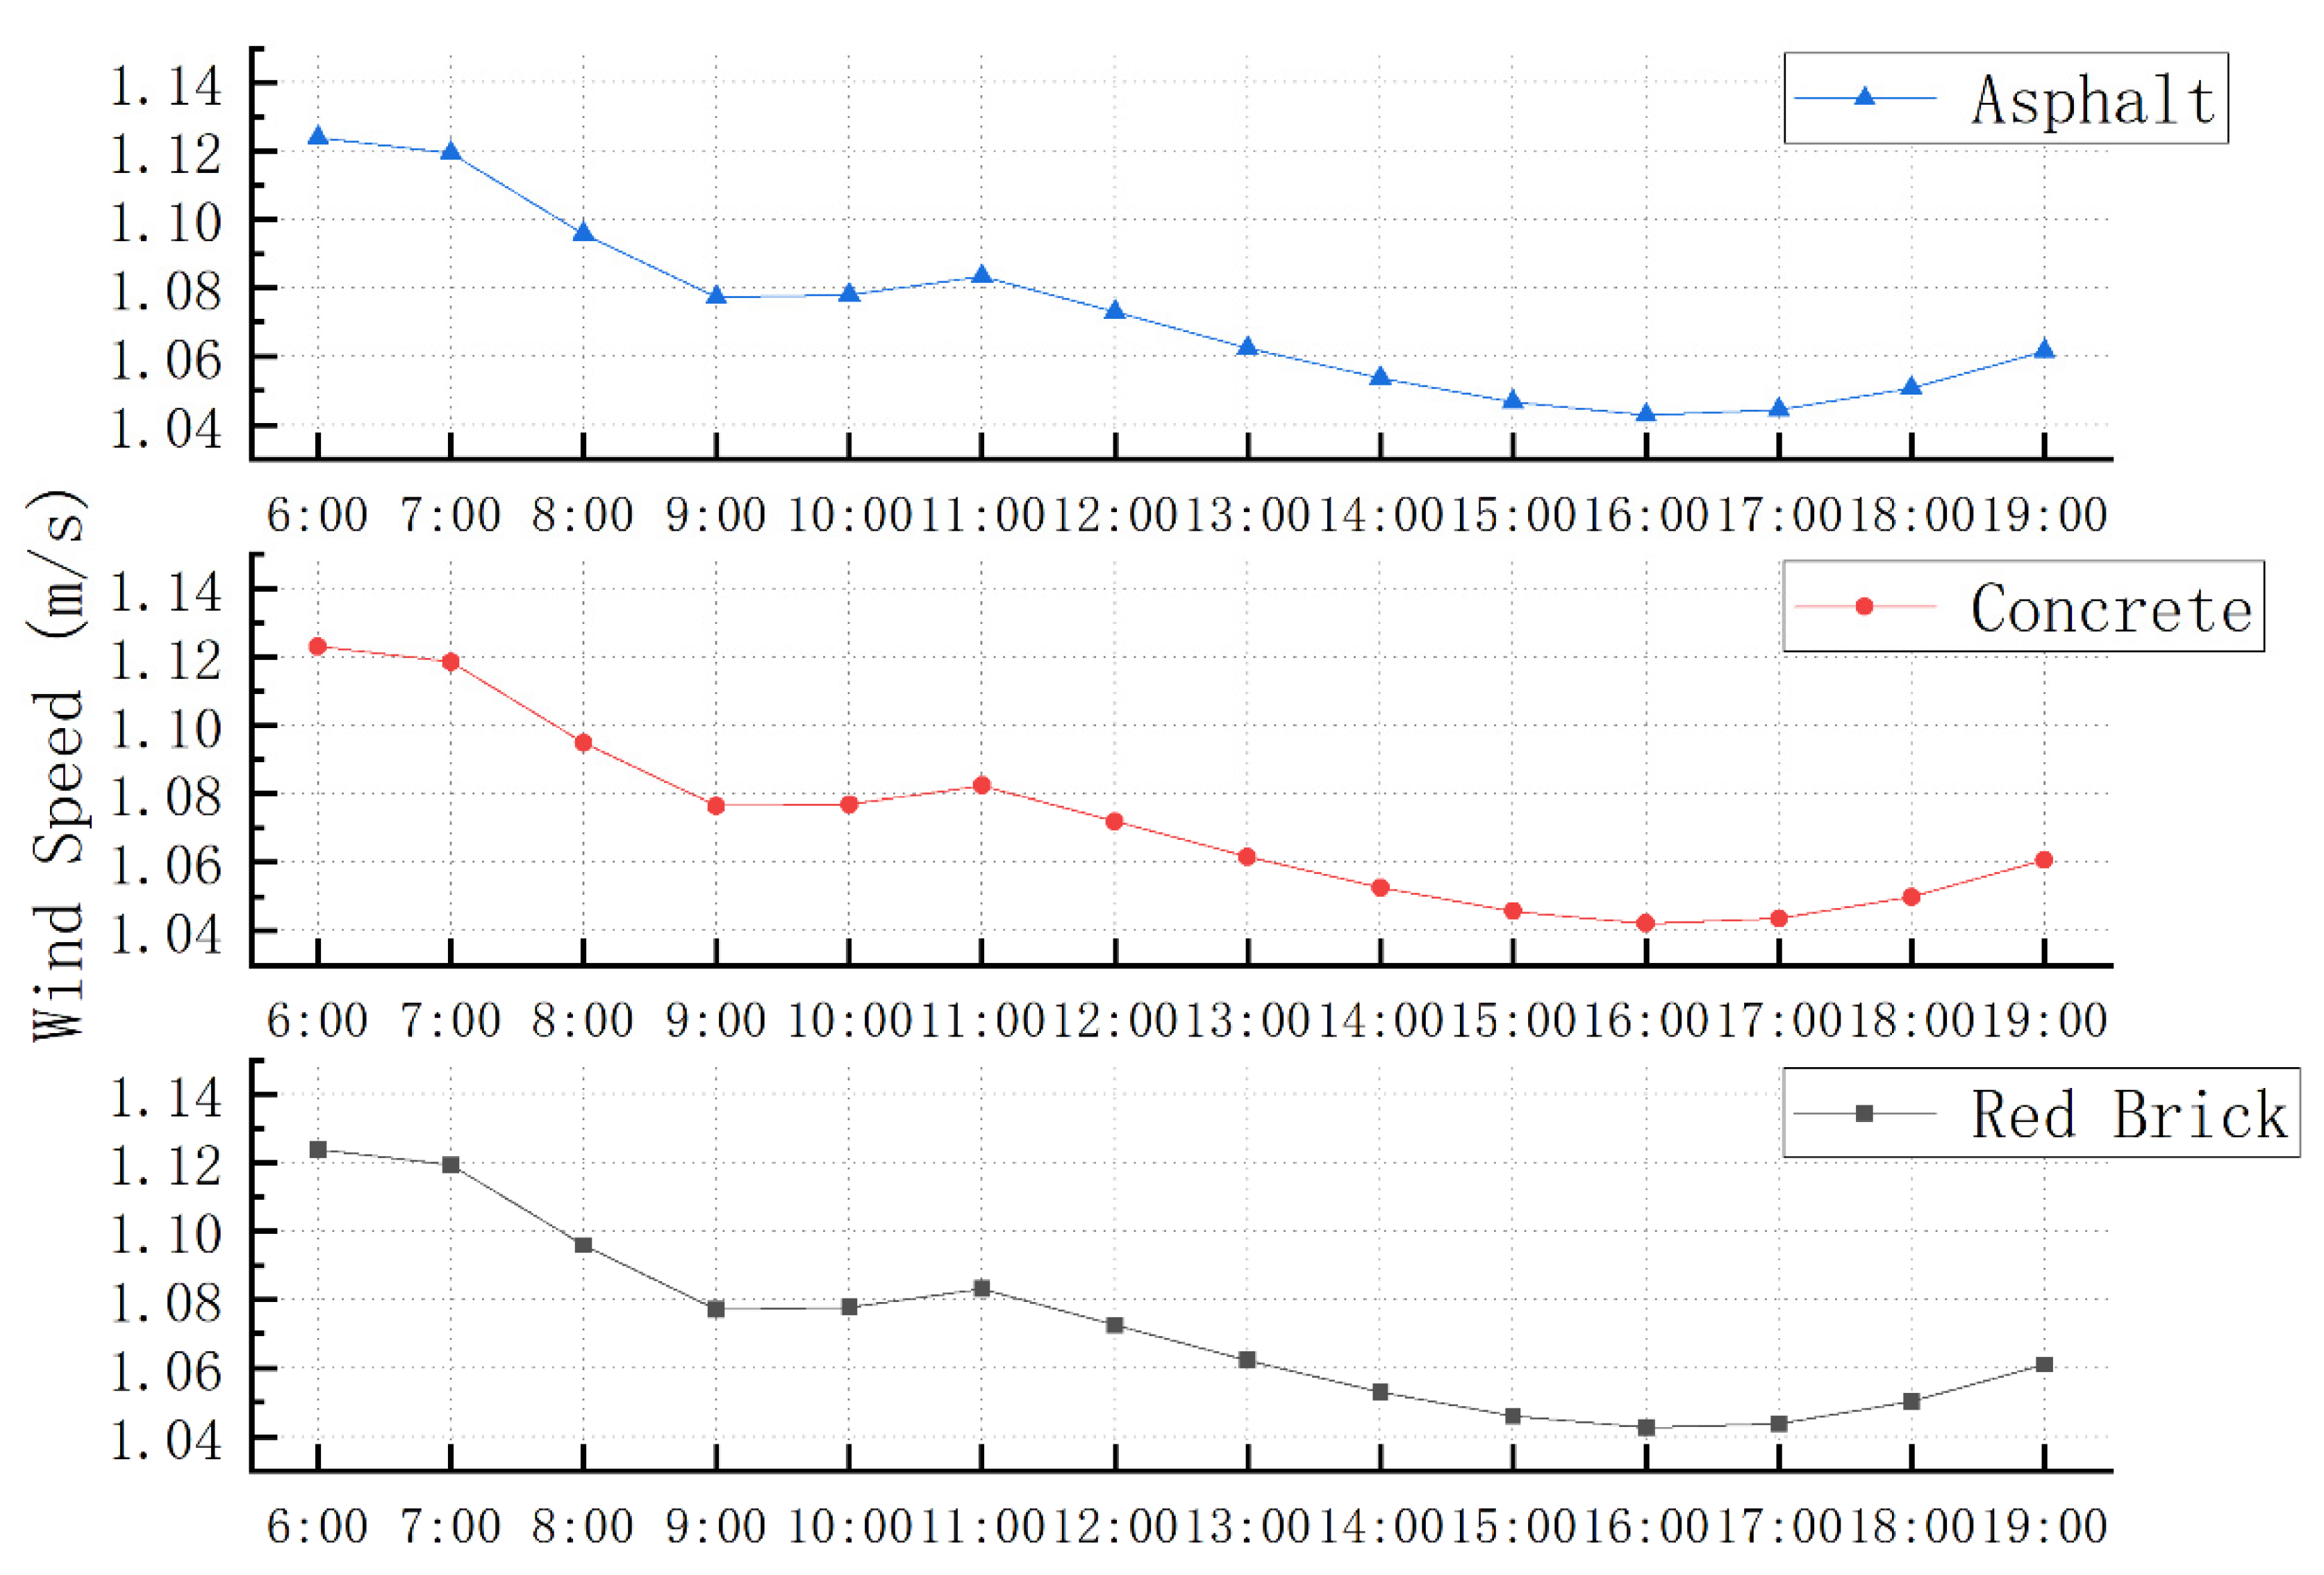
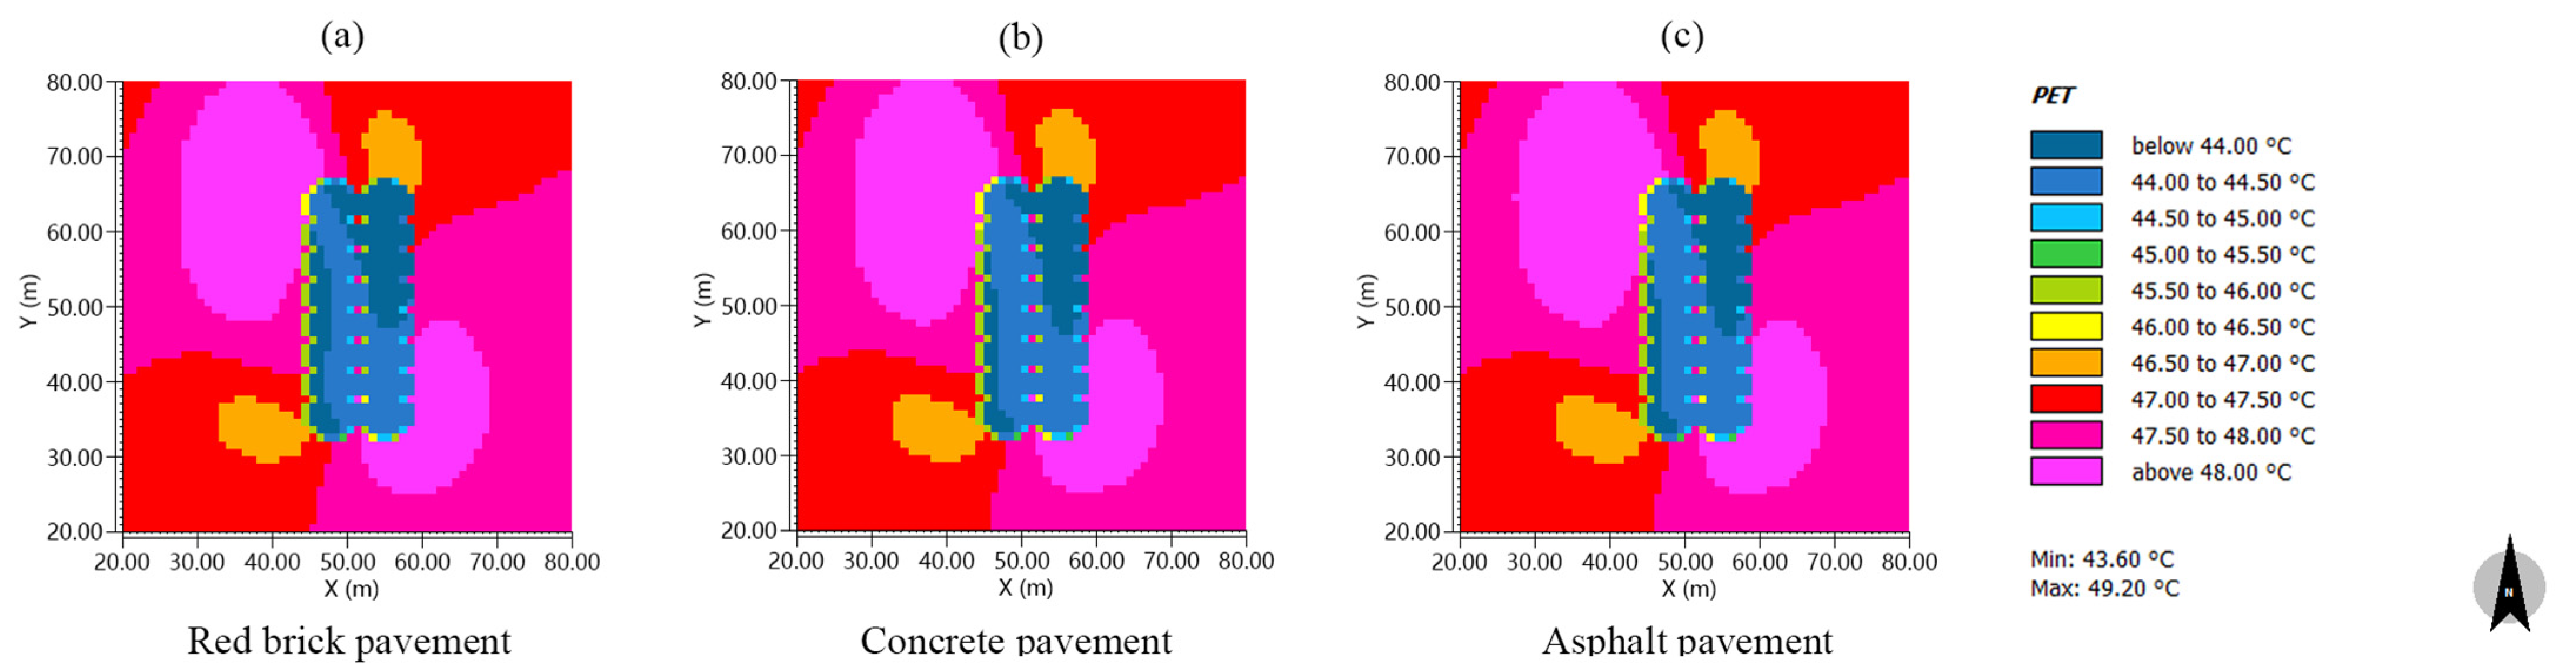
3.3.2. Comparative Analysis of Wind Speed, Tmrt, and PET

Figure 12 shows a comparative analysis of the wind speed for red brick, asphalt, and concrete, and the three curves in the figure basically coincide. The wind speed of the underlying concrete surface was only 0.001 m/s lower than that of the two other underlying surfaces, which may have been related to the ground roughness of the underlying surface.
Figure 13 shows a comparative analysis of the Tmrt values for red brick, asphalt, and concrete, and the black curve basically coincides with the blue curve. There was no significant difference in the Tmrt values of the underlying surface of the three materials, indicating that it had no significant effect on the Tmrt.
Figure 14 shows a PET cloud map of the S–N pavement on different underlying surfaces at 14:00. The various underlying surface materials had no significant effects on the PET distribution of the pavement. The average PET of the red floor brick, asphalt, and concrete was 45.08 °C, 45.13 °C, and 45.14 °C, respectively. The PET of the asphalt and underlying concrete surfaces was very similar, but the red tile underlying surface was 0.05 °C lower than that of the two other materials. As the comparison results of other road surfaces are almost the same as those of the north–south road surfaces, only one set of data results is selected for display.

3.3.3. Summary

This section investigated the impact that the underlying surface material had on the pavement, revealing that the temperature, humidity, Tmrt, and PET of the asphalt and underlying concrete surfaces had negligible differences. Comparing asphalt and underlying concrete surfaces, the relative humidity of red brick during the simulation period was slightly higher than the former two materials. In contrast, the air temperature, Tmrt, and PET were slightly lower than the former two materials. However, the differences among the three materials were negligible. Therefore, the underlying surface material impacted the thermal environment of the pavement. Generally, the impact of the underlying surface material on the pavement was not as large as those of the plant spacing and road orientation.

4. Discussion

In this study, the thermal environment along the pavement of Zhonghuan West Road, Guangzhou University, was measured and numerically simulated using EMVI-met to examine the influence of design factors, such as different road orientations, underlying surface materials, and plant spacing, on the thermal environment. This experiment was only carried out under high-temperature conditions in southern China, and no relevant experiments were carried out during the cold season. The main conclusions were as follows.
(1)
Street tree spacing had the greatest effect on the thermal environment of the pavement in this study. Relevant studies have shown that solar radiation is an important factor affecting the pavement thermal environment. Pavement trees can provide shade along the pavement and effectively reduce the penetration of direct solar radiation. The smaller the plant spacing, the smaller the SVF, the higher the shading rate, and the more notable the ability of street trees to humidify and cool the pavement. The numerical simulations revealed that for every 3 m reduction in the distance between street trees, the air temperature decreased by up to 0.25 °C and the relative humidity increased by 1.29%. Additionally, reducing the pavement tree spacing resulted in a uniform pavement temperature distribution, reduced local overheated areas, and improved resident comfort when walking in summer.
(2)
The road direction affected the pavement thermal environment. There was no significant difference in the temperature and humidity in each direction. However, the change in the air temperature and relative humidity of the pavement in the SE–NW direction was more stable than in the other directions. The wind speed of SW–NW toward the pavement was higher than that in other directions. SE–NW had the lowest wind speed. The wind speeds of S–N and E–W toward the pavement were similar. Furthermore, the wind speed changes in each direction were similar. This may be related to the occlusion effect of the pavement trees. The pavement facing SE–NW was parallel to the dominant wind, such that the loss of wind passing through the pavement was significantly higher than that of the pavements in other orientations. Therefore, the wind speed of the pavement facing SE–NW was significantly lower than that of the other pavements.
(3)
The underlying surface material had the least effect on the pavement thermal environment. There was no notable difference in the wind speed and Tmrt of the underlying surface with different materials. The average air temperature of the red brick was slightly lower than that of asphalt and concrete, whereas its relative humidity was slightly higher than that of asphalt and concrete.

5. Conclusions

Asia is the current urbanization hotspot; China and India, in particular, have the largest areas of urban expansion areas [23]. Over the next 30 years, China is likely to experience massive urbanization. Six megacities with populations of more than 8.9 million are located in China [24]. The problems of the urban ecosystem, especially the urban thermal environment, are becoming more and more obvious [25,26,27]. As a special urban underlying surface, the urban road is an important factor affecting the urban thermal environment. Similarly, the thermal environment of the road affects people’s comfort.
This experiment has a certain reference value for the study of the thermal environment in southern China. According to the experimental results, it can be known that to improve the comfort of pavement, street tree spacing can be reduced to a certain extent. However, due to limited time, this experiment did not measure the thermal environment during the cold season or whether reducing the distance between trees during the cold season had a positive effect on pavement. This experimental study has implications for pavement design; pavement design materials can be more practical and environmentally friendly when the underlying surface material is hardly a factor affecting the thermal environment of pavement. The experience has not been evaluated for road life extension but can lead to a reduction in urban infrastructure costs and an improvement in environmental conditions. This proposal could serve as a strategy for sustainable development.

Author Contributions

All authors contributed to the study conception and design. Material preparation and data collection and analysis were performed by Z.Z., T.Z. and Q.L. The first draft of the manuscript was written by L.L., Corresponding author X.Z. guides the manuscript throughout the process. All authors have read and agreed to the published version of the manuscript.

Funding

This research was funded by the Science and Technology Plan of Guangzhou, grant number 201904010251 and the Natural Science Foundation of Guangdong General Project, grant number 2020A1515011583).

Data Availability Statement

The datasets generated during or analyzed during the current study are available from the corresponding author on reasonable request.

Conflicts of Interest

The authors have no relevant financial or nonfinancial interests to disclose.

References

  1. Asaeda, T.; Thanh, C.V.; Wake, A. Heat storage of pavement and its effect on the lower atmosphere. Atmos. Environ. 1996, 30, 413–427. [Google Scholar] [CrossRef]
  2. Sailor, D.J. Simulated urban climate response to modifications in surface albedo and vegetative cover. J. Appl. Meteorol. 1995, 34, 1694–1704. [Google Scholar] [CrossRef] [Green Version]
  3. Menon, S.; Akbari, H.; Mahanama, S.; Sednev, I.; Levinson, R. Radiative forcing and temperature response to changes in urban albedos and associated CO2 offsets. Environ. Res. Lett. 2010, 5, 014005. [Google Scholar] [CrossRef]
  4. Gaitani, N.; Michalakakou, G.; Santamouris, M. On the use of bioclimatic architecture principles in order to improve thermal comfort conditions in outdoor spaces. Build. Environ. 2007, 42, 317–324. [Google Scholar] [CrossRef]
  5. Sreedhar, S.; Biligiri, K.P. Comprehensive laboratory evaluation of thermophysical properties of pavement materials: Effects on urban heat island. J. Mater. Civ. Eng. 2016, 28, 04016026. [Google Scholar] [CrossRef]
  6. Kappou, S.; Souliotis, M.; Papaefthimiou, S.; Panaras, G.; Paravantis, J.A.; Michalena, E.; Hills, J.M.; Vouros, A.P.; Ntymenou, A.; Mihalakakou, G. Cool Pavements: State of the Art and New Technologies. Sustainability 2022, 14, 5159. [Google Scholar] [CrossRef]
  7. Mascaró, J.J. Shaded pavements in the urban environment–A case study. Road Mater. Pavement Des. 2012, 13, 556–565. [Google Scholar] [CrossRef]
  8. Li, H.; He, Y.; Harvey, J. Human thermal comfort: Modeling the impact of different cool pavement strategies. Transp. Res. Rec. 2016, 2575, 92–102. [Google Scholar] [CrossRef]
  9. Lin, B.S.; Cho, Y.H.; Hsieh, C. Study of the thermal environment of sidewalks within varied urban road structures. Urban For. Urban Green. 2021, 62, 127137. [Google Scholar] [CrossRef]
  10. Liu, Z.; Li, S.; Jun, S. Ecological effect of growing different street trees species in institutional campus. Chin. J. Eco-Agric. 2007, 4, 208–210. [Google Scholar]
  11. Shahidan, M.F.; Shariff, M.K.M.; Jones, P.; Salleh, E.; Abdullah, A.M. A comparison of Mesua ferrea L. and Hura crepitans L. for shade creation and radiation modification in improving thermal comfort. Landsc. Urban Plan. 2010, 97, 168–181. [Google Scholar] [CrossRef]
  12. Shao, Y.H.; Liu, B.Y. A study on microclimate parameters of urban street space and its influential factors. Landsc. Architect. 2016, 23, 98–104. [Google Scholar]
  13. Takebayashi, H.; Kimura, Y.; Kyogoku, S. Study on the appropriate selection of urban heat island measure technologies to urban block properties. Sustain. Cities Soc. 2014, 13, 217–222. [Google Scholar] [CrossRef]
  14. Xiong, X. Study on the Impact of SVF on Outdoor Thermal Environment in Residential Area. Master’s Thesis, Guangzhou University, Guangzhou, China, 2018. [Google Scholar]
  15. Zhou, X.; Li, Q.; Li, L. Experimental measurement on the thermal environment of the sidewalk. Environmental Science and Engineering Proceedings of the 11th international symposium on Heating, ventilation and air conditioning. ISHVAC 2020, 2019, 837–845. [Google Scholar]
  16. Wang, M.; Li, Z.; Hong, Y.; Gao, R. Microclimate effects and human comfortability of street tree planting patterns in Hohhot. J. Northwest Univ. 2015, 30, 235–240. [Google Scholar]
  17. Xu, M.; Ho, B.; Jiang, R. Effects of avenue trees on human outdoor thermal comfort during summer on campus. Chin. Landsc. Arch. 2020, 36, 139–144. [Google Scholar]
  18. Yu, Q.; Meng, F.; Zhang, C. The vegetation influence on outdoor thermal environment of typical high-rise residential areas. J. Shandong Jianzhu Univ. 2018, 33, 49–55. [Google Scholar]
  19. Morakinyo, T.E.; Lau, K.K.; Ren, C.; Ng, E. Performance of Hong Kong’s common trees species for outdoor temperature regulation, thermal comfort and energy saving. Build. Environ. 2018, 137, 157–170. [Google Scholar] [CrossRef]
  20. Zhang, L.; Zhan, Q.; Lan, Y. Effects of the tree distribution and species on outdoor environment conditions in a hot summer and cold winter zone: A case study in Wuhan residential quarters. Build. Environ. 2018, 130, 27–39. [Google Scholar] [CrossRef]
  21. Ministry of Housing and Urban-Rural Development of the People’s Republic of China. 2013. Design Standard for Thermal Environment of Urban Residential Areas (JGJ286-2013). Available online: http://www.mohurd.gov.cn/gongkai/fdzdgknr/tzgg/201309/20130926224855.html (accessed on 16 April 2010).
  22. Du, X.; Shi, Y.; Zhang, Y. Field study on thermal environment of typical living street canyons in Guangzhou. Build. Sci. 2015, 31, 8–13+87. [Google Scholar]
  23. Kuang, W.; Du, G.; Lu, D.; Dou, Y.; Li, X.; Zhang, S.; Chi, W.; Dong, J.; Chen, G.; Yin, Z.; et al. Global Observation of Urban Expansion and Land-Cover Dynamics Using Satellite Big-Data. Sci. Bull. 2021, 66, 297–300. [Google Scholar] [CrossRef]
  24. Paravantis, J.A.; Tasios, P.D.; Dourmas, V.; Andreakos, G.; Velaoras, K.; Kontoulis, N.; Mihalakakou, G. A Regression Analysis of the Carbon Footprint of Megacities. Sustainability 2021, 13, 1379. [Google Scholar] [CrossRef]
  25. Goggins, W.B.; Chan, E.Y.Y.; Ng, E.; Ren, C.; Chen, L. Effect modification of the association between short-term meteorological factors and mortality by urban heat islands in Hong Kong. PLoS ONE 2012, 7, e38551. [Google Scholar] [CrossRef] [PubMed] [Green Version]
  26. Chan, E.Y.Y.; Goggins, W.B.; Yue, J.S.K.; Lee, P. Hospital admissions as a function of temperature, other weather phenomena and pollution levels in an urban setting in China. Bull. World Health Organ. 2013, 91, 576–584. [Google Scholar] [CrossRef]
  27. Ng, E.; Chao, R. The Urban Climatic Map: A Methodology for Sustainable Urban Planning; Routledge: London, UK; New York, NY, USA, 2015. [Google Scholar]
Figure 1. ENVI-met model made of trees and pavements. The top four (ad) are models with different orientations, whereas the bottom three (eg) are models with different plant spacing distances. (N–S: the north–south oriented pavement, W–E: the west–east oriented pavement, SE–NW: the southeast–northwest oriented pavement, NE–SW: the northeast–southwest oriented pavement).
Sustainability 14 07251 g001
Figure 2. Sky view factor (SVF) cloud images of the 12 models at a height of 1.5 m from the pavement. The colors represent the SVF values, with blue being the lowest and red the highest.
Sustainability 14 07251 g002
Figure 3. Changes in the air temperature and relative humidity over time at a height of 1.5 m from the pavement under different spacings.
Sustainability 14 07251 g003
Figure 4. Images of air temperature at a height of 1.5 m from the pavement under different plant spacings at 15:00 h from south to north facing the pavement: (a) a N–S pavement with a spacing of 3 m; (b) a N–S pavement with a spacing of 6 m; (c) a N–S pavement with a spacing of 9 m.
Sustainability 14 07251 g004
Figure 5. Changes in the mean radiant temperature (Tmrt) as a function of time under different plant spacings.
Sustainability 14 07251 g005
Figure 6. PET at 14:00 h at a height of 1.5 m from the pavement: (ac) are models with different plant spacing distances.
Sustainability 14 07251 g006
Figure 7. Temperature and humidity of the pavement under different orientations as a function of time.
Sustainability 14 07251 g007
Figure 8. Tmrt of the pavement under different orientations as a function of time.
Sustainability 14 07251 g008
Figure 9. Wind speeds of the pavement under different orientations as a function of time.
Sustainability 14 07251 g009
Figure 10. Comparison of the physiological effective temperature (PET) with pavement orientation: (ad) are models with different pavement orientations.
Sustainability 14 07251 g010
Figure 11. Temperature and humidity of the pavement under different undersurface materials as a function of time.
Sustainability 14 07251 g011
Figure 12. Tmrt of the pavement under different undersurface materials as a function of time.
Sustainability 14 07251 g012
Figure 13. Wind speeds of the pavement under different undersurface materials as a function of time.
Sustainability 14 07251 g013
Figure 14. PET cloud images at a height of 1.5 m from the pavement at 14:00 h: (ac) are models with different undersurface materials.
Sustainability 14 07251 g014
Table 1. Simulation conditions for the ENVI-met model.
No.Road OrientationPlant Spacing (m)Underlying Surface MaterialNo.Road
Orientation
Plant Spacing
(m)
Underlying Surface Material
A1N–S3Red BrickB7SE–NW6Concrete
A2W–E3Red BrickB8NE–SW6Concrete
A3SE–NW3Red BrickB9N–S6Concrete
A4NE–SW3Red BrickB10W–E6Concrete
A5N–S3Red BrickB11SE–NW6Concrete
A6W–E3Red BrickB12NE–SW6Concrete
A7SE–NW3Red BrickC1N–S9Asphalt
A8NE–SW3Red BrickC2W–E9Asphalt
A9N–S3Red BrickC3SE–NW9Asphalt
A10W–E3Red BrickC4NE–SW9Asphalt
A11SE–NW3Red BrickC5N–S9Asphalt
A12NE–SW3Red BrickC6W–E9Asphalt
B1N–S6ConcreteC7SE–NW9Asphalt
B2W–E6ConcreteC8NE–SW9Asphalt
B3SE–NW6ConcreteC9N–S9Asphalt
B4NE–SW6ConcreteC10W–E9Asphalt
B5N–S6ConcreteC11SE–NW9Asphalt
B6W–E6ConcreteC12NE–SW9Asphalt
Table 2. Main input parameters for ENVI-met simulation.
Simulation ParameterInput Content
Meteorological parametersHourly air temperature, relative humidity, and solar radiation data from typical summer days; wind speed of 1.5 m/s, wind direction of 135.0°
Surface roughness: 0.1 m
Absolute air moisture content at 2500 m: 10.76 (g/kg)
Initial state of soil0–20 cm: 305 k/30%; 20–50 cm: 307 k/40%; under 50 cm: 306 k/50%
Ground structure and thermal propertiesConcrete pavement: 4 cm concrete—2 cm sand–soil
Red tile pavement: 3 cm red tile—1 cm sand–soil
Asphalt pavement: 4 cm asphalt—2 cm sand–soil
Total simulation time14 h (05:00–19:00 h)
Table 3. Statistics of the pavement at 1.5 m for sky view factor (SVF) distribution.
Planting Distance (m)SVF < 0.30.3 < SVF < 0.5SVF > 0.5
362.9%33.88%3.22%
62.14%94.09%3.77%
90.02%41.91%58.07%
Table 4. Average temperature and humidity during the simulation period for different pavement orientations.
DirectionN–SW–ESE–NWNE–SW
Average temperature (°C)29.8729.8529.8829.85
Temperature difference (°C)4.834.824.824.84
Average humidity (%)71.5671.6271.5771.52
Humidity difference (%)17.3217.3716.9117.56
Publisher’s Note: MDPI stays neutral with regard to jurisdictional claims in published maps and institutional affiliations.

