1. Introduction
The rapid development of urbanization has led to a series of problems such as dense high-rise buildings and aggravated heat island effect, which directly threaten the comfort of the living environment and the health of urban residents [
1,
2,
3]. It is critical to alleviate the heat island effect, improve the urban climate, and create a healthy living environment [
4].
In recent years, many microclimate and thermal comfort related research mainly focused on the thermal environment in different urban environmental sites in inland areas [
5,
6,
7,
8,
9,
10,
11,
12,
13]. Such as indoor and outdoor buildings [
10], urban parks [
14,
15,
16,
17,
18,
19], streets [
20,
21,
22,
23,
24], and the influence of plant species and forest types on thermal comfort [
25,
26,
27,
28]. Amani-Beni, M et al. [
25] confirmed the cooling impact of large urban parks on their surrounding architectural environment in summer by measuring air temperature and relative humidity; Blachowski, J et al. [
26] took Wroclaw as a case to evaluate the cooling effect of four urban parks at different scales in the temperate continental climate zone; Santiago, JL et al. [
28] investigated the impact of forests on urban thermal comfort and air quality; Yang Shimin et al. [
10] used Envi-met software to assessing the residential thermal environment in summer in Hangzhou; Hu Yang et al. [
23] comprehensively simulated the impact of urban street greening on air quality and microclimate. Reviewing these previous studies, which mostly carried out research under the climate background of typical inland cities, while little discussed the local microclimate characteristics and human comfort in coastal cities, and difficult to provide the constructive suggestions on the layout method of green space.
In China, Qinhuangdao has rich urban forest conditions and was awarded the title of National Forest City in 2018, and the research is of great value to the future development of the city. Qinhuangdao has a warm temperate semi-humid monsoon climate with southeast winds in summer and northwest winds in winter. Due to the tunable ocean climate, the land and sea winds are apparent in the coastal areas, and the southeast wind blowing from the ocean to the land in summer brings special climatic conditions to the coastal areas [
29,
30]. Therefore, Qinhuangdao, which has a sound policy background and coexists with various complex conditions, as the landing area of the research project can provide a scientific and comprehensive reference for the subsequent development of related research in other regions.
More and more scholars use various software to simulate thermal environments to assist research. In recent years, ENVI-met, CFD (Computational Fluid Dynamics) and EnergyPlus, etc. are widely used in thermal environment simulation research. Compared with other software, ENVI-met software is more suitable for the field of environmental design. It is a three-dimensional dynamic microclimate model developed by Michael Bruse (University of Mainz, Germany). The model can comprehensively consider various factors such as wind speed, wind direction, air temperature, humidity, turbulence, and radiation to simulate solid surface-plant-air interactions in urban environments. It is widely used in the fields of environmental design, urban meteorology and architecture. (Excerpted from the official website
https://www.envi-met.com/zh-hans/ accessed on 5 June 2022) So this paper choosed the ENVI-met software to simulate the research.
Based on the above, under the background of the national forest city construction in Qinhuangdao and tidal conditions of the coastal area, this study took the Qinhuangdao Civic Center urban forest, which is located between the city and the sea, as the research area. Considering the basic meteorological conditions of sea and land wind, Using ENVI-met microclimate simulation software as an auxiliary research tool, through the method of combining actual measurement and software simulation, systematically studied the changes of air temperature and humidity before and after the built-up of the site under different scenarios in summer. And we also analyzed the improved degree of human comfort. Results can help provide scientific planning inspiration for the future planning and construction of coastal urban forests based on the improvement of human comfort, and creating a better thermal comfort environment for urban residents.
2. Materials and Methods
2.1. Study Area Description and Site Selection
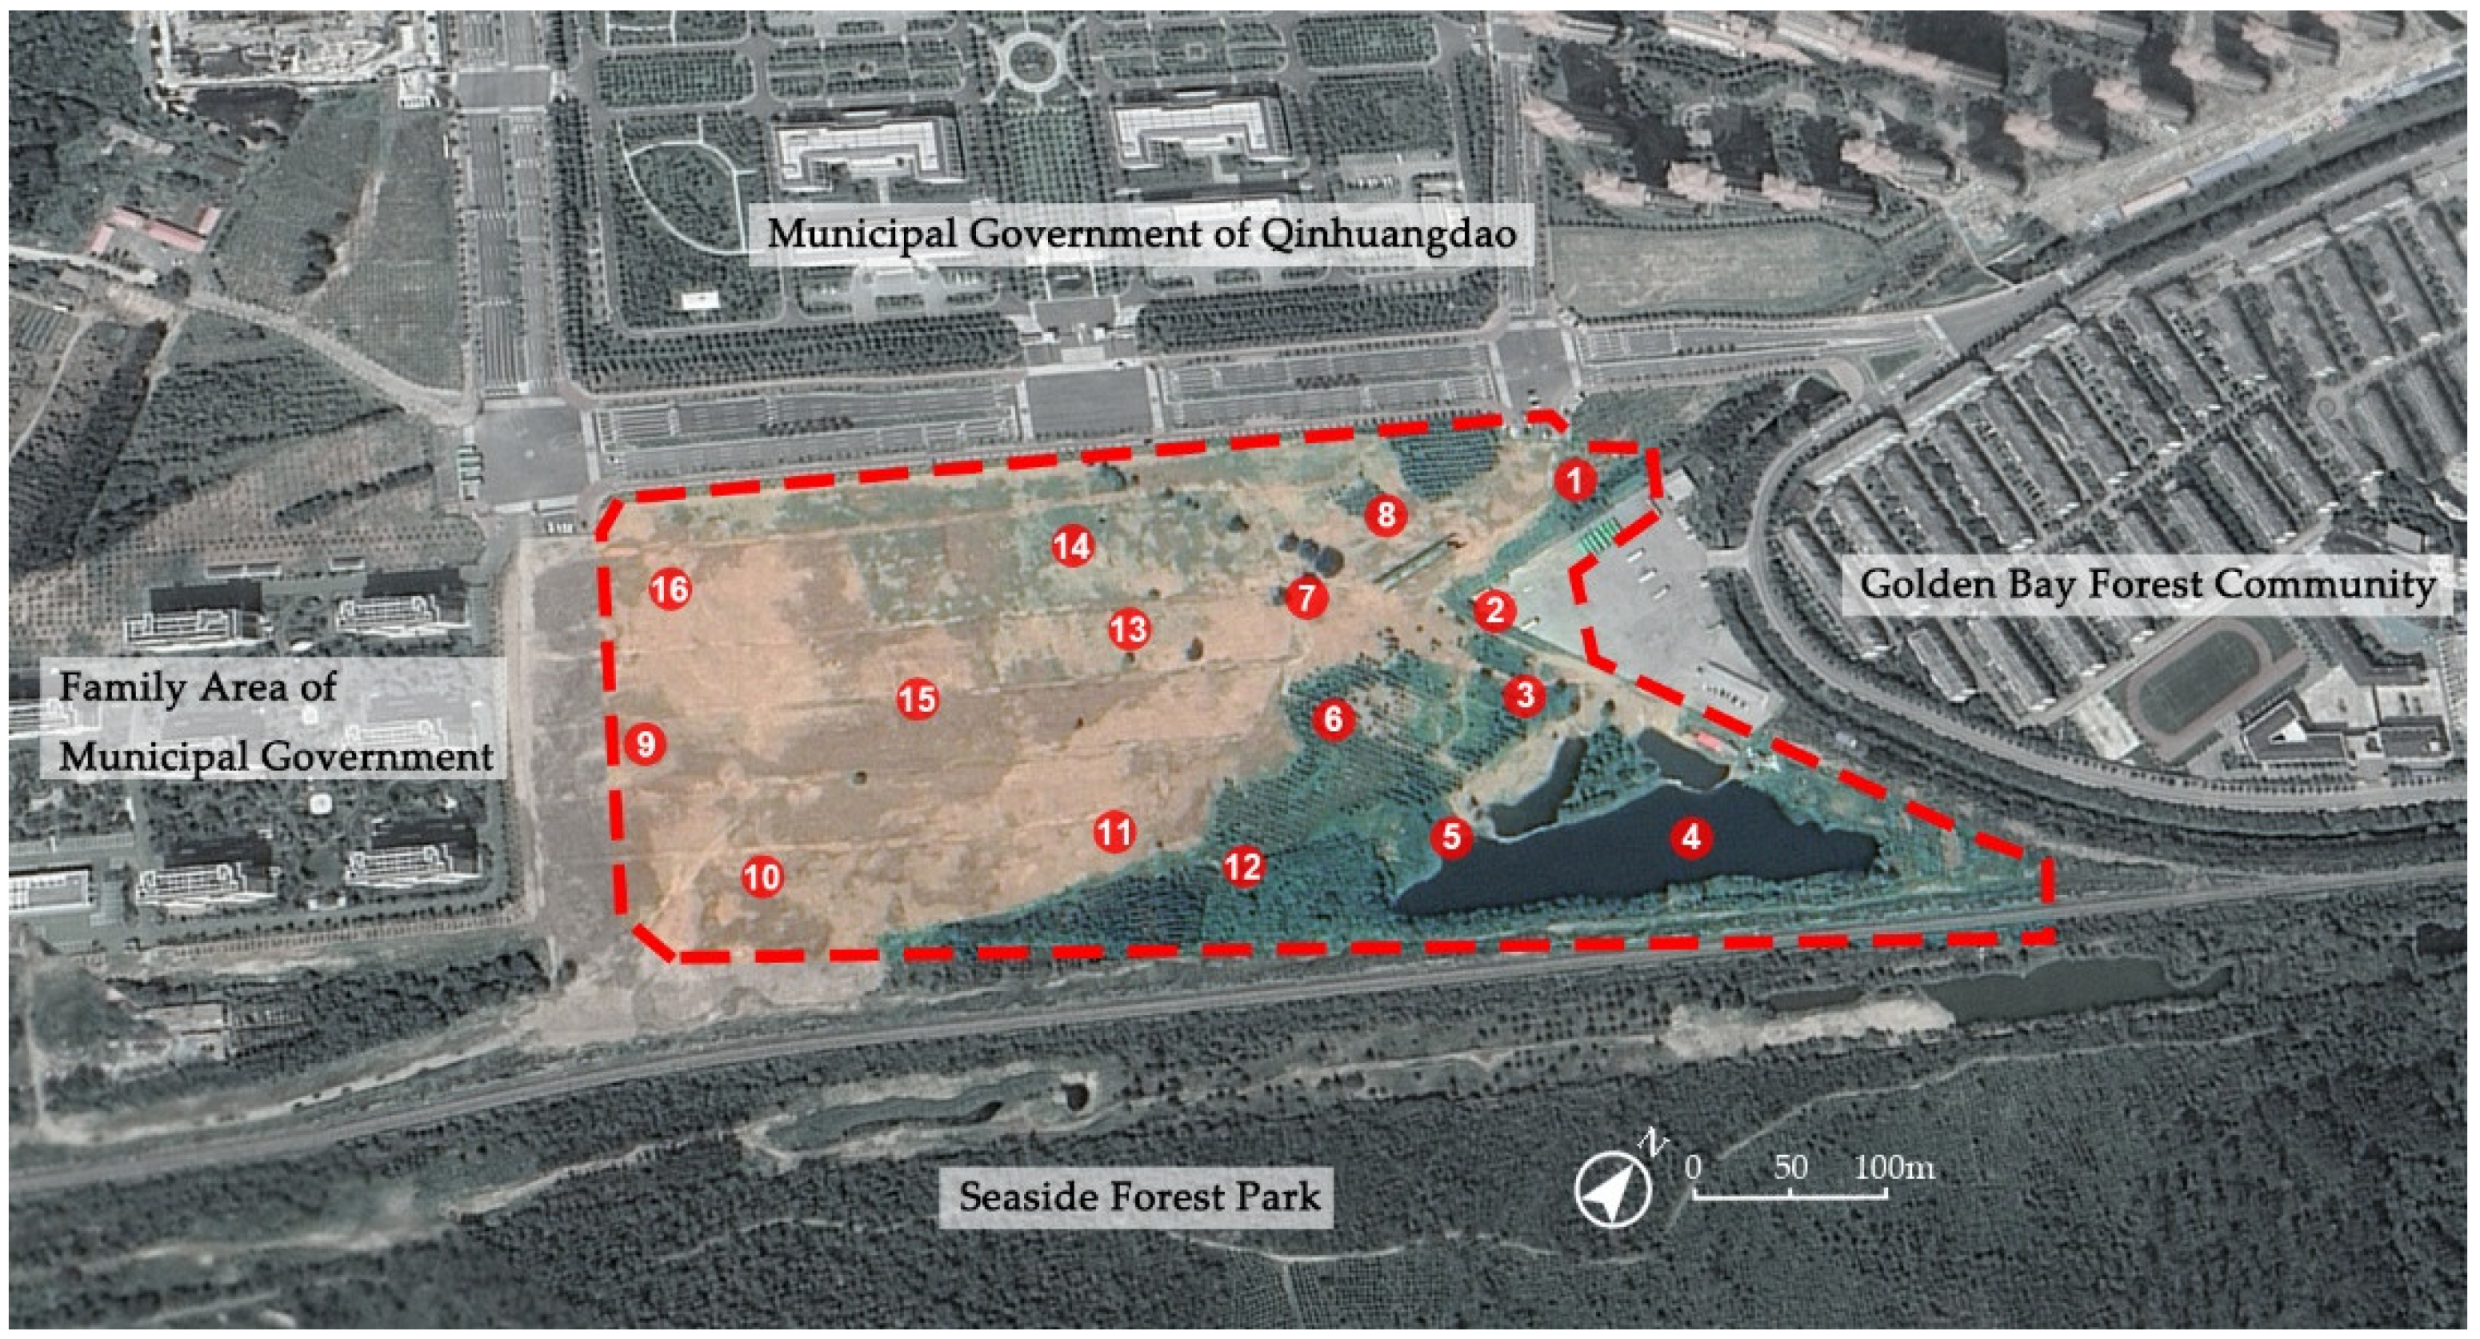
Qinhuangdao (N 39°24′~40°37′ and E 118°33′~119°51′), with a warm monsoon temperate climate located in the semi-humid zone. It is greatly influenced by the ocean and is relatively mild throughout the year. The annual average temperature is 11.2 °C, and the average precipitation is about 645 mm every year. The annual average wind speed is 2.5 m/s and 2.2 m/s in summer. There are many forest parks in Qinhuangdao, of which the Haibin National Forest Park is close to the Bohai Sea and is most affected by the tide and wind. Haibin National Forest Park is divided into two parts, north and south, of which the north park is close to three residential areas and the Qinhuangdao municipal government, and the surrounding environment is more complex than the south park. Moreover, the flow of people is more concentrated in south park. Therefore, the South Park, also known as the Qinhuangdao Civic Center Urban Forest, was chosen as the research area. It is located at the junction of Haigang District and Beidaihe District of Qinhuangdao, close to Binhai Avenue on the east side, with central train and bus stations on the north and south sides, and a large area of residential areas near the Qinhuangdao Municipal Government on the west side. The total area is about 134,000 m
2, and the existing water bodies area in the northeast of the site is 13,000 m
2. According to the geotechnical investigation report of the urban forest in Qinhuangdao Citizen Center, the research area was mainly shelter forest before built-up, with most bare soil and low vegetation coverage (
Figure 1). The soil surface layer is filled soil, thickness 0.5~7.5 m, under which is fine sand, thickness 0.7~5.4 m, silty clay thickness 0.5~6.5 m, coarse sand thickness 0.6~5.5 m, sandy cohesive soil thickness of 0.5~4.7 m, fully weathered mixed granite thickness of 0.6~1.1 m. The groundwater type in the site is diving, with a stable water level burial depth of 0.5 to 4.5 m, a stable water level elevation of 2.55 to 3.42 m, and an annual change of water level of about 1.0 to 2.0 m.
2.2. Methods
2.2.1. Field Measurement in the Coastal Urban Forest and Analysis of the Measured Parameters
Combined with the GOOGLE MAP of urban forests in the Civic Center (
Figure 2), 16 monitoring points were selected in the study area for microclimate factor measurement. The selected monitoring sites cover the main lower cushion surfaces and active space types in the study area (
Table 1). Roads, parking spaces, entrance plazas are mainly hard paved mat surfaces, and woodland and rain garden spaces are composed of green padding surfaces. The growth and maintenance of plants in the monitoring points are in good condition. All monitoring points are evenly distributed within the study area, and separated by a certain distance to avoid interference.
To avoid the interference of strong meteorological weather such as rainfall and cloudiness on the monitoring data, the field monitoring days of this study were selected from 22 June 2021 to 24 June 2021, and the test days were sunny and cloudless. The monitoring time was from 9:00 a.m. to 4:00 p.m. for each test. Every hour on the hour, the data was recorded, and the count was repeated three times at the same point. The air temperature, humidity, wind speed, and surface temperature of the selected 16 sample points were measured by Kestrel NK5500 (by Kestrel Meters) handheld anemometer and Fluke Ti401PRO (by FLUKE) thermal imager. The observation instruments were calibrated before the observation, and each observation parameter was obtained at 1.5 m from the ground.
2.2.2. Modeling of the Area after Built-Up
The SPACES module of ENVI-met 4.4.5 software was used to model the urban forest of Qinhuangdao civic center (
Figure 3). Model information includes terrain, underlying surface, buildings, and vegetation (type, quantity, height, and crown width), and the model is tested against the measured data (
Figure 4).
The setting of initial environmental parameters: environmental parameters were taken from the measured weather parameters combined and the meteorological data of the day released by the China Meteorological Network. Bring the environmental parameters of the monitoring day into the software as the initial simulation values. In order to ensure the stability of simulation data, the simulation period time was set from 6:00 a.m. to 6:00 p.m. on 22 June 2021, for 12 h simulation duration. According to the actual size of the site, the number of grids on the X, Y, and
Z-axis of the model was set as 227, 102, and 60, and the resolution of each axis was three meters. To reduce the influence of boundary, the height of the model’s
Z-axis must be more than twice the height of the highest building within the simulation range [
31]. Therefore, the number of grids on the
Z-axis was set as 60. Other simulation parameters were set according to the measured data of the day, as shown in
Table 2.
The setting of the vegetation parameter: vegetation model comprises three planting types, including trees, shrubs, and grasses. The planting design completion figure provides relevant information. The input parameters include the canopy structure information of plants, moisture and temperature data of each layer of soil, required meteorological parameters, and solar radiation coefficient.
Table 3 shows related parameter settings.
2.2.3. Compared and Analyzed the Results of the Measured Data and the Simulation after Built-Up
The accuracy of the model is mainly judged by two evaluation indicators. Namely, the roots mean square error (
RMSE) and the mean absolute deviation (
MAE) of the measured and simulated values [
32,
33]. Willmott pointed out that
MAE and
RMSE can reflect the average error of the model with some limitations, such as the relative size and source of the mean error [
34]. Based on the above, Willmott introduced consistency index d to illustrate the correlation between simulated and observed values. A value close to 1 indicates a higher correlation between the simulated value and the observed data. The calculation formula is as follows:
Pi and
Oi represent the simulated and observed values of the
ith experiment,
refers to the average value of observed data, and
N is the number of observations [
34].
The measured and simulated temperature and humidity values at 16 monitoring points in the study area are plotted (
Figure 5). The errors of measured and simulated values were calculated, and the error evaluation results were shown in
Table 4. From the calculation results, the
RMSE values of 16 monitoring points ranged from 0.25 to 0.83, the
MAE values were between 0.21 and 0.55, and consistency index d values were between 0.80 and 0.98; the
RMSE values of humidity were between 0.88 and 4.76, the
MAE values were between 0.69 to 4.07, and the consistency index d values were between 0.55 and 0.97. From the d values of temperature and humidity, the ENVI-met model was proved can predict the temperature and humidity variable indicators well, and the errors of each point were basically within the tolerance range of error made by the model in this study.
As seen in
Figure 5, the diurnal variation curves of air temperature were close to the standard distribution curve, showing an overall trend of rising first with peaking at around noon and then decreasing. The diurnal variation curves of relative humidity showed a contrary trend, and the trough values also appeared near noon. Therefore, this study selected 12 o’clock as the critical time for comparing comfort regulation be-fore and after the built-up of the study area.
2.2.4. Evaluation Methods of Human Comfort
This study adopted the widely used human comfort index (CI) came up by Beijing Meteorological Bureau [
35,
36]. The model considers comfort from temperature, humidity, and wind speed. Its calculation formula is:
CI is the human comfort index,
T represents the average temperature (°C),
RH represents the relative humidity (%), and
V is the wind speed (m/s). According to the unified standard stipulated by China Meteorological Administration, the specific classifications of human comfort are shown in
Table 5.
3. Results
3.1. Comparison of the Variability of Human Comfort in Various Types of Outdoor Spaces after Built-Up
Thermal imaging was used to investigate the differences in human comfort in various outdoor spaces, as well as the effects of various materials on the comfort index. As shown in
Table 6, comparing the thermal images of each monitoring point, (1) The surface temperature of diverse materials was impermeable color plastic > preservative wood > medium sand > granite > volcanic rock > vegetation > water bodies. (2) Materials with lower surface temperatures would moderately cool adjacent higher temperature materials. For example, at monitoring point 14, the surface temperature of the part of the anti-corrosion wood road near the vegetation was lower than that of the far from, and the vegetation material has a cooling effect on the other materials with a higher surface temperature. (3) The surface temperature of the same material with different laying forms, sizes, colors, and roughness is different. For example, monitoring points 1 and 9 are granite materials. The surface temperature of large-modulus granite was higher than that of small-modulus granite. The surface temperature of dark granite was higher than that of light granite, and the surface temperature of smooth granite was higher than that of rough granite. (4) It can be seen from monitoring point 4 that the farther away from the water bodies, the weaker the cooling effect. Monitoring point 1 showed the farther away from soft design elements such as vegetation and water bodies, the worse the cooling effect.
Comparing the human comfort index of different types of outdoor space, as shown in
Figure 6, the average comfort index of the same type of outdoor space in 16 monitoring points was obtained, and the results were as follows: 81.47 for waterfront space, 81.98 for large scale hard space, 82.67 for small scale hard space, 82.33 for forest edge space, and 82.96 for underwood space. Therefore, among the different types of outdoor spaces, the comfort of the waterfront space is the best, followed by large scale hard space, forest edge space, small scale hard space, and underwood space.
3.2. Simulation Analysis before the Area Is Built-Up
The model was established based on the pre-development site data, and the calibration simulation parameters were used to simulate the model. From
Figure 7, the microclimate simulation results before the built-up of the area showed that the average summer ambient temperature was about 29.8~31.4 °C, and the average relative humidity ranged from 48.8% to 52.5%. The difference between the relative humidity and the temperature of monitoring points was not apparent. Due to the influence of the tidal wind, the overall wind speed was high, between 0.28 m/s and 2.5 m/s. The CI of 16 monitoring points was shown in
Table 7. The comfort indexes of 16 monitoring points were between 81.96 and 83.77, demonstrating a relatively hot body feel. It might be attributed to a large area of bare land before built-up, resulting in higher values of temperature and wind speed factors. Besides, there is no local elevation change and plant enclosures inside the site so that no local microclimate can be formed.
3.3. Simulation Analysis after the Aerais Built-Up
First of all, we compared the results of the development of 16 monitoring points before and after. From
Figure 7, the average temperature after built-up was between 29.6 °C and 30.5 °C, 0.4 to 1.4 °C lower than before. The average relative humidity was between 48.91% and 52.84%, increased by 0.07% to 2.81% at 13 of the 16 monitoring points compared with before built-up. The results confirmed that the site had a cooling and humidifying effect after completion. As shown in
Figure 7, the completed site has formed several small spaces with good ventilation. The comfort indexes of the 16 monitoring points were between 81.00 and 83.68 (
Table 7). Among them, the comfort indexes of 12 sampling points had been optimized compared with before development, and the optimization range was 0.02 to 1.87. The comparison of various indicators of the site before and after development was shown in
Table 7. Boulevard space (monitoring points 3, 6, 7, 10, 13 and 15) and waterfront space (monitoring points 4 and 5) have more significant cooling and humidifying effects. The completed site has played a specific role in adjusting human comfort.
Next, combined with the simulation results before and after built-up in
Figure 7, we analyzed the microclimate in the whole park. The temperature of the park before the development was 29.8–31.4 °C, showing a higher temperature the closer to the southeast side. After the development, the temperature of the park was 29.6–30.5 °C, showing a gradual cooling trend from inside to outside. Compared with before the development, the temperature has dropped significantly. The humidity of the park before the development was 45.3–52.5%, showing a law of lower humidity as close to the southeast side. After the development, the humidity of the park was 49.2–59.9%, showing a trend of higher humidity the closer to the southeast. After the development, the relative humidity of the site increased significantly. Removing the influence of the building, the wind speed in the park before the development was 1.7–2.5 m/s, showing the law that the closer to the southeast, the lower the wind speed. After the development, in addition to the water surface of the east, the overall wind speed was 0.3–0.6 m/s, and the part of wind speed in open space reached 1.6 m/s. The water surface wind speed was 1.6–2.5 m/s, compared with before the development, the wind speed in other areas except the water surface has decreased significantly, and many spaces with good local ventilation effect had been formed.
Based on the above content, first of all, the simulation results for 16 monitoring points can be seen, (1) analysis of the results before and after the development of 16 monitoring points, in different types of outdoor space, the waterfront space comfort is optimal, followed by large scale hard space, forest edge space, small scale hard space, and underwood space. The water body has the best cooling and humidification effect on the surrounding environment of 9–18 m, and the human comfort index is the best. (2) The thermal surface radiation temperature in 16 outdoor space thermal images was analyzed, and the vegetation has a significant cooling effect on the surrounding environment. The farther away from the vegetation, the higher the average surface temperature. (3) Among the 16 monitoring points, the summer temperature dropped by 0.4 to 1.4 °C after development, the relative humidity increased by 0.07 to 2.81%, and the human comfort was optimized by 0.02 to 1.87. Next, combined with the results before and after the development of the whole park simulated by ENVI-met software, it can be seen that (1) after the development, the temperature of the whole park reduced by 0.2–1.8 °C, and the humidity is increased by 3.9–7.4%, and the wind speed reduced by 1.4–1.9 m/s. (2) Compared with the trend of a single change in temperature, humidity, and wind speed in the southeast direction of the park before the development, after the development of the park, several local microclimates were formed in the whole park.
4. Discussion
The site is located between the city and the ocean, and the site’s interior is always affected by the southeast wind from the ocean. Therefore, the park’s landscape structure can be constructed following the trend, forming a ventilation corridor inside the site. Meanwhile, the sea breeze is introduced into the city to alleviate the summer heat inside the city, making full use of the ocean’s role as a natural cold source.
- 2.
Expand water bodies and increase waterfront space
Water bodies have a good effect on the cooling and humidifying of the park environment and improve local wind speed. Before development, the scattered water bodies were systematically sorted, the original water system scope is appropriately expanded and integrated, and multiform water shorelines such as continents and islands are constructed. Waterfront trails and hydrophilic platforms are added, forming a local microclimate while improving the perception and enhancing tourists’ good thermal feelings.
- 3.
Vertical vegetation control, targeted adjustment of small-scale space microclimate
Outdoor space, such as waterfront space, large-scale hard space, small-scale hard space, forest edge space, and underwood space, are affected by the synergy of the new water system, vegetation, and terrain in the site. Homogenization of temperature and humidity of the entire site and excessive wind speed before built-up had been significantly improved, and the human comfort index can also be maintained at a comfort level. For example, in monitoring point 9, the temperature, relative humidity, and wind speed before built-up were 31.1 °C, 49.70%, and 2.3 m/s, respectively. The space’s microclimate was adjusted by creating local micro-terrain and improving vegetation design. After built-up, the temperature, relative humidity, and wind speed were 29.7 °C, 51.64%, and 1 m/s. The human comfort index was 81.99, 0.86 optimized with the pre-development period.
5. Conclusions
By considering the civic center urban forest in Qinhuangdao as an example, this study explored the relationship between microclimate and human comfort before and after the built-up of the urban forest. The main conclusions are summarized: Arranging the open leisure space around the water bodies and forest edge space of the deciduous broad-leaved forest could improve human comfort. At the same time, the construction of coastal forest belts, water systems, and open spaces can effectively create a local microclimate, playing a positive role in the regulation of microclimate, thereby improving people’s thermal comfort in outdoor space. The research is expected to provide a scientific basis and planning inspiration for constructing coastal urban forests in the same latitude area.
Author Contributions
Conceptualization, Y.L. and Q.N.; methodology, Y.L. and Q.N.; software, Y.L. and Q.N.; validation, Y.L. and Q.N.; formal analysis, Y.L. and Q.N.; investigation, Y.L. and Q.N.; resources, X.G.; data curation, Y.L. and Q.N.; writing—original draft preparation, Y.L. and Q.N.; writing—review and editing, Y.L. and Q.N.; visualization, Y.L. and Q.N.; supervision, X.G. and S.F.; project administration, X.G. and S.F.; funding acquisition, X.G. All authors have read and agreed to the published version of the manuscript.
Funding
This research was funded by the National Natural Science Foundation of China (31800606) (X.G.), Beijing Municipal Social Science Foundation (21JCC094) (X.G.).
Institutional Review Board Statement
This study does not involve human subjects, animals, plants or cells.
Informed Consent Statement
The study did not involve human subjects.
Data Availability Statement
The datasets generated during and/or analyzed during the current study are available from the corresponding author on reasonable request.
Acknowledgments
We hereby thank the National Natural Science Foundation of China for financial support for this research.
Conflicts of Interest
The authors declare no conflict of interest.
References
- Huang, H.; Yang, H.; Deng, X.; Chen, T.; Jia, Q. Spatial Evolution of Impact of Urban Heat Islang on Resident’ Health. Remote Sens. Inf. 2021, 36, 38–46. [Google Scholar]
- Lian, Z.; Liu, B. Test and Analysis of the Health Effects of Landscape Architecture Microclimate on Human Autonomic Vervous System. In Proceedings of the 2019 Annual Meeting of the Chinese Society of Landscape Architecture, Shanghai, China, 19–20 October 2019; Volume 2. [Google Scholar]
- Liu, B.; Mei, Y. Microclimate Perception Impact Mechanism and Methods in Landscape Architecture. In Proceedings of the 2015 Annual Meeting of the Chinese Society of Landscape Architecture, Beijing, China, 30 October–2 November 2015. [Google Scholar]
- Liu, B. Modern Landscape Planning and Design; Southeast University Press: Nanjing, China, 1999. [Google Scholar]
- Brown, R.D. Ameliorating the effects of climate change: Modifying microclimates through design. Landsc. Urban Plan. 2011, 100, 372–374. [Google Scholar] [CrossRef]
- Wu, F.; Zhang, N.; Chen, X. Effects of riparian buffers of North Mort of Beijing on air temperature and relative humidity. Acta Ecol. Sin. 2013, 33, 2292–2303. [Google Scholar]
- Wang, G.; Qian, L.; Chen, T.; Yand, X.; Xu, Z.; Zhu, W. Evaluation of tourism environmental comfort and its spatial-temporal differentiation: A case study of West Lake in Hangzhou, China. Acta Ecol. Sin. 2015, 35, 2206–2216. [Google Scholar]
- Amani-Beni, M.; Zhang, B.; Xu, J. Impact of urban park’s tree, grass and waterbody on microclimate in hot summer days: A case study of Olympic Park in Beijing, China. Urban For. Urban Green. 2018, 32, 1–6. [Google Scholar] [CrossRef]
- Wu, S.; Dong, L.; Fan, S. Effect of land cover types on lowering air temperature and increasing humidity and human comfort level. J. Fujian Agric. For. Univ. Nat. Sci. Ed. 2020, 49, 532–539. [Google Scholar]
- Yang, S.; Guo, X.; Bao, Z.; Yan, H. Thermal Environment of Hangzhou’s Residential Buildings in Summer Based on ENVI-Met. J. Chin. Urban For. 2020, 18, 84–88. [Google Scholar]
- Chan, S.Y.; Chau, C.K. On the study of the effects of microclimate and park and surrounding building configuration on thermal comfort in urban parks. Sustain. Cities Soc. 2021, 64, 102512. [Google Scholar] [CrossRef]
- Li, Y.; Han, Y. Research Progress in Simulating Microclimate in Urban Green Spaces Based on ENVI-met Model. J. Chin. Urban For. 2021, 19, 61–66. [Google Scholar]
- Lin, H.-J.; Ma, H.-Y.; Zhang, M. Analysis of the variation characteristics of human thermal comfort in summer of China from 1980 to 2019 based on UTCI. Clim. Change Res. 2022, 18, 58–69. [Google Scholar]
- Liu, C.; Xu, N.; Song, J.; Hu, S. Research on visitors’ thermal sensation and space choices in an urban forest park. Acta Ecol. Sin. 2017, 37, 3561–3569. [Google Scholar]
- Zhang, D.; Lisa, S.; Wang, Z.; Cao, W. Comparison Analysis of Human Comfort about Landscape Micro-climates in Three Parks, Shanghai. Landsc. Archit. 2018, 25, 97–100. [Google Scholar]
- Gu, L.; Wang, C.; Wang, Y.; Wang, X.; Sun, Z.; Wang, Q.; Sun, R. Patterns of Temporal Variation of Microclimate and Extent of Human Comfort in the Recreation Forests in Huishan National Forest Park. Sci. Silvae Sin. 2019, 55, 150–159. [Google Scholar]
- Zhang, F.; Li, L. Spatial Microclimate Simulation of Plant Community Based on Human Comfort—Taking Olympic Forest Park as an Example. J. Beijing Univ. Civ. Eng. Archit. 2020, 36, 30–39. [Google Scholar]
- Wang, Q.; Li, M.; Li, X. Research on Landscape Design of Fitness Facilities in Community Park Based on Human Comfort in Microclimate. Chin. Landsc. Archit. 2021, 37, 68–73. [Google Scholar]
- Xiao, X.; Ding, M.; Dong, L.; Wang, Y.; Wang, L. Study on the Influence of Park Characteristics and Distance from the Water Area on Summer Temperature and Humidity Effect: A Case Study of Suzhou Industrial Park. Chin. Landsc. Archit. 2021, 37, 48–53. [Google Scholar]
- Wu, F.; Li, S.-h.; Liu, J.-m. The Effects of Greening, Non-greening Square and Lawn on Temperature Humidity and Human Comfort. Acta Ecol. Sin. 2007, 27, 2964–2971. [Google Scholar]
- Geng, H.; Wei, X.; Zhang, M.; Li, Q. Influence of vegetation and architecture on microclimate based on Envi-met: A case study of Nanjing Agricultural University. J. Beijing For. Univ. 2020, 42, 115–124. [Google Scholar]
- Gu, K.; Qian, Z.; Fang, Y.; Sun, Z.; Wen, H. Influence of Vegetation Arrangement on PM2.5 in Urban Roadside Based on ENVI-met. Acta Ecol. Sin. 2020, 40, 4340–4350. [Google Scholar]
- Hu, Y.; Ma, K. A comprehensive simulation study on the influence of urban street greening on air quality and microclimate. Acta Ecol. Sin. 2021, 41, 1314–1331. [Google Scholar]
- Liu, C.; Li, Z.; Chen, Z.; Hu, Y.; Li, Y. Study of Campus Regeneration through Microclimate Simulation and Body Comfort Index Approaches—A Case of Tongji University Siping Road Campus. Hous. Sci. 2021, 41, 38–46. [Google Scholar]
- Amani-Beni, M.; Zhang, B.; Xie, G.-D.; Odgaard, A.J. Impacts of the Microclimate of a Large Urban Park on Its Surrounding Built Environment in the Summertime. Remote Sens. 2021, 13, 4703. [Google Scholar] [CrossRef]
- Blachowski, J.; Hajnrych, M. Assessing the Cooling Effect of Four Urban Parks of Different Sizes in a Temperate Continental Climate Zone: Wroclaw (Poland). Forests 2021, 12, 1136. [Google Scholar] [CrossRef]
- Ribeiro, A.P.; Bollmann, H.A.; de Oliveira, A.; Rakauskas, F.; Cortese, T.T.P.; Rodrigues, M.S.C.; Quaresma, C.C.; Ferreira, M.L. The role of tree landscape to reduce effects of urban heat islands: A study in two Brazilian cities. Trees 2021, 1–14. [Google Scholar] [CrossRef]
- Santiago, J.-L.; Rivas, E. Advances on the Influence of Vegetation and Forest on Urban Air Quality and Thermal Comfort. Forests 2021, 12, 1133. [Google Scholar] [CrossRef]
- Zang, W.-X.; Zhang, X.-Z.; Gong, C.-Q.; Sun, J. An Overiew of the Geo-environment in the Qinghuagndao Region. J. Geol. Hazards Environ. Preserv. 2012, 23, 32–35. [Google Scholar]
- Cao, Y.; Sun, Y.; Wu, M. Spatial and temporal characteristics of the periods of climate comfort in the Beijing-Tianjin-Hebei region from 1966 to 2015. Acta Ecol. Sin. 2019, 39, 7567–7582. [Google Scholar]
- Qin, W.-C.; Hu, D.; Li, Y.-Z.; Guo, Z. Numerical simulation of microclimate in Beijing typical residential area based on ENVI-met model. J. Meteorol. Environ. 2015, 31, 56–62. [Google Scholar]
- Yang, X. A Simulation Method for the Effects of Urban Microclimate on Building Cooling Energy Use; South China University of Technology: Guangzhou, China, 2012. [Google Scholar]
- Sun, C. Using ENVI-Met to Simulate the Impact of Green Spaces on the Thermal Environment in the Summer: A Case Study in the Nanjing University Gulou Campus; Nanjing University: Nanjing, China, 2014. [Google Scholar]
- Willmott, C.J. Some comments on the evaluation of model performance. Bull. Am. Meteorol. Soc. 1982, 63, 1309–1313. [Google Scholar] [CrossRef] [Green Version]
- Thom, E.C. The discomfort index. Weatherwise 1959, 12, 57–61. [Google Scholar] [CrossRef]
- Yan, Y.; Yue, S.; Liu, X.; Wang, D.; Chen, H. Advances in assessment of bioclimatic comfort conditions at home and abroad. Adv. Earth Sci. 2013, 28, 1119–1125. [Google Scholar]
| Publisher’s Note: MDPI stays neutral with regard to jurisdictional claims in published maps and institutional affiliations. |
© 2022 by the authors. Licensee MDPI, Basel, Switzerland. This article is an open access article distributed under the terms and conditions of the Creative Commons Attribution (CC BY) license (https://creativecommons.org/licenses/by/4.0/).


