Abstract
We aimed to examine associations between cognitive vulnerability and gait speed (GS) in a large older sample. A cross-sectional study analyzed data from the “Health, Lifestyle and Fitness in Adults and Seniors in Amazonas” (SEVAAI) project. In total, 697 participants were included (mean age 70.35 ± 6.86 years). Usual and fast GS were evaluated, and cognitive performance was examined by the COGTEL test battery. There was a positive and large correlation between cognition (COGTEL score) and usual GS (r = 0.510; p < 0.001) and fast GS (r = 0.503; p < 0.001). The usual GS, as a continuous variable, indicated a chance of improved cognitive performance by up to 55%, and fast GS by up to 82%. After controlling for potential confounders (i.e., sex, age, MMSE and years of education), usual and fast GS indicated a chance of improving cognition, respectively, in 57% and 85%. Analysis of GS in quartiles (Q) showed high and significant associations between usual and fast GS and cognitive vulnerability. GS classified as Q1 (slower), Q2 and Q3 represented a greater chance of presenting cognitive deficits, respectively, than in participants with both GS classified as Q4 (highest). Cognitive vulnerability was associated with low GS. Usual and fast GS can be used as complementary measures for the evaluation of cognitively normal Brazilian older adults.
1. Introduction
Gait and cognition are interrelated systems [1,2]. The simple act of walking requires the complex integration of external sensory information, which requires precise commands from the central nervous system. As a high motor action, gait is subordinated to neural networks linked to the cortical and subcortical structures of the spinal cord [3,4]. Thus, due to the need for brain negotiation involved in gait [5], gait speed (GS) alterations can be used as a non-invasive early indicator to detect pathogenic processes associated with brain functioning in the older adult population [6,7,8]. Therefore, individuals with slower GS are considered more likely to experience a cognitive decline (e.g., dementia) than those with faster GS [9,10,11,12].
From the relationship between the quality of gait (motor action) and the substrates involved in cognitive processes, it is possible to build a complementary approach to understand the functioning and/or alteration of neural functions during old age [13,14,15]. GS deficits may reflect the age-related atrophy of shared neural structures and/or greater dependence on cognitive processes compromised by sensorimotor integration [13]. Studies carried out in older adults using magnetic resonance imaging, nuclear imaging and electroencephalography revealed associations between poor gait performance and structural alterations in several subregions of the frontal lobe [16,17]. Moreover, reductions in grey matter volume were observed—more specifically, in the prefrontal cortex and hippocampus [18] and in the subcortical regions of the basal ganglia and cerebellum [19]. Quantitative gait changes have also been associated with white matter hyperintensities, increased ventricular volume and atrophy of the primary motor cortex [20].
In general, the gait exam is a simple and quick screening test, which can be performed in an outpatient setting without the need for expensive materials. GS is a sensitive measure that allows multiple uses, such as assessing the probability of older adult falls [21], as well as the estimation of the frailty of older people when associated with other indicators [22]. In recent decades, a considerable number of population studies have used the GS (in quantitative analyses) as a biomarker (screening) of cognitive vulnerability in older adults [3,7,23]. The GS examination is considered a substantial measure due to the difficulty in detecting superficial cognitive impairments [24]. In the clinical area, screening for mild cognitive impairment (MCI) or the beginning of the process is a major challenge [13,25,26]. Notably, few studies have examined the association between GS and cognitive vulnerability in cognitively normal older adults, especially in a population-based study [6,27,28]. The majority of cross-sectional investigations have included older adults with cognitive impairments (e.g., Parkinson’s disease, Alzheimer’s, dementia). Moreover, due to methodological differences between existing cross-sectional studies, there is a low consensus on the associations between cognitive impairment and GS, especially in the single-task condition [26]. When dealing with the older and cognitively normal population, cross-sectional studies have the advantage of helping to identify cognitive alterations during the genesis of the process (pre-clinical phases), a propitious moment for an early therapeutic intervention. In addition, there is a lack of information on the relationship between GS and cognitive change in normal ageing, especially in older Latin American populations [8].
Although, in recent decades, studies have examined the association between GS and cognitive impairment with cognitively normal older adults from different countries, such as the United States [25,26,29], Canada [19,20] and Japan [30], to date, we are not aware of population-based investigations that have investigated associations between GS and cognitive deficits in cognitively normal and independent Brazilian older adults. Information based on the geolocation of the cohort is important, as it provides a deeper understanding of the facets of the ageing process, contributing to the creation or restructuring of specific health policies/strategies. According to the Brazilian Society of Geriatrics and Gerontology [31], compared to other regions of the country, the older population of the northern region is ageing in conditions of greater vulnerability: the process takes place in a scenario of socio-economic fragility, with worse access to basic care and education.
Thus, we used data from the Health, Lifestyle and Physical Fitness in Adults and Elderly in Amazonas (SEVAAI) research project to examine associations between cognitive vulnerability and GS in a large older sample. We hypothesized that (1) higher GS values are positively associated with better cognitive performance, and (2) low GS is associated with cognitive vulnerability in cognitively normal older adults.
2. Materials and Methods
2.1. Study Design and Participants
This was a cross-sectional study carried out with 701 participants (433 women and 268 men). Four participants were excluded due to neurological diseases such as Alzheimer’s (n = 3) and Parkinson’s disease (n = 1). Participants were part of the research project “Health, Lifestyle and Fitness in Adults and Seniors in Amazonas” (SEVAAI). All were volunteers with unique geographic and cultural characteristics of the city of Manaus (municipalities of Fonte Boa and Apuí), located in the state of Amazonas, in the northern region of Brazil. Data were collected between 2016 and 2017.
The inclusion criteria were: (1) living in one of the three cities in the city of Manaus mentioned above; (2) minimum age of 60 years; (3) being able to walk independently and perform physical assessments; (4) present autonomy and independence in carrying out activities of daily living. The exclusion criterion were: (1) a score of <15/30 points in the Mini-Mental State Examination (MMSE)—the criterion was assumed as the limit of the inability to understand and follow the evaluation protocol of this study [32]—and (2) medical contraindication for the practice of exercise. All participants gave informed consent, and the present study included adherence to the declaration of Helsinki, which had been approved by the local ethics commission (CAAE: 56519616.0000.5016; N° 1.599,258; Brazil Platform).
2.2. Data Collection
2.2.1. Cognitive Assessment
The participants’ cognitive performance was individually assessed in a face-to-face interview, carried out by members of the field team trained in the application of protocols. The instrument used was the COGTEL, composed of six subtests [33]. The COGTEL includes important domains of cognitive function: (1) prospective memory; (2) short-term verbal memory; (3) working memory; (4) inductive reasoning; (5) verbal fluency and (6) long-term verbal memory. The calculation of the total score (continuous scale) was performed by the following formula: COGTEL total score = 7.2 × prospective memory + 1.0 × short-term verbal memory + 0.9 × long-term verbal memory + 0.8 × working memory + 0.2 × verbal fluency + 1.7 × inductive reasoning. In the Brazilian population, the psychometric properties of COGTEL were previously verified in an older adult sample [34], showing excellent test–retest reliability (0.85; p < 0.001), with high MMSE convergent validity (0.93; p < 0.001).
2.2.2. Gait Speed
GS was assessed using the 30-Foot Walk Test [35]. First, participants were asked to walk a distance of 30 feet at their usual speed. After, they were asked to repeat the same test at a fast speed but without running in a second moment. Three attempts were measured for each gait type (usual speed and fast speed), and the best performance was assumed.
2.2.3. Covariates
In a face-to-face interview, the participants reported sex, age, years of education, comorbidities (coronary heart, cerebrovascular, muscle diseases, depression and others), the number of types of medication consumed daily and total falls in the last 12 months. Body mass and height were measured using an anthropometric scale and a Welmy® stadiometer coupled with 0.1 cm and 0.1 kg [36]. Body mass index (BMI) was defined as (weight [kg])/(height [m2]).
2.2.4. Statistical Analysis
To assess the normal distribution of the variables, the Kolmogorov–Smirnov test was used. Thus, metric variables were reported by medians (IQR) and categorical by frequencies (%). Differences between groups were processed by nonparametric Mann–Whitney U test or chi-square test for continuous or categorical variables, respectively. The cutoff point used for composition (segregation) of the groups was determined by the overall mean of the total COGTEL (score = 18.9 points) minus 1 standard deviation. The literature indicated this procedure to identify individuals with cognitive vulnerability and, e.g., mild cognitive impairment [37]. The groups were established as follows: cognitive impairment with ≤17.9 points vs. normal cognition with ≥17.9 points. To test cross-sectional associations, we performed a three-phase approach. First, we tested whether higher GS values were positively associated with higher cognitive performance (first hypothesis). Thus, we examined the correlation of cognition (COGTEL total score) with usual GS and fast GS (motor performance). Correlations were presented in a scatter plot and interpreted by Pearson’s correlation coefficients (r): 0.1 = small, 0.3 = medium and ≥0.5 = large [38].
Second, we verified whether GS as a continuous variable can predict cognitive vulnerability in cognitively normal older adults (second hypothesis). Thus, we chose for analysis the group “cognitive impairment” as a reference and developed two linear logistic regressions separately for gait: (1) we analyzed the performance of COGTEL (dependent variable, binary) vs. usual GS (independent variable), and (2) we examined the performance of COGTEL (dependent variable, binary) vs. fast GS (independent variable). Third, we verified whether slow GS increases the chance of cognitive vulnerability in cognitively normal older adults. In this case, we chose to analyze the “normal cognition” group as a reference, and then two multinomial logistic regressions for gait were performed separately: (1) we included the performance of COGTEL (dependent variable, binary) vs. usual GS (independent variable/quartile analysis), and (2) we chose the performance of COGTEL (dependent variable, binary) vs. fast GS (independent variable/quartile analysis). The use of quartiles (Q) was assumed to avoid the assumption of collinearity in both GS assessments. The highest quartile (fourth) was the reference category. Only covariates with a p-value < 0.20 in the univariate analysis were included as control factors in the adjusted analyses. Both the results of the logistic regression analysis and the multinomial regression analysis were presented in two models: Model 1 unadjusted and Model 2 adjusted for sex, age, MMSE and years of education. In all analyses, the odds ratios (ORs) and their respective confidence intervals (CI) were estimated. The statistical analyses were performed using IBM-SPSS (IBM Corp., Armonk, NY, USA), version 22.0. The significance level was defined as α = 0.05.
3. Results
3.1. Main Characteristics of the Participants
Six hundred and ninety-seven participants were evaluated (see Table 1 for an overview). Of these, 331 were classified with cognitive impairment, and the other 366 were classified with normal cognitive performance. The median age of the entire sample was 69.2 (60.00–91.84) years; members of the cognitive impairment group indicated a median of 79.8 (60.24–91.84) years, while participants of the normal cognition group indicated 67.9 (60.00–89.46) years (p < 0.001). Regarding gender, 61.7% of the participants were women (p = 0.002). Significant differences were also found for BMI, years of education and the MMSE (p < 0.001). Among the self-reported comorbidities, the most prevalent was visual impairment (83.5%), followed by heart disease (56.7%). However, only musculoskeletal disease (42.3%) showed a statistical difference (p < 0.001).

Table 1.
Main characteristics for the entire study population, according to cognitive performance on the COGTEL test.
3.2. Performance of Usual GS and Fast GS
Table 2 presents the gait performance results. The usual and fast GS analysis as continuous variables showed greater speed for the group with normal cognition (p < 0.001). The analysis by quartiles revealed a prevalence of low velocity for group members with cognitive impairment. Significant results were observed for usual GS in Q3 (p = 0.003), and for fast GS in Q1 (p = 0.014) and Q4 (p = 0.028).
Table 2.
Performance of usual GS and fast GS (continuous variable), and performance prevalence in quartiles, according to the cognitive assessment of the COGTEL test.
Figure 1 shows the performance of the usual and fast GS of both groups in the quartiles. Significant differences were found for usual GS (Figure 1A) in Q3 (p = 0.003), and for fast GS (Figure 1B) in Q1 (p = 0.014) and Q4 (p = 0.028). The analysis also showed differences in gait performance between groups for each quartile; the results are represented as Δ-Delta values.
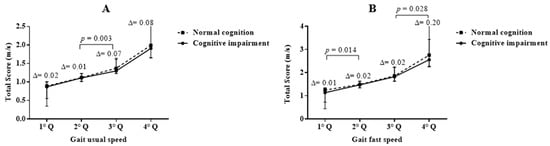
Figure 1.
Comparative graph of the usual GS and GS fast (mean and standard errors), between the groups with and without cognitive impairment, according to velocity quartiles. Each consecutive top quartile of speed represents a better gait. (A) usual GS; (B) fast GS; m = meter; s = second; Q = quartile; p < 0.05.
3.3. Correlations between Usual and Fast GS and Cognitive Performance
Figure 2 shows the scatter plots of the correlation analysis between cognition (COGTEL total score) and the two GS performance assessments (as a continuous variable). Positive and large correlations were found between COGTEL and usual GS (r = 0.510; p < 0.001) (Figure 2A), as well as COGTEL and fast GS (r = 0.503; p < 0.001) (Figure 2B).
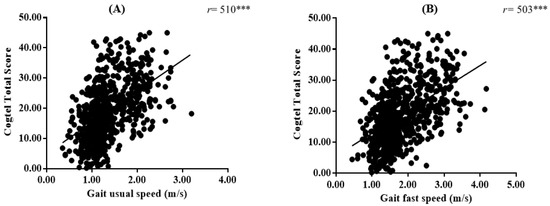
Figure 2.
Scatter plot of correlations between usual GS and fast GS and cognitive performance in the COGTEL test. (A) usual GS; (B) fast GS; m = meter; s = second; *** p < 0.001.
3.4. Associations between Usual GS and Fast GS (Continuous Variable) and Cognitive Vulnerability
According to Table 3, the unadjusted analysis indicated a statistically significant negative association between cognition and usual GS (OR = −0.45, CI −0.553–0.410, p < 0.001) and fast GS (OR = −0.433, CI −0.384–0.280, p < 0.001). After controlling for potential confounders (i.e., sex, age, MMSE and years of education), the associations between cognition and GS were negative and attenuated, remaining significant: usual GS (OR = −0.180, CI −0.264–0.120, p < 0.001) and fast GS (OR = −0.150, CI −0.166–0.063, p < 0.001).
Table 3.
Associations between gait speed (continuous and quartiles) and cognitive performance (COGTEL); results expressed by logistic and multivariate regression.
3.5. Associations between Usual GS (Quartile) and Cognitive Impairment
Regarding the multinomial analysis (see Table 3 for an overview), the unadjusted model showed significant associations (p < 0.001). Older adults classified with usual GS in Q1 and Q2 (lowest) and Q3 (medium) were indicated as 18.55 (CI 10.663–32.266), 8.35 (CI 5.165–14.106) and 3.48 (CI 2.091–5.817) times more likely to develop cognitive impairment, respectively, compared to those ranked in the highest quartile. When the analysis was adjusted for confounders, the associations were attenuated, remaining significant for the lowest quartiles (p < 0.001), but not for the medium-velocity quartile (p > 0.050). Thus, older adults classified in Q1 and Q2 were indicated as 4.10 (CI 2.088–8.048) and 2.98 (CI 1.611–5.499) times more likely to develop cognitive impairment than those classified in the highest quartile. The analysis showed no significant association for usual GS in Q3 (OR = 1.773, CI 0.953–3.297, p = 0.071).
3.6. Associations between Fast GS (Quartile) and Cognitive Impairment
Following the results, the unadjusted analysis indicated a higher level of association for fast GS in the lowest-velocity quartiles (see Table 3 for an overview). Older adults classified in Q1, Q2 and Q3 were presented as 13.20 (CI 7.790–22.352), 8.88 (CI 5.369–14.695) and 4.10 (CI 2.482–6.768) times more likely to develop cognitive impairment, respectively, in relation to being ranked in the highest quartile. After controlling for potential confounders (i.e., sex, age, MMSE and years of education), the associations were considerably attenuated, but remained significant (p < 0.001). Therefore, participants classified in Q1, Q2 and Q3 were 3.15 (CI 1.640–6.060), 3.05 (CI 1.636–5.705) and 2.33 (CI 1.266–4.312) times more likely to develop cognitive impairment, respectively, when compared to others classified in the highest quartile.
4. Discussion
To the best of our knowledge, this is the first population-based study to identify associations between GS and cognitive vulnerability carried out with cognitively normal older Brazilian adults. A strong point of this study is the recruitment of the population, carried out in a defined geographic area (Manaus city). Population-based health information from areas far from large urban centers plays an important role in disease surveillance, management and analysis [39]. Thus, the findings highlight the unknown information about the older Brazilian population of Amazonas, considered comparatively to other states in the country, a region of extreme vulnerability in health and quality of life [40,41].
We confirmed our premise that high GS values would be positively associated with high cognitive performance. Pearson’s positive and strong associations were found between the usual and fast measure of GS and cognition, and the results are in agreement with previous empirical research [42,43,44]. Our second hypothesis was also confirmed: we found that high values of usual and fast GS (as a continuous variable) were able to predict cognitive vulnerability. Elevated GS values indicated a protective role in cognitive performance. From this perspective, through significant associations between usual and fast GS and low cognitive performance, we show that GS can be assumed as a non-invasive biomarker capable of detecting cognitive alterations in cognitively normal older adults [6,7,45].
Previous investigations have highlighted that typical ageing diseases such as Alzheimer’s and dementia are progressive [46,47], and the transition from cognitive health from MCI to advanced impairment can take a decade or more [26,48], and even remain undetectable. Thus, the development of useful measures to track cognitive vulnerability in cognitively normal older adults at an early stage is an important and necessary procedure, and could have an important impact on the healthcare field [49]. We found a higher prevalence of low GS in the group with cognitive impairment. This finding is in agreement with previous population studies that found associations between low GS and cognitive vulnerability [9,50,51,52].
Low GS reflects the possibility that older people have advancing functional and/or structural brain changes [1,5,20]. Based on the results offered by the gait measurement, more in-depth examinations could be performed with participants who indicated low gait values. It is known that a low GS suggests a reduction in grey matter volume in the prefrontal cortex [53,54], changes in the subcortical regions in the basal ganglia or cerebellum [17], a reduction in periventricular and subcortical white matter [53], atrophy of medial temporal areas [30], as well as a reduction in hippocampal volumes [54]. Moreover, our associations corroborate the proposal of a “motor signature” of cognitive decline [48,55] and also with the syndrome of “Cognitive–Motor Risk” [53]. Both theories indicate that, in advanced age, idling is able to confirm complaints of cognitive impairment, which may be associated with pre-dementia syndromes, therefore indicating potential risks for progressing to dementia [7].
By analyzing the usual GS as a continuous variable, we found that each increase in standard deviation (SD) of 0.1 m/s indicated a chance of improvement in cognitive performance of up to 55%. After controlling for potential confounders (i.e., sex, age, MMSE and years of education), for each increase in standard deviation (SD) of 0.1 m/s, the chance of developing a cognitive deficit was attenuated by up to 82%. Regarding fast GS as a continuous variable, for each increase in the standard deviation (SD) of 0.1 m/s, there was a chance of improvement in cognitive performance of up to 57%. After controlling for potential confounders (i.e., sex, age, MMSE and years of education), for each increase in standard deviation (SD) of 0.1 m/s from fast GS, cognitive impairment was attenuated by up to 85%. One interpretation of this result is that having a preserved cognitive status (MMSE assessment) and longer years of education acts as a protective factor, increasing the individual’s chance of not developing cognitive decline [9,29,56]. Moreover, it should be considered that GS is not an exclusive predictor of future cognitive impairment at an advanced age. The process has multifaceted correlates, including age, sex, anthropometry, genetics, diet, past events and lifestyle [55,57].
The analysis in quartiles offered a more detailed understanding of the potential of the GS exam to predict the chance of cognitive vulnerability: a second hypothesis. Thus, older adults classified with usual GS in Q1, Q2 and Q3 indicated a chance of presenting cognitive vulnerability of 175%, 75% and 24%, respectively, in relation to those classified in the highest quartile (Q4). By controlling for potential confounders (i.e., sex, age, MMSE and years of education), the levels of association decreased considerably, but even so, participants classified in Q1 (slowest) and Q2 indicated a chance of developing cognitive impairment of up to 30% and 19%, respectively. For Q3 (1.24–1.64 m/s), there was no significant association. A possible explanation for this is that the performance of these participants (Q3) was equal to or superior to the performance of a usual GS (1.2 m/s to 1.4 m/s), considered in the literature as normal/preserved gait [29], while a GS below 0.8 m/s is associated with impaired mobility [57].
These findings are in line with previous evidence [48,49,50]. Regarding fast GS, our analysis showed, for Q1, Q2 and Q3, an increase in the chance of presenting a cognitive deficit of 122%, 78% and 31%, respectively, in relation to the participants classified in the highest quartile (Q4). Controlling for potential confounders (i.e., sex, age, MMSE and years of education), the chance remained higher in Q1 and Q2, respectively, with rates up to 21% and 20%. For those with speed rated in Q3 (medium), the chance of experiencing cognitive vulnerability was up to 13%, and therefore lower than in Q1 and Q2 (poor speed). These results confirmed the usual and fast GS as potential screening measures (biomarkers) of cognitive vulnerability in cognitively normal older adults, a potentially useful strategy to prevent cognitive impairment [6,8,9], as well as crucial for maintaining autonomy [7].
Limitations
Our study had the following limitations. First, the cross-sectional results are not directly generalizable to changes over time and to other populations. Second, we focused the analysis on only one temporal parameter of gait (speed). Therefore, we did not assess other important gait parameters (e.g., pace, stride length, double stance time, cadence, gait stability ratio). Finally, we found some barriers to fully drawing comparisons between our results and previous studies due to their methodological differences, such as heterogeneity between the protocols and instruments used to assess cognition and gait, as well as the disproportionate numbers of men and women and inequality in the years of education for each population.
5. Conclusions
Our population-based study showed that slow GS values considerably increase the chance of cognitive vulnerability in older adults. The results were consistent with the hypothesis that slow GS can be considered a predictor of cognitive deficits even in the cognitively normal older population [6,27,28]. The associations found between cognition and GS arise because gait demands the sharing of external information with internal neural networks. This requires the integration of different cognitive domains (e.g., attention, planning, visuospatial and motor processes). Our findings corroborate the thesis that understanding the functionality of gait and cognition together may be superior to understanding their constructs only separately [7], and they suggest that the examination of the GS can help to elucidate the cognitive integration of multiple and complex brain processes. This study has remarkable implications for public health and clinical practice: GS assessment is an attractive screening measure; in a short time and at a low cost (stopwatch and cutoff point), it is possible to perform routine clinical examinations. It is suggested that further investigations be carried out and that these include longitudinal follow-up to qualify the understanding of GS as a biomarker of cognitive decline in cognitively normal older adults.
Author Contributions
Conceptualization, M.d.M.N., É.R.G., A.M. and A.I.; methodology, M.d.M.N. and É.R.G.; software, É.R.G.; validation, M.d.M.N., É.R.G., A.M., P.M. and B.R.G.; formal analysis, M.d.M.N.; investigation, M.d.M.N., É.R.G., B.R.G., A.M. and A.I.; resources, É.R.G., B.R.G. and A.I.; data curation, M.d.M.N. and É.R.G.; writing—original draft preparation, M.d.M.N., É.R.G. and A.I.; writing—review and editing, A.M., B.R.G. and P.M.; visualization, M.d.M.N., A.M., P.M. and É.R.G.; supervision, É.R.G., B.R.G. and A.I.; project administration, É.R.G., B.R.G., A.M. and A.I.; funding acquisition, É.R.G., B.R.G., A.M. and A.I. All authors have read and agreed to the published version of the manuscript.
Funding
We acknowledge support from the Swiss National Centre of Competence in Research LIVES—Overcoming vulnerability: life course perspectives, which is funded by the Swiss National Science Foundation (grant number: 51NF40-185901). Moreover, A.I. acknowledges support from the Swiss National Science Foundation (grant number: 10001C_189407). É.R.G. and B.R.G. acknowledge support from LARSyS—Portuguese national funding agency for science, research and technology (FCT) pluriannual funding 2020–2023 (Reference: UIDB/50009/2020).
Institutional Review Board Statement
The study was conducted according to the guidelines of the Declaration of Helsinki and had been approved by the local ethics committee before the start of the data collection (ethic committee name: The Research Ethics Committee—Human Beings; approval code: CAAE: 56519616.6.0000.5016, Number: 1.599.258, Brazil Platform; approval date: 20 June 2016).
Informed Consent Statement
Informed consent was obtained from all subjects involved in the study before participation.
Data Availability Statement
The data presented in this study are available upon request from the corresponding author.
Acknowledgments
The authors are grateful to Duarte L. Freitas and Jefferson Jurema for their help in setting up the study, as well as Maria A. Tinôco, Floramara T. Machado, Angenay P. Odim and Bárbara R. Muniz for the technical assistance in the data collection and management. We are especially grateful to the older people for their participation and interest.
Conflicts of Interest
The authors declare no conflict of interest. The funders had no role in the design of the study; in the collection, analyses or interpretation of data; in the writing of the manuscript or in the decision to publish the results.
References
- Taylor, M.E.; Lasschuit, D.A.; Lord, S.R.; Delbaere, K.; Kurrle, S.E.; Mikolaizak, A.S.; Kvelde, T.; Close, J.C.T. Slow gait speed is associated with executive function decline in older people with mild to moderate dementia: A one year longitudinal study. Arch. Gerontol. Geriatr. 2017, 73, 148–153. [Google Scholar] [CrossRef] [PubMed]
- Toots, A.T.M.; Taylor, M.E.; Lord, S.R.; Close, J.C.T. Associations between gait speed and cognitive domains in older people with cognitive impairment. J. Alzheimer’s Dis. 2019, 71, S15–S21. [Google Scholar] [CrossRef] [PubMed]
- Allali, G.; Montembeault, M.; Brambati, S.M.; Bherer, L.; Blumen, H.M.; Launay, C.P.; Liu-Ambrose, T.; Helbostad, J.L.; Verghese, J.; Beauchet, O. Brain structure covariance associated with gait control in aging. J. Gerontol.-Ser. A Biol. Sci. Med. Sci. 2019, 74, 705–713. [Google Scholar] [CrossRef]
- Grande, G.; Triolo, F.; Nuara, A.; Welmer, A.-K.; Fratiglioni, L.; Vetrano, D.L. Measuring gait speed to better identify prodromal dementia. Exp. Gerontol. 2019, 124, 110625. [Google Scholar] [CrossRef]
- Cohen, J.A.; Verghese, J.; Zwerling, J.L. Cognition and gait in older people. Maturitas 2016, 93, 73–77. [Google Scholar] [CrossRef]
- Beauchet, O.; Allali, G.; Launay, C.; Herrmann, F.R.; Annweiler, C. Gait variability at fast-pace walking speed: A biomarker of mild cognitive impairment? J. Nutr. Health Aging 2013, 17, 235–239. [Google Scholar] [CrossRef]
- Montero-Odasso, M. Gait as a biomarker of cognitive impairment and dementia syndromes. Quo vadis? Eur. J. Neurol. 2016, 23, 437–438. [Google Scholar] [CrossRef]
- Garcia-Cifuentes, E.; Márquez, I.; Vasquez, D.; Aguillon, D.; Borda, M.G.; Lopera, F.; Cano-Gutierrez, C. The role of gait speed in dementia: A secondary analysis from the sabe colombia study. Dement. Geriatr. Cogn. Disord. 2020, 49, 565–572. [Google Scholar] [CrossRef]
- Knapstad, M.K.; Steihaug, O.M.; Aaslund, M.K.; Nakling, A.; Naterstad, I.F.; Fladby, T.; Aarsland, D.; Giil, L.M. Reduced walking speed in subjective and mild cognitive impairment: A cross-sectional study. J. Geriatr. Phys. Ther. 2019, 42, E122–E128. [Google Scholar] [CrossRef]
- Windham, B.G.; Parker, S.B.; Zhu, X.; Gabriel, K.P.; Palta, P.; Sullivan, K.J.; Parker, K.G.; Knopman, D.S.; Gottesman, R.F.; Griswold, M.E.; et al. Endurance and gait speed relationships with mild cognitive impairment and dementia. Alzheimer’s Dement. Diagn. Assess. Dis. Monit. 2022, 14, e12281. [Google Scholar] [CrossRef]
- Montero-Odasso, M.; Verghese, J.; Beauchet, O.; Hausdorff, J.M. Gait and cognition: A complementary approach to understanding brain function and the risk of falling. J. Am. Geriatr. Soc. 2012, 60, 2127–2136. [Google Scholar] [CrossRef] [PubMed]
- Rosso, A.L.; Studenski, S.A.; Chen, W.G.; Aizenstein, H.J.; Alexander, N.B.; Bennett, D.A.; Black, S.E.; Camicioli, R.; Carlson, M.C.; Ferrucci, L.; et al. Aging, the central nervous system, and mobility. J. Gerontol. Ser. A 2013, 68, 1379–1386. [Google Scholar] [CrossRef] [PubMed]
- Demnitz, N.; Hogan, D.B.; Dawes, H.; Johansen-Berg, H.; Ebmeier, K.P.; Poulin, M.J.; Sexton, C.E. Cognition and mobility show a global association in middle- and late-adulthood: Analyses from the Canadian longitudinal study on aging. Gait Posture 2018, 64, 238–243. [Google Scholar] [CrossRef]
- Lau, B.; Welter, M.-L.; Belaid, H.; Fernandez Vidal, S.; Bardinet, E.; Grabli, D.; Karachi, C. The integrative role of the pedunculopontine nucleus in human gait. Brain 2015, 138, 1284–1296. [Google Scholar] [CrossRef] [PubMed]
- Weiss, D.; Schoellmann, A.; Fox, M.D.; Bohnen, N.I.; Factor, S.A.; Nieuwboer, A.; Hallett, M.; Lewis, S.J.G. Freezing of gait: Understanding the complexity of an enigmatic phenomenon. Brain 2020, 143, 14–30. [Google Scholar] [CrossRef] [PubMed]
- Beauchet, O.; Launay, C.P.; Annweiler, C.; Allali, G. Hippocampal volume, early cognitive decline and gait variability: Which association? Exp. Gerontol. 2015, 61, 98–104. [Google Scholar] [CrossRef] [PubMed]
- Dumurgier, J.; Crivello, F.; Mazoyer, B.; Ahmed, I.; Tavernier, B.; Grabli, D.; François, C.; Tzourio-Mazoyer, N.; Tzourio, C.; Elbaz, A. MRI atrophy of the caudate nucleus and slower walking speed in the elderly. Neuroimage 2012, 60, 871–878. [Google Scholar] [CrossRef]
- Annweiler, C.; Beauchet, O.; Bartha, R.; Wells, J.L.; Borrie, M.J.; Hachinski, V.; Montero-Odasso, M. Motor cortex and gait in mild cognitive impairment: A magnetic resonance spectroscopy and volumetric imaging study. Brain 2013, 136, 859–871. [Google Scholar] [CrossRef]
- Kueper, J.K.; Lizotte, D.J.; Montero-Odasso, M.; Speechley, M. Cognition and motor function: The gait and cognition pooled index. PLoS ONE 2020, 15, e0238690. [Google Scholar] [CrossRef]
- Montero-Odasso, M.; Speechley, M.; Muir-Hunter, S.W.; Sarquis-Adamson, Y.; Sposato, L.A.; Hachinski, V.; Borrie, M.; Wells, J.; Black, A.; Sejdić, E.; et al. Motor and cognitive trajectories before dementia: Results from gait and brain study. J. Am. Geriatr. Soc. 2018, 66, 1676–1683. [Google Scholar] [CrossRef]
- Abellan Van Kan, G.; Rolland, Y.; Andrieu, S.; Bauer, J.; Beauchet, O.; Bonnefoy, M.; Cesari, M.; Donini, L.M.; Gillette-Guyonnet, S.; Inzitari, M.; et al. Gait speed at usual pace as a predictor of adverse outcomes in community-dwelling older people an International Academy on Nutrition and Aging (IANA) Task Force. J. Nutr. Health Aging 2009, 13, 881–889. [Google Scholar] [CrossRef] [PubMed]
- Stuck, A.E.; Iliffe, S. Comprehensive geriatric assessment for older adults. BMJ 2011, 343, d6799. [Google Scholar] [CrossRef] [PubMed]
- Machulda, M.M.; Pankratz, V.S.; Christianson, T.J.; Ivnik, R.J.; Mielke, M.M.; Roberts, R.O.; Knopman, D.S.; Boeve, B.F.; Petersen, R.C. Practice effects and longitudinal cognitive change in normal aging vs. Incident mild cognitive impairment and dementia in the mayo clinic study of aging. Clin. Neuropsychol. 2013, 27, 1247–1264. [Google Scholar] [CrossRef]
- Wilson, R.S.; Segawa, E.; Boyle, P.A.; Anagnos, S.E.; Hizel, L.P.; Bennett, D.A. The natural history of cognitive decline in Alzheimer’s disease. Psychol. Aging 2012, 27, 1008–1017. [Google Scholar] [CrossRef] [PubMed]
- Mielke, M.M.; Roberts, R.O.; Savica, R.; Cha, R.; Drubach, D.I.; Christianson, T.; Pankratz, V.S.; Geda, Y.E.; Machulda, M.M.; Ivnik, R.J.; et al. Assessing the temporal relationship between cognition and gait: Slow gait predicts cognitive decline in the mayo clinic study of aging. J. Gerontol. Ser. A Biol. Sci. Med. Sci. 2013, 68, 929–937. [Google Scholar] [CrossRef] [PubMed]
- Savica, R.; Wennberg, A.M.V.; Hagen, C.; Edwards, K.; Roberts, R.O.; Hollman, J.H.; Knopman, D.S.; Boeve, B.F.; Machulda, M.M.; Petersen, R.C.; et al. Comparison of gait parameters for predicting cognitive decline: The mayo clinic study of aging. J. Alzheimer’s Dis. 2016, 55, 559–567. [Google Scholar] [CrossRef]
- Holtzer, R.; Verghese, J.; Xue, X.; Lipton, R.B. Cognitive processes related to gait velocity: Results from the Einstein aging study. Neuropsychology 2006, 20, 215–223. [Google Scholar] [CrossRef]
- Tasvuran Horata, E.; Cetin, S.Y.; Erel, S. Effects of individual progressive single- and dual-task training on gait and cognition among older healthy adults: A randomized-controlled comparison study. Eur. Geriatr. Med. 2021, 12, 363–370. [Google Scholar] [CrossRef]
- Fitzpatrick, A.L.; Buchanan, C.K.; Nahin, R.L.; Dekosky, S.T.; Atkinson, H.H.; Carlson, M.C.; Williamson, J.D. Associations of gait speed and other measures of physical function with cognition in a healthy cohort of elderly persons. J. Gerontol. A. Biol. Sci. Med. Sci. 2007, 62, 1244–1251. [Google Scholar] [CrossRef]
- Taniguchi, Y.; Yoshida, H.; Fujiwara, Y.; Motohashi, Y.; Shinkai, S. A prospective study of gait performance and subsequent cognitive decline in a general population of older japanese. J. Gerontol. Ser. A Biol. Sci. Med. Sci. 2012, 67, 796–803. [Google Scholar] [CrossRef]
- Brazilian Society of Geriatrics and Gerontology (SBGG) Aging in the North and Northeast of Brazil: What Needs to Be Done to Overcome the Challenges of Care. Available online: https://sbgg.org.br/envelhecimento-no-norte-e-nordeste-do-brasil-o-que-e-preciso-driblar-para-vencer-os-desafios-do-cuidar/ (accessed on 2 January 2021).
- Creavin, S.T.; Noel-Storr, A.H.; Smailagic, N.; Giannakou, A.; Ewins, E.; Wisniewski, S.; Cullum, S. Mini-Mental State Examination (MMSE) for the detection of Alzheimer’s dementia and other dementias in asymptomatic and previously clinically unevaluated people aged over 65 years in community and primary care populations. In Cochrane Database of Systematic Reviews; Creavin, S.T., Ed.; John Wiley & Sons, Ltd.: Chichester, UK, 2016. [Google Scholar]
- Kliegel, M.; Martin, M.; Jäger, T. Development and Validation of the Cognitive Telephone Screening Instrument (COGTEL) for the assessment of cognitive function across adulthood. J. Psychol. 2007, 141, 147–170. [Google Scholar] [CrossRef] [PubMed]
- Ihle, A.; Gouveia, É.R.; Gouveia, B.R.; Kliegel, M. The Cognitive Telephone Screening Instrument (COGTEL): A brief, reliable, and valid tool for capturing interindividual differences in cognitive functioning in epidemiological and aging studies. Dement. Geriatr. Cogn. Dis. Extra 2017, 7, 339–345. [Google Scholar] [CrossRef] [PubMed]
- Rose, D.J. Fallproof!: A Comprehensive Balance and Mobility Training Program, 2nd ed.; Human Kinetics: Champaign, IL, USA, 2010; ISBN 978-0-7360-6747-8. [Google Scholar]
- Marfell-Jones, M.; Olds, T.; Stew, A.; Carter, L. International Standards for Anthropometric Assessment; International Society for Advancement of Kinanthropometry: Potchefstroom, South Africa, 2018. [Google Scholar]
- Bischkopf, J.; Busse, A.; Angermeyer, M.C. Mild cognitive impairment–areview of prevalence, incidence and outcome according to current approaches. Acta Psychiatr. Scand. 2012, 196, 403–414. [Google Scholar]
- Cohen, J. Set correlation and contingency tables. Appl. Psychol. Meas. 1988, 12, 425–434. [Google Scholar] [CrossRef]
- Fradelos, E.; Papathanasiou, I.; Mitsi, D.; Tsaras, K.; Kleisiaris, C.; Kourkouta, L. Health based Geographic Information Systems (GIS) and their applications. Acta Inform. Med. 2014, 22, 402. [Google Scholar] [CrossRef]
- Miranda Goncalves, R.; Moreira Domingos, I. Riverside population in Amazonas and inequality in access to health. Rev. Estud. Const. Hermenêutica E Teor. Do Direito 2019, 11, 99–108. [Google Scholar]
- Aracaty, M.L.; de Souza Rojas, S.R. Índice de vulnerabilidade Social vulnerability index (IVS) of the metropolitan regions of Belém do Pará-PA (RMB) and Manaus-AM (RMM). Econ. E Desenv. 2021, 33, 1–22. [Google Scholar]
- Laukka, E.J.; MacDonald, S.W.S.; Fratiglioni, L.; Bäckman, L. Preclinical cognitive trajectories differ for Alzheimer’s disease and vascular dementia. J. Int. Neuropsychol. Soc. 2012, 18, 191–199. [Google Scholar] [CrossRef]
- Buracchio, T.; Dodge, H.H.; Howieson, D.; Wasserman, D.; Kaye, J. The trajectory of gait speed preceding mild cognitive impairment. Arch. Neurol. 2010, 67, 980–986. [Google Scholar] [CrossRef]
- Soumare, A.; Tavernier, B.; Alperovitch, A.; Tzourio, C.; Elbaz, A. A Cross-sectional and longitudinal study of the relationship between walking speed and cognitive function in community-dwelling elderly people. J. Gerontol. Ser. A Biol. Sci. Med. Sci. 2009, 64A, 1058–1065. [Google Scholar] [CrossRef]
- Watson, N.L.; Rosano, C.; Boudreau, R.M.; Simonsick, E.M.; Ferrucci, L.; Sutton-Tyrrell, K.; Hardy, S.E.; Atkinson, H.H.; Yaffe, K.; Satterfield, S.; et al. Executive function, memory, and gait speed decline in well-functioning older adults. J. Gerontol. Ser. A Biol. Sci. Med. Sci. 2010, 65A, 1093–1100. [Google Scholar] [CrossRef] [PubMed]
- Rasmussen, L.J.H.; Caspi, A.; Ambler, A.; Broadbent, J.M.; Cohen, H.J.; D’Arbeloff, T.; Elliott, M.; Hancox, R.J.; Harrington, H.; Hogan, S.; et al. Association of neurocognitive and physical function with gait speed in midlife. JAMA Netw. Open 2019, 2, e1913123. [Google Scholar] [CrossRef] [PubMed]
- Rosano, C.; Aizenstein, H.J.; Studenski, S.; Newman, A.B. A regions-of-interest volumetric analysis of mobility limitations in community-dwelling older adults. J. Gerontol.-Ser. A Biol. Sci. Med. Sci. 2007, 62, 1048–1055. [Google Scholar] [CrossRef] [PubMed]
- Allali, G.; Annweiler, C.; Predovan, D.; Bherer, L.; Beauchet, O. Brain volume changes in gait control in patients with mild cognitive impairment compared to cognitively healthy individuals; GAIT study results. Exp. Gerontol. 2016, 76, 72–79. [Google Scholar] [CrossRef] [PubMed]
- Murray, E.A.; Wise, S.P. Interactions between orbital prefrontal cortex and amygdala: Advanced cognition, learned responses and instinctive behaviors. Curr. Opin. Neurobiol. 2010, 20, 212–220. [Google Scholar] [CrossRef]
- Makizako, H.; Shimada, H.; Doi, T.; Yoshida, D.; Ito, K.; Kato, T.; Shimokata, H.; Washimi, Y.; Endo, H.; Suzuki, T. The association between decline in physical functioning and atrophy of medial temporal areas in community-dwelling older adults with amnestic and nonamnestic mild cognitive impairment. Arch. Phys. Med. Rehabil. 2011, 92, 1992–1999. [Google Scholar] [CrossRef] [PubMed]
- Callisaya, M.L.; Beare, R.; Phan, T.G.; Blizzard, L.; Thrift, A.G.; Chen, J.; Srikanth, V.K. Brain structural change and gait decline: A longitudinal population-based study. J. Am. Geriatr. Soc. 2013, 61, 1074–1079. [Google Scholar] [CrossRef]
- Montero-Odasso, M.M.; Barnes, B.; Speechley, M.; Muir Hunter, S.W.; Doherty, T.J.; Duque, G.; Gopaul, K.; Sposato, L.A.; Casas-Herrero, A.; Borrie, M.J.; et al. Disentangling cognitive-frailty: Results from the gait and brain study. J. Gerontol. Ser. A Biol. Sci. Med. Sci. 2016, 71, 1476–1482. [Google Scholar] [CrossRef]
- Li, C.; Verghese, J.; Holtzer, R. A comparison of two walking while talking paradigms in aging. Gait Posture 2014, 40, 415–419. [Google Scholar] [CrossRef]
- Breitling, L.P.; Müller, H.; Stegmaier, C.; Kliegel, M.; Brenner, H. Association of prion protein with cognitive functioning in humans. Exp. Gerontol. 2012, 47, 919–924. [Google Scholar] [CrossRef]
- Noce Kirkwood, R.; de Souza Moreira, B.; Mingoti, S.A.; Faria, B.F.; Sampaio, R.F.; Alves Resende, R. The slowing down phenomenon: What is the age of major gait velocity decline? Maturitas 2018, 115, 31–36. [Google Scholar] [CrossRef] [PubMed]
- Fritz, S.; Lusardi, M. White Paper: “Walking Speed: The Sixth Vital Sign”. J. Geriatr. Phys. Ther. 2009, 32, 2–5. [Google Scholar] [CrossRef]
- Tian, Q.; An, Y.; Resnick, S.M.; Studenski, S. The relative temporal sequence of decline in mobility and cognition among initially unimpaired older adults: Results from the Baltimore Longitudinal Study of Aging. Age Ageing 2016, 46, 445–451. [Google Scholar] [CrossRef]


Publisher’s Note: MDPI stays neutral with regard to jurisdictional claims in published maps and institutional affiliations. |
© 2022 by the authors. Licensee MDPI, Basel, Switzerland. This article is an open access article distributed under the terms and conditions of the Creative Commons Attribution (CC BY) license (https://creativecommons.org/licenses/by/4.0/).